

Wave Basin Tests of a Multi-Body Floating PV System Sheltered by a Floating Breakwater

 ,
,  , and
, and
Abstract
:1. Introduction
2. Design of Coupled Floating Breakwater and FPV System
3. Methods
3.1. Scaling and Sign Convention
3.2. Facility
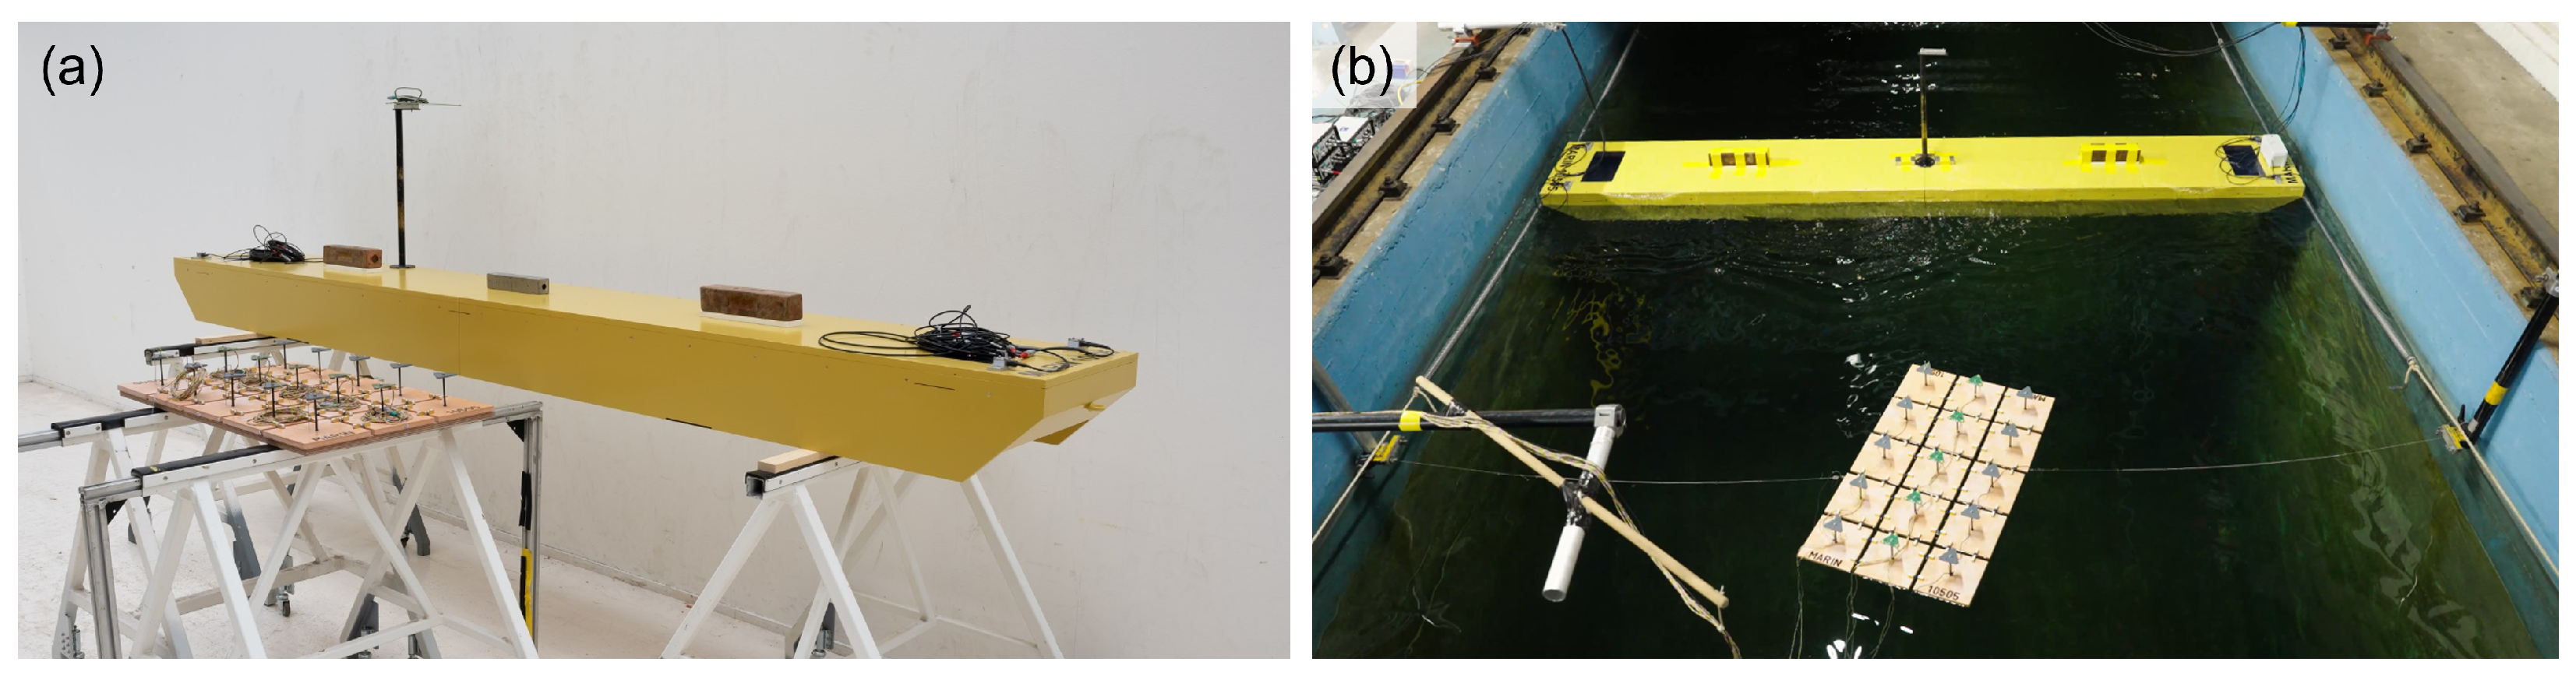
3.3. Floater Models
3.3.1. Floating Breakwater
3.3.2. PV Modules
3.3.3. FPV Hinges
3.4. Instrumentation
3.5. Basin Setup
3.6. Wave Conditions
3.7. Data Processing
4. Results
4.1. Floating Breakwater Motions
4.2. Wave Attenuation by the Floating Breakwater
4.3. FPV Motions
4.3.1. Motions in FBW Absence
4.3.2. FPV Motions in FBW Shelter
4.4. Relative Motions between PV Modules
4.4.1. Relative Motion RAOs
4.4.2. Hinge Buckling Occurrence
5. Discussion
6. Conclusions
- The FBW is effective in terms of wave attenuation for wave frequencies rad/s, which roughly corresponds to the FBW’s natural frequency in heave. This is reflected in the motion RAOs of the FPV modules, which in the sheltering presence of the FBW, reduce by a factor 2 to 3 at high frequencies. However, the FBW is less effective for rad/s and hardly effective for rad/s.
- The five instrumented PV modules generally result in similar-amplitude motion RAOs, suggesting that the hydrodynamic interaction between modules is minor (for the present small PV farm). For vertical motions and roll/pitch rotations, the PV modules tend to move individually and follow the water surface. In surge, the multi-body system moves as a whole (similar amplitude and phase for all modules) when the wave length exceeds the length of the assembled system, but phase differences between modules emerge for waves shorter than the PV farm. This suggests that larger farm sizes will result in higher relative surge motions between panels and in higher axial hige loads.
- Compressive loads on the FPV system, possibly in combination with bending loads due to relative pitching between modules, lead to hinge buckling. Buckling occurs especially for normal and close to normal incident waves, implying that such conditions result in the highest axial hinge loads. The hinges in the center of the FPV system appear to be more susceptible to buckling, which is attributed to an accumulation of inertial loads towards the FPV system center when compressed.
- Quartering seas lead to few buckling events, but do result in relative sway motions between modules. The relative sway motions are a measure for shear loads on the hinges and are largest for the outward PV modules.
- The FBW has the potential to reduce hinge loads in all directions (axial, shear, torsional, and bending), because it is effective at the high wave frequencies that largely drive relative motions between modules. The FBW effectiveness is demonstrated by a significant reduction in hinge buckling events in the tested steep waves conditions.
Author Contributions
Funding
Data Availability Statement
Acknowledgments
Conflicts of Interest
Abbreviations
| CoG | center of gravity |
| FBW | floating breakwater |
| (F)PV | (floating) photovoltaics |
| JONSWAP | Joint North Sea wave project |
| PS | portside |
| RAO | response amplitude operator |
| SB | starboard |
| VLFS | very large floating structure |
| a | amplitude |
| wave transmission coefficient | |
| significant wave height | |
| s | spacing between PV modules |
| wave peak period | |
| x | longitudinal position (surge) |
| y | transverse position (sway) |
| z | vertical position (heave) |
| JONSWAP peak enhancement factor | |
| rotation around x axis (roll) | |
| rotation around y axis (pitch) | |
| rotation around z axis (yaw) | |
| radial wave frequency |
Appendix A. Hinge Tensile Tests


References
- Melnyk, L.H.; Shaulska, L.V.; Maziin, Y.O.; Matsenko, O.I.; Piven, V.S.; Konoplov, V.V. Modern Trends in the Production of Renewable Energy: The Cost Benefit Approach. Mech. Econ. Regul. 2021, 1, 5–16. [Google Scholar] [CrossRef]
- Cousse, J. Still in love with solar energy? Installation size, affect, and the social acceptance of renewable energy technologies. Renew. Sustain. Energy Rev. 2021, 145, 111107. [Google Scholar] [CrossRef]
- Sahu, A.; Yadav, N.; Sudhakar, K. Floating photovoltaic power plant: A review. Renew. Sustain. Energy Rev. 2016, 66, 815–824. [Google Scholar] [CrossRef]
- Abid, M.; Abid, Z.; Sagin, J.; Murtaza, R.; Sarbassov, D.; Shabbir, M. Prospects of floating photovoltaic technology and its implementation in Central and South Asian Countries. Int. J. Environ. Sci. Tecnol. 2019, 16, 1755–1762. [Google Scholar] [CrossRef]
- Shi, W.; Yan, C.; Ren, Z.; Yuan, Z.; Liu, Y.; Zheng, S.; Li, X.; Han, X. Review on the development of marine floating photovoltaic systems. Ocean Eng. 2023, 286, 115560. [Google Scholar] [CrossRef]
- Mavraki, N.; Bos, O.G.; Vlaswinkel, B.M.; Roos, P.; de Groot, W.; van der Weide, B.; Bittner, O.; Coolen, J.W.P. Fouling community composition on a pilot floating solar-energy installation in the coastal Dutch North Sea. Front. Mar. Sci. 2023, 10. [Google Scholar] [CrossRef]
- Kumar, V.; Shrivastava, R.; Untawale, S. Solar Energy: Review of Potential Green & Clean Energy for Coastal and Offshore Applications. Aquat. Procedia 2015, 4, 473–480. [Google Scholar] [CrossRef]
- Claus, R.; López, M. Key issues in the design of floating photovoltaic structures for the marine environment. Renew. Sustain. Energy Rev. 2022, 164, 112502. [Google Scholar] [CrossRef]
- Golroodbari, S.Z.; Ayyad, A.W.; van Sark, W. Offshore floating photovoltaics system assessment in worldwide perspective. Prog. Photovoltaics Res. Appl. 2023, 31, 1061–1077. [Google Scholar] [CrossRef]
- Golroodbari, S.; Vaartjes, D.; Meit, J.; van Hoeken, A.; Eberveld, M.; Jonker, H.; van Sark, W. Pooling the cable: A techno-economic feasibility study of integrating offshore floating photovoltaic solar technology within an offshore wind park. Sol. Energy 2021, 219, 65–74. [Google Scholar] [CrossRef]
- Solomin, E.; Sirotkin, E.; Cuce, E.; Selvanathan, S.P.; Kumarasamy, S. Hybrid Floating Solar Plant Designs: A Review. Energies 2021, 14, 2751. [Google Scholar] [CrossRef]
- Vo, T.T.E.; Ko, H.; Huh, J.; Park, N. Overview of Possibilities of Solar Floating Photovoltaic Systems in the OffShore Industry. Energies 2021, 14, 6988. [Google Scholar] [CrossRef]
- Cuce, E.; Cuce, P.M.; Saboor, S.; Ghosh, A.; Sheikhnejad, Y. Floating PVs in Terms of Power Generation, Environmental Aspects, Market Potential, and Challenges. Sustainability 2022, 14, 2626. [Google Scholar] [CrossRef]
- Ghosh, A. A comprehensive review of water based PV: Flotavoltaics, under water, offshore & canal top. Ocean Eng. 2023, 281, 115044. [Google Scholar] [CrossRef]
- DNV-GL. Recommended Practice: Environmental Conditions and Environmental Loads (DNVGL-RP-C205, April 2014); Technical Report; DNV GL Group: Baerum, Norway, 2014. [Google Scholar]
- Fu, S.; Moan, T.; Chen, X.; Cui, W. Hydroelastic analysis of flexible floating interconnected structures. Ocean Eng. 2007, 34, 1516–1531. [Google Scholar] [CrossRef]
- Michailides, C.; Loukogeorgaki, E.; Angelides, D.C. Response analysis and optimum configuration of a modular floating structure with flexible connectors. Appl. Ocean Res. 2013, 43, 112–130. [Google Scholar] [CrossRef]
- Li, Y.; Ren, N.; Li, X.; Ou, J. Hydrodynamic Analysis of a Novel Modular Floating Structure System Integrated with Floating Artificial Reefs and Wave Energy Converters. J. Mar. Sci. Eng. 2022, 10, 1091. [Google Scholar] [CrossRef]
- DNV-GL. Recommended Practice: Design, Development and Operation of Floating Solar Photovoltaic Systems (DNVGL-RP-0584, March 2021); Technical Report; DNV GL Group: Baerum, Norway, 2021. [Google Scholar]
- Yoon, J.S.; Cho, S.P.; Jiwinangun, R.G.; Lee, P.S. Hydroelastic analysis of floating plates with multiple hinge connections in regular waves. Mar. Struct. 2014, 36, 65–87. [Google Scholar] [CrossRef]
- Waals, O.J.; Bunnik, T.H.J.; Otto, W.J. Model tests and numerical analysis for a floating mega island. In Proceedings of the 37th International Conference on Ocean, Offshore and Arctic Engineering (OMAE2018), Madrid, Spain, 17–22 June 2018; ASME: New York, NY, USA, 2018; p. OMAE2018-78589. [Google Scholar]
- Ren, N.; Zhang, C.; Magee, A.R.; Hellan, Ø.; Dai, J.; Ang, K.K. Hydrodynamic analysis of a modular multi-purpose floating structure system with different outermost connector types. Ocean Eng. 2019, 176, 158–168. [Google Scholar] [CrossRef]
- Bispo, I.; Mohapatra, S.; Guedes Soares, C. Numerical analysis of a moored very large floating structure composed by a set of hinged plates. Ocean Eng. 2022, 253, 110785. [Google Scholar] [CrossRef]
- Ikhennicheu, M.; Blanc, A.; Danglade, B.; Gilloteaux, J.C. OrcaFlex modeling of a Multi-Body Floating Solar Island Subjected to Waves. Energies 2022, 15, 9260. [Google Scholar] [CrossRef]
- Otto, W.J.; Bunnik, T.H.J.; Kaydihan, L. Hydro-Elastic Behavior of an Inflatable Mattress in Waves. In Proceedings of the 9th International Conerence on Hydroelasticity in Marine Technology, Rome, Italy, 10–13 July 2022. [Google Scholar]
- Xu, P.; Wellens, P.R. Theoretical analysis of nonlinear fluid–structure interaction between large-scale polymer offshore floating photovoltaics and waves. Ocean Eng. 2022, 249, 110829. [Google Scholar] [CrossRef]
- Zhang, M.; Schreier, S. Review of wave interaction with continuous flexible floating structures. Ocean Eng. 2022, 264, 112404. [Google Scholar] [CrossRef]
- Friel, D.; M, K.; Whittaker, T.; Doran, W.J.; Howlin, E. A review of floating photovoltaic design concepts and installed variations. In Proceedings of the 4th International Conference on Offshore Renewable Energy (CORE2019), Glasgow, UK, 29–30 August 2019; ASRANet Ltd.: Surrey, UK, 2019. [Google Scholar]
- Claus, R.; López, M. A methodology to assess the dynamic response and the structural performance of floating photovoltaic systems. Sol. Energy 2023, 262, 111826. [Google Scholar] [CrossRef]
- Delacroix, S.; Bourdier, S.; Soulard, T.; Elzaabalawy, H.; Vasilenko, P. Experimental modeling of a Floating Solar Power Plant Array under Wave Forcing. Energies 2023, 16, 5198. [Google Scholar] [CrossRef]
- Zhang, C.; Dai, J.; Ang, K.K.; Lim, H.V. Development of compliant modular floating photovoltaic farm for coastal conditions. Renew. Sustain. Energy Rev. 2024, 190, 114084. [Google Scholar] [CrossRef]
- Sree, D.K.; Law, A.W.K.; Pang, D.S.C.; Tan, S.T.; Wang, C.L.; Kew, J.H.; Seow, W.K.; Lim, V.H. Fluid-structural analysis of modular floating solar farms under wave motion. Sol. Energy 2022, 233, 161–181. [Google Scholar] [CrossRef]
- Lee, J.H.; Paik, K.J.; Lee, S.H.; Hwangbo, J.; Ha, T.H. Experimental and Numerical Study on the Characteristics of Motion and Load for a Floating Solar Power Farm under Regular Waves. J. Mar. Sci. Eng. 2022, 10, 565. [Google Scholar] [CrossRef]
- Friel, D.; Karimirad, M.; Whittaker, T.; Doran, J. Experimental hydrodynamic assessment of a cylindrical-type floating solar system exposed to waves. J. Ocean Eng. Sci. 2023, 8, 461–473. [Google Scholar] [CrossRef]
- Jiang, Z.; Dai, J.; Saettone, S.; Tørå, G.; He, Z.; Bashir, M.; Souto-Iglesias, A. Design and model test of a soft-connected lattice-structured floating solar photovoltaic concept for harsh offshore conditions. Mar. Struct. 2023, 90, 103426. [Google Scholar] [CrossRef]
- McCartney, B.L. Floating breakwater design. J. Waterw. Port, Coastal, Ocean Eng. 1985, 111, 304–318. [Google Scholar] [CrossRef]
- Burcharth, H.F.; Zanuttigh, B.; Andersen, T.L.; Lara, J.L.; Steendam, G.J.; Ruol, P.; Sergent, P.; Ostrowski, R.; Silva, R.; Martinelli, L.; et al. Chapter 3—Innovative Engineering Solutions and Best Practices to Mitigate Coastal Risk. In Coastal Risk Management in a Changing Climate; Zanuttigh, B., Nicholls, R., Vanderlinden, J.P., Burcharth, H.F., Thompson, R.C., Eds.; Butterworth-Heinemann: Boston, MA, USA, 2015; pp. 55–170. [Google Scholar]
- van der Zanden, J.; van der Hout, A.; Otto, W.; Spaargaren, F.; Walles, B.; de Wilde, J. Experimental study on a breaking-enforcing floating breakwater. J. Coast. Hydraul. Struct. 2022, 2, 1–28. [Google Scholar] [CrossRef]
- Dai, J.; Ming, C.; Utsunomiya, T.; Duan, W. Review of recent research and developments on floating breakwaters. Ocean Eng. 2018, 158, 132–151. [Google Scholar] [CrossRef]
- Macagno, E.O. Fluid mechanics—Experimental study of the effects of the passage of a wave beneath an obstacle. In Proceedings of the Academic des Sciences, Paris, France, 13 July 1953. [Google Scholar]
- Ruol, P.; Martinelli, L.; Pezzutto, P. Formula to Predict Transmission for π-Type Floating Breakwaters. J. Waterw. Port Coastal Ocean Eng. 2013, 139, 1–8. [Google Scholar] [CrossRef]
- van der Zanden, J.; Heijmen, R.; van Engelenburg, R. Data Report SUREWAVE WP6.4: Early Stage Model Tests of Integrated Floating Breakwater-FPV Design. 2024. Available online: https://zenodo.org/doi/10.5281/zenodo.10960432 (accessed on 19 April 2024).
- Chen, M.; Guo, H.; Wang, R.; Tao, R.; Cheng, N. Effects of Gap Resonance on the Hydrodynamics and Dynamics of a Multi-Module Floating System with Narrow Gaps. J. Mar. Sci. Eng. 2021, 9, 1256. [Google Scholar] [CrossRef]
- Gao, J.L.; Lyu, J.; Wang, J.H.; Zhang, J.; Liu, Q.; Zang, J.; Zou, T. Study on Transient Gap Resonance with Consideration of the Motion of Floating Body. J. Mar. Sci. Eng. 2022, 36, 994–1006. [Google Scholar] [CrossRef]
- Li, Z.; Chen, D.; Feng, X. Hydroelastic and expansibility analysis of a modular floating photovoltaic system with multi-directional hinge connections. Ocean Eng. 2023, 289, 116218. [Google Scholar] [CrossRef]
- Fagerholt, E. DIC Software, eCorr v4.0, Copyright 2017; NTNU: Trondheim, Norway, 2017. [Google Scholar]
- Somarathna, H.; Raman, S.; Mohotti, D.; Mutalib, A.; Badri, K. Rate dependent tensile behavior of polyurethane under varying strain rates. Constr. Build. Mater. 2020, 254, 119203. [Google Scholar] [CrossRef]


| Designation | Symbol | Value | Unit |
|---|---|---|---|
| Floating breakwater | |||
| Length | L | 38.00 | [m] |
| Width | W | 5.00 | [m] |
| Height | H | 2.50 | [m] |
| Draft | 2.03 | [m] | |
| Displacement mass | D | 246 | [tonnes] |
| Vertical position CoG | 1.58 | [m] | |
| Roll radius of gyration | 1.83 | [m] | |
| Pitch radius of gyration | 11.40 | [m] | |
| Yaw radius of gyration | 11.53 | [m] | |
| Floating PV modules, incl. 0.06 m marine growth | |||
| Length | L | 1.88 | [m] |
| Width | W | 1.88 | [m] |
| Height | H | 0.14 | [m] |
| Draft | 0.10 | [m] | |
| Displacement mass | D | 346 | [kg] |
| Vertical position CoG | 0.10 | [m] | |
| Roll radius of gyration | 0.48 | [m] | |
| Pitch radius of gyration | 0.48 | [m] | |
| Yaw radius of gyration | 0.62 | [m] | |
| Spacing between panels | s | 0.15 | [m] |
| Estimated hinge stiffness at small deflection | |||
| Axial | 84 | [kN/m] | |
| Shear, transverse | 8.9 | [kN/m] | |
| Shear, vertical | 1.5 | [kN/m] | |
| Torsional (roll) | 1.7 | [Nm/rad] | |
| Bending (pitch) | 1.4 | [Nm/rad] | |
| Bending (yaw) | 84 | [Nm/rad] | |
| Description | [m] | [s] | [-] |
|---|---|---|---|
| White noise (WN) | 0.67 | 2.4–11.8 | - |
| JONSWAP 1 (J1) | 1.01 | 4.12 | 4.0 |
| JONSWAP 2 (J2) | 3.06 | 7.43 | 2.3 |
Disclaimer/Publisher’s Note: The statements, opinions and data contained in all publications are solely those of the individual author(s) and contributor(s) and not of MDPI and/or the editor(s). MDPI and/or the editor(s) disclaim responsibility for any injury to people or property resulting from any ideas, methods, instructions or products referred to in the content. |
© 2024 by the authors. Licensee MDPI, Basel, Switzerland. This article is an open access article distributed under the terms and conditions of the Creative Commons Attribution (CC BY) license (https://creativecommons.org/licenses/by/4.0/).
Share and Cite
van der Zanden, J.; Bunnik, T.; Cortés, A.; Delhaye, V.; Kegelart, G.; Pehlke, T.; Panjwani, B. Wave Basin Tests of a Multi-Body Floating PV System Sheltered by a Floating Breakwater. Energies 2024, 17, 2059. https://doi.org/10.3390/en17092059
van der Zanden J, Bunnik T, Cortés A, Delhaye V, Kegelart G, Pehlke T, Panjwani B. Wave Basin Tests of a Multi-Body Floating PV System Sheltered by a Floating Breakwater. Energies. 2024; 17(9):2059. https://doi.org/10.3390/en17092059
Chicago/Turabian Stylevan der Zanden, Joep, Tim Bunnik, Ainhoa Cortés, Virgile Delhaye, Guillaume Kegelart, Thomas Pehlke, and Balram Panjwani. 2024. "Wave Basin Tests of a Multi-Body Floating PV System Sheltered by a Floating Breakwater" Energies 17, no. 9: 2059. https://doi.org/10.3390/en17092059