

- Article

Genome-Wide Analysis of Amino Acid Permease Gene Family in Solanum lycopersicum and Expression Profiling Under Drought Stress
- Joseph N. Amoah
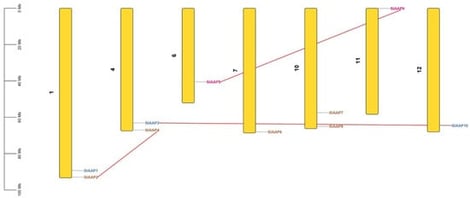
A genome-wide identification and expression analysis was performed to examine the response of the amino acid permease (AAP) gene family to drought stress in tomato (Solanum lycopersicum L.). Ten AAP genes were identified across seven of the twelve chromosomes and classified into four subfamilies (I–IV) based on phylogenetic relationships. Expansion of the SlAAP family appears to have been driven mainly by segmental and tandem duplication events. Members within the same subfamily displayed high similarity in exon–intron organization and conserved motif architecture. Promoter analysis revealed the presence of multiple cis-acting elements associated with stress and defence regulation. Under drought stress, all putative genes exhibited significant transcriptional induction, with SlAAP8, SlAAP9 and SlAAP10 showing the strongest upregulation, suggesting their potential involvement in drought adaptation. Drought treatment also led to a marked decline in nitrate (NO3−) and total nitrogen (N) contents, while simultaneously increasing the accumulation of total amino acids, ammonium (NH4+), and proline in both leaf and root tissues of tomato. The expression profiles of the ten putative SlAAP genes showed strong positive correlations with total amino acid levels in both organs, suggesting their involvement in amino acid redistribution under stress. Collectively, these results underscore the functional complexity of the SlAAP gene family and provide a robust foundation for future investigations into their molecular roles and potential applications in enhancing drought tolerance in tomato and other crop species.
2 February 2026
![Urinary Cd excretion rates and levels of eGFR, FPG, and serum β2M in controls and diabetics. Boxplots of data on ECd/Ccr (A), eGFR (B), [Glc]p (C), and serum levels of β2M (D) in controls and subjects with diabetes for <10 and ≥10 years, respectively. Each box represents the 25th and 75th percentile values of the variable indicated on the x-axis. A horizontal line inside each box represents the median. Circles and asterisks represent outliers.](https://mdpi-res.com/cdn-cgi/image/w=281,h=192/https://mdpi-res.com/stresses/stresses-06-00004/article_deploy/html/images/stresses-06-00004-ag-550.jpg)


