- Article

Interactive Effects of Tillage, Nitrogen Fertilisation, and Herbicide Management: Impacts on Soil CO2 Emissions and Agroecosystem Dynamics in a Maize Production
- Zainulabdeen Kh. Al-Musawi,
- Agampodi Gihan S. D. De Silva and
- István Mihály Kulmány
- + 11 authors
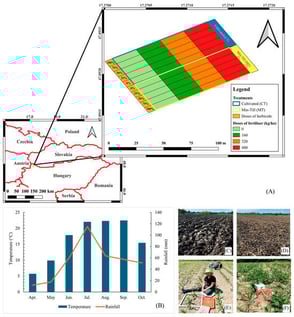
Agriculture must balance productivity with greenhouse gas emissions, biodiversity, and resource concerns. This study examined how tillage (conventional, CT; minimum, MT), nitrogen fertilisation (0–221 kg N ha−1), and herbicide rates (0–100%) interactively affected soil CO2 emissions, vegetation vigour, and weed diversity in maize production during 2022. A factorial experiment was conducted on a 1 ha with 40 plots monitored soil temperature, moisture, penetration resistance, normalised difference vegetation index (NDVI), weed diversity (Simpson’s Index), and CO2 emissions (closed-chamber method). Minimum tillage increased soil water retention (9.3 ± 6.5% vs. 5.4 ± 4.3%), soil temperature (28.0 ± 1.5), and compaction (0.6 ± 0.3 vs. 0.1 ± 0.0 MPa), while enhancing weed diversity (0.53–0.80 vs. 0.38–0.67). MT produced higher CO2 emissions than CT, especially at 147 kg N ha−1 (49.9 ± 15.7 vs. 29.1 ± 11.6 μmol m−2 s−1), peaking under MT-147 kg N ha−1-H75 (79.4 ± 1.2 μmol m−2 s−1). NDVI responses varied between tillage systems; under CT, vegetation vigour peaked at 75% herbicide application, while under MT vegetation was more responsive to nitrogen and more sensitive to herbicide, highlighting nitrogen × herbicide interaction trade-offs. Overall, MT enhanced water conservation and weed diversity but increased short-term CO2 emissions. This study reports first-year, site-specific results from an ongoing multi-year field experiment; therefore, the findings were interpreted as short-term, season-specific responses. This highlights the need for site-specific, climate-smart management that integrates emissions, soil health, biodiversity, and productivity.
5 February 2026
![Existing sorghum cultivation areas in Indonesia, as plotted on the agroclimate map. Supplementary Table S1 provides descriptions of the location numbers. The agroclimate map was redrawn from the regional agroclimate map of Sumatra [32], Java [31], Kalimantan [35], Sulawesi [34], Maluku and Irian Jaya, Bali, Nusa Tenggara Barat, and Nusa Tenggara Timur [33].](https://mdpi-res.com/cdn-cgi/image/w=281,h=192/https://mdpi-res.com/soilsystems/soilsystems-10-00023/article_deploy/html/images/soilsystems-10-00023-g001-550.jpg)