- Article

A Spheroid-Based In Vitro Model to Generate the Zonal Organisation of the Tendon-to-Bone Enthesis
- Vinothini Prabhakaran and
- Jennifer Z. Paxton
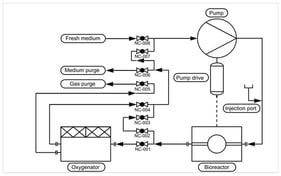
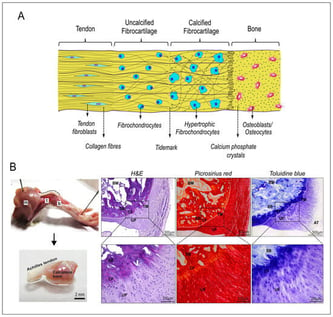
The tendon-to-bone enthesis is a multiphasic structure with four structurally continuous and compositionally distinct regions: tendon, uncalcified fibrocartilage, calcified fibrocartilage and bone. Our study aimed to develop 3D scaffold-free in vitro spheroids and macro-tissues of the enthesis for applications as experimental tools to understand the development and repair of enthesis injury. This study hypothesises that integrating tendon and bone cell spheroids with bone marrow mesenchymal stem cell spheroids will facilitate the production of a fibrocartilaginous interface. 3D Spheroids: The biphasic (tendon–bone) and triphasic co-culture (tendon–stem cell–bone) of spheroids in growth media and chondrogenic media were investigated to establish fusion kinetics, and the cellular and ECM components produced via histology and immunohistochemistry. Complete fusion between spheroids occurred within 6-to-8 days in biphasic co-culture, and 15-to-20 days in triphasic co-culture. Compared to biphasic, the triphasic co-culture in chondrogenic media showed a continuous interface connecting the tendon and bone regions. The presence of collagen I, sulphated proteoglycans and collagen type II in the interface region of triphasic co-culture indicates fibrochondrogenic differentiation. 3D macro-tissues: The modular tissue engineering strategy was used in this study to produce enthesis macro-tissues using spheroids as building blocks. Spheroids were bio-assembled in the triphasic manner (12 tendon spheroids, 12 stem cell spheroids and 8 bone spheroids) in the custom-designed and 3D-printed temporary supports (Formlabs Clear Resin®) using a customised spheroid bio-assembly system. The fusion of spheroids occurred by day 8 after bio-assembly, and they were removed from temporary supports and cultured in scaffold-free conditions. Although the bio-assembly methodology was successful in producing fused scaffold-free macro-tissues, the histological analysis revealed the presence of an extensive necrotic core due to the large-sized constructs. To conclude, the findings support the hypothesis that a triphasic co-culture has the potential to produce a structurally continuous fibrocartilaginous interface but requires further optimisation to produce macro-tissues with anatomical morphologies and reduced necrotic cores.
10 February 2026
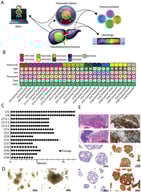
![The presence of mouse cells in organoids derived from xenografts. (A) During the passaging process of M63 breast cancer organoids, cell clusters of differing sizes were observed. The upper panels show large cell clusters, while the lower panels show small cell clusters. Left panels: bright-field images; right panels: Hoechst 33342 staining. Scale bar: 20 μm. (B) Microscopic and immunofluorescence (IF) staining images of spheroids derived from large (upper panels) and small (lower panels) cell clusters. mCyclophilin A (green): staining with a mouse-specific anti-cyclophilin A antibody; 4′,6-diamidino-2-phenylindole (DAPI, blue). Scale bars: 100 μm (brightfield), 50 μm (hematoxylin and eosin [HE], mCyclophilin A and DAPI). (C) IF staining of serial sections of spheroids derived from mouse cells isolated from M63 breast cancer organoids. Nuclei were counterstained with DAPI (blue). Scale bar, 50 μm. (D) Microscopic and IF staining images of mouse mammary organoids. IF images were obtained from serial sections. Nuclei were counterstained with DAPI (blue). Scale bar: 100 μm (brightfield), 50 μm (IF staining).](https://mdpi-res.com/cdn-cgi/image/w=281,h=192/https://mdpi-res.com/organoids/organoids-05-00006/article_deploy/html/images/organoids-05-00006-g001-550.jpg)