Skip to Content

Journal of Marine Science and Engineering

Journal of Marine Science and Engineering is an international, peer-reviewed, open access journal on marine science and engineering, published semimonthly online by MDPI.
The Australia New Zealand Marine Biotechnology Society (ANZMBS) is affiliated with JMSE and its members receive discounts on the article processing charges.
Quartile Ranking JCR - Q2 (Engineering, Marine | Engineering, Ocean | Oceanography)

All Articles (13,001)

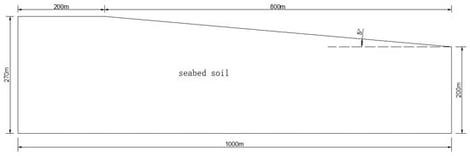
To find out the combined effect of seismic action, seepage, and sandy and argillaceous interlayers on the seabed slope stability, the safety factors of seabed slopes, which include sandy and argillaceous interlayers, under different hydraulic gradients and seismic loads, were calculated using the geotechnical simulation software Geo-Studio 2012. Results demonstrate that both seismic action and seepage exert significant impacts on seabed slope stability: seismic loads play a dominant role in governing slope stability, while seepage acts as a key triggering factor for slope failure. With the gradual increase in seismic load magnitude, the influence of seepage hydraulic gradient on slope safety factor decreases progressively. For homogeneous segregated slopes, which consist of silty clay, a higher seepage hydraulic gradient reduces the magnitude of critical seismic load that induces slope instability. Under identical seismic load and hydraulic gradient conditions, seabed slopes with sandy interlayers exhibit higher stability compared to homogeneous soil slopes, whereas slopes with argillaceous interlayers show reduced stability.

22 February 2026

Schematic of the seabed slope model.

Very-high-resolution (VHR) satellite imagery has expanded the scale at which researchers can monitor marine mammals in remote regions and improved monitoring efforts in data-deficient areas. Relatively little is known about beluga whale (Delphinapterus leucas) distribution in their wintering grounds, due partly to the unpredictability of sea ice formation and limited accessibility. VHR satellite imagery has been used successfully to estimate the abundance of summering beluga whales; however, the feasibility of tasking VHR satellite imagery in the winter and determining the detectability of beluga whales amongst sea ice have not been formally assessed. Our objective was to assess the feasibility of acquiring VHR satellite imagery in the winter and whether beluga whales could be reliably distinguished from sea ice in the imagery. Our study focused on beluga whale populations that are winter residents within James Bay and Cumberland Sound, occupying nearshore open water and ice leads in the winter. Two images were collected in Cumberland Sound covering known beluga whale wintering grounds in February and March 2022 encompassing 745 km2, with ice covering >75% of the image, and three images were acquired within James Bay from January to March 2024 spanning over 5700 km2, with ice covering >86% of the survey area. We observed 0 certain and 294 uncertain detections, suggesting that current satellite imagery resolutions are too low for confidently detecting beluga whales amongst densely packed ice. High-definition sharpening to 15 cm reduced the number of uncertain detections, but we were still unable to identify any certain whales. Continued advancements in imagery resolution are required to distinguish beluga whales from sea ice and improve year-round beluga whale monitoring.

21 February 2026

(A) Satellite imagery acquired in Cumberland Sound (red) and James Bay (blue). (B) Foot prints of 31 cm very-high-resolution (VHR) satellite imagery from 5 February 2022 (red) and 14 March 2022 (black) in Cumberland Sound and (C) 29 January 2024 (solid blue), 22 February (dashed orange), and 5 March 2024 (dotted purple) in James Bay. Points indicate locations of uncertain detections in 31 cm resolution imagery. Open and closed points indicate uncertain detections in 31 cm and 15 cm resolution imagery, respectively.

Digitalisation is reshaping shipyard production, yet its methodological foundations remain fragmented across simulation, optimisation, Artificial Intelligence (AI), and Digital Twin (DT) research streams. This paper presents a domain-specific methodological review of shipyard production modelling from 2010 to 2025, synthesising advances in Discrete-Event Simulation (DES), multi-objective optimisation, hybrid simulation–optimisation architectures, Machine Learning (ML), reinforcement learning (RL), and DT-enabled cyber-physical systems. Using an explicit evaluative framework based on integration depth, validation basis, and decision scope, the review differentiates between analytically mature but execution-decoupled DES/optimisation approaches and integration-rich yet variably validated DT and AI-driven systems. The analysis shows that hybrid DES-optimisation frameworks currently represent the most operationally credible class of methods, delivering measurable production improvements under structured conditions, whereas many DT and AI contributions prioritise architectural integration and data synchronisation over longitudinal yard-wide KPI validation. A comparative assessment of simulation platforms, optimisation engines, and manufacturing execution system/enterprise resource planning/product lifecycle management infrastructures highlights the central role of structured product–process–resource data and execution-layer connectivity, while severe confidentiality constraints and the scarcity of openly available industrial datasets continue to limit reproducibility and benchmarking. Overall, shipyard production research is progressing toward increasingly integrated and cyber-physical systems, but sustained yard-scale validation and shared benchmark development remain critical prerequisites for translating architectural sophistication into demonstrable operational impact.

21 February 2026

Foundations of shipyard production modelling.

The coupling of physical transport and phase-transfer processes represents a fundamental mechanism governing metal cycling in estuarine systems under tidal oscillations. Taking Quanzhou Bay as a model system, we conducted continuous observations and sample collection at the river channel (Q1), the turbidity maximum zone (Q2), and the outer bay channel (Q3). The metals (Al, Ti, Ba, Cu, Mn, and Zn) were measured by ICP-MS to systematically investigate the distribution, transport, and inter-media transfer across multiple water layers under varying estuarine processes. Our findings demonstrate that particulate metal concentrations in Quanzhou Bay exhibit strong synchrony with suspended sediment concentrations (SSC) over tidal cycles, displaying a distinct sediment-following pattern controlled by alternating end members. Particulate metal fluxes during flood and ebb-tides generally followed the hierarchy Q1 > Q2 >> Q3. Notably, stations Q1 and Q2 were dominated by flood-tide fluxes with net transport directed landward, whereas Q3 was characterized by ebb tide dominance with net flux directed seaward—revealing a spatial division of labor between “inner bay retention/reallocation” and “outer bay channel export”. In contrast, dissolved metals exhibited marked element-specific responses to tidal forcing: Al and Ti increased during flood tides at stations Q1 and Q2, while Ba and Cu showed opposite trends, and Mn and Zn displayed more conservative behavior. Concurrently, solid/liquid partition coefficient (logKd) values for Al, Ti and Ba, Cu exhibited inverse patterns over tidal cycles, suggesting divergent adsorption–desorption regulation under identical hydrodynamic conditions that drives differential phase-transfer dynamics. These disparities likely reflect intrinsic chemical properties and source variations among the elements. This study elucidates, at the tidal timescale, the coupled processes of “alternating end-member control—estuarine filter modulation—concurrent channelized export and inner bay retention” in Quanzhou Bay, providing critical process-level insights for metal flux quantification and bay pollution remediation initiatives in an ecological restoration project.

21 February 2026

(a) The bathymetric map of Eastern China Maginal Sea and location of Quanzhou Bay. Different colors represent different water depths. (b) The sampling stations. Station Q1 is in the Jinjiang River channel; station Q2 is located at the junction of the Jinjiang estuary and Luoyangjiang estuary, where the turbidity maximum zone of Quanzhou Bay is located; station Q3 is in the south channel, southwest of Dazhui Island. The gray font shows the name of the tidal current zone and shoal. The black arrow is the tidal current during the spring tide from July to September (as a multi-year average) of Quanzhou Bay. This figure was adapted from [34].

News & Conferences

Issues

Open for Submission

Editor's Choice

Get Alerted

Add your email address to receive forthcoming issues of this journal.

XFacebookLinkedIn
J. Mar. Sci. Eng. - ISSN 2077-1312