Skip to Content

Atmosphere

Atmosphere is an international, peer-reviewed, open access journal of scientific studies related to the atmosphere, published monthly online by MDPI.
The Italian Aerosol Society (IAS) and Working Group of Air Quality in European Citizen Science Association (ECSA) are affiliated with Atmosphere and their members receive a discount on the article processing charges.

All Articles (12,242)

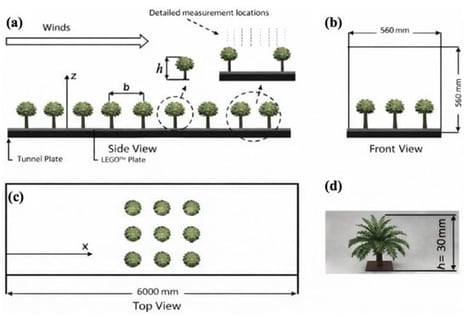
The momentum transport and scale-dependent motion characteristics within vegetation canopies play a crucial role in shaping near-surface turbulent structures and exchange processes, yet the interactions among different turbulent scales and their statistical representations remain insufficiently understood. Based on a series of controlled wind tunnel experiments, this study identifies coherent turbulent structures using a phase-space algorithm constructed from streamwise velocity fluctuation u′, acceleration a, and jerk j, and compares transport efficiency (exuberance η). This study uses scale-wise (cut-off frequency) momentum flux contribution analysis, natural visibility graph (NVG), and large–small-scale amplitude modulation to examine transport and multiscale behaviors across different canopy densities, array layouts, and inflow conditions. Results show that canopy density (different Cd drag coefficient) is a primary factor governing transport efficiency. Under low-wind staggered configurations, increasing canopy density strengthens the contribution of low-frequency large-scale motions to total momentum flux. In contrast, high-wind aligned configurations intensify canopy-top shear, enhancing small-scale motions and thereby reducing the relative contribution of large-scale motions. NVG analysis further reveals that in high-density canopies, large-scale acceleration and deceleration events tend toward equilibrium, whereas deceleration events dominate consistently in low- and medium-density cases. Amplitude modulation results indicate that high-density cases exhibit highly consistent modulation behavior, followed by low-density cases, while medium-density cases display a pronounced height-dependent variation, characterized by a distinct modulation critical point. This study proposes a unified analytical framework integrating coherent structure detection, graph-theoretic analysis, multiscale transport characterization, and large–small-scale modulation, providing a comprehensive description of momentum transport and scale motions within canopy flows, and it offers new insight into the mechanisms governing complex vegetation canopy turbulence.

23 February 2026

Schematic of the test section with models of the vegetation canopy. (a) Front view; (b) side view; (c) top view; (d) photograph of a unit of plastic tree model.

Understanding the upper-ocean thermal response during and between typhoons is critical for accurate prediction of typhoon intensity and for evaluating air–sea interactions. Previous studies have primarily focused on ocean cooling induced by individual typhoons and sea surface temperature (SST) recovery after that, yet oceanic thermal rejuvenation within the typhoon Inactivity Duration and its influence on the subsequent typhoon remains insufficiently explored. Using 42 years of typhoon best-track data, satellite observations and reanalysis data, we provide the first systematic quantification of the physical link between Inactivity Duration and subsequent typhoon intensification. Here we found that the intensity of the subsequent typhoon increased with typhoon Inactivity Duration. The subsequent typhoon is 6.34 kt and 7.69 hPa stronger than the previous typhoon for every 10 days of increase in typhoon Inactivity Duration. Upper-ocean thermal condition rejuvenated with time and contributed to subsequent typhoon development, and both SST and ocean heat content (OHC) exhibited significant phase changes from negative after the preceding typhoon to positive prior to the subsequent one, accompanied by a notable shoaling of the mixed layer depth (MLD) and sustained high levels of atmospheric instability. These coordinated environmental changes provide enhanced energy reserves and more favorable thermodynamic conditions for typhoon development after the inactivity period. These findings highlight the importance of considering ocean thermal rejuvenation in forecasting typhoon intensity and provide a quantitative framework for assessing sequential typhoon interactions with the upper ocean, offering theoretical support for improved intensity forecasting.

22 February 2026

Definition of the study domain in the WNP. (a) Spatial distribution of cumulative typhoon genesis counts derived from a 5° × 5° grid analysis during 1982−2023. (b) Spatial distribution of typhoon intensification probability (ratio of intensifying records to total records) for the same period. The magenta rectangles outline the selected research domain.

The Yellow River Great Bend Urban Agglomeration is a key area in the ecological protection and high-quality development strategy of the Yellow River Basin. In the process of coordinated regional development, the contradiction between economic development and environmental protection has become increasingly prominent, and the pollution problems of PM2.5 and O3 have become prominent. Based on the observation data of air pollutants and meteorological data of 15 cities from 2020 to 2023, this study explored the spatio-temporal variation characteristics of PM2.5 and O3 concentrations in this region and the influence of meteorological factors (temperature, relative humidity, wind speed, and precipitation). The results showed that the proportion of days with good air quality in the Yellow River Great Bend Urban Agglomeration metropolitan area increased first and then decreased from 2020 to 2023. PM2.5 concentrations were highest in winter and lowest in summer, with moderate levels in spring and autumn. In contrast, O3 concentrations peaked in summer and reached their lowest levels in winter. In terms of spatial variation, the spatial distribution of the number of PM2.5 polluted days roughly decreases from northwest to southeast, with Taiyuan City having the largest number of polluted days. The number of days with O3 pollution roughly shows a pattern of more in the middle and less around the periphery. Spatial autocorrelation analysis indicates that the PM2.5 concentration and O3 concentration in the Yellow River Great Bend Urban Agglomeration have obvious high-value and low-value spatial agglomeration characteristics. Meteorological elements have a significant influence on the concentrations of PM2.5 and O3. The occurrence frequencies of PM2.5 pollution and O3 pollution were significantly higher respectively within the temperature ranges of −10 to 15 °C and 20 to 30 °C, as well as under the condition of RH > 50% and in the range of 30% to 70% of the relative humidity. Statistical analysis revealed a universally significant negative correlation between wind speed and PM2.5 concentrations across all cities (mean R = −0.09, binomial test p < 0.001), confirming the critical role of stagnant conditions in local pollutant accumulation. The results of this study can provide important references for regional precise pollution control and environmental quality improvement and are of great significance for promoting regional sustainable development.

20 February 2026

Map of the study area.

Urban wetlands on the Qinghai–Tibetan Plateau are increasingly recognized as potentially important components of city-scale carbon budgets; however, their CO2 flux dynamics and associated environmental drivers remain insufficiently quantified, particularly under high-altitude urban conditions. In this study, we addressed this knowledge gap by conducting continuous eddy covariance observations at Haihu Wetland Park in Xining City, China. Carbon fluxes were monitored throughout 2023 using the Huangshui Park Station flux tower. We quantified the temporal dynamics of gross primary productivity (GPP), ecosystem respiration (Re), and net ecosystem exchange (NEE), and systematically assessed their responses to key environmental drivers across multiple temporal scales. GPP and Re exhibited unimodal seasonal patterns, with substantially higher values during the growing season. NEE showed pronounced diel cycling, with nighttime CO2 release and daytime uptake, and shifted seasonally between net source and net sink states. At the daily scale (n = 365), Pearson correlations showed that air temperature (Ta), 5 cm soil temperature (Ts5) and volumetric soil water content (SWC) exhibited the strongest associations with the flux components, whereas photosynthetic photon flux density (PPFD) showed moderate associations and precipitation was weak. At the monthly scale (n = 12), Mantel tests further highlighted a dominant thermal control on GPP and Re (Ta and Ts5), whereas precipitation showed additional associations with Re and NEE. Overall, the ecosystem acted as a net CO2 sink in 2023 (annual NEE = −292.25 g C m−2 yr−1 under our sign convention), with uptake concentrated in the first eight months of the year. Under the combined effects of multiple environmental factors, plateau urban wetlands functioned as a strong carbon sink, and the results of this study provide a data basis for improving the accuracy of carbon budget estimates for this type of ecosystem.

20 February 2026

Geographic location of the eddy covariance (EC) flux tower at Haihu Wetland Park, Xining City, northeastern Qinghai–Tibetan Plateau, China (36°39′13.21″N, 101°41′13.62″E).

News & Conferences

Issues

Open for Submission

Editor's Choice

Get Alerted

Add your email address to receive forthcoming issues of this journal.

XFacebookLinkedIn
Atmosphere - ISSN 2073-4433