- Article

PM2.5 and Lung Cancer: An Ecological Study (2014–2023) Using Data from Brazilian Capitals
- Albery Batista de Almeida Neto,
- Fernando Rafael de Moura and
- Flavio Manoel Rodrigues da Silva Júnior
- + 6 authors
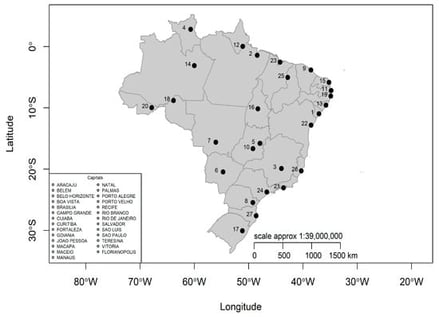
Air pollution remains a major global public health concern, with fine particulate matter (PM2.5) recognized as an important environmental risk factor for lung cancer. This ecological study assessed lung cancer mortality attributable to long-term PM2.5 exposure in the 26 Brazilian state capitals and the Federal District (Brasília) from 2014 to 2023. Annual mean PM2.5 concentrations were estimated using reanalysis-based PM2.5 concentration estimates and atmospheric reanalysis data, ensuring consistent spatial and temporal coverage. Mortality data were obtained from the Brazilian Mortality Information System (SIM/DATASUS). Health impacts attributable to PM2.5 exposure were estimated using the World Health Organization’s AirQ+ model, based on exposure–response functions from the Global Burden of Disease framework. During the study period, 97.41% of annual PM2.5 means exceeded the WHO Air Quality Guideline of 5 µg/m3, and 28.52% surpassed the current Brazilian regulatory limit. Higher concentrations were observed mainly in capitals from the North and Southeast regions, reflecting the influence of biomass burning, urbanization, and regional atmospheric processes. Approximately 13.56% of lung cancer deaths in Brazilian capitals were attributable to PM2.5 exposure, with the highest absolute numbers concentrated in the Southeast region. These findings demonstrate a substantial and spatially heterogeneous lung cancer burden associated with urban air pollution in Brazil and highlight the need for strengthened air quality management and targeted urban public health policies.
8 February 2026