
High-Fat-High-Fructose Diet Elicits Brown Adipocyte Dysfunction through miRNA-103 Induced miRNA Biogenesis Pathway
Department of Pharmaceutical Sciences, Irma Lerma Rangel School of Pharmacy, Texas A&M Health Science Center, College Station, TX 77843, USA
*
Author to whom correspondence should be addressed.
†
These authors contributed equally to this work.
Obesities 2024, 4(2), 93-105; https://doi.org/10.3390/obesities4020010
Submission received: 23 April 2024
/
Revised: 7 May 2024
/
Accepted: 8 May 2024
/
Published: 10 May 2024
Abstract
:Background: Obesity is a critical public health concern with its prevalence growing at an alarming rate worldwide. The Western diet that typically includes high-fat or high-fructose components is one of the leading contributing factors of obesity. Recent findings demonstrate the essential role of BAT in regulating whole-body metabolism. However, the explicit mechanism through which BAT maintains homeostasis is still unknown. Methods: Six-week-old C57BL/6 male mice were fed either a low-fat diet (LFD) or a high-fat high-fructose diet (HFHFD) for 4, 12, and 20 weeks. Results: We observed a significant increase in BAT weight under HFHFD along with BAT whitening in a time-dependent manner. This was also accompanied by a significant decrease in UCP1 and PGC1α protein, as well as a significant increase in the Bax/Bcl-2 ratio as early as 12 weeks, indicating increased apoptosis under HFHFD. Interestingly, miRNA-103 expression that holds a seed sequence within the miRNA biogenesis machinery, Dicer, was significantly upregulated after 12 and 20 weeks of HFHFD. Dicer and another biogenesis regulator, TRBP2, exhibited significant upregulation at 4 weeks of HFHFD. Conversely, those gene expressions were significantly downregulated at 12 and 20 weeks of HFHFD, followed by a significant decrease in the protein level at 12 weeks. To confirm the mechanistic connection, miRNA-103 knockdown in vitro significantly upregulated Dicer and the TRBP2 gene. However, only Dicer exhibited a significant increase at the translational level. Conclusion: Overall, we conclude that HFHFD may elicit BAT dysfunction by inhibiting Dicer via miRNA-103.
1. Introduction
Obesity is a global epidemic associated with the risk of developing chronic diseases such as type 2 diabetes, cardiovascular disease, cancer, and metabolic syndrome [1]. The primary cause of obesity is an imbalance in energy homeostasis [2]. In a healthy state, energy intake is equivalent to energy expenditure, allowing a standard body weight to be maintained. Conversely, failure to maintain energy homeostasis by either overconsumption or reduced expenditure can result in a multitude of detrimental health conditions [3]. Therefore, therapeutic strategies generally include either the targeting of increasing energy expenditure or the reducing energy intake. These targets provide promising avenues to combat obesity and its associated metabolic complications. In this context, significant advancements have been made in unraveling white adipose tissue (WAT) mechanisms to reveal potential approaches for reducing fat accumulation [4]. Recently, there has been an emphasis on the approaches that are centered around brown adipose tissue (BAT) due to its unique inherent ability to modulate global energy expenditure in the form of heat [5]. This exceptional feature of BAT, to dissipate energy through non-shivering thermogenesis, underscores its importance as a crucial target in combating obesity [6]. The emphasis on the benefits of BAT in humans is demonstrated by recent studies that established an association of higher participant BAT content with lower blood glucose and triglyceride levels, as well as improved HDL levels and cardio-metabolic health [7,8]. Despite the positive observational outcomes, queries persist regarding the coordinated regulation of thermogenic mechanisms and the potential involvement of non-coding RNAs in these scenarios.
The thermogenic ability of BAT is primarily known to be regulated by uncoupling protein 1 (UCP1) and its regulator peroxisome proliferative activated receptor gamma coactivator 1 alpha (PGC1α) [9]. Several types of diet can affect the function of BAT [10,11]. Rodents fed on a ketogenic diet exhibited two-fold increases in the expression of UCP1 and total number of mitochondria in BAT [12]. In contrast, a high-fat diet (HFD) has been demonstrated to play a significant role in promoting obesity and inducing BAT dysfunction [13]. Evidence has indicated that the consumption of HFD can cause whitening of BAT that is characterized by an increase in lipid accumulation, mitochondrial dysfunction, and diminished thermogenic capability [13,14]. HFD-fed obese mice display a reduction in thermogenesis along with elevated apoptotic marker expression in BAT [15]. Further, BAT ablation has been established to decrease energy expenditure and promote obesity under HFD exposure [6]. It has also been revealed that a single day of HFD feeding is also enough to trigger the early signs of BAT whitening and insulin resistance in mice [16]. A recent clinical study showed that BAT glucose uptake, rather than thermogenesis, is compromised by a high-fructose diet, but not a high-glucose diet [17]. Despite the current understanding of diet-induced BAT dysfunction caused by either a high-fat or high-fructose diet, the combined effect of a high-fat high-fructose diet (HFHFD) on epigenetic regulation of BAT remains unexplored. Additionally, although sporadic time points were used in different studies, none investigated the progression over a period of time in a single study.
The Western diet has been shown to induce metabolic syndrome and other related disorders via dysregulation of epigenetic reprogramming such as DNA methylation, histone modifications, and regulation of non-coding RNAs [18]. Among these multiple epigenetic mechanisms, regulation of several microRNAs (miRNAs), a type of short noncoding RNAs, has been emphasized to be altered by diets [19,20]. One of the epidemiological studies revealed that HFD could induce metabolic endotoxemia as well as elevate the levels of both pro-inflammatory cytokines and circulating miRNAs [21]. Certain miRNAs that were previously identified as the regulators of WAT adipogenesis have also demonstrated their involvement in BAT function [22]. In a diet-induced obesity model, the knockdown of certain miRNAs led to enhanced whitening in all depots of WAT and promoted more browning in BAT of the mice [23]. Alongside these physiological changes, it was identified that miRNA deficiency contributed to the activation of the transcriptional pathway directing thermogenesis via deacetylation of PGC1α [23]. The above study and a couple of other studies confirm that a mechanism of miRNAs plays a pivotal role in post-transcriptional regulation of BAT function [24]. Although the above evidence indicates that miRNAs are associated with the regulation of thermogenesis pathways in BAT, it remains unknown whether miRNA biogenesis regulators are involved in diet-induced BAT dysfunction. The miRNA biogenesis machinery has been described to be sensitive to hormonal regulation and dietary change [25]. Recently, two groups have investigated the role of specific miRNAs that regulate BAT function by impairing miRNA processing via miRNA biogenesis machinery [22,26]. Knockdown of the biogenesis machinery regulator Dicer or DGCR8 in mice triggered increased WAT accumulation and promoted BAT whitening, leading to defective metabolic function [22,26,27]. In the present study, we investigated the involvement of one specific miRNA and miRNA biogenesis machinery in BAT dysfunction under a high-fat high-fructose diet in a time-dependent manner.
2. Materials and Methods
2.1. Animals and Diets
C57BL/6 male mice were procured from Jackson Laboratory and were acclimatized. Mice were fed on a chow diet (PicoLab Rodent Diet 5053, Lab Supply, Fort Worth, TX, USA) and water ad libitum in a controlled room with a 12:12 h light/dark cycle until randomization. Six-week-old male mice were divided into two groups and fed either a low-fat diet (LFD, 20% protein, 10% fat, and 70% carbohydrates, Research Diet Inc., New Brunswick NJ, USA, D12450H) or a high-fat high-fructose diet (HFHFD, 20% protein, 45% fat, and 35% carbohydrates, Research Diet Inc., New Brunswick, NJ, USA, D15041701) for either 4 weeks (short-term), 12 weeks (mid-term), or 20 weeks (long-term). At the end of each time point, BAT was excised, weighed, and flash-frozen in liquid nitrogen immediately on the day of sacrifice. All procedures were performed in compliance with relevant laws and institutional guidelines and have been approved by the Institutional Animal Care and Use Committee of the Institute of Biosciences & Technology at the Texas A&M Health Science Center (IACUC 2014-0338-IBT).
2.2. mRNA and miRNA Extraction and RT-PCR
mRNA was extracted using the Qiagen RNeasy mini kit. Reverse transcription was carried out using the High-Capacity cDNA Reverse Transcription Kit according to the manufacturer’s protocol (Life Technologies, Grand Island, NY, USA). The expression levels of genes were determined by quantitative real-time PCR using the Powerup Sybr Green PCR Master Mix (Life Technologies, NY, USA). Relative gene expression was normalized to β-actin and represented as a fold change as previously described. miRNA was extracted using the Qiagen RNeasy mini kit according to the manufacturer’s protocol. Extracted miRNA’s cDNA synthesis and miRNA-specific quantitative real-time PCR were performed. The miRNA expression was normalized to U6 and expressed as relative expression compared to the control low-fat diet. Relative miRNA expression was analyzed using the delta–delta comparative threshold cycle (2−ΔΔCt) method and represented as a fold change. The primers’ sequences are shown in Table A1.
2.3. Western Blot Analysis
Protein lysate was prepared as described previously [28]. Briefly, whole tissue lysates/cell lysates were separated by SDS-PAGE and transferred onto PVDF membranes. Odyssey blocking buffer (LI-COR Biosciences, Lincoln NE, USA) was used as a blocking agent for the membrane. After blocking, membranes were incubated with a specific primary antibody diluted 1:1000 before use (UCP1 #14670S, PGC1α #2178S, Bax #2772S, and Bcl2 #2876S from Cell Signaling, MA, USA; Dicer #ab227518 from Abcam, Cambridge, UK, and TRBP2 #orb248147 from Biorbyt, Cambridge, UK) at 4 °C overnight followed by LiCor IRDye® secondary antibody (LI-COR Biosciences, 1:10,000). Bands were then visualized using an Odyssey scanner and Image Studio software, version 5.2 (LI-COR Biosciences). Pre-stained protein markers were used as a reference for molecular weight determination and β-actin (# D6A8 from Cell Signaling, Boston, MA, USA) was used as a loading control. A protein expression study of the 20-week-old group was not conducted due to an insufficient BAT sample quantity. Also, due to the insufficient sample quantity, the same blot was used to re-probe UCP1, PGC1α, Dicer, TRBP2, and Actin in 4- and 12-week-old samples (Figures 2a and 4b).
2.4. Transient Transfections and miRNA-103 Knockdown Assay
The brown adipocyte T37i cell line was procured commercially (#SCC250, Millipore Sigma, St. Louis, MO, USA). Cells were cultured and seeded at a density of 2 × 10⁴ cells per well in a 24-well plate and transiently transfected with 25 pmol mirVana™ miRNA-103 inhibitor (Ambion, USA, cat# 4464084) and mirVana™ miRNA Inhibitor, Negative Control #1 (Ambion, USA, cat# 4464076). After transfection, T37i cells were differentiated with T37i Expansion Medium (DMEM/F12 with HEPES, L-Glutamine and 10% FBS) containing 2 nM 3,3′,5-Triiodo-L-thyronine (T3) (Sigma T5516), and 20 nM insulin (Sigma I-1882) for 6 days. Expression of miRNA-103 was examined to ensure efficient knockdown followed by miRNA biogenesis machinery analysis.
2.5. Bioinformatic Analysis
TargetScan (https://www.targetscan.org/vert_80/, 1 September 2021) was used to identify the seed sequence similarity of the target genes and to predict the biological targets of miRNAs.
2.6. Statistical Analysis
All results are expressed as means ± standard error (SEM). Two groups were compared using the unpaired Student’s t-test. The statistical significance of differences among three or more groups was compared using one-way ANOVA, followed by Dunnett’s post hoc test. p < 0.05 was considered statistically significant. Statistical analyses were performed using Graph Pad Prism software (GraphPad, Boston, MA, USA).
3. Results
3.1. HFHFD-Fed Mice Exhibit Enlarged and Whitened BAT
BAT whitening has been described to be marked by the accumulation of large lipid droplets and compromised thermogenic capacity [29]. BAT from HFHFD-fed mice showed increased visible whitening after 12 weeks compared to LFD fed mice (Figure 1a). This whitening became more pronounced after 20 weeks of HFHFD. However, no significant visible change was observed at 4 weeks of HFHFD (Figure 1a). The mice fed on HFHFD also exhibited increased BAT weight compared to those fed LFD after 12 and 20 weeks (p < 0.001) (Figure 1b). There was no significant change in BAT weight for HFHFD-fed mice over 4 weeks.
3.2. HFHFD Feeding Impairs BAT Function
BAT thermogenesis is the key factor of homeostasis. Recent studies have shown that BAT homeostasis declines during obesity and impairs adaptive thermogenesis in humans [26]. As there was BAT whitening with HFHFD feeding, we investigated the protein expression levels of BAT-specific thermogenesis biomarkers. At 4 weeks of HFHFD exposure, there was significant elevation of UCP1 protein levels (p < 0.05), but no change in PGC1α expression levels when compared to LFD (Figure 2a). Interestingly, both UCP1 and PGC1α protein expression levels were significantly downregulated at 12 weeks of HFHFD exposure (Figure 2a) (p < 0.05). The reduction in thermogenesis also induces apoptosis in BAT and was measured by the Bax/Bcl-2 ratio. This ratio exhibited no change at 4 weeks but was significantly higher (p < 0.01) in the BAT of mice exposed to an HFHFD for 12 weeks compared to an LFD (Figure 2b). As 12 weeks had already demonstrated impairment, in addition to lack of BAT to process, we were unable to analyze protein for 20 weeks of samples. However, it is predicted that the long-term diet effect will reflect similar dysregulation as was reported at 12 weeks.
3.3. Upregulation of miRNA-103/107 Expression in HFHFD-Fed Mice
Increasing evidence indicates that obesity is characterized by changes in the miRNA expression profile of adipose tissue [30]. miRNA-103 and miRNA-107 are among the upregulated miRNAs discovered in the several metabolic tissues of obese mice as well as in obese human adipose tissue [31,32]. We observed that at 4 weeks, HFHFD had no effect on miRNA-103; however, its homologue, miRNA-107, exhibited significant downregulation (p < 0.001) (Figure 3a). Conversely, significantly higher expression levels of miRNA-103 and miRNA-107 were observed at weeks 12 and 20 of HFHFD exposure. As an established mechanism of action of miRNAs is to inhibit gene expression via post-transcriptional binding, we performed a seed sequence analysis of potential targets for miRNA-103 and miRNA-107. Both miRNA-103 and -107 have a seed sequence within Dicer, a miRNA biogenesis regulator (Figure 3b). This also indicates that these miRNAs and Dicer may target similar pathways due to seed sequence similarity [33].
3.4. HFHFD Feeding Inhibits miRNA Biogenesis Machinery
To determine the early molecular mechanisms of the observed BAT dysfunction in HFHFD fed mice, we examined the expression of miRNA biogenesis machinery. Dicer, Drosha, DGCR8, and TRBP2 are the major components of the miRNA-processing pathway. In HFHFD-fed mice, the gene expression levels of Dicer and TRBP2 were significantly increased compared to the LFD fed mice at 4 weeks (p < 0.01). This was followed by a significant decrease at 12 and 20 weeks of HFHFD exposure (Figure 4a). Similarly, at 4 weeks of HFHFD exposure, the protein levels of Dicer were increased (p < 0.001), followed by a significant decrease (p < 0.05) at 12 weeks (Figure 4b). In contrast, there was no change in the TRBP2 protein level at 4 weeks of HFHFD exposure, yet there was a significant decrease at 12 weeks (p < 0.05) (Figure 4b). This highlights a significant decrease in Dicer and TRBP2 at both the transcriptional and translational levels after 12 weeks of HFHFD exposure (p < 0.01 and p < 0.05, respectively). Further, the gene expression levels of both Dicer (p < 0.01) and TRBP2 (p < 0.0001) were significantly decreased in BAT at 20 weeks of HFHFD feeding (Figure 4a). The gene expression of other biogenesis regulators such as Drosha and DGCR8 remained unchanged at all time points (Figure 4a).
3.5. miRNA-103 Mediated Regulation of miRNA Biogenesis Machinery In Vitro
To confirm the hypothesized miRNA-103/107-mediated regulation of miRNA biogenesis machinery, we performed a knockdown study in the T37i brown adipocyte cell line (Figure 5a). We only used miRNA-103 as the mature miRNA-103. On this note, the miRNA-107 sequence differs only by one nucleotide at position 21, which cannot be distinguished by Northern blotting [31]. Knockdown of miRNA-103 led to the upregulation of Dicer and TRBP2 gene expression when compared to the negative control (Figure 5b). Consistent with our findings in vivo, miRNA-103 knockdown did not alter the gene expression of Drosha and DGCR8 (Figure 5b). Protein levels of Dicer and TRBP2 were subsequently evaluated as well. Dicer exhibited elevated protein expression compared to the negative control (p < 0.01), while TRBP2 showed no change (Figure 5c).
4. Discussion
Brown adipose tissue is a crucial regulator in maintaining body temperature through thermogenesis [34]. Several factors such as caloric excess, sedentary lifestyle or aging can induce BAT dysfunction [35]. Our study uncovers a novel epigenetic mechanism in diet-induced BAT dysfunction. Our findings reveal a significant progression of BAT whitening under HFHFD exposure when compared to LFD (Figure 1a). Although most visible whitening characteristics emerged under longer exposure time periods, the initiation of the process appears to have begun at earlier time points. This phenomenon is supported by other studies where as little as 1 day or 2–4 weeks of exposure to HFD showed similar characteristics in BAT [16,36]. Notably, previous mouse studies only demonstrated the function of BAT solely with different types of HFD (i.e., varying percentages of total calories from fat) compared to the chow diet [37]. In the present study, the experimental diet also contains a high-fructose content in addition to high-fat content. To our knowledge, there is currently no known information about the effect of a high-fat high-fructose diet on BAT dysfunction. Although the chow diet is generally used as the control for most metabolic research, we instead employed a low-fat diet as the control to mimic the real-life scenario, as healthy people also consume a certain amount of fat regularly in their diet [38]. The use of LFD is highly recommended for in vivo studies rather than a chow diet to facilitate the NIH mission for additional rigor and reproducibility [39]. In addition to BAT whitening, the BAT mass increased due to HFHFD feeding in a time-dependent manner (Figure 1b). This correlates with the body weight progression in mice as previously reported by our group [38]. An increase in BAT mass does not directly imply tissue dysfunction; however, whitening of BAT due to increased lipid accumulation contributes to body weight gain, dysregulated whole-body metabolism, and is a marker of BAT dysfunction [40]. For instance, a clinical study demonstrated that while the obese participants had elevated BAT masses, they did not have the corresponding defective thermogenesis [41]. In the present study, prolonged HFHFD effects were consistent with the previous studies where BAT weight was increased along with whitening under long-term HFD or fructose alone [17,42]. To elucidate the underpinning molecular mechanisms mediating the diet-induced BAT dysfunction across different time periods, we then investigated key biomarkers for thermogenesis and apoptosis. As whitened BAT is typically accompanied by diminished UCP1 and PGC1α thermogenic biomarkers [29], we first evaluated their expressions in the BAT. UCP1 and PGC1α were indeed altered in the BAT of mice fed an HFHFD (Figure 2). Under short-term HFHFD exposure, there was elevated UCP1 expression (Figure 2a) that may indicate an inherent adaptive mechanism of BAT [36]. Consistent with our observations, another study demonstrated that a short-term (2–4 weeks) HFD feeding led to increased UCP1 levels in BAT [36]. In contrast to short-term diet exposure, reduced UCP1 and PGC1α expression levels under 12 weeks of HFHFD exposure (Figure 2a) revealed that the dissipating capacity of BAT might have been impaired in profound obese or diabetic conditions. We predict that this may be pivoting from an adaptive state to an overburdened one, which aligns with several previous studies where mice were subjected to HFD for longer time periods [29,42]. Specifically, these studies demonstrated that the significant body weight gain over time due to high-fat diet challenge diminishes UCP1 and PCG1α expression in BAT [43]. It has further been reported that mice fed on a high-fat high-glucose diet for 20 weeks also experienced suppressed UCP1 and PGC1α expression [44]. The reduction in thermogenesis due to obesity also induces apoptosis in BAT; therefore, it may be considered as one of the causative factors for BAT dysfunction [45]. As predicted, the Bax/Bcl-2 ratio indicated a pro-apoptotic environment as early as 12 weeks of HFHFD exposure (Figure 2b). This indeed correlated with previous studies where HFD-fed obese mice also displayed elevated apoptotic marker expression [15]. In parallel, a clinical study suggested that impaired BAT activity in obese patients was due to reduced cell differentiation, proliferation, and increased apoptosis [45]. The dysfunction of BAT in HFHFD-fed mice prompted us to delve further into the potential underlying epigenetic mechanisms that are involved in or preceding this process.
As epigenetic regulations can be modulated depending on the nutritional environment, we next investigated a recently emerging hypothesis that miRNAs may be involved in BAT function. Only a limited number of miRNAs are presumed to be involved in impaired BAT function under Western diet exposure [22,23,26]. On the other hand, several miRNAs are identified as significant regulators of various metabolic pathways when exposed to a Western diet [27]. Among those, miRNA-103, which encodes two identical mature miRNAs and paralogous miRNA-107, is one of the most studied miRNAs in metabolic research [32]. However, the role of miRNA-103 in the regulation of BAT function has not been established yet. Upon examination of this regulatory network in the HFHFD-fed mice, there was a reducing trend of miRNA-103 in BAT under a short-term HFHFD (Figure 3a). On the other hand, as expected, mid- and long-term HFHFD feeding clearly indicated altered epigenetic molecular mechanisms as miRNA-103 expression was elevated (Figure 3a). As expected, miRNA-107 showed a similar trend as miRNA-103. We also speculate that the other clusters may have the same effect; however, the investigation of individual miRNAs will be carried out in future studies. This reinforces our observations that at the earlier stage of HFHFD exposure, the body is trying to defend against the dietary challenge via inhibiting these miRNAs to increase energy expenditure and improve BAT function [27]. In contrast, with long-term HFD exposure, these miRNAs may tend to increase and target critical thermogenic regulators, which can lead to BAT dysfunction. This subsequently can create an environment conducive to the development of obesity as chronic exposure to a Western diet can lead to diminished energy expenditure.
As evidenced so far, miRNAs may play an important role in brown adipose function. In addition, the endoribonuclease Dicer or other major components of the miRNA-processing pathway may also play a significant role in regulating the overall thermogenesis process. Recently, Kahn’s group showed that mice with an adipose tissue-specific knockout of Dicer develop a form of lipodystrophy characterized by decreased WAT mass and increased BAT mass along with whitening [26]. They also demonstrated that these issues were closely associated with insulin resistance, adipose tissue inflammation, dyslipidemia, and other systemic alterations. Sun’s group also recently showed that adipose-tissue-specific DGCR8 knockout mice exhibited enlarged and pale brown fat, accompanied with decreased expression of UCP1 and PGC1α in brown fat [22]. Furthermore, these mice were also intolerant to cold exposure, indicating a disrupted thermogenesis. These reports motivated us to investigate the miRNA biogenesis pathways under the HFHFD scenario. More importantly, we explored a novel idea that has not been pursued in this context, i.e., whether these modulations can occur via any metabolic miRNA, for example miRNA-103.
Interestingly, the seed sequence of miRNA-103 is within Dicer (Figure 3b), which may explain the upregulated miRNA-103 expression and decreased Dicer expression under mid-term and long-term HFHFD exposure. Additionally, we also observed a significant reduction in another biogenesis regulator, TRBP2 (Figure 4a,b). As we have only observed the changes in the miRNA machinery genes that are located in the cytoplasm, including Dicer and TRBP2, but not the one located in the nucleus, Drosha and DGCR8, we assume that miRNA-103 pre-miRNAs might have been exported from the nucleus to the cytoplasm and could become mature miRNAs in the cytoplasm [46]. To further validate the role of miRNA-103 in the regulation of miRNA biogenesis machinery, in vitro silencing of miRNA-103 revealed significantly increased Dicer and TRBP2 expression at the transcriptional level (Figure 5a,b) with a significant elevation at the translational level of Dicer, but not TRBP2 (Figure 5c). This confirmed the key involvement of Dicer in miRNA-103-mediated BAT dysfunction. As per our literature search, there are no reports so far that demonstrate the role of TRBP2 in a knockout model of mice in the context of BAT regulation. Future studies should investigate the effect of different diets on miRNA-103, Dicer, or other miRNA biogenesis regulator knockout mice. Using the Dicer and DGCR8 knockout animal model, the groups led by Kahn and Sun also identified a series of miRNAs that are important downstream regulators in brown adipose function. Therefore, we also predict that that other miRNAs might be involved in the downstream pathway to regulate the overall BAT function. Here, we propose that the regulation of miRNA biogenesis machinery, Dicer, through miRNA-103 might serve as the underlying mechanism for diet-induced BAT dysfunction contributing to obesity (Figure 6).
5. Conclusions
We present a novel concept of miRNA-103-mediated regulation of miRNA biogenesis pathways in BAT dysfunction under the influence of time-dependent HFHFD exposure. Our investigation provides a better understanding of the miRNA pathway involved in diet-induced BAT dysfunction, which can be the foundation of potential therapeutic targets that aim to combat obesity.
Author Contributions
M.C.: Conceptualization, supervision, writing—reviewing and editing. N.S.: Data curation, organization of data, and writing the final draft. S.M.: Mice experiment and data curation, in addition to writing a preliminary draft with the methods outlined. M.H.P.: Data curation and result writing. All authors have read and agreed to the published version of the manuscript.
Funding
This work was supported by the Morris L Lichtenstein Jr Medical Research Foundation.
Institutional Review Board Statement
The study was conducted according to the institutional guidelines and have been approved by the Institutional Animal Care and Use Committee of the Institute of Biosciences & Technology at the Texas A&M Health Science Center (IACUC 2014-0338-IBT).
Informed Consent Statement
Not applicable.
Data Availability Statement
The data presented in this study are available on request from the corresponding author.
Acknowledgments
We acknowledge Catherine Powell, Jian Zhang, and Ravi Sonkar for their help with the animal maintenance and technical help during the mouse study. We thank Zehuan Ding, Susheel Gunasekar, and Sunil Venkategowda for their constructive comments pertaining to the manuscript. We also thank Lauren Gladwell, Kathryn Kunz, Anusha Srinivas, and Maya Gonsoulin for editing the manuscript.
Conflicts of Interest
The authors declare no conflicts of interest.
Appendix A

Table A1.
List of primer sequences.
| Targets | Forward Primer (5′-3′) | Reverse Primer (5′-3′) |
|---|---|---|
| Dicer1 | GGTCCTTTCTTTGGACTGCCA | GCGATGAACGTCTTCCCTGA |
| TRBP2 | AGGAGCAGGCTTTCCATGTC | GGTGGACAGTTCCACTAGGC |
| Drosha | ATGCAAGGCAATACGTGTCAT | TTTTGGGGTCTGAAAGCTGGT |
| DGCR8 | GCAGGAGAAGCGATGATGGAG | CCGTAGAAGTTGAATGGGTCG |
| UCP1 | ACTGCCACACCTCCAGTCATT | CTTTGCCTCACTCAGGATTGG |
| PGC1α | TATGGAGTGACATAGAGTGTGCT | CCACTTCAATCCACCCAGAAAG |
| β-actin | AGCCATGTACGTAGCCATCC | GCTGTGGTGGTGAAGCTGTA |
| miRNA-103-3p | GCAGAGCAGCATTGTACAG | GGTCCAGTTTTTTTTTTTTTTTCATAG |
| miRNA-107-3p | GCAGAGCAGCATTGTACAG | GGTCCAGTTTTTTTTTTTTTTTGATAG |
| U6 | TGGCCCCTGCGCAAGGATG | AGTTTTTTTTTTTTTTTGCGCAG |
References
- Mitchell, N.S.; Catenacci, V.A.; Wyatt, H.R.; Hill, J.O. Obesity: Overview of an epidemic. Psychiatr. Clin. N. Am. 2011, 34, 717–732. [Google Scholar] [CrossRef] [PubMed]
- Crowley, V.E.; Yeo, G.S.; O’Rahilly, S. Obesity therapy: Altering the energy intake-and-expenditure balance sheet. Nat. Rev. Drug Discov. 2002, 1, 276–286. [Google Scholar] [CrossRef] [PubMed]
- Kumar, R.B.; Srivastava, G.; Reid, T.J.; Aronne, L.J. Understanding the pathophysiologic pathways that underlie obesity and options for treatment. Expert. Rev. Endocrinol. Metab. 2021, 16, 321–338. [Google Scholar] [CrossRef] [PubMed]
- Naomi, R.; Teoh, S.H.; Halim, S.; Embong, H.; Hasain, Z.; Bahari, H.; Kumar, J. Unraveling Obesity: Transgenerational Inheritance, Treatment Side Effects, Flavonoids, Mechanisms, Microbiota, Redox Balance, and Bioavailability—A Narrative Review. Antioxidants 2023, 12, 1549. [Google Scholar] [CrossRef] [PubMed]
- Lu, K.Y.; Primus Dass, K.T.; Tsai, S.F.; Chuang, H.M.; Lin, S.Z.; Liu, S.P.; Harn, H.J. Clinical Application Potential of Small Molecules that Induce Brown Adipose Tissue Thermogenesis by Improving Fat Metabolism. Cell Transplant. 2020, 29, 963689720927394. [Google Scholar] [CrossRef] [PubMed]
- Lowell, B.B.; S-Susulic, V.; Hamann, A.; Lawitts, J.A.; Himms-Hagen, J.; Boyer, B.B.; Kozak, L.P.; Flier, J.S. Development of obesity in transgenic mice after genetic ablation of brown adipose tissue. Nature 1993, 366, 740–742. [Google Scholar] [CrossRef] [PubMed]
- Becher, T.; Palanisamy, S.; Kramer, D.J.; Eljalby, M.; Marx, S.J.; Wibmer, A.G.; Butler, S.D.; Jiang, C.S.; Vaughan, R.; Schöder, H.; et al. Brown adipose tissue is associated with cardiometabolic health. Nat. Med. 2021, 27, 58–65. [Google Scholar] [CrossRef] [PubMed]
- Herz, C.T.; Kulterer, O.C.; Prager, M.; Schmöltzer, C.; Langer, F.B.; Prager, G.; Marculescu, R.; Kautzky-Willer, A.; Hacker, M.; Haug, A.R.; et al. Active Brown Adipose Tissue is Associated with a Healthier Metabolic Phenotype in Obesity. Diabetes 2021, 71, 93–103. [Google Scholar] [CrossRef] [PubMed]
- Frontini, A.; Cinti, S. Distribution and development of brown adipocytes in the murine and human adipose organ. Cell Metab. 2010, 11, 253–256. [Google Scholar] [CrossRef]
- Heenan, K.A.; Carrillo, A.E.; Fulton, J.L.; Ryan, E.J.; Edsall, J.R.; Rigopoulos, D.; Markofski, M.M.; Flouris, A.D.; Dinas, P.C. Effects of Nutrition/Diet on Brown Adipose Tissue in Humans: A Systematic Review and Meta-Analysis. Nutrients 2020, 12, 2752. [Google Scholar] [CrossRef]
- Feldmann, H.M.; Golozoubova, V.; Cannon, B.; Nedergaard, J. UCP1 ablation induces obesity and abolishes diet-induced thermogenesis in mice exempt from thermal stress by living at thermoneutrality. Cell Metab. 2009, 9, 203–209. [Google Scholar] [CrossRef]
- Srivastava, S.; Baxa, U.; Niu, G.; Chen, X.; Veech, R.L. A ketogenic diet increases brown adipose tissue mitochondrial proteins and UCP1 levels in mice. IUBMB Life 2013, 65, 58–66. [Google Scholar] [CrossRef]
- Roberts-Toler, C.; O’Neill, B.T.; Cypess, A.M. Diet-induced obesity causes insulin resistance in mouse brown adipose tissue. Obesity 2015, 23, 1765–1770. [Google Scholar] [CrossRef]
- Shimizu, I.; Aprahamian, T.; Kikuchi, R.; Shimizu, A.; Papanicolaou, K.N.; MacLauchlan, S.; Maruyama, S.; Walsh, K. Vascular rarefaction mediates whitening of brown fat in obesity. J. Clin. Investig. 2014, 124, 2099–2112. [Google Scholar] [CrossRef] [PubMed]
- Alcala, M.; Calderon-Dominguez, M.; Bustos, E.; Ramos, P.; Casals, N.; Serra, D.; Viana, M.; Herrero, L. Increased inflammation, oxidative stress and mitochondrial respiration in brown adipose tissue from obese mice. Sci. Rep. 2017, 7, 16082. [Google Scholar] [CrossRef]
- Kuipers, E.N.; Held, N.M.; In Het Panhuis, W.; Modder, M.; Ruppert, P.M.M.; Kersten, S.; Kooijman, S.; Guigas, B.; Houtkooper, R.H.; Rensen, P.C.N.; et al. A single day of high-fat diet feeding induces lipid accumulation and insulin resistance in brown adipose tissue in mice. Am. J. Physiol. Endocrinol. Metab. 2019, 317, E820–E830. [Google Scholar] [CrossRef]
- Richard, G.; Blondin, D.P.; Syed, S.A.; Rossi, L.; Fontes, M.E.; Fortin, M.; Phoenix, S.; Frisch, F.; Dubreuil, S.; Guérin, B.; et al. High-fructose feeding suppresses cold-stimulated brown adipose tissue glucose uptake independently of changes in thermogenesis and the gut microbiome. Cell Rep. Med. 2022, 3, 100742. [Google Scholar] [CrossRef] [PubMed]
- Raad, G.; Serra, F.; Martin, L.; Derieppe, M.A.; Gilleron, J.; Costa, V.L.; Pisani, D.F.; Amri, E.Z.; Trabucchi, M.; Grandjean, V. Paternal multigenerational exposure to an obesogenic diet drives epigenetic predisposition to metabolic diseases in mice. eLife 2021, 10, e61736. [Google Scholar] [CrossRef]
- Martino, E.; D’Onofrio, N.; Balestrieri, A.; Colloca, A.; Anastasio, C.; Sardu, C.; Marfella, R.; Campanile, G.; Balestrieri, M.L. Dietary Epigenetic Modulators: Unravelling the Still-Controversial Benefits of miRNAs in Nutrition and Disease. Nutrients 2024, 16, 160. [Google Scholar] [CrossRef]
- MacDonald-Ramos, K.; Martínez-Ibarra, A.; Monroy, A.; Miranda-Ríos, J.; Cerbón, M. Effect of Dietary Fatty Acids on MicroRNA Expression Related to Metabolic Disorders and Inflammation in Human and Animal Trials. Nutrients 2021, 13, 1830. [Google Scholar] [CrossRef]
- Quintanilha, B.J.; Pinto Ferreira, L.R.; Ferreira, F.M.; Neto, E.C.; Sampaio, G.R.; Rogero, M.M. Circulating plasma microRNAs dysregulation and metabolic endotoxemia induced by a high-fat high-saturated diet. Clin. Nutr. 2020, 39, 554–562. [Google Scholar] [CrossRef]
- Kim, H.J.; Cho, H.; Alexander, R.; Patterson, H.C.; Gu, M.; Lo, K.A.; Xu, D.; Goh, V.J.; Nguyen, L.N.; Chai, X.; et al. MicroRNAs are required for the feature maintenance and differentiation of brown adipocytes. Diabetes 2014, 63, 4045–4056. [Google Scholar] [CrossRef]
- Fu, T.; Seok, S.; Choi, S.; Huang, Z.; Suino-Powell, K.; Xu, H.E.; Kemper, B.; Kemper, J.K. MicroRNA 34a inhibits beige and brown fat formation in obesity in part by suppressing adipocyte fibroblast growth factor 21 signaling and SIRT1 function. Mol. Cell Biol. 2014, 34, 4130–4142. [Google Scholar] [CrossRef] [PubMed]
- Chen, Y.; Siegel, F.; Kipschull, S.; Haas, B.; Frohlich, H.; Meister, G.; Pfeifer, A. miR-155 regulates differentiation of brown and beige adipocytes via a bistable circuit. Nat. Commun. 2013, 4, 1769. [Google Scholar] [CrossRef]
- Davis, C.D.; Ross, S.A. Evidence for dietary regulation of microRNA expression in cancer cells. Nutr. Rev. 2008, 66, 477–482. [Google Scholar] [CrossRef]
- Mori, M.A.; Thomou, T.; Boucher, J.; Lee, K.Y.; Lallukka, S.; Kim, J.K.; Torriani, M.; Yki-Järvinen, H.; Grinspoon, S.K.; Cypess, A.M.; et al. Altered miRNA processing disrupts brown/white adipocyte determination and associates with lipodystrophy. J. Clin. Investig. 2014, 124, 3339–3351. [Google Scholar] [CrossRef] [PubMed]
- Price, N.L.; Fernandez-Hernando, C. miRNA regulation of white and brown adipose tissue differentiation and function. Biochim. Biophys. Acta 2016, 1861, 2104–2110. [Google Scholar] [CrossRef]
- Zhang, J.; Kay, M.K.; Park, M.H.; Meruvu, S.; Powell, C.; Choudhury, M. LncRNA DLEU2 regulates sirtuins and mitochondrial respiratory chain complex IV: A novel pathway in obesity and offspring’s health. Int. J. Obes. 2022, 46, 969–976. [Google Scholar] [CrossRef] [PubMed]
- Ziqubu, K.; Dludla, P.V.; Mthembu, S.X.H.; Nkambule, B.B.; Mabhida, S.E.; Jack, B.U.; Nyambuya, T.M.; Mazibuko-Mbeje, S.E. An insight into brown/beige adipose tissue whitening, a metabolic complication of obesity with the multifactorial origin. Front. Endocrinol. 2023, 14, 1114767. [Google Scholar] [CrossRef]
- Shi, C.; Zhang, M.; Tong, M.; Yang, L.; Pang, L.; Chen, L.; Xu, G.; Chi, X.; Hong, Q.; Ni, Y.; et al. miR-148a is Associated with Obesity and Modulates Adipocyte Differentiation of Mesenchymal Stem Cells through Wnt Signaling. Sci. Rep. 2015, 5, 9930. [Google Scholar] [CrossRef]
- Trajkovski, M.; Hausser, J.; Soutschek, J.; Bhat, B.; Akin, A.; Zavolan, M.; Heim, M.H.; Stoffel, M. MicroRNAs 103 and 107 regulate insulin sensitivity. Nature 2011, 474, 649–653. [Google Scholar] [CrossRef]
- Wilfred, B.R.; Wang, W.X.; Nelson, P.T. Energizing miRNA research: A review of the role of miRNAs in lipid metabolism, with a prediction that miR-103/107 regulates human metabolic pathways. Mol. Genet. Metab. 2007, 91, 209–217. [Google Scholar] [CrossRef] [PubMed]
- Kehl, T.; Backes, C.; Kern, F.; Fehlmann, T.; Ludwig, N.; Meese, E.; Lenhof, H.P.; Keller, A. About miRNAs, miRNA seeds, target genes and target pathways. Oncotarget 2017, 8, 107167–107175. [Google Scholar] [CrossRef]
- Carpentier, A.C.; Blondin, D.P.; Virtanen, K.A.; Richard, D.; Haman, F.; Turcotte, E.E. Brown Adipose Tissue Energy Metabolism in Humans. Front. Endocrinol. 2018, 9, 447. [Google Scholar] [CrossRef] [PubMed]
- Cui, X.; Xiao, W.; You, L.; Zhang, F.; Cao, X.; Feng, J.; Shen, D.; Li, Y.; Wang, Y.; Ji, C.; et al. Age-induced oxidative stress impairs adipogenesis and thermogenesis in brown fat. FEBS J. 2019, 286, 2753–2768. [Google Scholar] [CrossRef]
- Ohtomo, T.; Ino, K.; Miyashita, R.; Chigira, M.; Nakamura, M.; Someya, K.; Inaba, N.; Fujita, M.; Takagi, M.; Yamada, J. Chronic high-fat feeding impairs adaptive induction of mitochondrial fatty acid combustion-associated proteins in brown adipose tissue of mice. Biochem. Biophys. Rep. 2017, 10, 32–38. [Google Scholar] [CrossRef] [PubMed]
- Wada, T.; Kenmochi, H.; Miyashita, Y.; Sasaki, M.; Ojima, M.; Sasahara, M.; Koya, D.; Tsuneki, H.; Sasaoka, T. Spironolactone improves glucose and lipid metabolism by ameliorating hepatic steatosis and inflammation and suppressing enhanced gluconeogenesis induced by high-fat and high-fructose diet. Endocrinology 2010, 151, 2040–2049. [Google Scholar] [CrossRef]
- Zhang, J.; Powell, C.A.; Kay, M.K.; Sonkar, R.; Meruvu, S.; Choudhury, M. Effect of Chronic Western Diets on Non-Alcoholic Fatty Liver of Male Mice Modifying the PPAR-γ Pathway via miR-27b-5p Regulation. Int. J. Mol. Sci. 2021, 22, 1822. [Google Scholar] [CrossRef] [PubMed]
- Collins, F.S.; Tabak, L.A. Policy: NIH plans to enhance reproducibility. Nature 2014, 505, 612–613. [Google Scholar] [CrossRef]
- Kotzbeck, P.; Giordano, A.; Mondini, E.; Murano, I.; Severi, I.; Venema, W.; Cecchini, M.P.; Kershaw, E.E.; Barbatelli, G.; Haemmerle, G.; et al. Brown adipose tissue whitening leads to brown adipocyte death and adipose tissue inflammation. J. Lipid Res. 2018, 59, 784–794. [Google Scholar] [CrossRef]
- Leitner, B.P.; Huang, S.; Brychta, R.J.; Duckworth, C.J.; Baskin, A.S.; McGehee, S.; Tal, I.; Dieckmann, W.; Gupta, G.; Kolodny, G.M.; et al. Mapping of human brown adipose tissue in lean and obese young men. Proc. Natl. Acad. Sci. USA 2017, 114, 8649–8654. [Google Scholar] [CrossRef] [PubMed]
- Maharjan, B.R.; McLennan, S.V.; Yee, C.; Twigg, S.M.; Williams, P.F. The Effect of a Sustained High-Fat Diet on the Metabolism of White and Brown Adipose Tissue and Its Impact on Insulin Resistance: A Selected Time Point Cross-Sectional Study. Int. J. Mol. Sci. 2021, 22, 13639. [Google Scholar] [CrossRef] [PubMed]
- Dickson, L.M.; Gandhi, S.; Layden, B.T.; Cohen, R.N.; Wicksteed, B. Protein kinase A induces UCP1 expression in specific adipose depots to increase energy expenditure and improve metabolic health. Am. J. Physiol. Regul. Integr. Comp. Physiol. 2016, 311, R79–R88. [Google Scholar] [CrossRef]
- Moreno-Fernandez, S.; Garces-Rimon, M.; Uranga, J.A.; Astier, J.; Landrier, J.F.; Miguel, M. Expression enhancement in brown adipose tissue of genes related to thermogenesis and mitochondrial dynamics after administration of pepsin egg white hydrolysate. Food Funct. 2018, 9, 6599–6607. [Google Scholar] [CrossRef] [PubMed]
- Liu, Z.; Gu, H.; Gan, L.; Xu, Y.; Feng, F.; Saeed, M.; Sun, C. Reducing Smad3/ATF4 was essential for Sirt1 inhibiting ER stress-induced apoptosis in mice brown adipose tissue. Oncotarget 2017, 8, 9267–9279. [Google Scholar] [CrossRef]
- Lund, E.; Guttinger, S.; Calado, A.; Dahlberg, J.E.; Kutay, U. Nuclear export of microRNA precursors. Science 2004, 303, 95–98. [Google Scholar] [CrossRef]
Figure 1.
HFHFD feeding promotes BAT whitening with increased tissue weight. Male C57BL/6 mice were fed on either an LFD or HFHFD for 4, 12, and 20 weeks. The clear bar represents BAT from LFD mice and gray bar represents the BAT from HFHFD mice. (a) Representative images of BAT. (b) Tissue weight at the time of sacrifice (n = 6–8). Data shown as the mean ± SEM. *** p < 0.001 compared to LFD.

Figure 2.
HFHFD feeding diminishes thermogenesis and elevates apoptosis in BAT. The clear bar represents BAT from LFD mice and gray bar represents the BAT from HFHFD mice. Protein expression levels of (a) thermogenesis markers: UCP1, and PGC1α (b) apoptosis markers: Bax and Bcl2 in BAT of mice fed on LFD and HFHFD for 4 weeks and 12 weeks (n = 4). β-actin was used as a loading control for Western blot analysis. Western blot images are representative of one of three different experiments. Data shown as the mean ± SEM. * p < 0.05, and ** p < 0.01 vs. LFD.
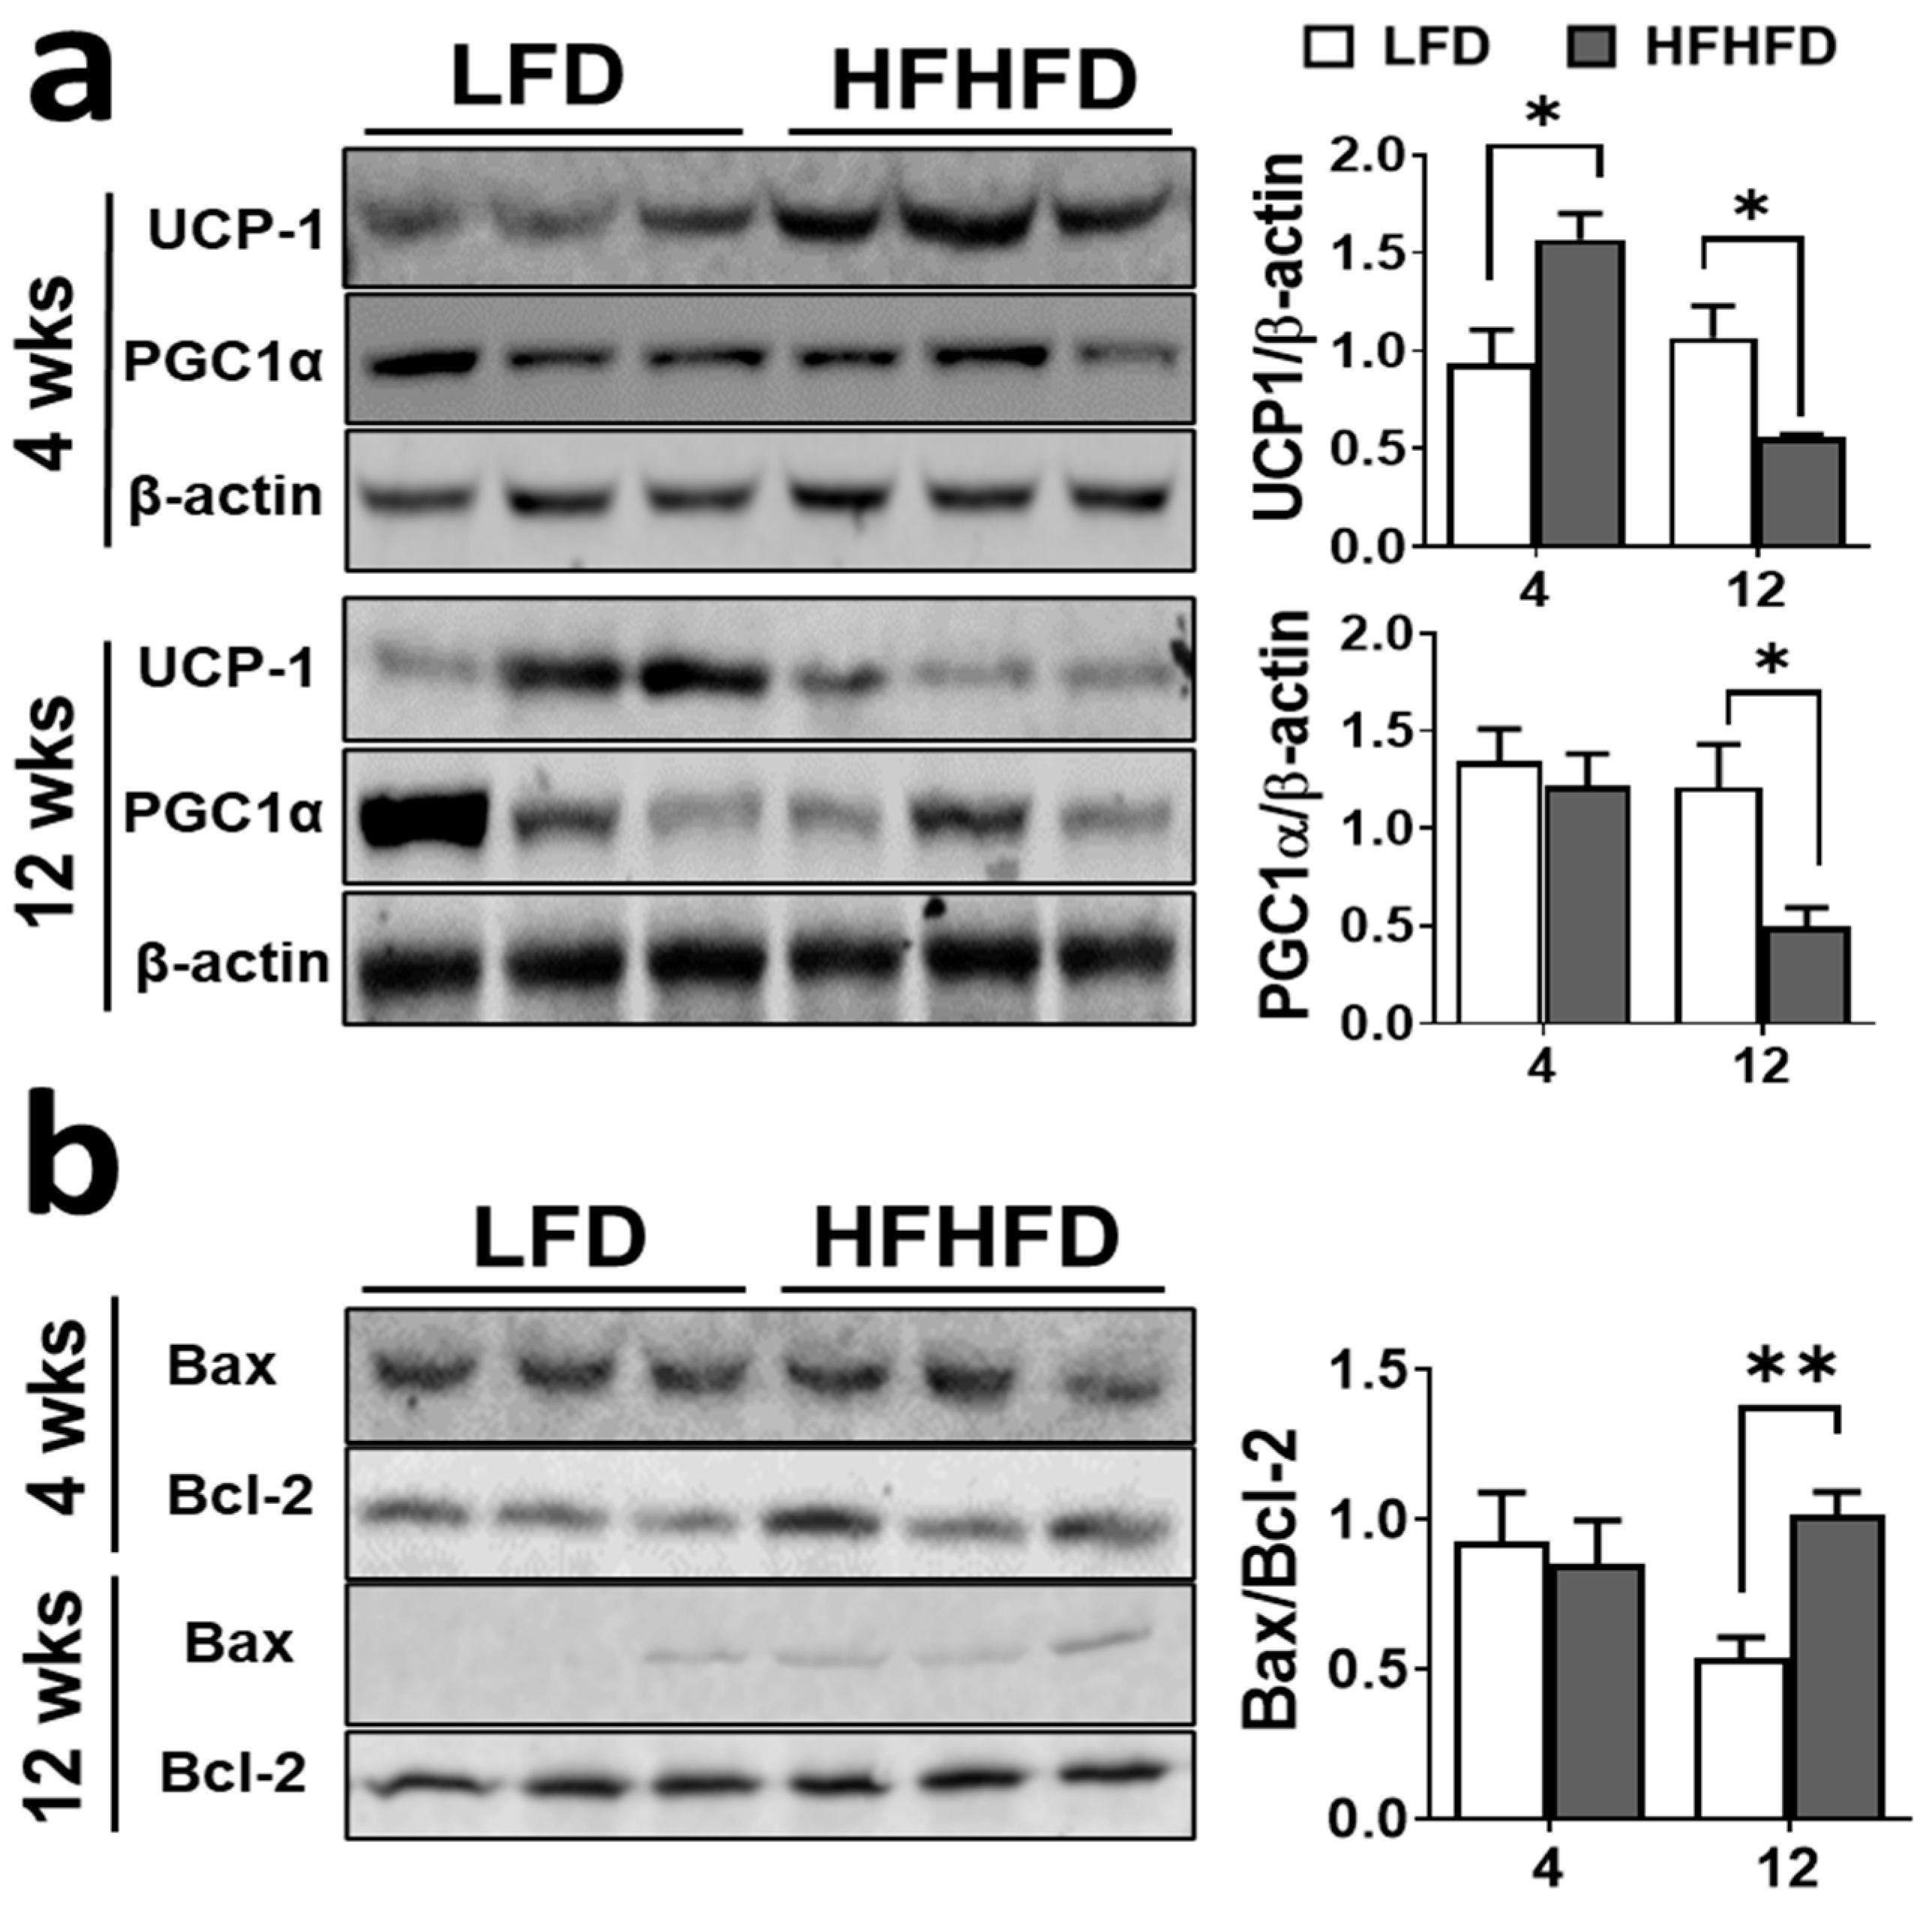
Figure 3.
HFHFD induces upregulation of miRNA-103/107 expression in BAT. The clear bar represents BAT from LFD mice and gray bar represents the BAT from HFHFD mice. (a) Gene expression levels of miRNA-103 and miRNA-107 (n = 6–8). U6 was used as an internal control for qPCR. Data shown as the mean ± SEM. * p < 0.05, ** p < 0.01, and *** p < 0.001 vs. the LFD. (b) Targetscan analysis represents the seed sequence of miRNA-103 and miR-107 within Dicer.

Figure 4.
HFHFD dysregulates miRNA biogenesis machinery in BAT. The clear bar represents BAT from LFD mice and gray bar represents the BAT from HFHFD mice. (a) Gene expression of miRNA biogenesis machinery and (b) protein expression levels of Dicer and TRBP2 complex in BAT of LFD and HFHFD fed mice by qPCR (n = 6–8) and Western blot analysis (n = 4), respectively. β-actin expression was used as an internal control (this β-actin is also used in Figure 2a. Please refer to Section 2.3 for more details) and loading control for qPCR and Western blot analysis, respectively. Western blot images are representative of three different experiments. The data are shown as the mean ± SEM. * p < 0.05, ** p < 0.01, and *** p < 0.001 vs. the LFD.
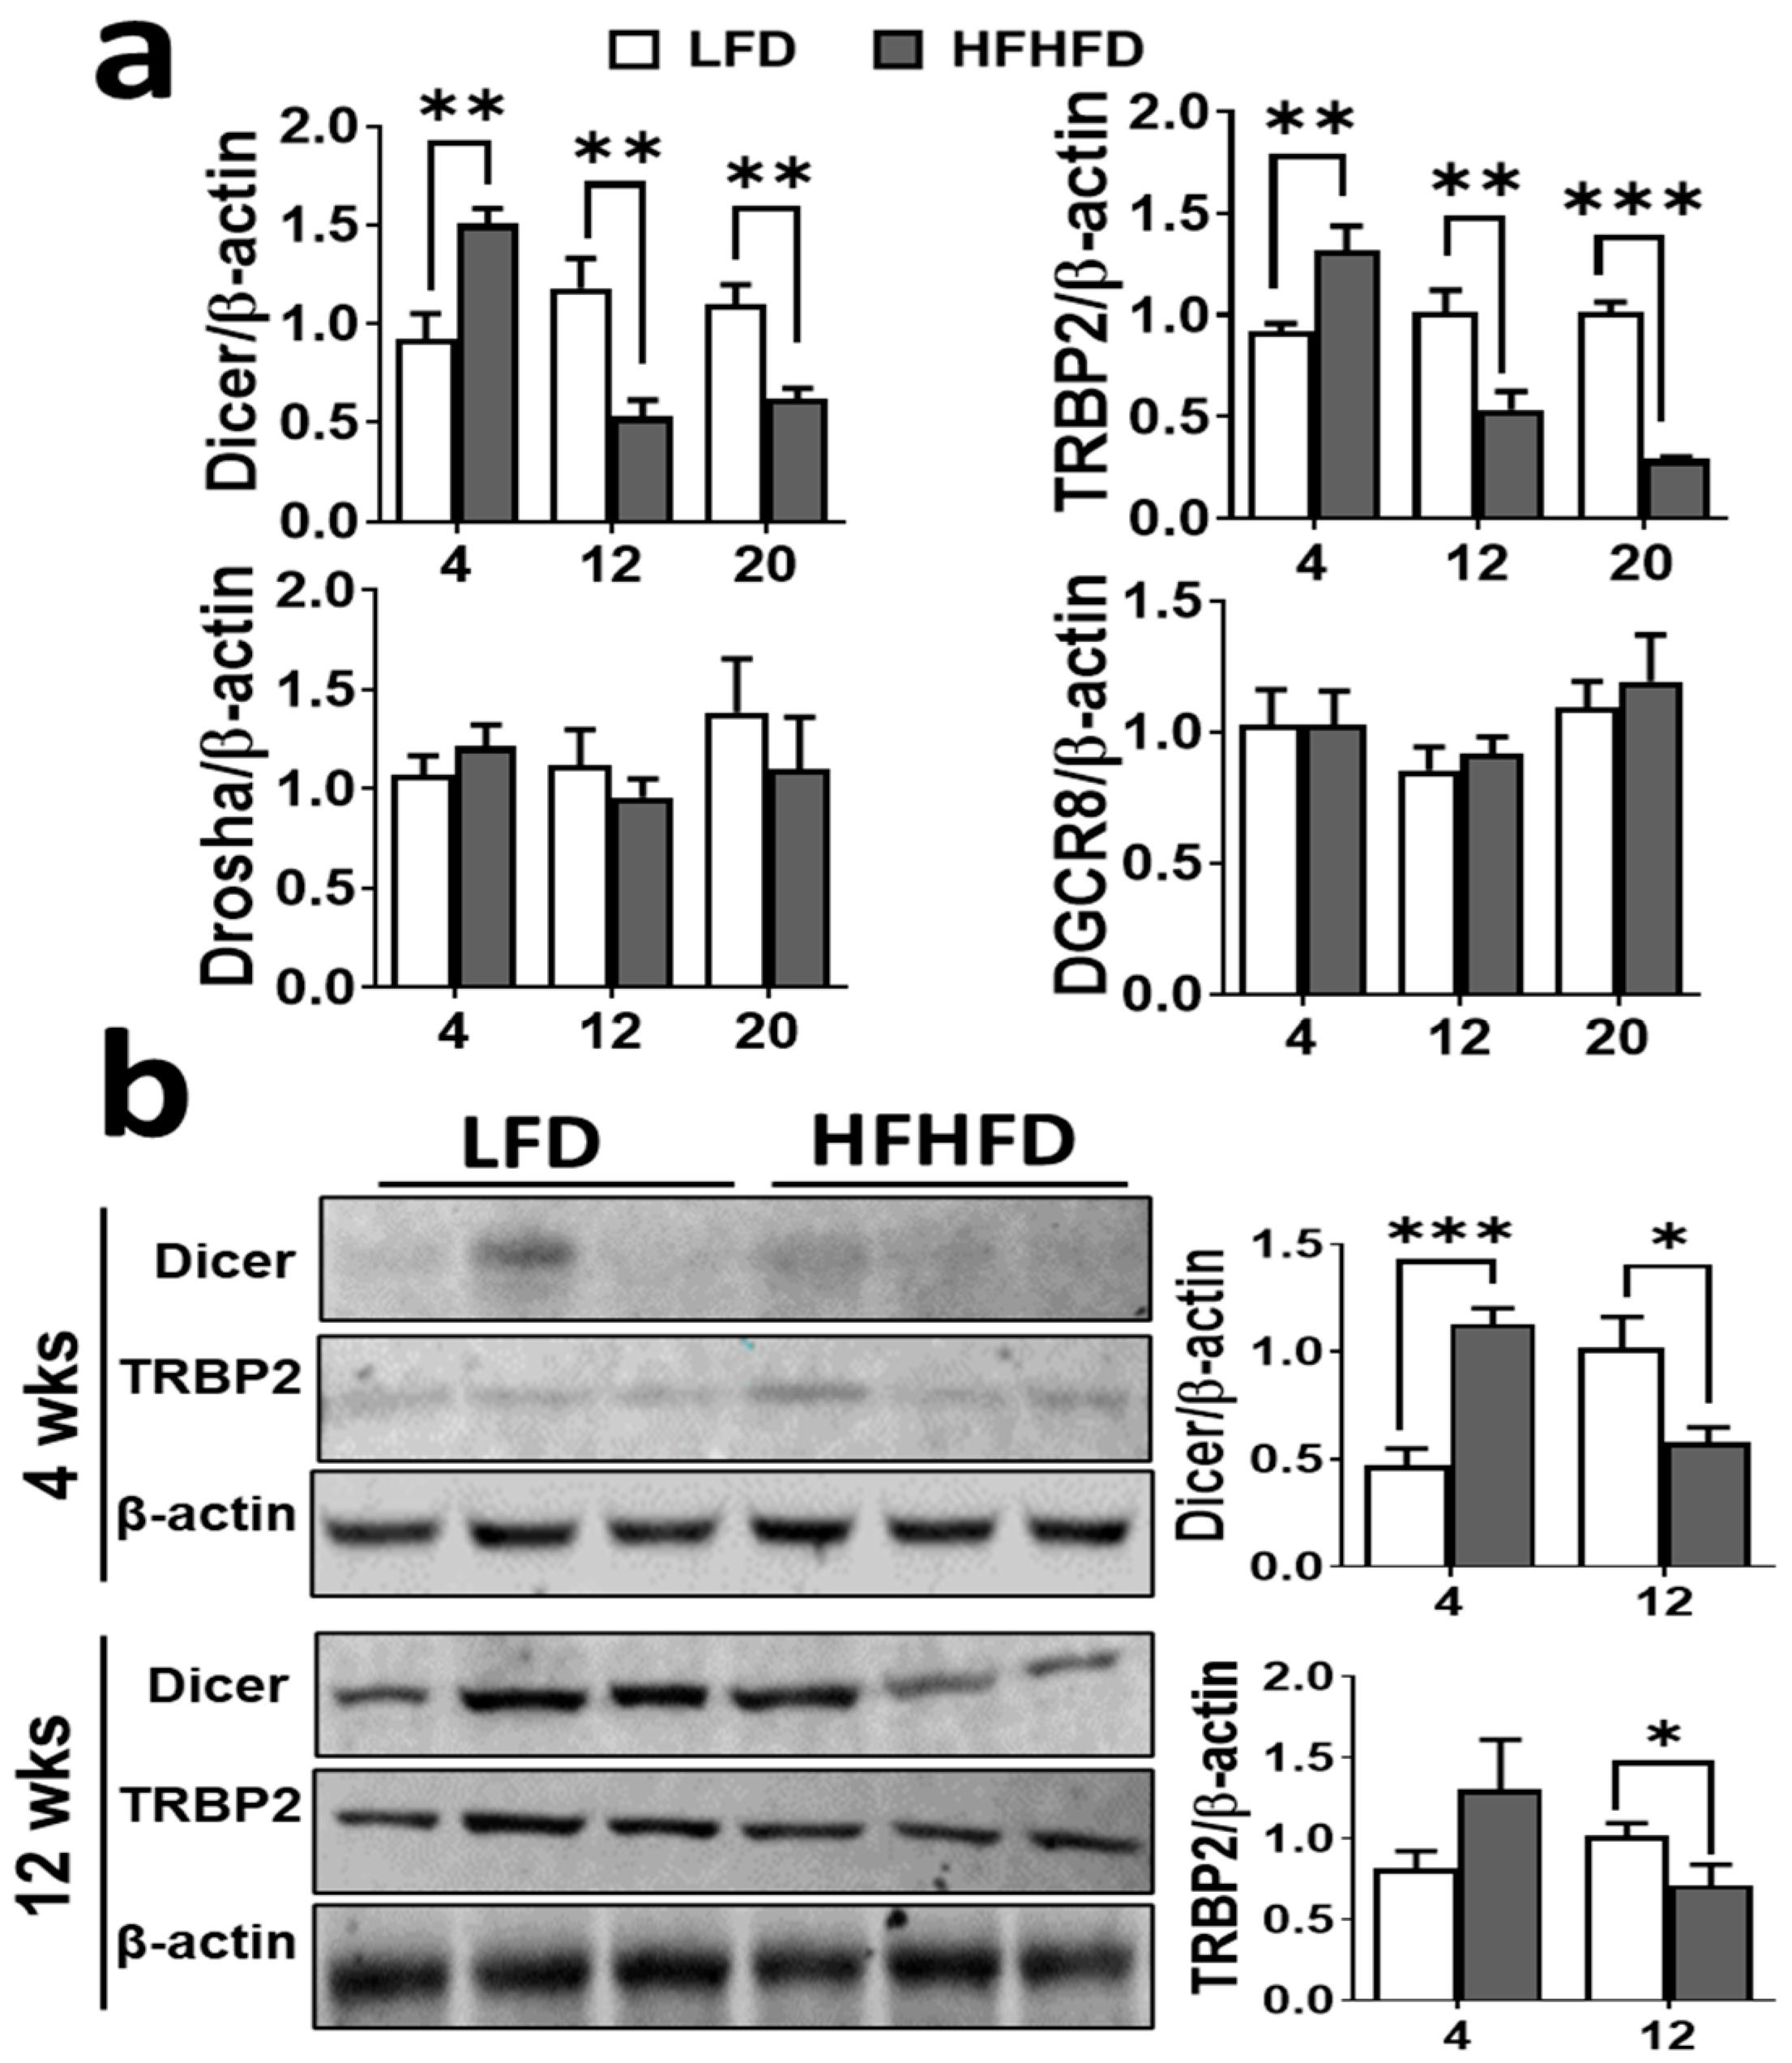
Figure 5.
miRNA-103 knockdown elevates Dicer expression in vitro. NC: negative control, KD: miRNA-103 knockdown. The clear bar represents NC and gray bar represents KD. (a) miRNA-103 knockdown; (b) miRNA biogenesis machinery gene expression; (c) Western blot depicting Dicer and TRBP2 protein levels upon miRNA-103 knockdown. Data shown as the mean ± SEM. ** p < 0.01, and *** p < 0.001.

Figure 6.
Proposed model of miRNA processing in obesity. Consumption of a high-fat high-fructose Western diet can induce Brown adipocyte dysfunction. An increase in miRNA-103 levels can inhibit miRNA biogenesis machinery including Dicer in brown adipocytes. This perturbation coupled with other unknown miRNAs may contribute to impaired thermogenesis and accelerated apoptosis, ultimately leading to obesity. Created with BioRender.com.

Disclaimer/Publisher’s Note: The statements, opinions and data contained in all publications are solely those of the individual author(s) and contributor(s) and not of MDPI and/or the editor(s). MDPI and/or the editor(s) disclaim responsibility for any injury to people or property resulting from any ideas, methods, instructions or products referred to in the content. |
© 2024 by the authors. Licensee MDPI, Basel, Switzerland. This article is an open access article distributed under the terms and conditions of the Creative Commons Attribution (CC BY) license (https://creativecommons.org/licenses/by/4.0/).
Share and Cite
MDPI and ACS Style
Shree, N.; Meruvu, S.; Park, M.H.; Choudhury, M. High-Fat-High-Fructose Diet Elicits Brown Adipocyte Dysfunction through miRNA-103 Induced miRNA Biogenesis Pathway. Obesities 2024, 4, 93-105. https://doi.org/10.3390/obesities4020010
AMA Style
Shree N, Meruvu S, Park MH, Choudhury M. High-Fat-High-Fructose Diet Elicits Brown Adipocyte Dysfunction through miRNA-103 Induced miRNA Biogenesis Pathway. Obesities. 2024; 4(2):93-105. https://doi.org/10.3390/obesities4020010
Chicago/Turabian StyleShree, Nitya, Sunitha Meruvu, Min Hi Park, and Mahua Choudhury. 2024. "High-Fat-High-Fructose Diet Elicits Brown Adipocyte Dysfunction through miRNA-103 Induced miRNA Biogenesis Pathway" Obesities 4, no. 2: 93-105. https://doi.org/10.3390/obesities4020010