Directional Differences in Thematic Maps of Soil Chemical Attributes with Geometric Anisotropy
Abstract
1. Introduction
2. Materials and Methods
2.1. Simulation Study
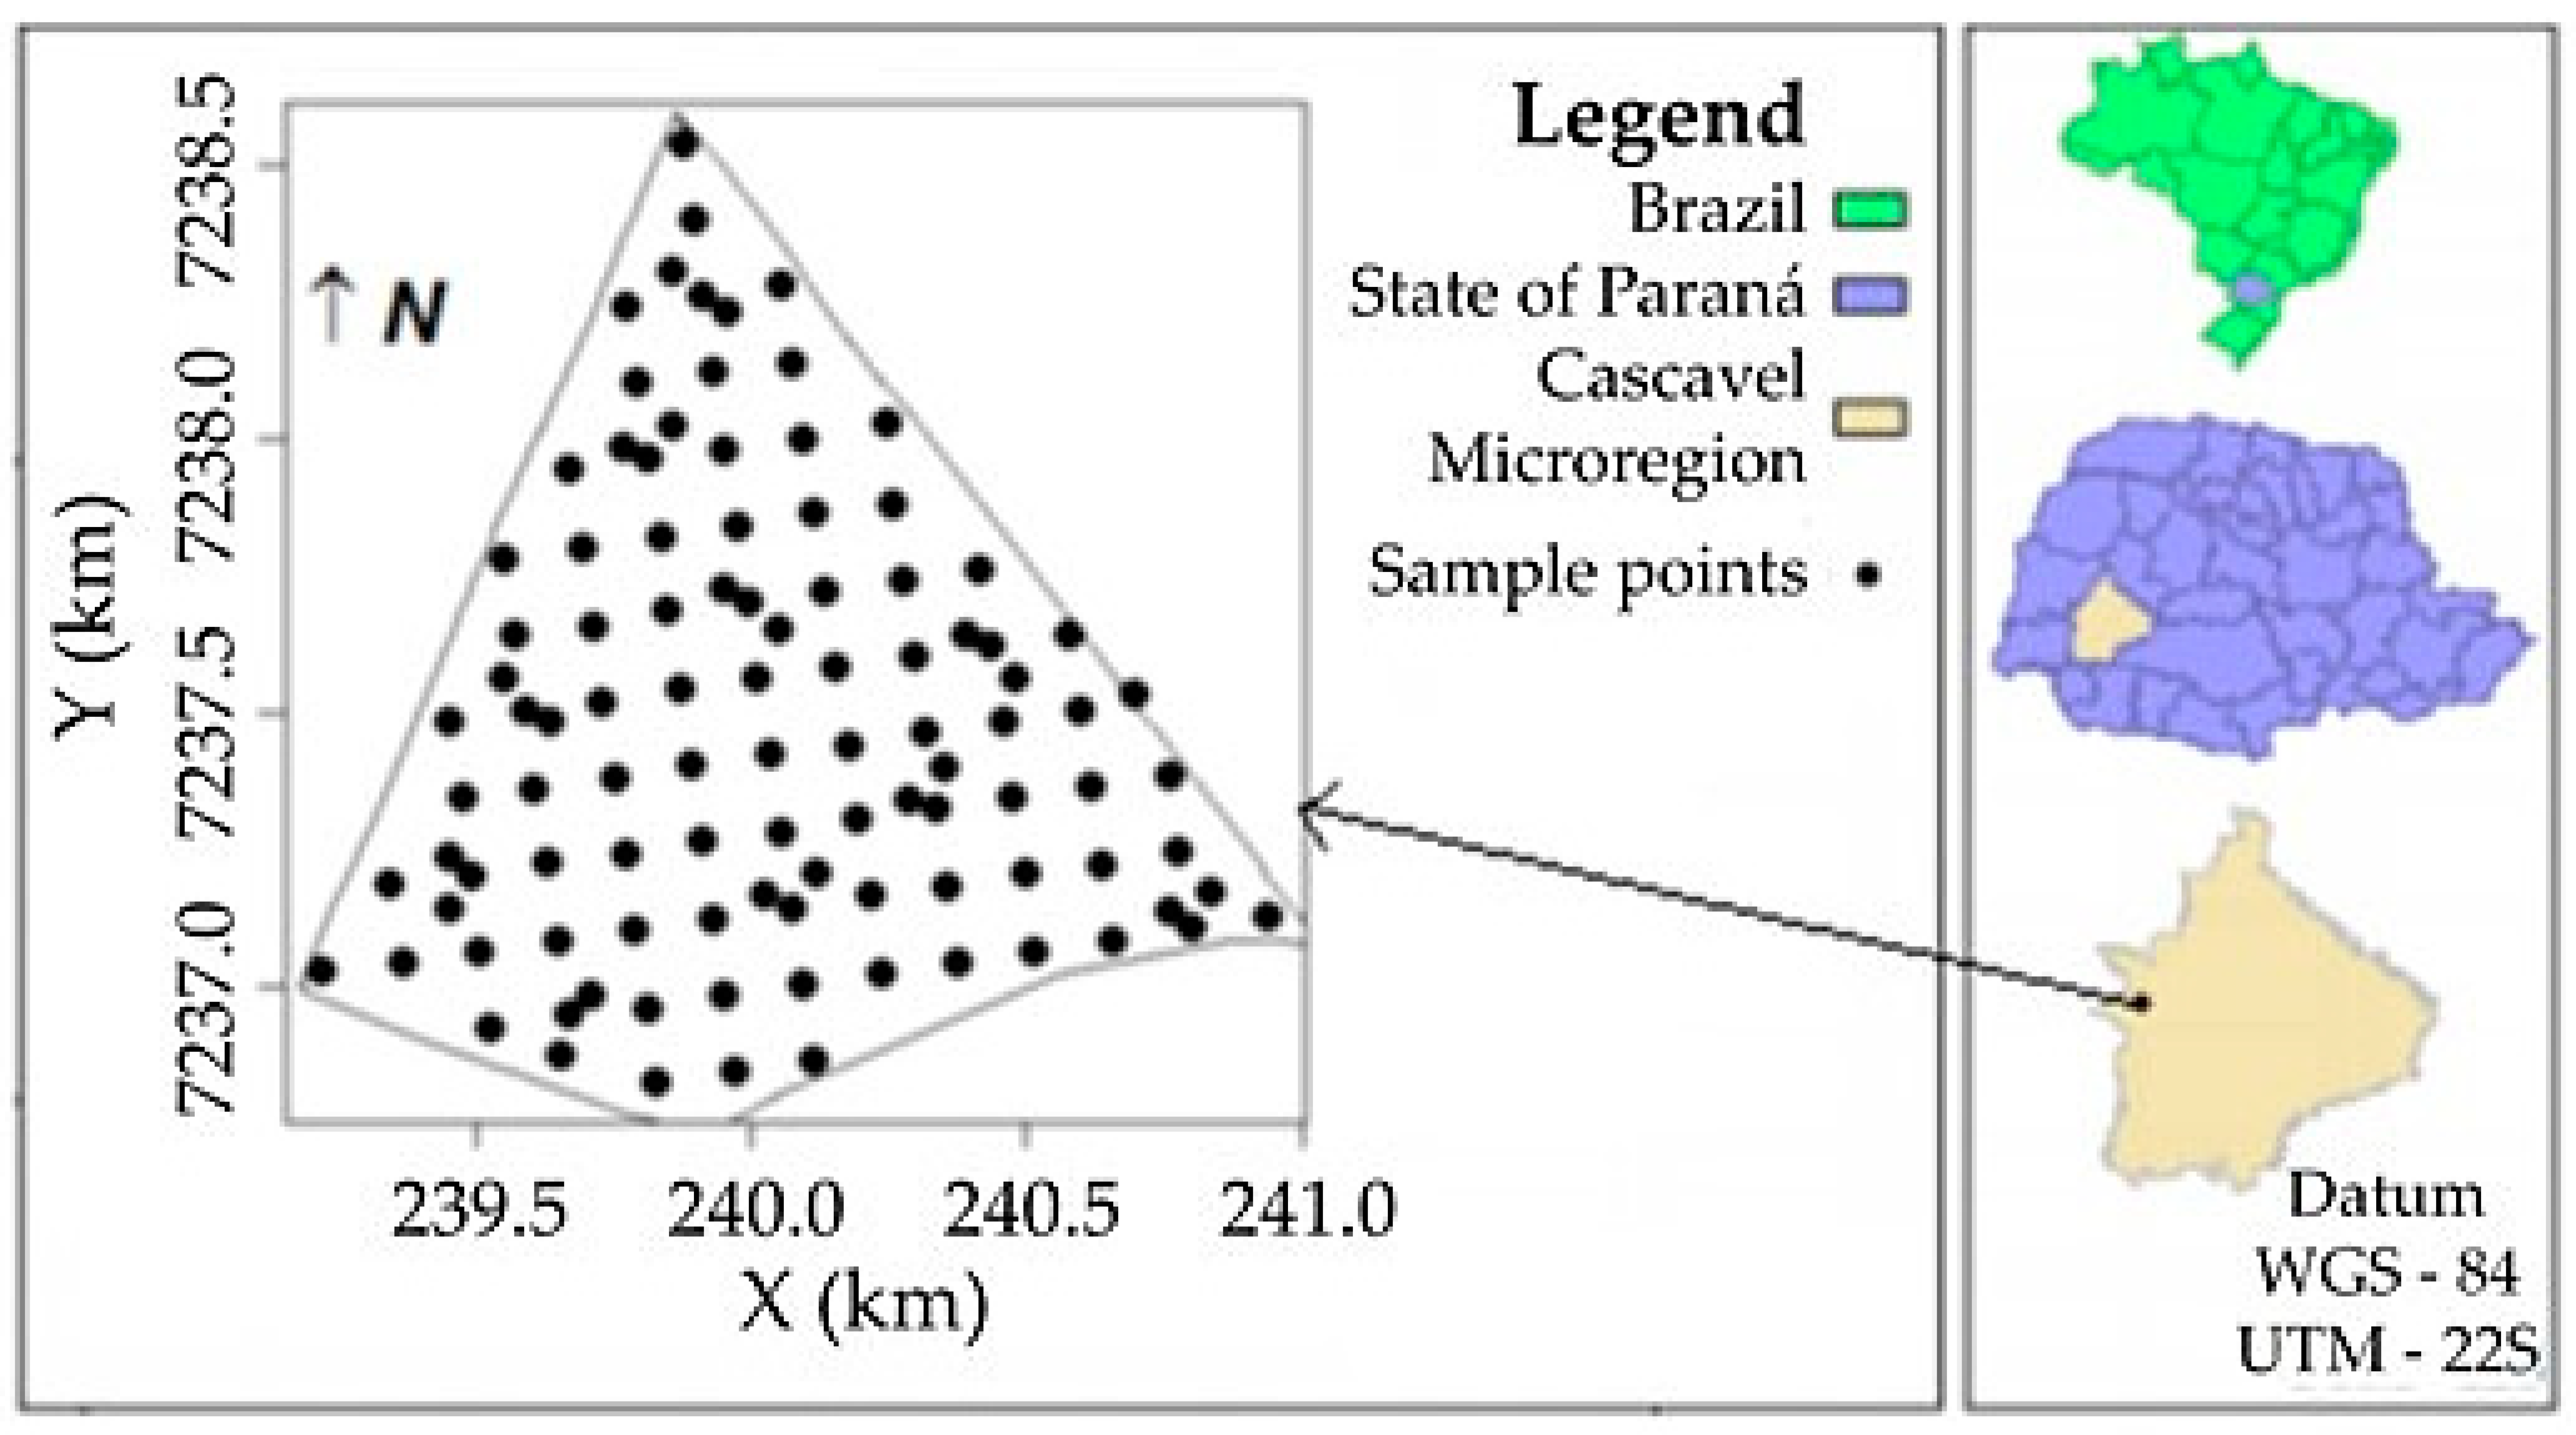
2.2. Soil Chemical Property Study
2.3. Computational Resources
3. Results
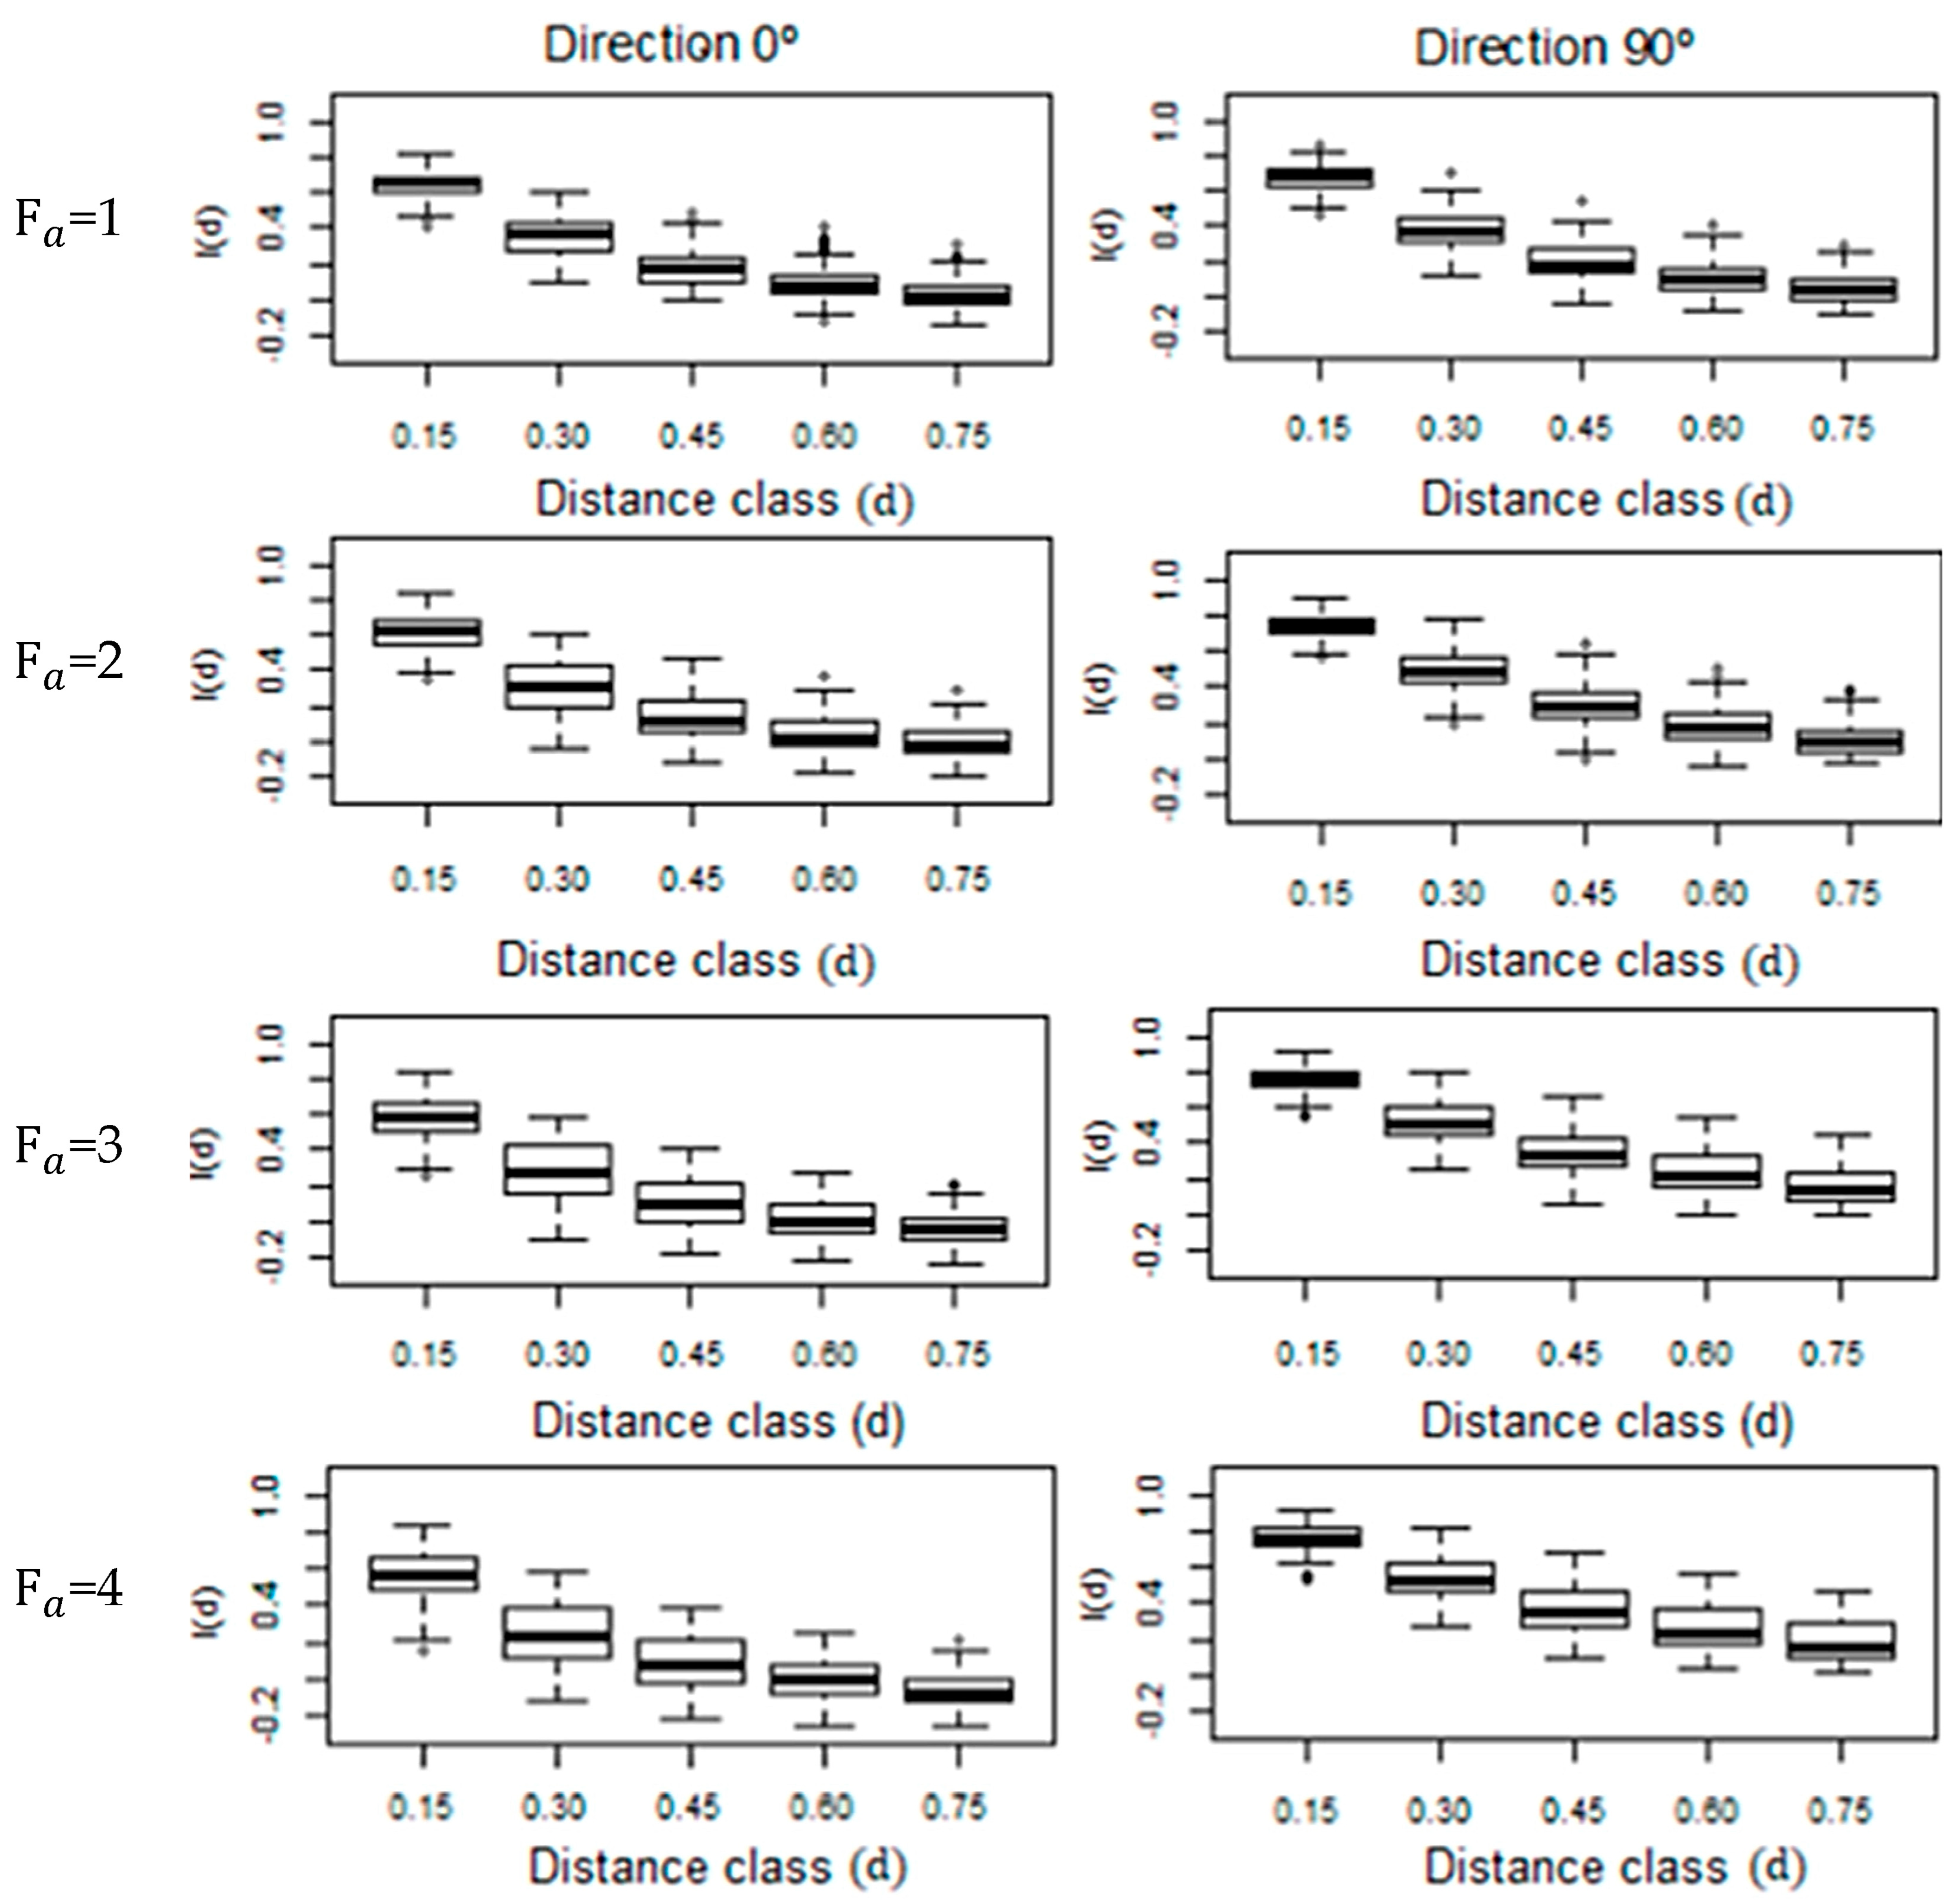
3.1. Simulation Study
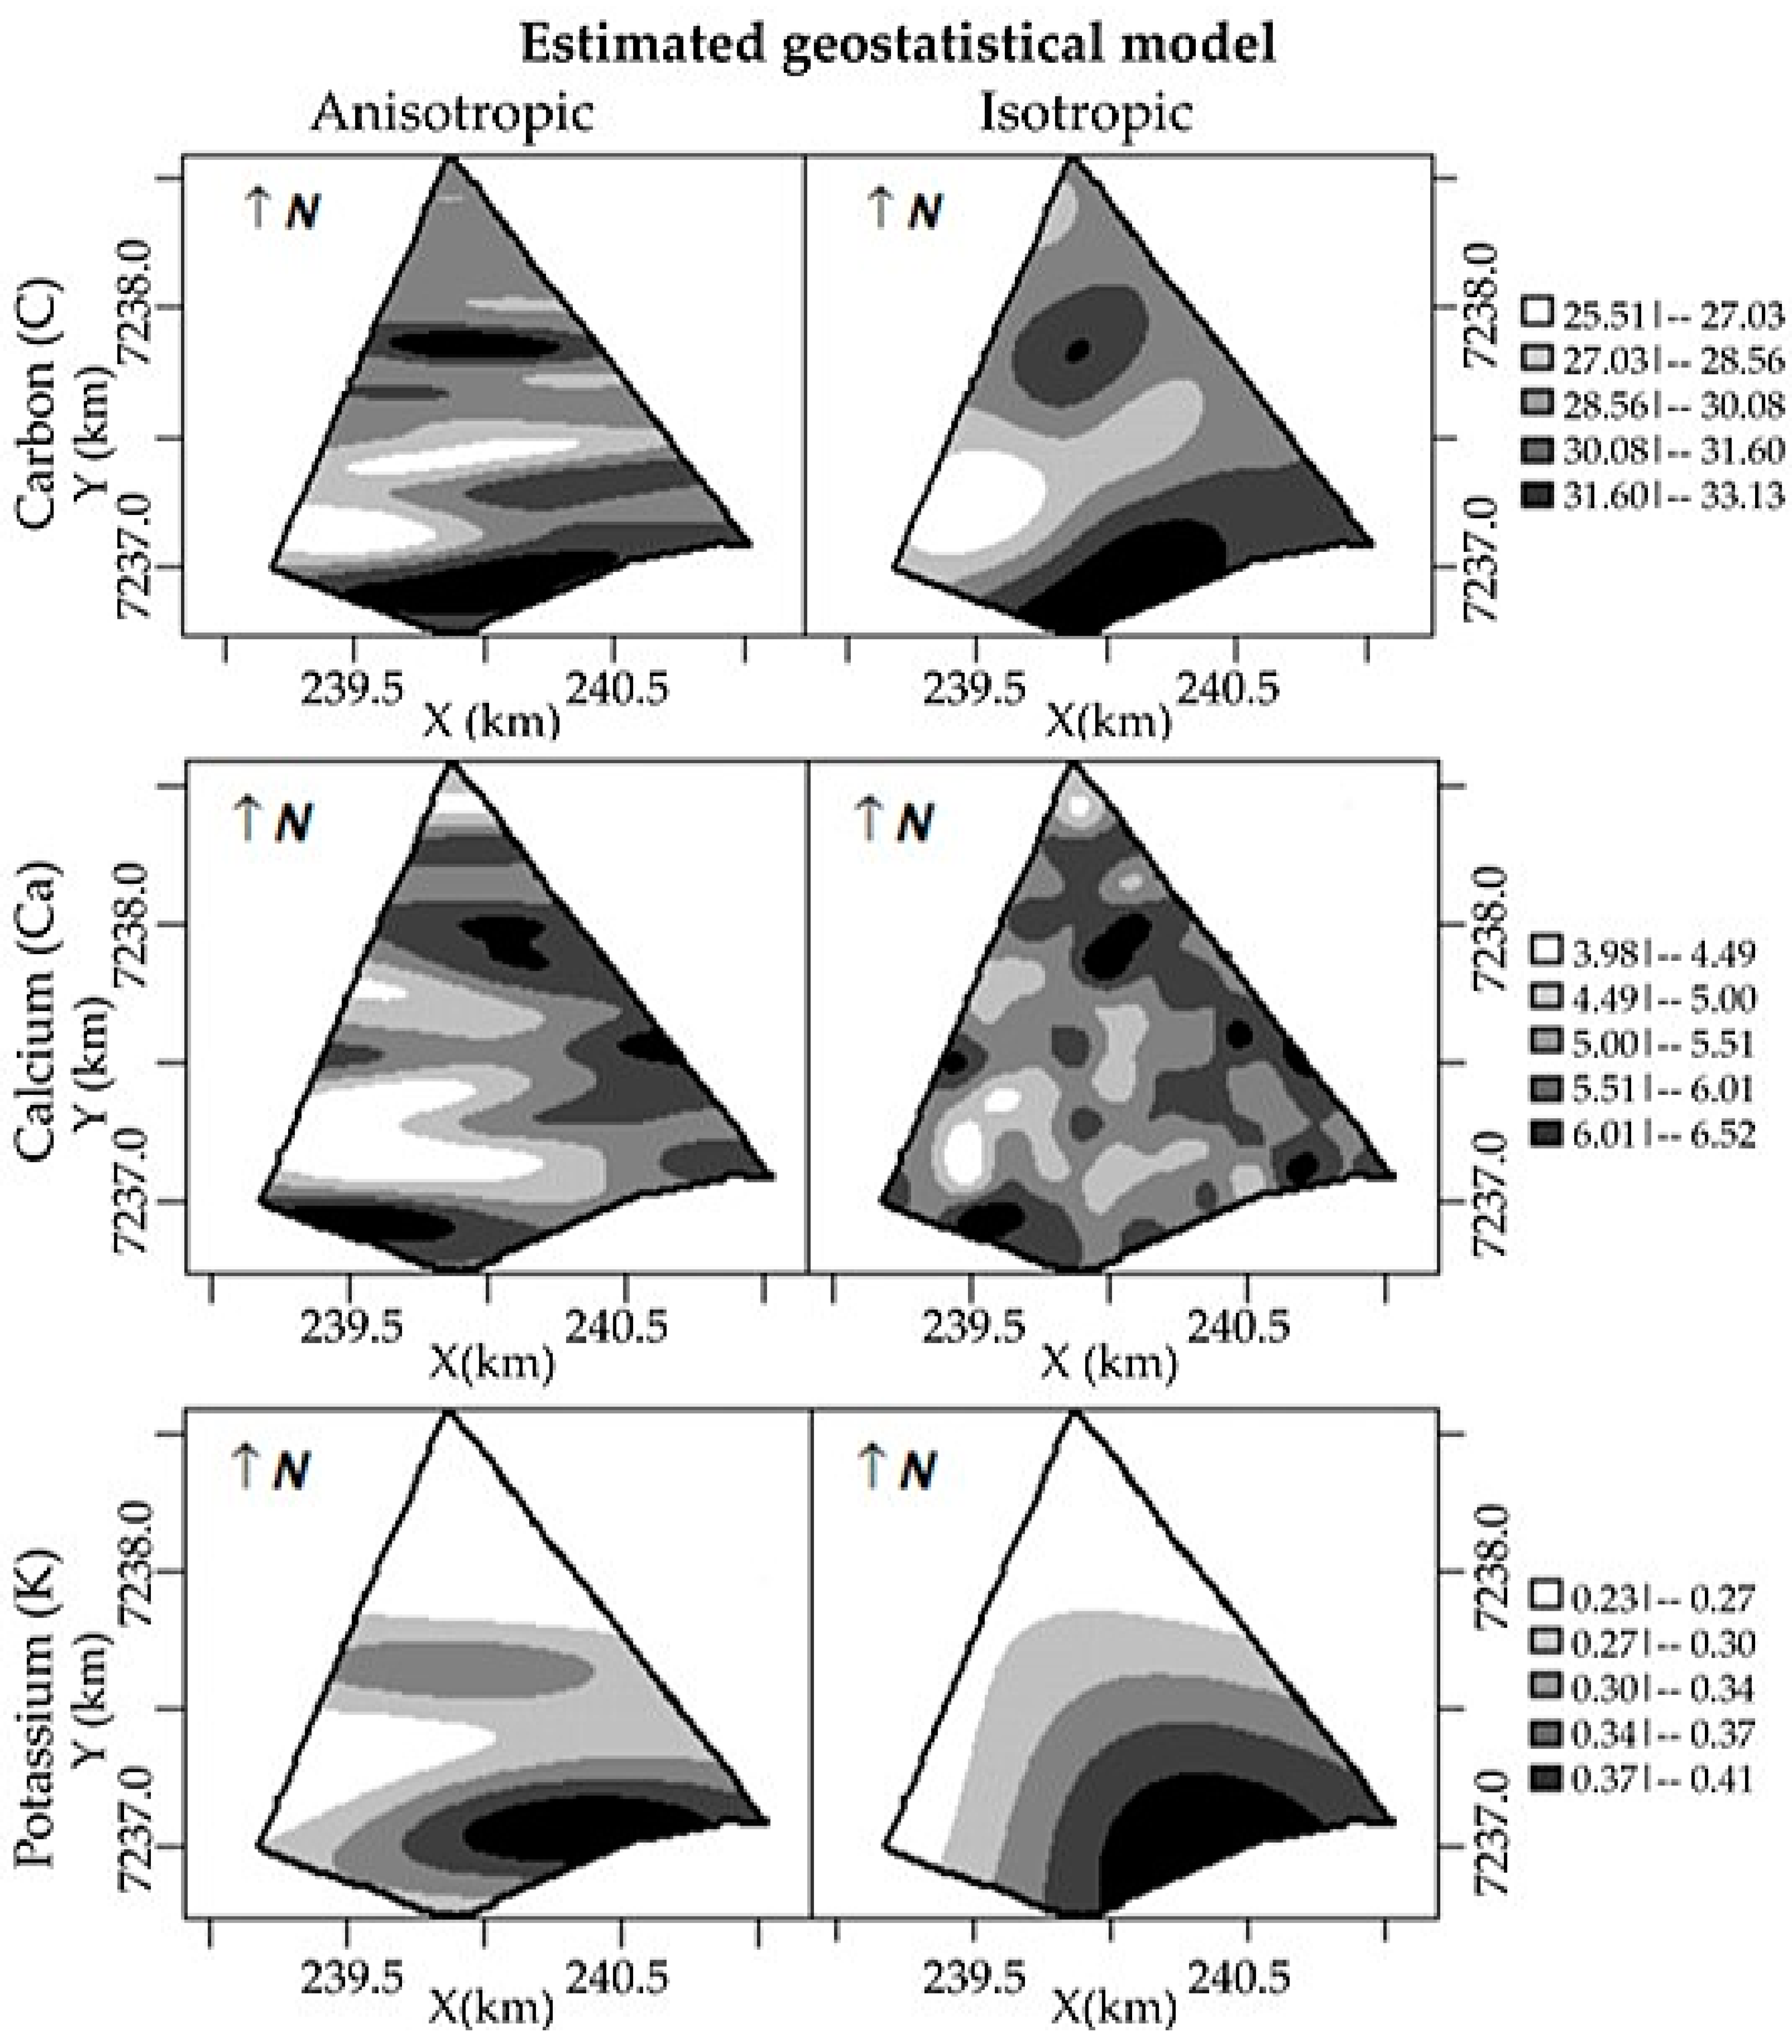
3.2. Soil Chemical Property Study
4. Discussion
5. Conclusions
Author Contributions
Funding
Institutional Review Board Statement
Informed Consent Statement
Data Availability Statement
Acknowledgments
Conflicts of Interest
Abbreviations
| AIC | Akaike information |
| BIC | Bayesian information |
| C | Carbon |
| Ca | Calcium |
| CV | Coefficient of variation |
| Fa | Anisotropic ratio |
| GNSS | GeoExplorer, Trimble Navigation Limited, Sunnyvale |
| K | Potossium |
| Kappa | |
| Overall accuracy | |
| Pearson’s linear correlation coefficient between the soil chemical properties and the x and y coordinates | |
| SDI | spatial dependence index |
| Tau | |
| UTM | Universal Transverse Mercator |
References
- Cressie, N.A.C. Statistics for Spatial Data; John Wiley & Sons: New York, NY, USA, 2015. [Google Scholar]
- De Bastiani, F.; Cysneiros, A.F.J.; Cysneiros, A.H.M.; Uribe-Opazo, M.A.; Galea, M. Infuence diagnostics in elliptical spatial linear models. Test 2015, 24, 322–340. [Google Scholar] [CrossRef]
- Uribe-Opazo, M.A.; De Bastiani, F.; Galea, M.; Schemmer, R.C.; Assumpção, R.A. Influence diagnostics on a reparameterized t-Student spatial linear model. Spat. Stat. 2021, 41, 100481. [Google Scholar] [CrossRef]
- Uribe-Opazo, M.A.; Dalposso, G.H.; Galea, M.; Johann, J.A.; De Bastiani, F.; Moyano, E.N.C.; Grzegozewski, D. Spatial variability of wheat yield using the Gaussian spatial linear model. Aust. J. Crop Sci. 2023, 17, 179–189. [Google Scholar] [CrossRef]
- Guedes, L.P.C.; Uribe-Opazo, M.A.; Ribeiro, P.J., Jr. Influence of incorporating geometric anisotropy on the construction of thematic maps of simulated data and chemical attributes of soil. Chil. J. Agric. Res. 2013, 73, 414–423. [Google Scholar] [CrossRef]
- Guan, Y.; Sherman, M.; Calvin, J.A. A nonparametric test for spatial isotropy using subsampling. J. Am. Stat. Assoc. 2004, 99, 810–821. [Google Scholar] [CrossRef]
- Guedes, L.P.C.; Uribe-Opazo, M.A.; Johann, J.A.; Souza, E.G. Anisotropia no estudo da variabilidade espacial de algumas variáveis químicas do solo. Rev. Bras. Ciênc. Solo 2008, 7, 2217–2226. [Google Scholar] [CrossRef]
- Facas, N.W.; Mooney, M.A.; Asce, M.; Furrer, R. Anisotropy in the spatial distribution of roller-measured soil stiffness. Int. J. Geomech. 2010, 10, 129–135. [Google Scholar] [CrossRef]
- Guedes, L.P.C.; Uribe-Opazo, M.A.; Ribeiro, P.J., Jr.; Dalposso, G.H. Relationship between sample design and geometric anisotropy in the preparation of thematic maps of chemical soil atributes. Eng. Agríc. 2018, 38, 260–269. [Google Scholar] [CrossRef]
- Mardia, K.V.; Marshall, R.J. Maximum likelihood models for residual covariance in special regression. Biometrika 1984, 71, 319–332. [Google Scholar] [CrossRef]
- Uribe-Opazo, M.A.; Borssoi, J.A.; Galea, M. Influence diagnostics in Gaussian spatial linear models. J. Appl. Stat. 2012, 39, 615–630. [Google Scholar] [CrossRef]
- Chipeta, M.G.; Terlouw, D.J.; Phiri, K.S.; Diggle, P.J. Inhibitory geostatistical designs for spatial prediction taking account of uncertain covariance structure. Environmetrics 2017, 28, e2425. [Google Scholar] [CrossRef]
- Rosenberg, M.S. The bearing correlogram: A new method of analyzing directional spatial autocorrelation. Geogr. Anal. 2000, 32, 267–278. [Google Scholar] [CrossRef]
- De Araújo, E.C.; Uribe-Opazo, M.A.; Johann, J.A. Modelo de regressão espacial para estimativa da produtividade da soja associada a variáveis agrometeorológicas na região oeste do estado do Paraná. Eng. Agríc. 2014, 34, 286–299. [Google Scholar] [CrossRef][Green Version]
- Maltauro, T.C.; Guedes, L.P.C.; Uribe-Opazo, M.A.; Canton, L.E.D. Spatial multivariate optimization for a sampling redesign with a reduced sample size of soil chemical properties. Rev. Bras. Cienc. Solo 2023, 47, e0220072. [Google Scholar] [CrossRef]
- Walkley, A.; Black, I.A. An examination of the Degtjareff method for determining soil organic matter and a proposed modification of the chromic acid titration method. Soil Sci. 1934, 37, 29–38. [Google Scholar] [CrossRef]
- Callegari-Jacques, S.M. Bioestatística: Princípios e Aplicações; Artmed: Porto Alegre, Brazil, 2003. [Google Scholar]
- Neto, E.A.; Seidel, E.J.; Oliveira, M.S. Geostatistical-based index for spatial variability in soil properties. Rev. Bras. Cienc. Solo 2020, 44, e0200086. [Google Scholar]
- Anderson, J.R.; Hardy, E.E.; Roach, J.T.; Witmer, R.E. A Land Use and Land Cover Classification System for Use with Remote Sensor Data; U.S. Government Print Office: Washington, DC, USA, 2001.
- Krippendorff, K. Content Analysis: An Introduction to Its Methodology, 2nd ed.; Sage Publications: Beverly Hills, CA, USA, 2013. [Google Scholar]
- Ribeiro, P.J., Jr.; Diggle, P.J. geoR: A package for geostatistical analysis. R-NEWS 2016, 1, 15–18. [Google Scholar]
- R Development Core Team. R: A Language and Environment for Statistical Computing; R Foundation for Statistical Computing: Vienna, Austria, 2023; Available online: https://www.r-project.org/ (accessed on 1 March 2020).
- Costa, J.M.; Oliveira, E.F. Fertilidade do Solo e Nutrição de Plantas; COAMO: Campo Mourão, Brazil, 2001. [Google Scholar]
- Pimentel Gomes, F. Curso de Estatística Experimental, 12th ed.; Nobel: São Paulo, Brazil, 1985. [Google Scholar]
- Akaike, H. Information theory and the maximum likelihood principle. In International Symposium on Information Theory, 2nd ed.; Petrov, B.N., Csäki, F., Eds.; Akademiai Kiàdo: Budapest, Hungary, 1973. [Google Scholar]
- Faraco, M.A.; Uribe-Opazo, M.A.; Silva, E.A.A.; Johann, J.A.; Borssoi, J.A. Seleção de modelos de variabilidade espacial para elaboração de mapas temáticos de atributos físicos do solo e produtividade da soja. Rev. Bras. Ciênc. Solo 2008, 32, 463–476. [Google Scholar] [CrossRef]
- Diggle, P.J.; Ribeiro, P.J., Jr. Model Based Geostatistics; Springer: New York, NY, USA, 2007. [Google Scholar]
- Griffith, D.A. Spatial autocorrelation and eigenfunctions of the geographic weights matrix accompanying geo-referenced data. Can. Geogr. 1996, 40, 351–367. [Google Scholar] [CrossRef]
- Oden, N.L.; Sokal, R.R. Directional autocorrelation: An extension of spatial correlograms to two dimensions. Syst. Zool. 1986, 35, 608–617. [Google Scholar] [CrossRef]
- De Deus Afonseca, B.; Costa, J.F.C. Dynamic anisotropy and non-linear geostatistics supporting short term modelling of structurally complex gold mineralization. Geosciences 2021, 74, 199–207. [Google Scholar] [CrossRef]
- Richetti, J.; Uribe-Opazo, M.A.; de Bastiani, F.; Johann, J.A. Técnicas para detecção de pontos influentes em variáveis contínuas regionalizadas. Eng. Agríc. 2016, 36, 152–165. [Google Scholar] [CrossRef]


| Anisotropic Ratio (Fa) | Direction (θ) | Percentage | ||||
|---|---|---|---|---|---|---|
| Distance Class (d) | ||||||
| 0.15 | 0.30 | 0.45 | 0.60 | 0.75 | ||
| Fa = 1 (isotropic) | 0° | 100 | 100 | 95 | 82 | 60 |
| 90° | 100 | 100 | 92 | 83 | 56 | |
| Fa = 2 | 0° | 100 | 99 | 82 | 57 | 37 |
| 90° | 100 | 100 | 98 | 96 | 84 | |
| Fa = 3 | 0° | 100 | 95 | 70 | 42 | 25 |
| 90° | 100 | 100 | 100 | 99 | 95 | |
| Fa = 4 | 0° | 100 | 90 | 59 | 39 | 19 |
| 90° | 100 | 100 | 100 | 100 | 98 | |
| Statistic | Carbon (C) | Calcium (Ca) | Potassium (K) |
|---|---|---|---|
| Average | 29.42 | 5.39 | 0.30 |
| Minimum | 22.40 | 2.25 | 0.10 |
| Median | 29.33 | 5.32 | 0.26 |
| Maximum | 45.22 | 8.76 | 0.67 |
| Coefficient of variation (CV) (%) | 12.67 | 25.18 | 45.04 |
| r(x) | 0.23 | 0.22 | 0.18 |
| Confidence interval (x) | [0.037; 0.406] | [0.029; 0.399] | [−0.013; 0.363] |
| p-value | 0.019 * | 0.024 * | 0.067 ns |
| r(y) | −0.11 | 0.03 | −0.26 |
| Confidence interval (y) | [−0.303; 0.081] | [−0.164; 0.224] | [−0.437; −0.075] |
| p-value | 0.247 ns | 0.756 ns | 0.006 * |
| Soil Chemical Property | + | |||||||
|---|---|---|---|---|---|---|---|---|
| Carbon (C) | 29.443 | 9.027 | 4.497 | 13.524 | 86.425 | 6.078 | 149.575 | 5.80% |
| Calcium (Ca) | 5.388 | 1.401 | 0.390 | 1.791 | 101.671 | 4.550 | 175.962 | 7.86% |
| Potassium (K) | 0.292 | 0.015 | 0.003 | 0.018 | 214.878 | 3.754 | 371.890 | 17.70% |
| Soil Chemical Property | Overall Accuracy () | Kappa () | Tau () |
|---|---|---|---|
| Carbon | 0.51 | 0.31 | 0.38 |
| Calcium | 0.58 | 0.38 | 0.47 |
| Potassium | 0.48 | 0.32 | 0.36 |
| d | θ | Carbon (C) | Calcium (Ca) | Potassium (K) | |||
|---|---|---|---|---|---|---|---|
| Isotropic Model | Anisotropic Model | Isotropic Model | Anisotropic Model | Isotropic Model | Anisotropic Model | ||
| 150 | 0° | 0.896 * | 0.538 * | 0.531 * | 0.607 * | 0.963 * | 0.838 * |
| 90° | 0.942 * | 0.838 * | 0.629 * | 0.864 * | 0.972 * | 0.945 * | |
| 300 | 0° | 0.657 * | 0.257 * | 0.168 * | 0.248 * | 0.869 * | 0.538 * |
| 90° | 0.781 * | 0.591 * | 0.320 * | 0.605 * | 0.899 * | 0.799 * | |
| 450 | 0° | 0.346 * | 0.091 * | 0.061 * | 0.093 * | 0.715 * | 0.275 * |
| 90° | 0.537 * | 0.404 * | 0.192 * | 0.404 * | 0.784 * | 0.621 * | |
| 600 | 0° | 0.121 * | −0.042 | 0.040 * | 0.042 * | 0.542 * | 0.186 * |
| 90° | 0.327 * | 0.267 * | 0.136 * | 0.277 * | 0.661 * | 0.498 * | |
| 750 | 0° | 0.008 | −0.096 * | 0.029 * | 0.023 * | 0.359 * | 0.147 * |
| 90° | 0.168 * | 0.158 * | 0.089 * | 0.180 * | 0.526 * | 0.390 * | |
Disclaimer/Publisher’s Note: The statements, opinions and data contained in all publications are solely those of the individual author(s) and contributor(s) and not of MDPI and/or the editor(s). MDPI and/or the editor(s) disclaim responsibility for any injury to people or property resulting from any ideas, methods, instructions or products referred to in the content. |
© 2024 by the authors. Licensee MDPI, Basel, Switzerland. This article is an open access article distributed under the terms and conditions of the Creative Commons Attribution (CC BY) license (https://creativecommons.org/licenses/by/4.0/).
Share and Cite
Ribeiro, D.L.; Maltauro, T.C.; Guedes, L.P.C.; Uribe-Opazo, M.A.; Dalposso, G.H. Directional Differences in Thematic Maps of Soil Chemical Attributes with Geometric Anisotropy. Stats 2024, 7, 65-78. https://doi.org/10.3390/stats7010005
Ribeiro DL, Maltauro TC, Guedes LPC, Uribe-Opazo MA, Dalposso GH. Directional Differences in Thematic Maps of Soil Chemical Attributes with Geometric Anisotropy. Stats. 2024; 7(1):65-78. https://doi.org/10.3390/stats7010005
Chicago/Turabian StyleRibeiro, Dyogo Lesniewski, Tamara Cantú Maltauro, Luciana Pagliosa Carvalho Guedes, Miguel Angel Uribe-Opazo, and Gustavo Henrique Dalposso. 2024. "Directional Differences in Thematic Maps of Soil Chemical Attributes with Geometric Anisotropy" Stats 7, no. 1: 65-78. https://doi.org/10.3390/stats7010005
APA StyleRibeiro, D. L., Maltauro, T. C., Guedes, L. P. C., Uribe-Opazo, M. A., & Dalposso, G. H. (2024). Directional Differences in Thematic Maps of Soil Chemical Attributes with Geometric Anisotropy. Stats, 7(1), 65-78. https://doi.org/10.3390/stats7010005


