Article

Mechanical Characterization of Hybrid Steel Wire Mesh/Basalt/Epoxy Fiber-Reinforced Polymer Composite Laminates

by
Mohamad Yusuf Bin Salim
1,2,
Ali Farokhi Nejad
1,2,
Mohd Yazid Yahya
1,2,*,
Tobias Dickhut
3 and
Seyed Saeid Rahimian Koloor
3,*
1
Faculty of Mechanical Engineering, Universiti Teknologi Malaysia, Johor Bahru 81310, Malaysia
2
Centre for Advanced Composite Materials, Universiti Teknologi Malaysia, Johor Bahru 81310, Malaysia
3
Institute of Aeronautical Engineering, Faculty of Mechanical Engineering, Universität der Bundeswehr München, Werner-Heisenberg-Weg 39, 85579 Neubiberg, Munich, Germany
*
Authors to whom correspondence should be addressed.
J. Compos. Sci. 2024, 8(5), 184; https://doi.org/10.3390/jcs8050184
Submission received: 28 March 2024 / Revised: 28 April 2024 / Accepted: 9 May 2024 / Published: 15 May 2024
(This article belongs to the Special Issue Hybrid Metal Matrix Composites)

Abstract

:
Hybrid composite materials have been widely used to advance the mechanical responses of fiber-reinforced composites by utilizing different types of fibers and fillers in a single polymeric matrix. This study incorporated three types of fibers: basalt woven fiber and steel (AISI304) wire meshes with densities of 100 and 200. These fibers were mixed with epoxy resin to generate plain composite laminates. Three fundamental mechanical tests (tensile, compression, and shear) were conducted according to the corresponding ASTM standards to characterize the steel wire mesh/basalt/epoxy FRP composites used as plain composite laminates. To investigate the flexural behavior of the hybrid laminates, various layer configurations and thickness ratios were examined using a design of experiments (DoE) matrix. Hybrid samples were chosen for flexural testing, and the same procedure was employed to develop a finite element (FE) model. Material properties from the initial mechanical testing procedure were integrated into plain and hybrid composite laminate simulations. The second FE model simulated the behavior of hybrid laminates under flexural loading; this was validated through experimental data. The results underwent statistical analysis, highlighting the optimal configuration of hybrid composite laminates in terms of flexural strength and modulus; we found an increase of up to 25% in comparison with the plain composites. This research provides insights into the potential improvements offered by hybrid composite laminates, generating numerical models for predicting various laminate configurations produced using hybrid steel wire mesh/basalt/epoxy FRP composites.

1. Introduction

The demand for metallic and synthetic materials in the automotive industry has grown in recent years, leading to resource reduction for future use. Many industries struggle to substitute non-sustainable materials with appropriate alternatives. Industries are prioritizing alternative sustainable materials due to the recycling of waste products and concerns about carbon footprint. Organizations are researching sustainable materials like metal matrices and glass fibers, derived from green plants, due to the demand for alternative materials. The potential of sustainable materials is being examined using mechanical approaches. In the past decade, sustainable and recyclable materials such as composite fibers or fillers have been increasingly used. Natural fibers are a viable substitute for a range of uses, including packaging and automotive applications. The potential of these sustainable materials is mostly evaluated using mechanical methods. Natural-fiber-reinforced sustainable composites are becoming popular because of their plentiful availability; however, in comparison with synthetic materials, their mechanical properties are not competitive. The variety of mechanical properties in natural fibers is the second disadvantage of using these materials as composite fibers [1]. Composite materials are in high demand due to their cost-effectiveness and other advantageous aspects in commercial markets. Natural fibers require 60% less energy to produce than glass fibers [2]. It can be said that, although natural fibers are not as strong as synthetic fibers, the final price of a product made from sustainable materials is much more economical. Therefore, in applications with where high-load-bearing capacity is not a priority, using sustainable materials is a good choice, allowing cheap, lightweight, and recyclable composite structures to be made. Many automobile and aerospace companies have shifted from using steel to using aluminum, and then they have progressed to using composites. The use of natural fibers, increasing due to their higher efficiency, has reduced the use of traditional materials by 15%. Composites have a superior density in comparison with synthetic materials. This benefit has prompted the electrical industry to capitalize on the chance of decreasing the total weight of products, including batteries.
Fiber-reinforced polymer (FRP) composites have been extensively studied and used in civil engineering and the construction, aerospace, military, and automotive industries for decades [3]. The extensive use of FRP composites is a result of their outstanding strength, resistance to corrosion, and comparatively low weight [4,5,6]. These composites are usually made by combining fibers, such as carbon and glass, as the main strengthening elements, along with matrices like thermoplastics and thermosetting mechanisms for bonding [7,8]. FRP composites are frequently used in external retrofit materials to improve the strength of existing concrete structures [9]. However, a significant disadvantage of FRP materials is in their bonding defects and adhesive joining. The variations in short-term and long-term material properties such as stiffness, creep, and thermal expansion between FRP materials and the substrate matrix lead to this issue [10,11]. Furthermore, FRP composites are brittle upon failure [10]. Recent improvements have produced hybrid composites to address these drawbacks, incorporating numerous additives such as different fiber types, metal alloys, and metallic wire meshes [12,13].
Numerous experimental studies have investigated the mechanical characteristics of these hybrid composite specimens [14,15,16]. Subagia and Kim [17] combined basalt fiber layers with carbon fiber layers to study the tensile properties of the composite materials. Their findings showed that a greater number of basalt fiber layers resulted in increased tensile strain in a carbon–basalt FRP. Composites containing basalt fibers in the outer layers showed greater tensile strength compared to those with basalt fibers in the interior layers. Kaleemulla and Siddeswarappa [18] studied the mechanical characteristics of hybrid composites made of plain-woven glass and textile satin fibers combined with an epoxy matrix. Increasing the glass fiber content substantially enhanced the tensile and compressive strengths of the hybrid composites. Utilizing a fiber orientation of (0/90) resulted in significantly higher tensile and compressive strengths compared to a fiber orientation of 45. Carrillo and Cantwell [19] investigated the mechanical characteristics of fiber–metal laminate (FML) composites, which are made up of alternating thin layers of aluminum alloy and a polypropylene-fiber-reinforced polypropylene composite (SRPP), subjected to tensile and flexural loading. The tensile test findings showed that FML composites had greater tensile strength than SRPP. The strain at failure of FML composites with aluminum layers orientated at 45 degrees was notably higher than that of standard aluminum alloy. Yet, the orientation of the aluminum alloy had minimal impact on the flexural characteristics of the FML hybrid composites [20]. Recent research has examined the mechanical characteristics of hybrid composites that combine steel wire mesh and fibers [21,22,23,24].
Steel wire mesh may experience difficulties in adhesive bonding at contact with fibers, unlike solid metal reinforcements like thin sheets or metal foils. Prior research has demonstrated that both thermoplastic and thermoset materials can be used as adhesives to produce hybrid composites with exposed metallic reinforcements, such as steel wire mesh. Composites that incorporate both carbon fiber textiles and steel wire mesh have shown improved stiffness, strength, and ductility when compared to carbon-fiber-reinforced polymer (CFRP) composites that do not include steel wire mesh [21]. Furthermore, research by Pazhanivel et al. [25] found that positioning the steel wire meshes in the center of the specimen increased flexural strength and stiffness; meanwhile, having the steel wire meshes placed closer together enhanced tensile strength. Another study by Karunagaran and Rajadurai [26] showed that surface treatment greatly improved the tensile strength, flexural strength, and inter-laminar shear strength of hybrid composites when compared to untreated ones. The enhancement was credited to improved bonding at the interface due to surface treatment between the glass fiber and the steel wire mesh. The study explored how three types of stainless-steel wire meshes (coarse, intermediate, and fine mesh) and two carbon fiber orientations (0 and 45 degrees) affected the tensile properties of hybrid composites made of carbon fiber and steel wire mesh. The hybrid composites were constructed using a manual-layup technique, incorporating three layers of steel wire mesh (1, 2, and 4), alternated with four layers of carbon fiber (2, 3, 4, and 6), bonded together with epoxy resin. The tensile characteristics were assessed based on initial stiffness, peak load, and ultimate strain. An analytical model was created to predict the load–displacement response curves for hybrid composites reinforced with carbon fiber–steel wire mesh and polymer. The tensile properties were evaluated in terms of initial stiffness, peak load, and ultimate strain, and an analytical model was developed to predict the load–strain response curves for carbon fiber–steel-wire-mesh-reinforced polymer hybrid composites.
Although some research was carried out on a hybrid metallic wire mesh–polymer composite, less attention has been paid to the mechanical characteristics of hybrid laminates made by steel wire mesh and polymer-reinforced composite laminates. Moreover, the effect of layer stacking and configuration in finding the optimum mechanical response for this kind of hybrid laminate has not been sufficiently discussed. In this study, three types of fibers, namely basalt woven fiber and steel (AISI304) wire meshes with densities 100 and 200, were combined with epoxy resin to create plain composite laminates. Three primary mechanical tests (tensile, compression, and shear tests) based on the relative ASTM standards were carried out and the material characterization of the steel wire mesh/basalt/epoxy FRP composites was determined for their use as plain composite laminates. For the investigation of the flexural behavior of hybrid laminates, different layer configurations and thickness rations were considered based on a matrix of the design of experiments (DoE). The elastic and failure behaviors of plain laminates were used for numerical simulation. The results of mechanical testing and flexural testing were used to validate the FE model for future studies. The outcome of this study can be used to develop numerical models for the prediction of different laminate designs made by hybrid steel wire mesh/basalt/epoxy FRP composites.

2. Experimental Procedure

2.1. Materials

In this research, two different fiber materials were used, including basalt and stainless-steel (AISI 304) wire mesh. Two types of stainless-steel wire mesh were incorporated, featuring mesh densities of 100 and 200 cells per one-centimeter square. The geometrical properties of the wire mesh, as specified by the manufacturer, can be found in Table 1.
Figure 1 shows the physical condition of the basalt fabric and the stainless-steel wire mesh utilized in this study. The basalt fabric employed was a plain weave fabric with an average weight of 200 g/m2. The purpose is to identify the performance of plain basalt–stainless-steel wire mesh composites as well as hybridization of basalt and stainless-steel composites through mechanical and flexural testing. To identify the potential of hybrid basalt–stainless-steel wire meshes, different types of hybrid composites with different combinations of configurations and thickness ratios were implemented during the preparation of the specimens.
The resin that was selected to be the matrix for this study was DER 331, a thermoset epoxy matrix, in combination with Jointmine 903 hardener. The epoxy-to-hardener weight ratio was set at 10:6 according to the manufacturer’s specifications. Table 2 provides the properties associated with the resin and its hardener.

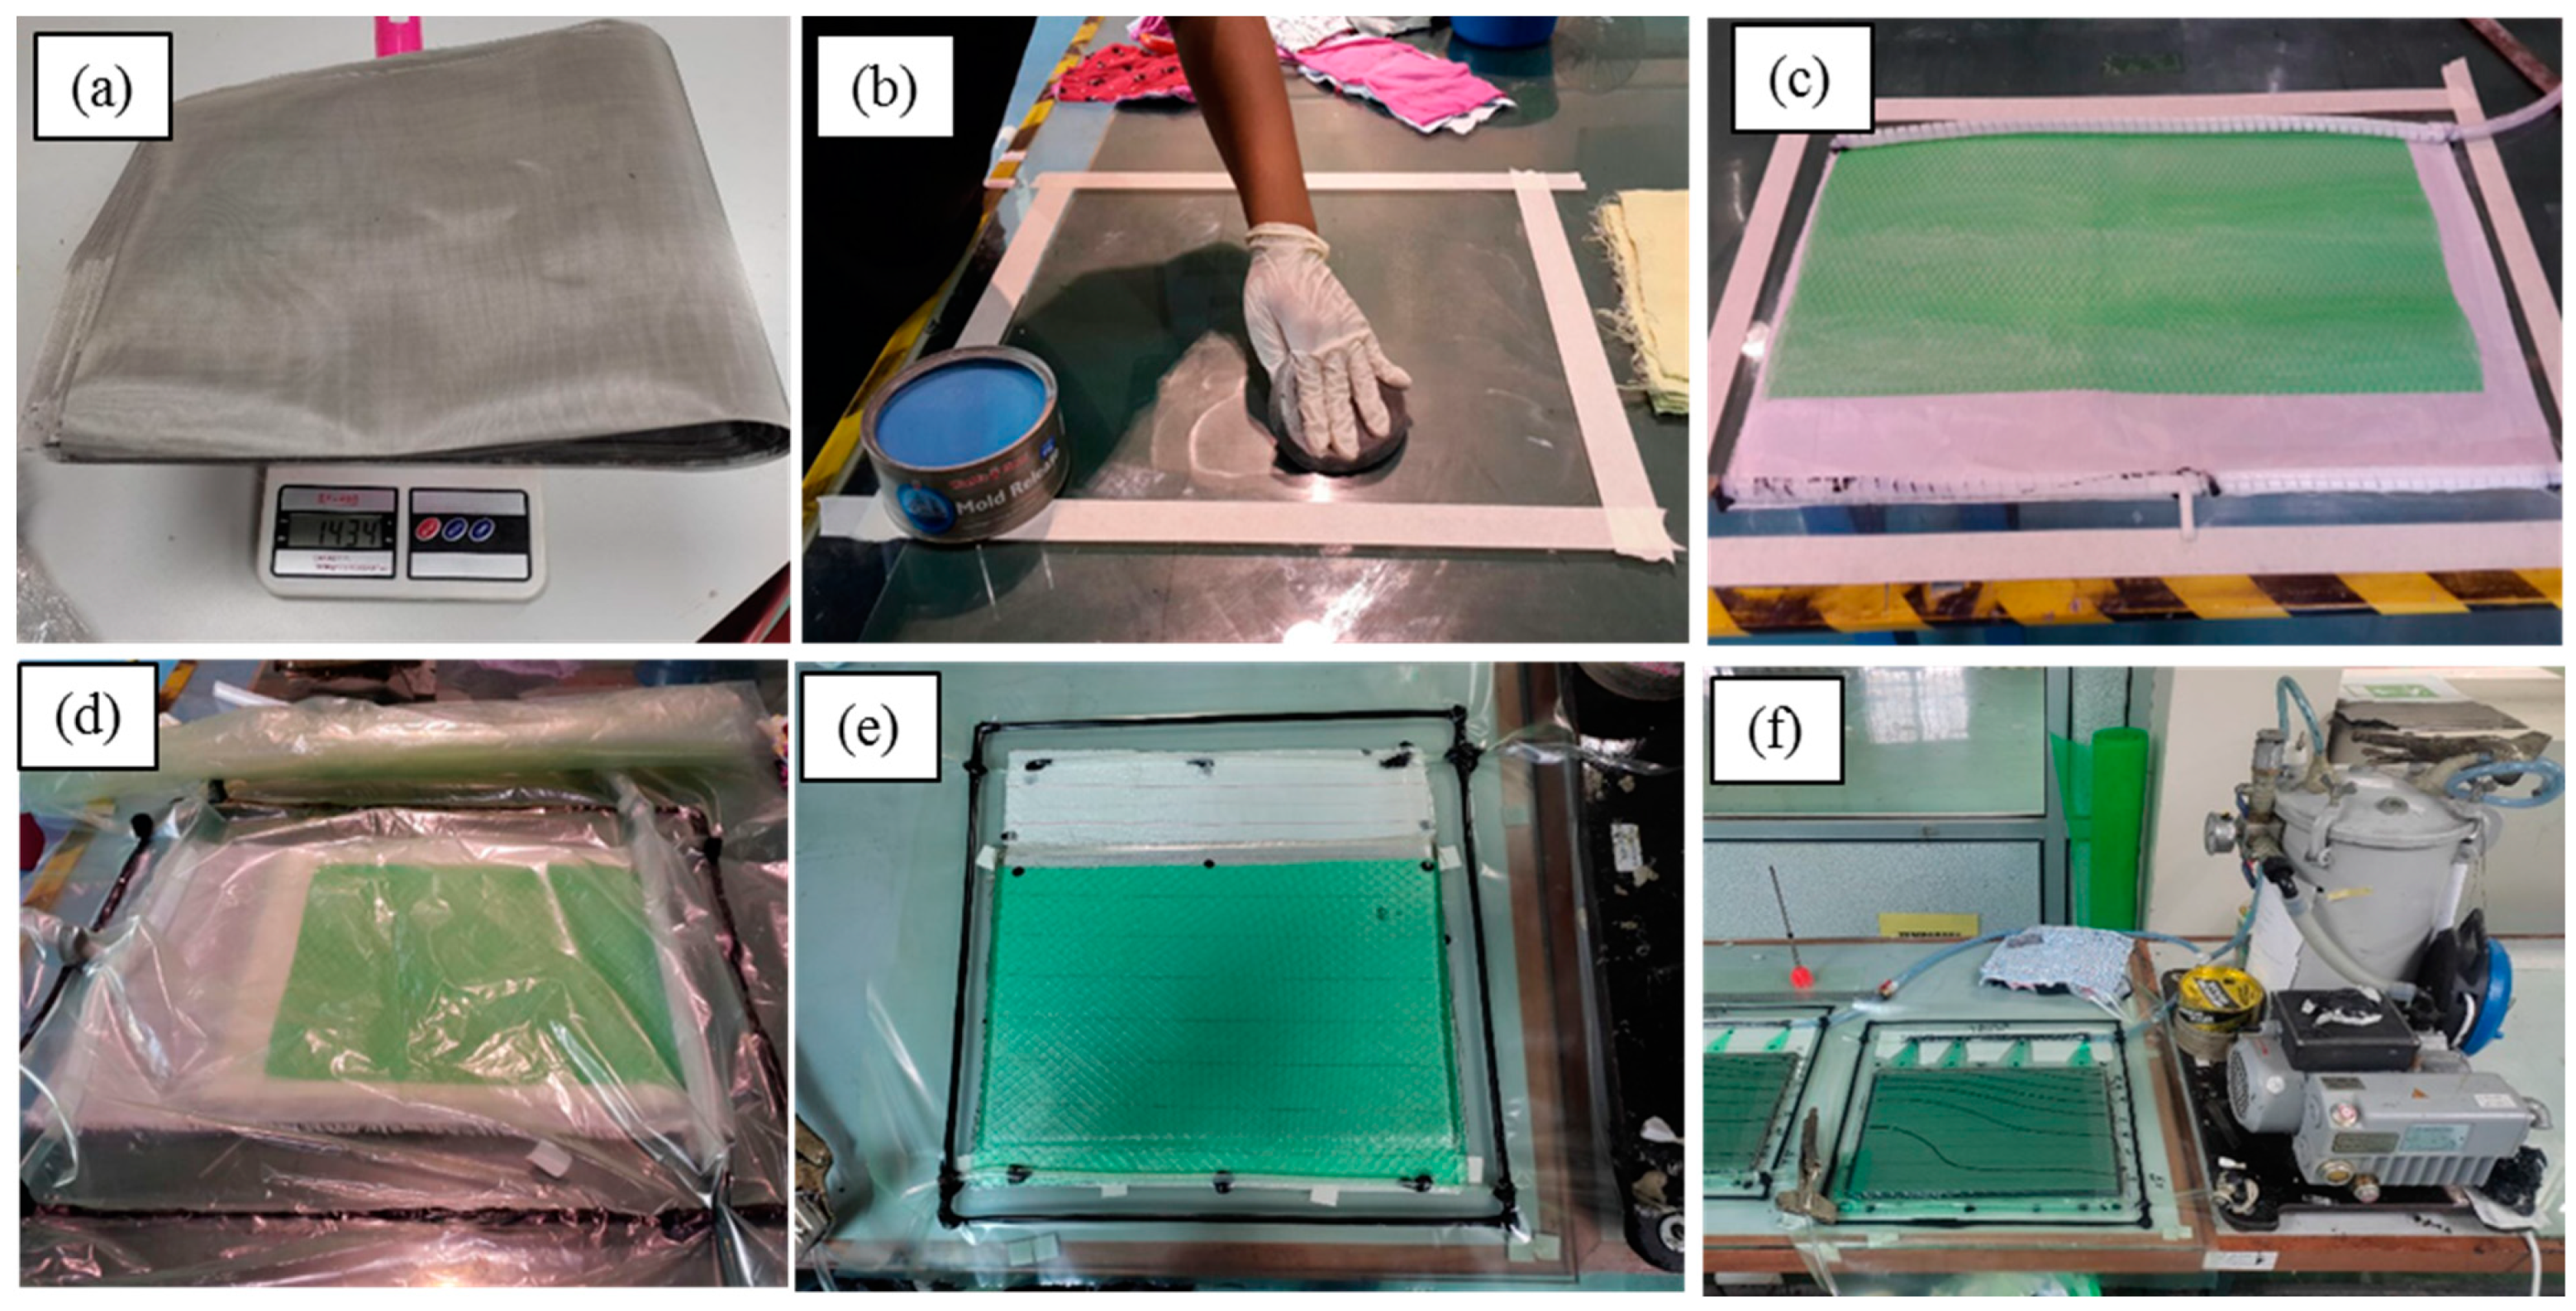
2.2. Specimen Fabrication

In the present study, the test samples comprising two types of composite laminates were fabricated: plain composites (non-hybrid); hybrid inter-ply composites. The composite plates were created through the vacuum infusion process (VIP) to ensure an even distribution of resin. For the plain composite category, three primary materials were employed: basalt fabric (B), wire mesh with a density of 100 (WM100), and wire mesh with a density of 200 (WM200). These materials were chosen to examine the mechanical properties of the plain composite category. In the case of hybrid laminate composites, a combination of various parameters was used to formulate these composites. Four distinct stacking sequences for the inter-ply composites were investigated, identified as stacking sequences A (B/WM/B), B (WM/B/WM/B), C (B/WM/B/WM), and D (WM/B/WM). Figure 2 illustrates the stacking sequences employed in this research.
Additionally, three different hybrid thickness ratios were explored: 50:50, 70:30, and 90:10. These ratios represent the total percentage thickness of basalt to the total percentage of the wire mesh in the composites while maintaining the same overall thickness of the composites for comparison purposes. Figure 3 shows a visual representation of the hybrid thickness ratio for stacking sequence A. This approach resulted in a total of 24 configurations for the hybrid composites, each with its own unique combination of stacking sequence, thickness ratio, and wire mesh density.
To achieve a composite thickness of 4 mm, the fibers need to be cut based on the thickness specifications for each layer. In the case of plain basalt, this includes 24 layers, while WM100 and WM200 require 20 and 38 layers, respectively. All prepared layers before and after the laminate fabrication process were weighed to ascertain the theoretical fiber volume fraction [27].
The manufacturing process begins by preparing a mold that matches the size and shape of the specimen. In this instance, a flat, smooth glass surface serves as the mold’s lower surface; this was thoroughly cleaned using acetone to remove any impurities. Following this, the working area’s perimeter was masked, extending at least 30 mm beyond the specimen’s cut size. To facilitate the subsequent peel-off process, up to three layers of wax-based release agents were applied within the working area. Any excess wax was then removed. The materials were organized based on the specified composite design. For example, in the hybrid laminate composite 1A90 configuration, the arrangement included 11 layers of basalt, followed by 2 layers of wire mesh with a density of 100, and concluding with 11 layers of basalt. Detailed information regarding the layer counts for each specimen configuration, along with their corresponding fiber volume fraction percentages, can be found in Table 3.
The vacuum infusion process is initiated and then set to a vacuum state for 15 min to verify the absence of any leaks in the system before moving to the resin infusion phase. Once the vacuum pump is activated, the laminate is subjected to vacuum pressure, drawing the resin through the inlet tubing to disperse within the laminate. Typically, curing takes approximately 24 h, with an additional five days allocated for post-curing. The preparation procedure is summarized in Figure 4.

2.3. Material Characterization Process

Mechanical tests play a fundamental role in characterizing the structural behavior of materials, offering crucial insights into their responses to tensile, compressive, shear, and flexural forces. The consistent application of standardized testing procedures ensures the reliability and comparability of the obtained results. The subsequent sections detail the testing procedures for tensile, compression, shear, and three-point bending flexural tests. Figure 5 shows the methodology of this research as a research flowchart.
After preparing samples of plain laminates and hybrid laminates based on a design of experiments (DOE) matrix, the test samples underwent cutting with a diamond saw, adhering to ASTM standards for each test sample’s dimensions. Hybrid samples were specifically utilized for flexural testing, and the same testing procedure was applied to generate a finite element (FE) model [6]. Material properties, obtained from mechanical testing, were incorporated for modeling plain and hybrid composite laminate simulations. The second FE model was employed to simulate hybrid laminates under flexural loading, and the results were used for model validation against the experimental data. Finally, the results underwent statistical analysis, highlighting the optimal configuration of the hybrid composite laminates in terms of two mechanical responses: flexural strength and flexural modulus.

2.3.1. Tensile Test

The tensile test, an essential mechanical assessment, plays a crucial role in evaluating a material’s ability to withstand axial loads and deform under tensile stress. Using ASTM D3039, each sample underwent particular preparation and testing procedures [28]. The dimensions of the specimens were fixed at 250 mm × 25 mm × 4 mm, and a minimum of five specimens were thoughtfully prepared for each sample, promoting statistical robustness. To prepare the tensile samples, they were securely affixed with glass/epoxy composite tabs, incorporating a 2 mm thickness, at both surface ends. The experimental setup is shown in Figure 6a. The specimens were firmly attached using Araldite epoxy adhesive, ensuring a reliable and secure grip during testing. A schematic representation of the tensile test specimen is depicted in Figure 6b. The tensile tests were carried out using an Instron universal testing machine, which utilized a non-contacting video extensometer. The crosshead speed during testing was set at 2 mm/min, and the gauge length was established at 50 mm.
The tensile test was performed to evaluate the mechanical properties of plain basalt fabric and two different densities of SS304 wire mesh: 100 and 200 mesh. Figure 7 shows a typical stress–strain curve, derived from the outcomes of a tensile test. The test involved the application of a uniaxial static constant load through a crosshead, parallel to the specimen. Analyzing the stress–strain curve unveils the distinctive behaviors of the specimens. Both plain WM100 and plain WM200 exhibit comparable curve profiles. In contrast, plain basalt demonstrates a linear increase in tensile stress until it reaches its maximum stress point before failure. Conversely, plain WM100 and plain WM200 showcase greater strain deformations, entering a plateau stress stage after surpassing the elastic limit but before fracturing. This stress–strain pattern indicates that plain WM100 and plain WM200 are ductile composites, while plain basalt is a brittle composite. The observed differences are attributed to the varying strength and modulus of the reinforced materials.

2.3.2. Compression Test

To extract the compressive material behavior of composite laminate according to ASTM D3410, a compression test was carried out [29]. To ensure the test results’ reliability, five specimens with the size of 155 mm × 25 mm × 4 mm were used for testing. To enhance the reliability of the compression tests, the clamped side of the sample surfaces was precisely prepared to have a coarse texture to prevent potential slipping during testing and ensure a secure grip on the specimen. Moreover, to ensure the repeatability of the results, five tests were performed for each sample. Figure 8 illustrates the specimens’ dimensions. The compression tests were conducted on a universal testing machine with a compression speed set at 1.5 mm/min and a gauge length set at 15 mm to maintain uniform testing conditions. The composite specimens were securely positioned in a compression test fixture, as shown in Figure 8. This fixture design, along with the defined parameters, ensures the controlled and consistent application of compressive loads during testing.
Figure 9 demonstrates the distinct behaviors evidenced by the plain composite specimens when compressed. The specimen of plain basalt exhibited a linear increase in load with displacement until it reached its maximum load, followed by an abrupt decrease in load, forming a triangle with a right angle on the graph. The results show that basalt specimens are more brittle than steel wire mesh. Moreover, the strength of plain basalt is much higher than steel wire mesh samples in compressive loading.

2.3.3. Shear Test

Following ASTM D7078 shear testing, the specimens—shaped as flat rectangles with symmetrical, centrally positioned V-notches—are shown in Figure 10a [29]. To conduct the shear tests, the prepared specimens were placed between two fixture clamps, aligning the notches with the direction of the applied load. As the testing machine extended the fixture clamps, monitoring the applied load, shear stresses were induced within the notched specimens due to the relative displacement between the grippers. This testing approach adhered to a specified crosshead speed of 2 mm/min. Each test was repeated five times to ensure the repeatability of the results. For an effective assessment of the material’s shear strain response, two positioned strain gauges (TML BFLAB 5-3, designed for composite materials), oriented at angles of ±45° to the loading axis, were introduced at the midpoint of the specimens. This orientation allowed for a comprehensive evaluation of the material’s behavior under shear forces. The angle of fiber orientation for all samples was 0/90 degrees in relation to the angle of the strain gauge installation. The experimental setup for the shear tests is illustrated in Figure 10b,d.
The purpose of the test is to measure the shear behavior and strength of the composites. The load–displacement curves derived from the V-notch shear test are depicted in Figure 11. In comparison to plain basalt and WM200, the plain WM100 specimen demonstrated a shallow slope curve upon initial loading. This indicates that the plain WM100 specimen has lower initial shear stiffness. As displacement increased, the curves for all specimens demonstrated a nonlinear increase in load, though with a shallower slope than the initial slope. This indicates that the specimens’ shear strength decreased after exceeding their elastic limit.

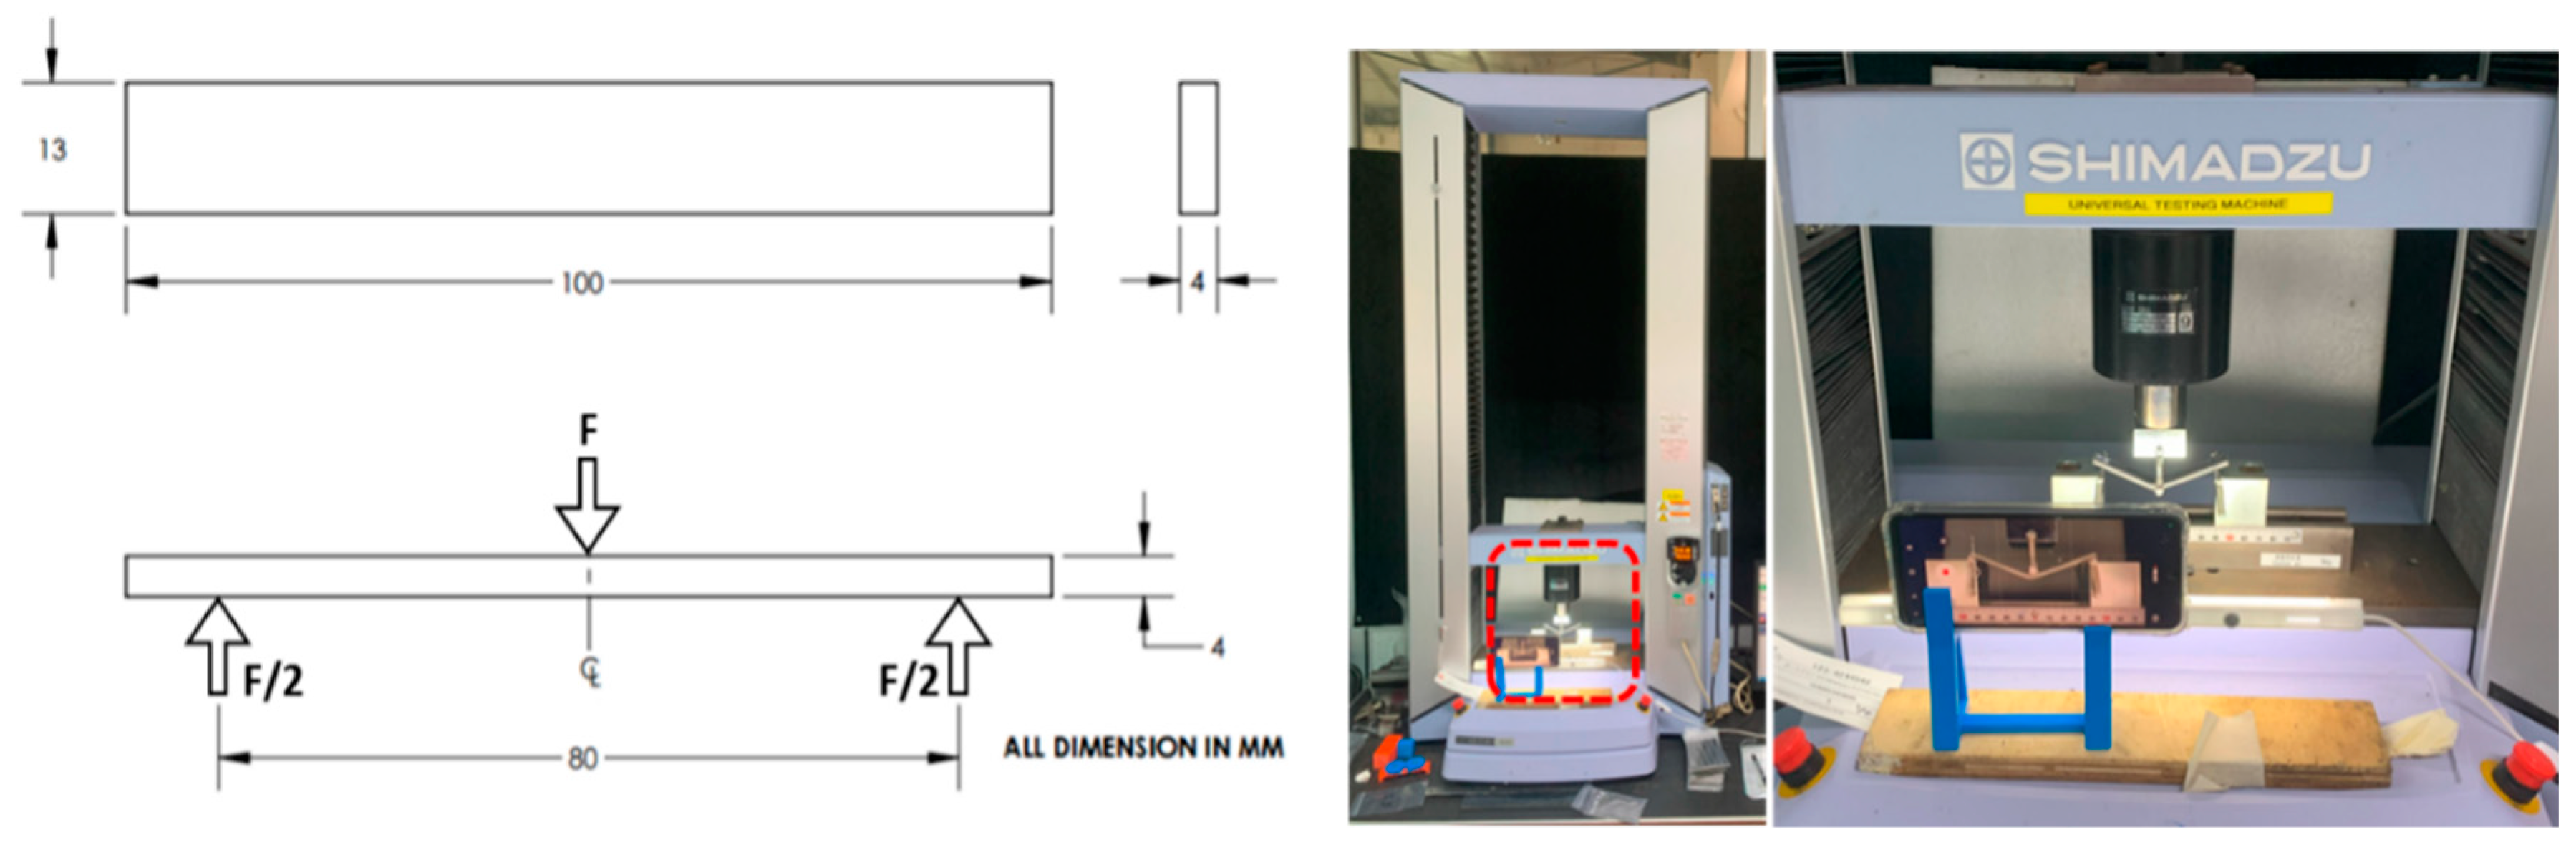
2.3.4. Flexural Test

To determine the bending properties of different layer configurations, a set of flexural testing tests was carried out according to the ASTM D7264 standard. The flexural strength and modulus of the specimens were determined by calculating the mean values from five test repetitions. Figure 12 presents a schematic depiction of the flexural specimen along with an illustration of the span length. According to the ASTM D7264 [29], the loading noses and supports shall have a cylindrical contact surface of a radius of 3.0 mm and maintain a support span-to-depth ratio (L/d) of 20:1. The crosshead motion rate for each specimen was maintained at 2 mm/min. Figure 12 demonstrates the setup of an experiment for flexural testing. The data collected from the flexural tests included flexural strength, flexural modulus, maximum flexural load, and deflection.
To evaluate the effect of different parameters on the flexural responses of the hybrid composite laminates, a set of design of experiments (DOEs) was proposed based on categorical factorial design (26 tests with 3 replicates). Three categorical factors, thickness ratio (A), mesh density (B), and layer configurations (C), were considered as the main design factors. Two responses, i.e., flexural strength and flexural modulus, as two main parameters in bending structures, were recorded as the structural responses. Table 4 represents the DOE matrix for experimental testing.

3. Numerical Model

3.1. Initial Finite Element Model

The results of the experimental test were used to provide the material properties of different plain and hybrid composites. An initial finite element model was generated in ABAQUS/Standard 6.16 commercial code. CAD geometries for the tensile, compression, and shear testing of the specimens were generated in the FE software (ABAQUS/Standard 2016). In order to ensure a good quality of mesh, the H-method (Lagrangian method) was used. The criteria can vary based on maximum stress, strain, or strain energy. However, in this study, the strain energy was considered as the mesh quality criterion. In this method, the size of the mesh will be reduced until the strain energy of the whole model maintains a constant value. The size of the element was selected with a minimum size of 0.8 mm [30]. The boundary condition was taken from the experimental test. The applied loading in all cases was displacement control according to the experimental loading rate (2 mm/min). Figure 13 shows the FE model of material testing for material characterization and model validation.
The tie constraint was considered between all 24 layers and the bonding was considered as the perfect bonding. The tie constraint makes a permanent contact between two corresponding nodes of two different laminates; when one node is going to be deformed, the same displacement can be read from the corresponding node from the connected layer. In this regard, the delamination or debonding between layers cannot be seen in this simulation. To avoid stress concentration in the loading area, a coupling constraint was applied on the loading surface and an external reference point. In the case of tensile simulation, the simulation continued until a full rupture occurred. In the compression test simulation, a load of gripper wedges was read from a tensile testing machine and the exact force was applied to both sides of the gripper. To perform the applying load correctly, the gripping process was performed in the first step and the compression load was applied in the second step.
The results of mechanical testing were used for assigning material properties and the extraction of damage parameters for FE modeling [31]. The results of the mechanical testing process were used to assign material properties to the different layers for FE modeling. Table 5 demonstrates the material properties for the mechanical testing of the basalt and steel wire mesh laminates.

3.2. Finite Element Model for Flexural Testing

3.2.1. FE Model Definition

After finishing the initial FE model, the validation of the mechanical behavior of the FE and the experimental results was conducted. According to ASTM D7264, a single 3D lamina with a thickness of 0.23 mm was generated. The model consists of a 24-layer lamina based on experimental dimensions. All layers were connected to generate the final laminate. In this model, three material sections (basalt, W100, or W200) were defined based on the stacking configuration taken from Table 4. The bonding between layers was considered to be the perfect bonding. The hybrid composite laminate was assigned; to simulate the three points of the bending test, three rigid rollers were generated with rigid body properties. The element type of layers was considered as the 3D deformable elements and the roller supports were made by discrete rigid elements. The size of element for flexural testing was considered as equal to 0.5 mm in the plane, with only one element through the thickness (0.23 mm). The contact between the roller and the composite laminate was defined as the surface-to-surface penalty contact method, with a friction coefficient of µ = 0.08. A displacement rate of 2 mm/min as the quasi-static loading was applied to the FE solver. The load was applied as a linear ramp over time, and the simulation was stopped until the maximum displacement reached failure displacement in the experiments (at a maximum of 30 mm). Figure 14 shows the FE model applying the loading and boundary conditions of the model.
Based on the DOE matrix, the 26 different test conditions (see Table 4) were assigned to the model and the design responses, i.e., the flexural strength and flexural modulus were recorded for data analysis and to determine the optimum condition.

3.2.2. Damage Initiation and Failure Criteria

Hashin’s damage criteria were employed in the ABAQUS/Standard to illustrate the initiation of damage and progressive failure, where the commencement of damage correlates with material degradation. The evaluation of Hashin’s failure prediction involves four distinct criteria: fiber failure in tension, matrix failure in tension, fiber failure in compression, and matrix failure in compression [32]. The structure will hypothetically be safe (undamaged) if all the five conditions are below the critical threshold. However, if one or more of these equations are satisfied, damage initiation will occur. In other words, the damage of the composite layer will be initiated when only one of these criteria is higher than 1. When damage propagates between 0 and 1, the corresponding element will be degraded; immediately after reaching 1, the element will be deleted from the FE model and the load will be transferred to the neighboring elements. The model for Hashin’s failure criteria is expressed in Equations (1)–(4).
F f = σ 11 X T 2 + α τ 12 S L 2   ,   σ 11 ¯   0 ,       f i b e r   t e n s i o n   σ 11 ¯ < 0 ,   t
F f = σ 11 X C 2 ,       F i b e r   c o m p r e s s i o n   σ 11 ¯   0 , c
F m = σ 22 Y T 2 + τ 12 S L 2   ,       m a t r i x   t e n s i o n     σ 22 ¯ < 0 , t
F m = σ 22 2 S T 2 + Y c 2 S T 2   1 σ 22 Y C 2 + τ 12 S L 2   ,       m a t r i x   c o m p r e s s i o n     σ 22 ¯ < 0 ,     c

4. Results and Discussion

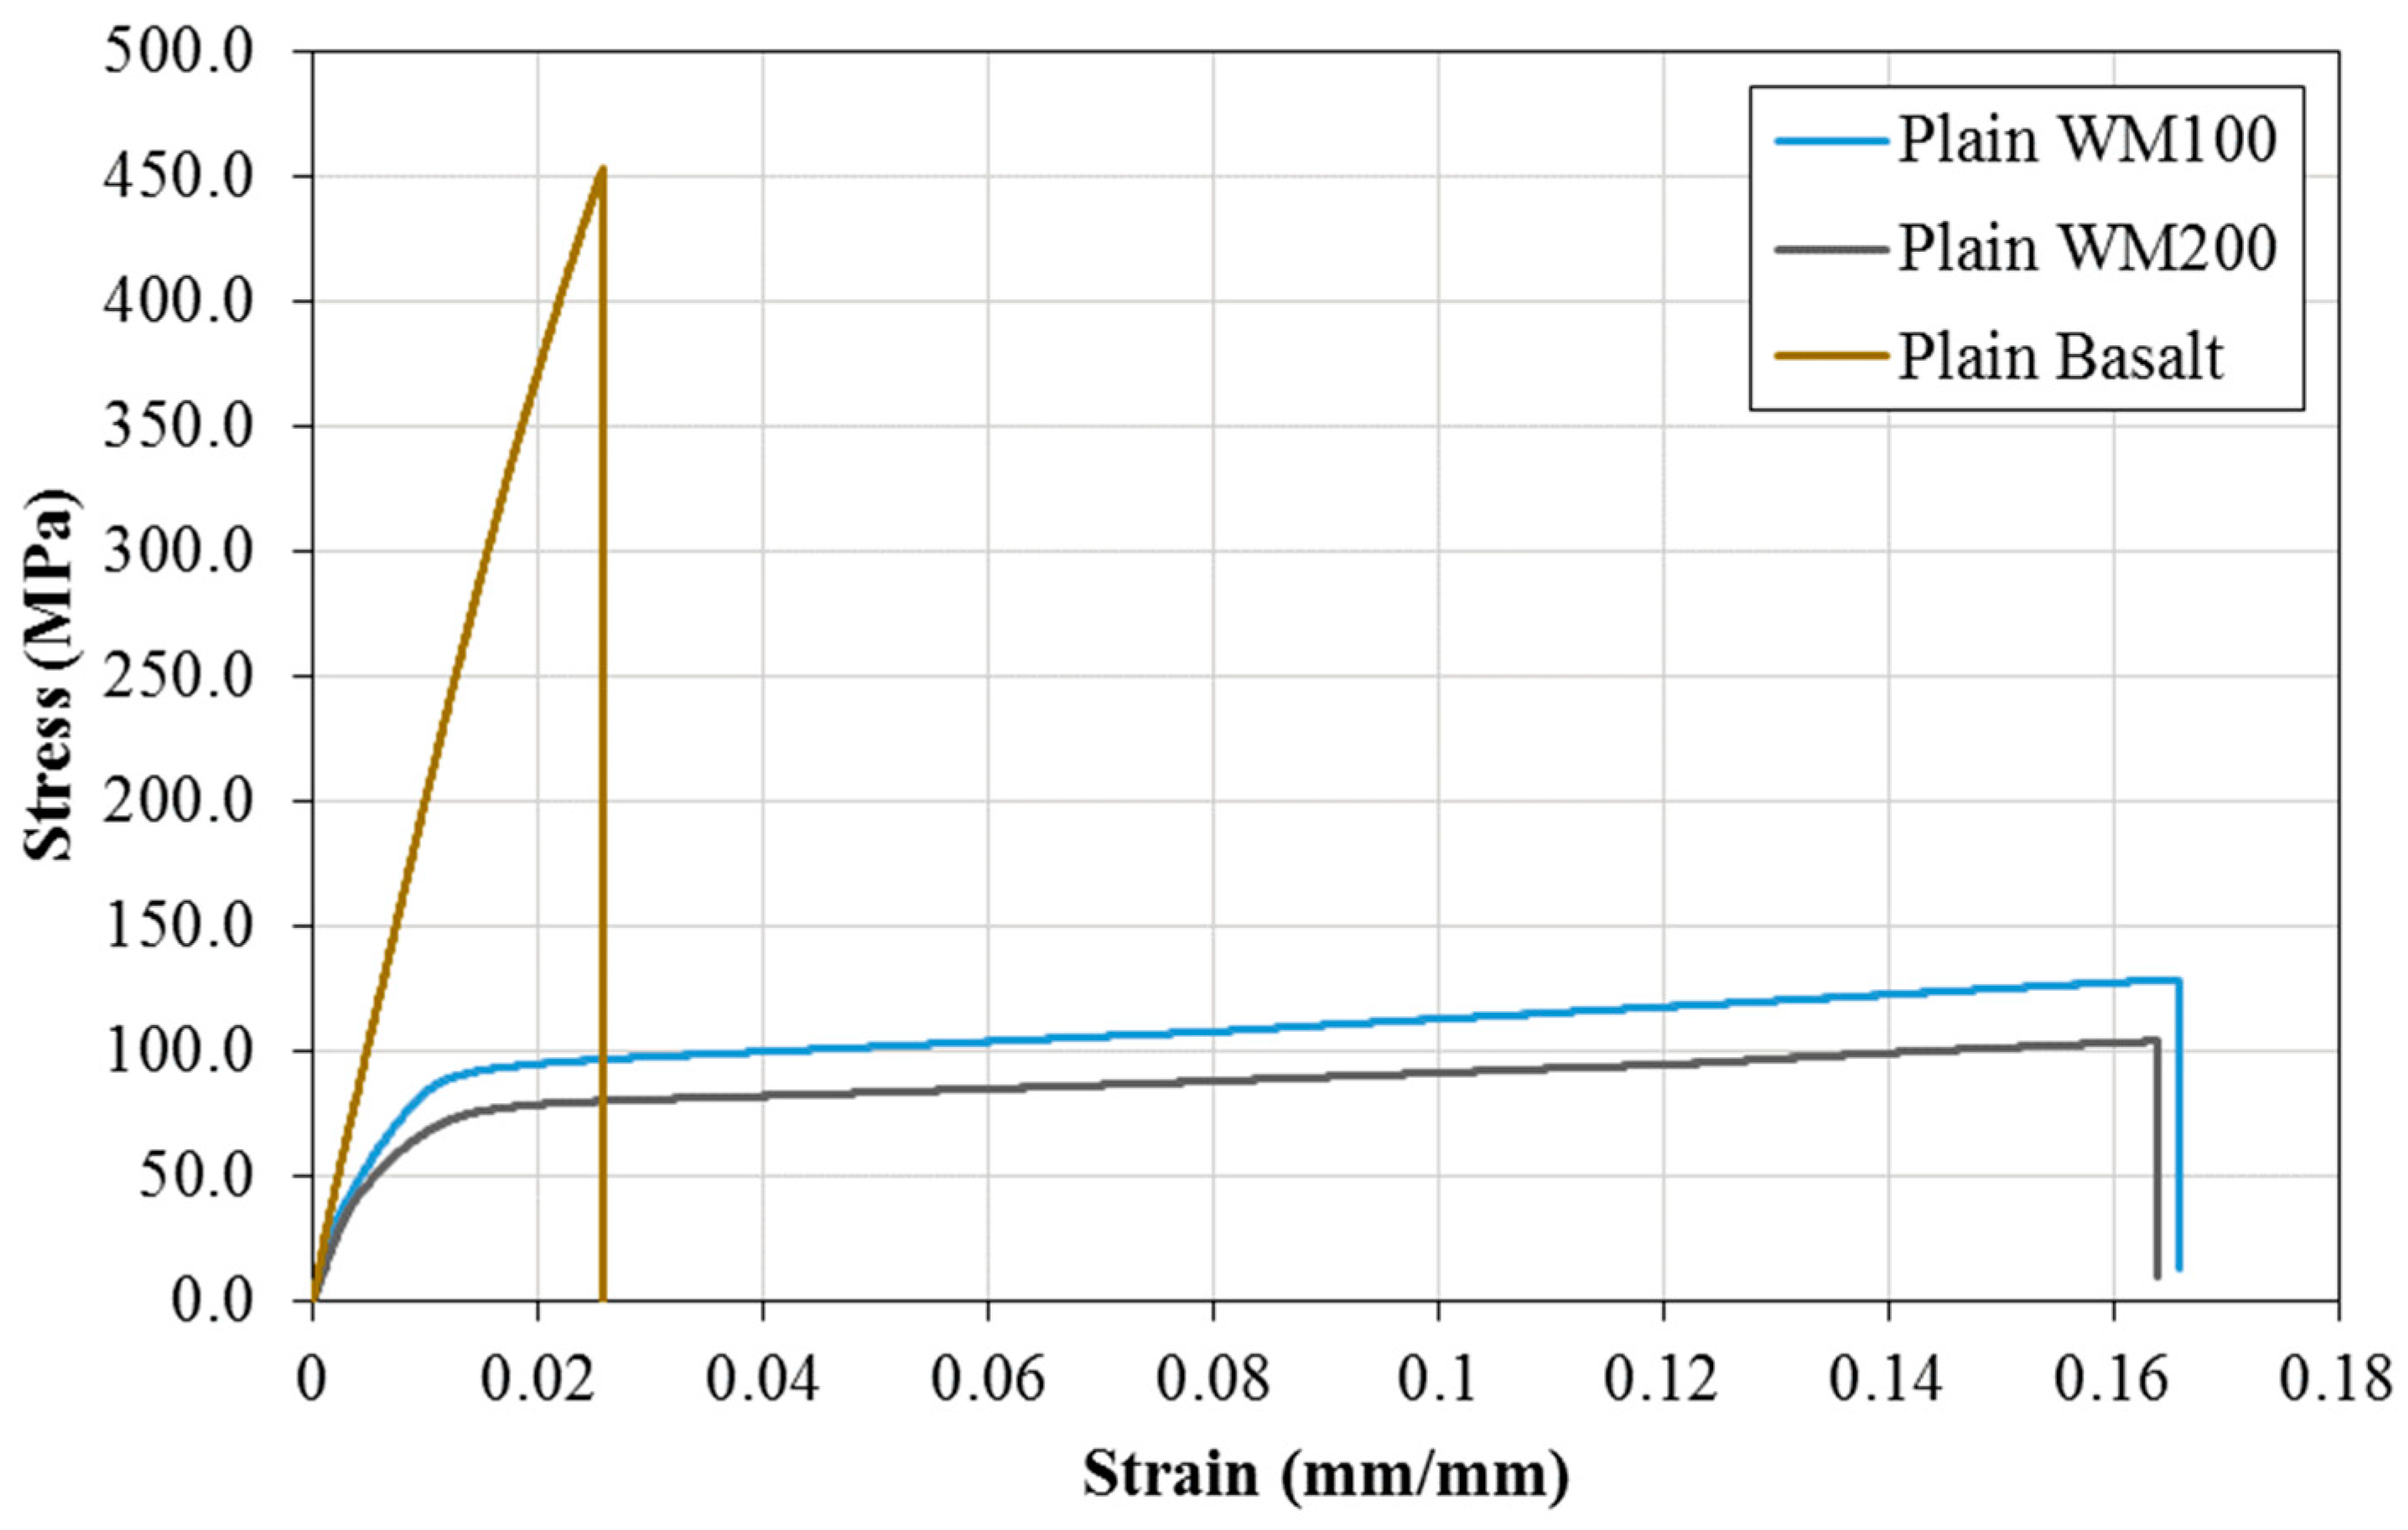
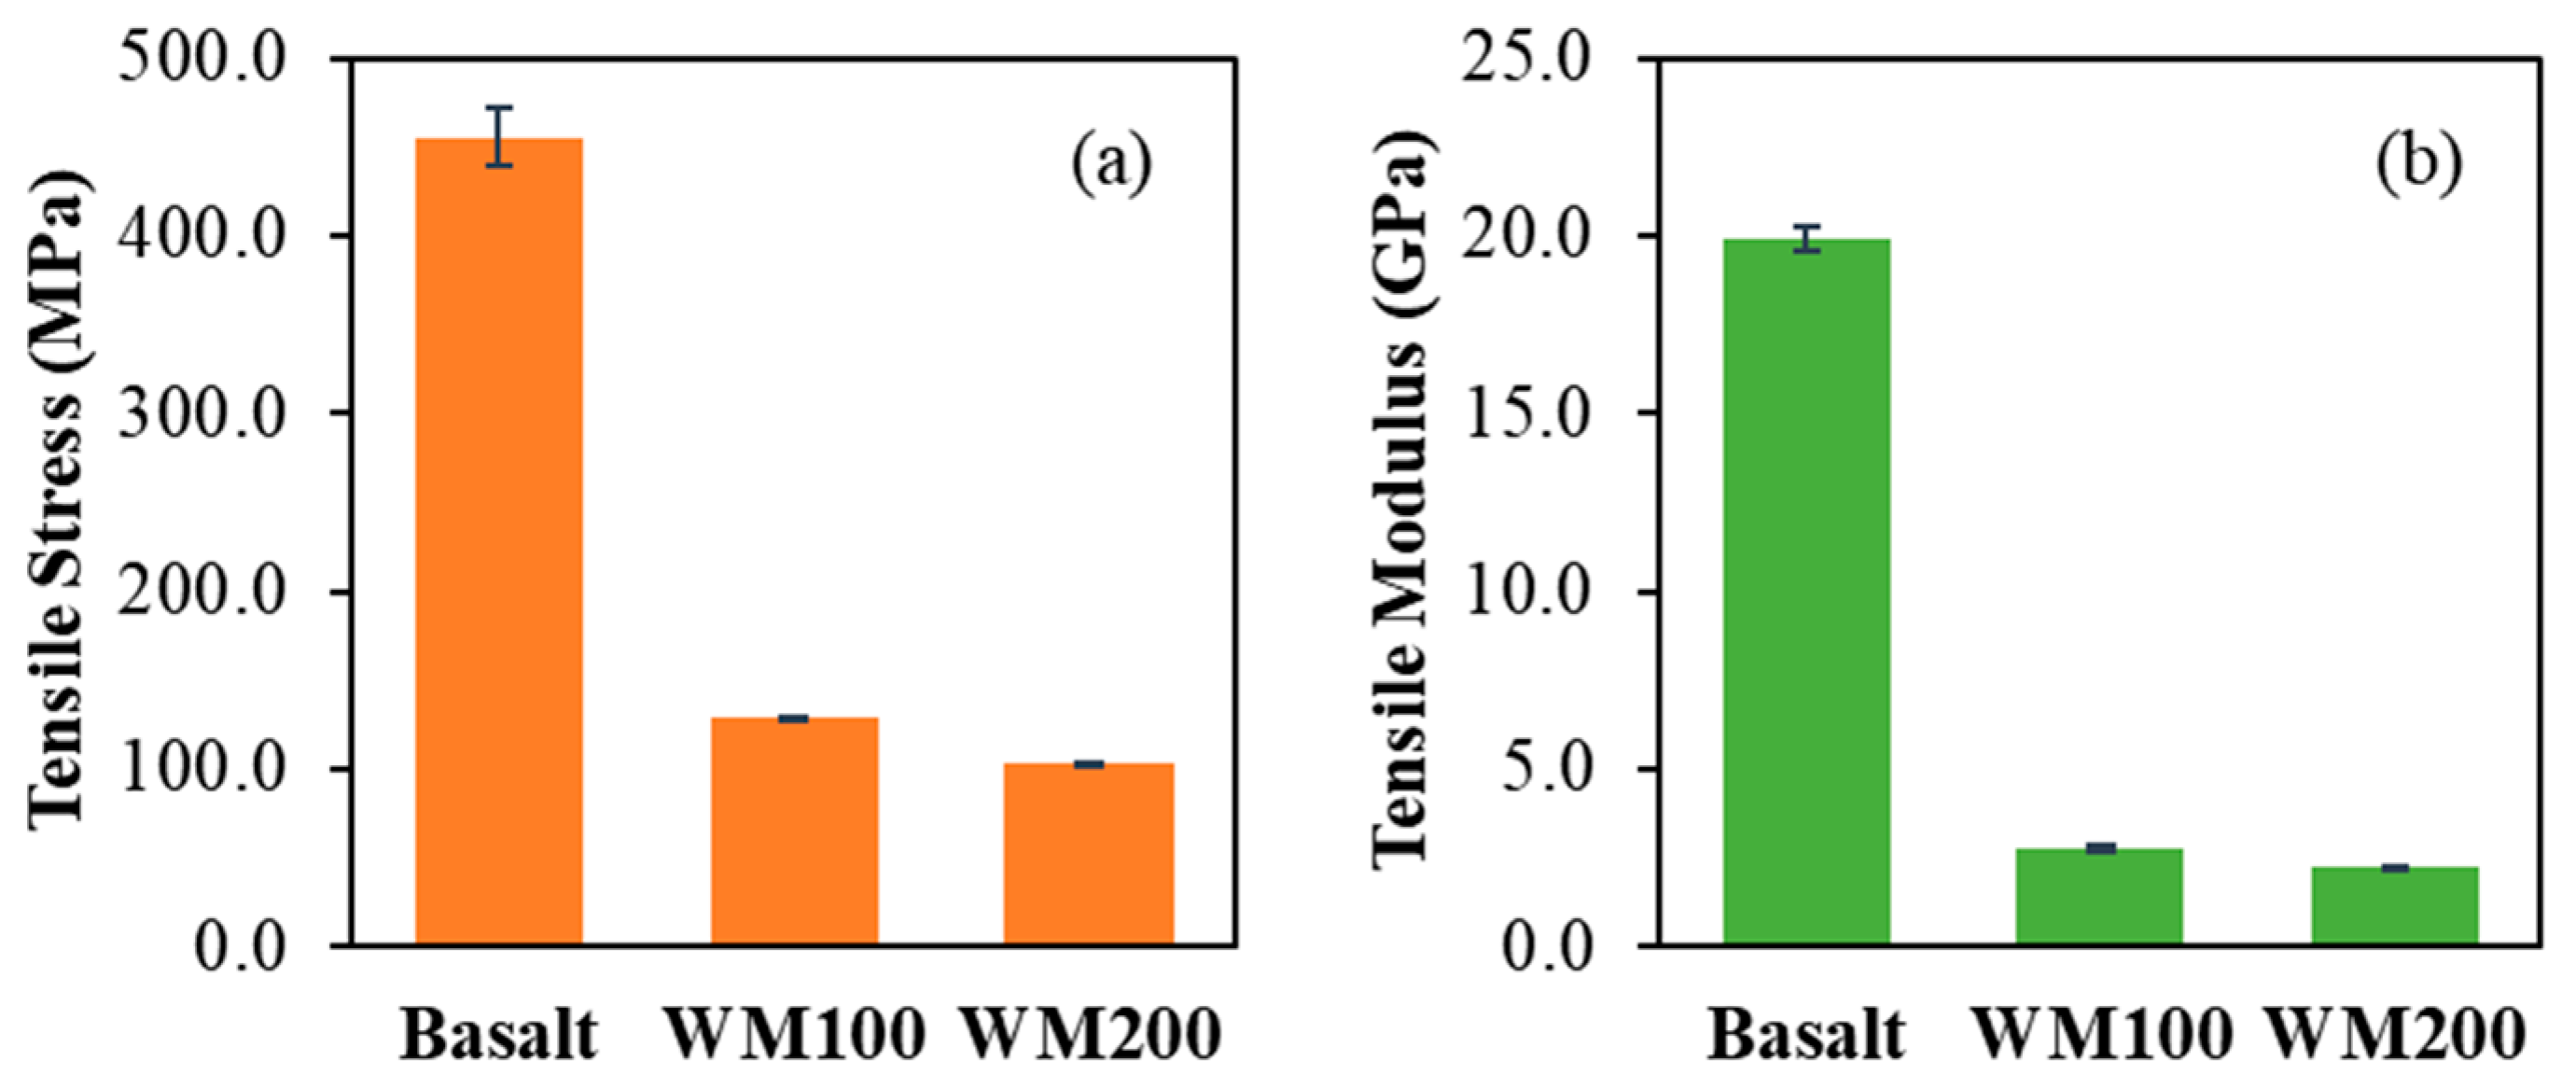
4.1. Tensile Behavior

Figure 15 illustrates a comparison between the tensile strength and modulus of different specimens. The tensile strength of plain basalt (455.5 MPa) surpasses that of plain WM100 (128.3 MPa) and plain WM200 (102.8 MPa). Variances in the wire mesh diameter and the number of layers used in fabrication contribute to the difference in tensile strength between plain WM100 and plain WM200. The tensile modulus exhibits a similar trend, with plain basalt exhibiting the highest value (19.9 GPa), followed by plain WM100 (2.78 GPa) and plain WM200 (2.2 GPa).
The superior mechanical properties of basalt fiber account for the higher strength and modulus of the plain basalt composite. On the other hand, the ductility of SS304 allows plain WM100 and WM200 to undergo significant elongation before failure. Plain WM100 and WM200 demonstrate approximate elongations of 16.5% and 16.1%, respectively, before failure, while plain basalt exhibits an approximate elongation of 2.6% before failure.
Figure 16 compares the results of the tensile test from the experiments and FE modeling. It can be said that the model is in good agreement with the test data and the tensile behavior of plain specimens is suitable for use in modeling the hybrid structure. The maximum calculated error between the FE results and the experimental data is less than 4% in all three cases.

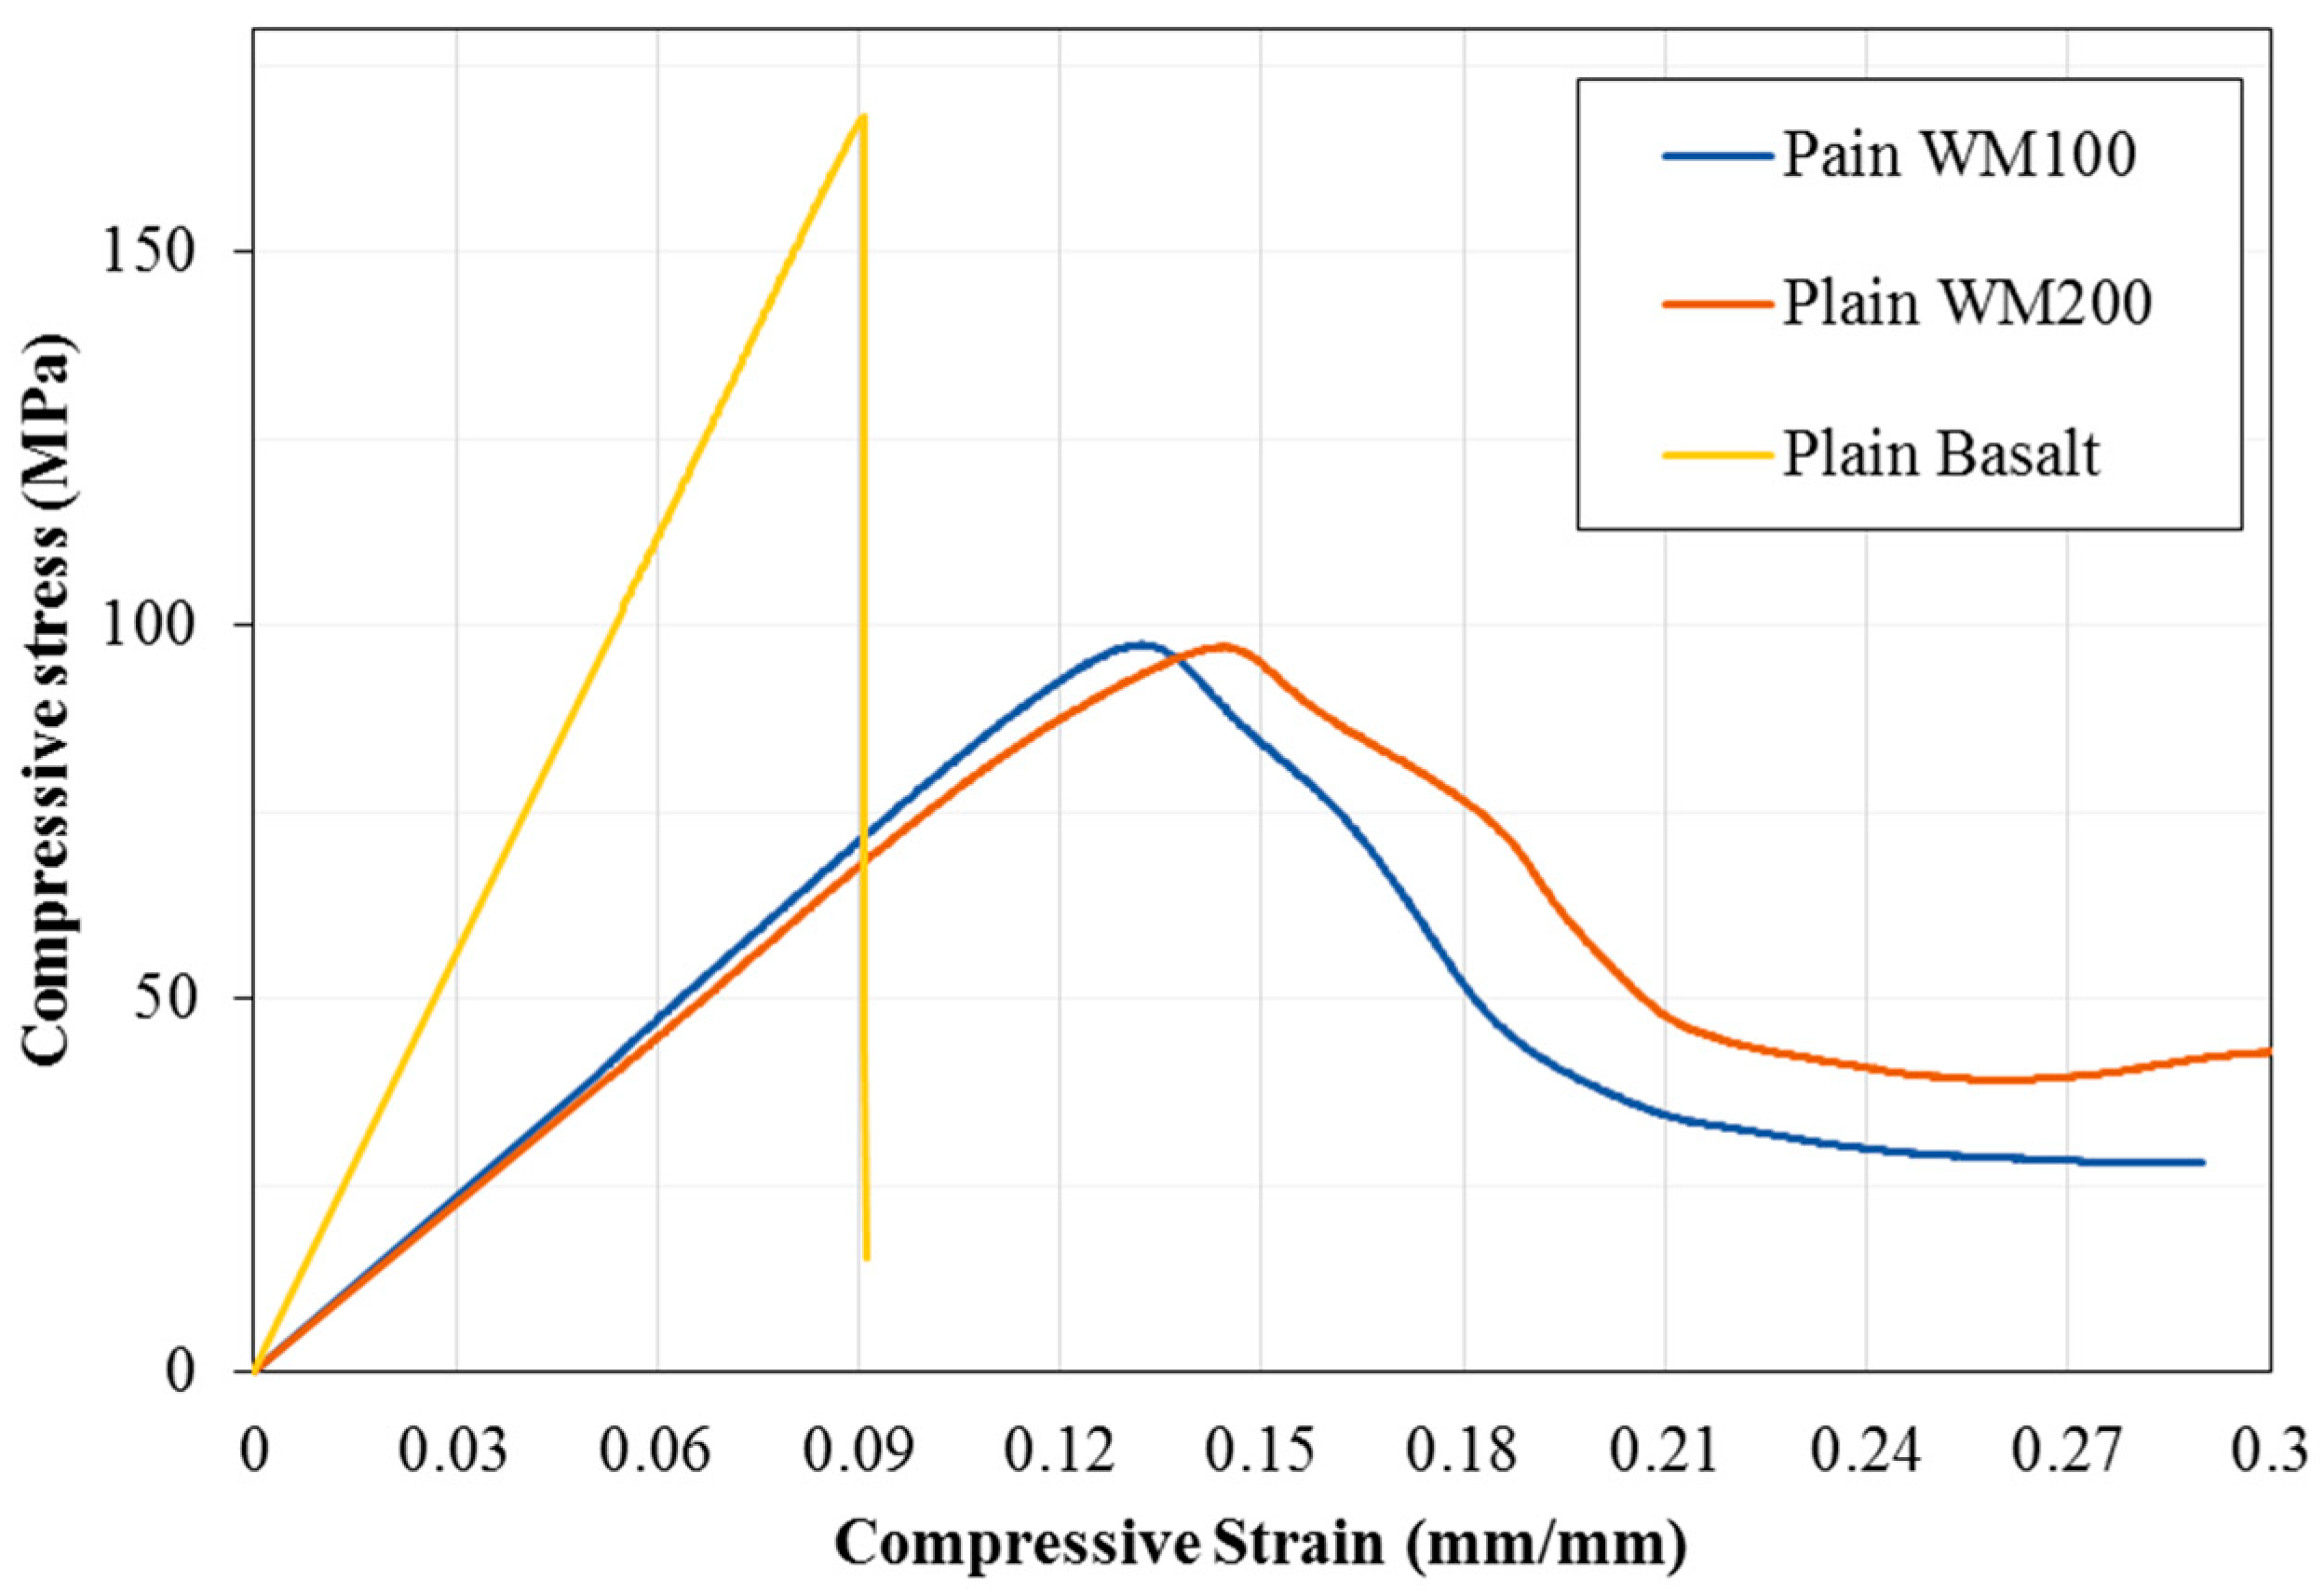
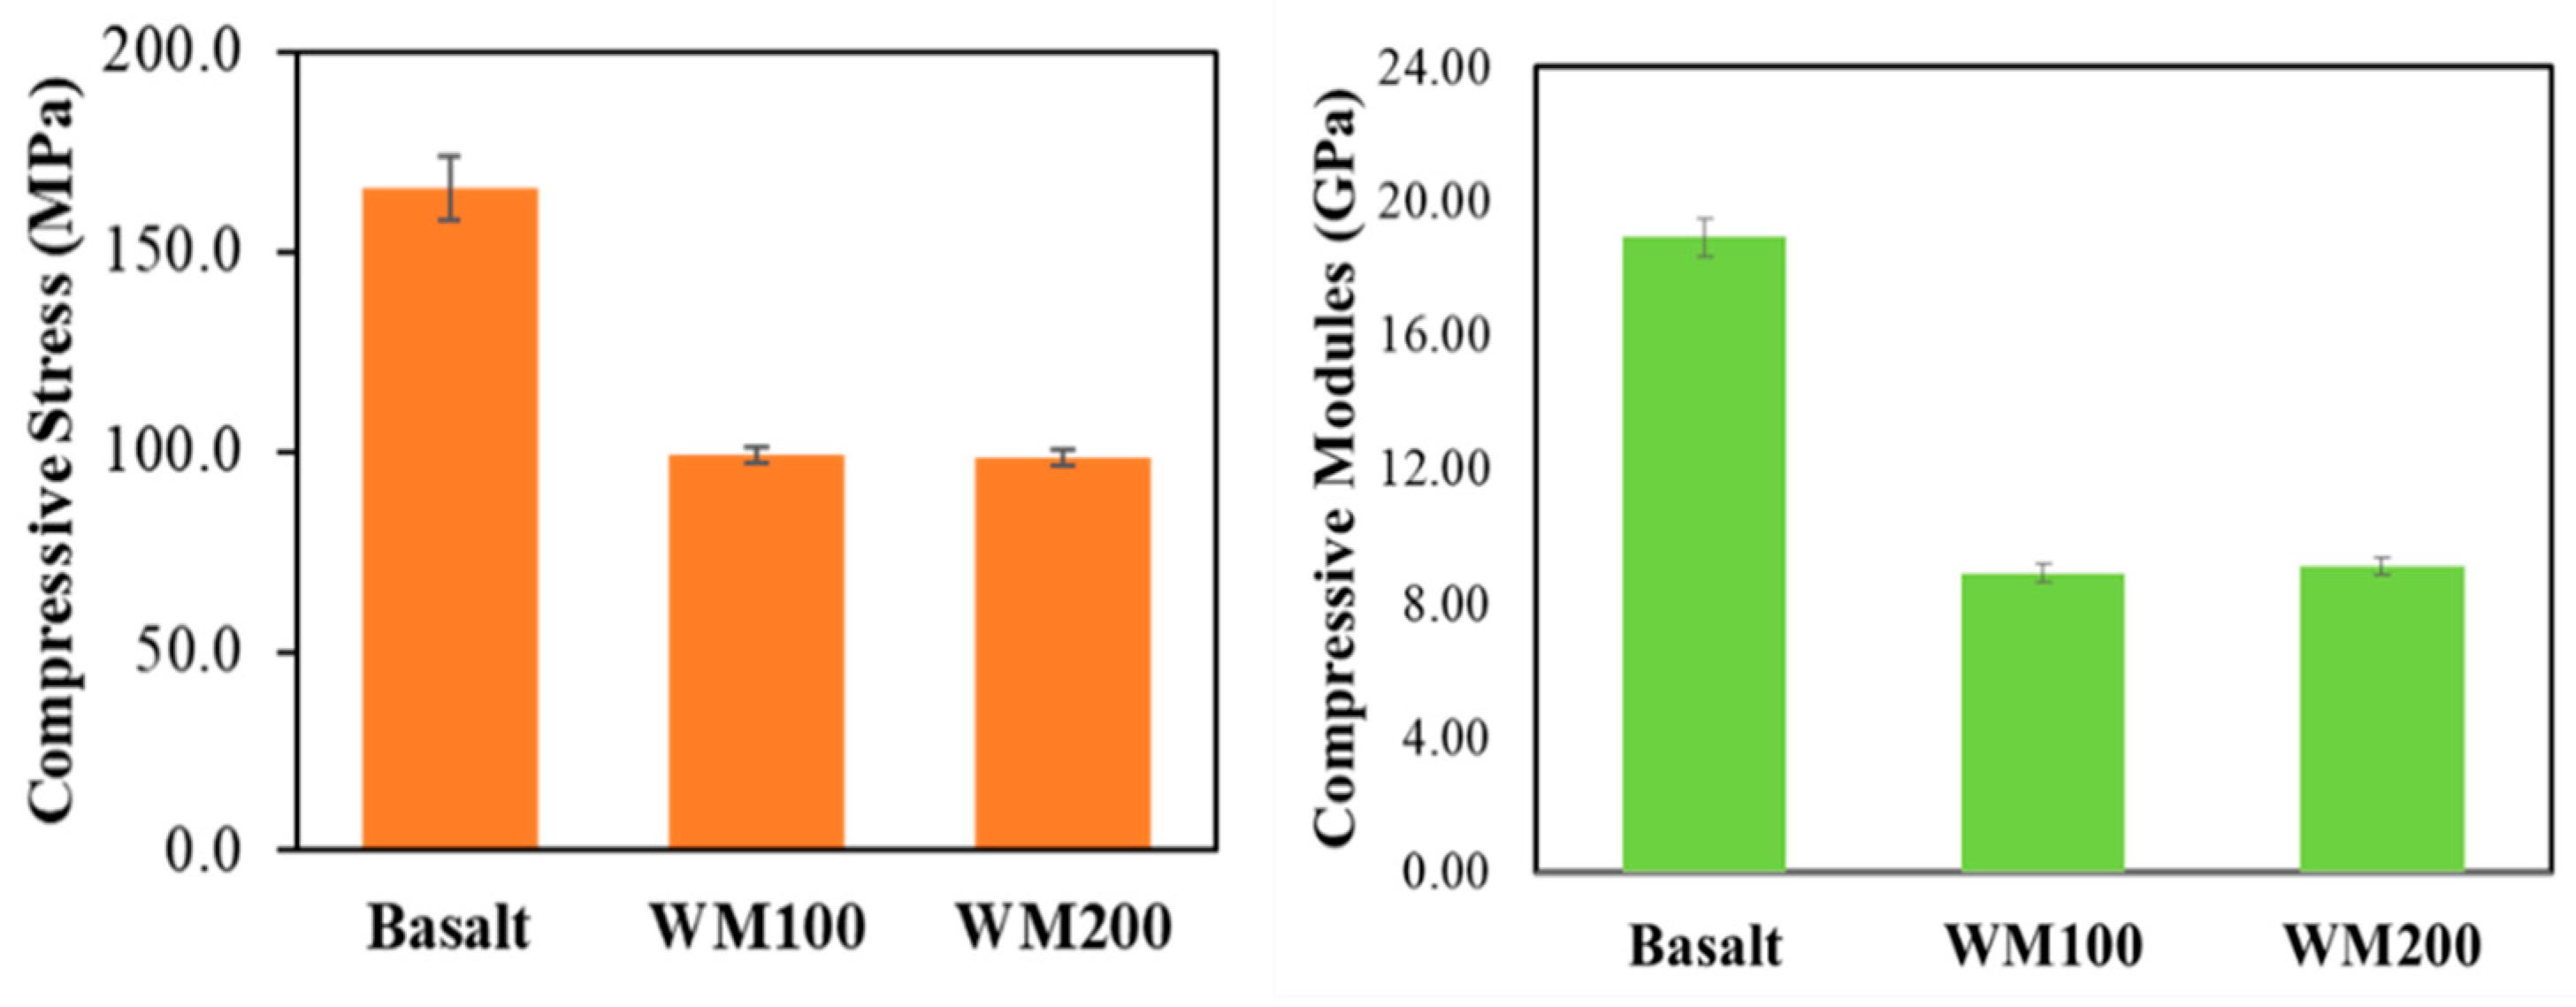
4.2. Compression Test
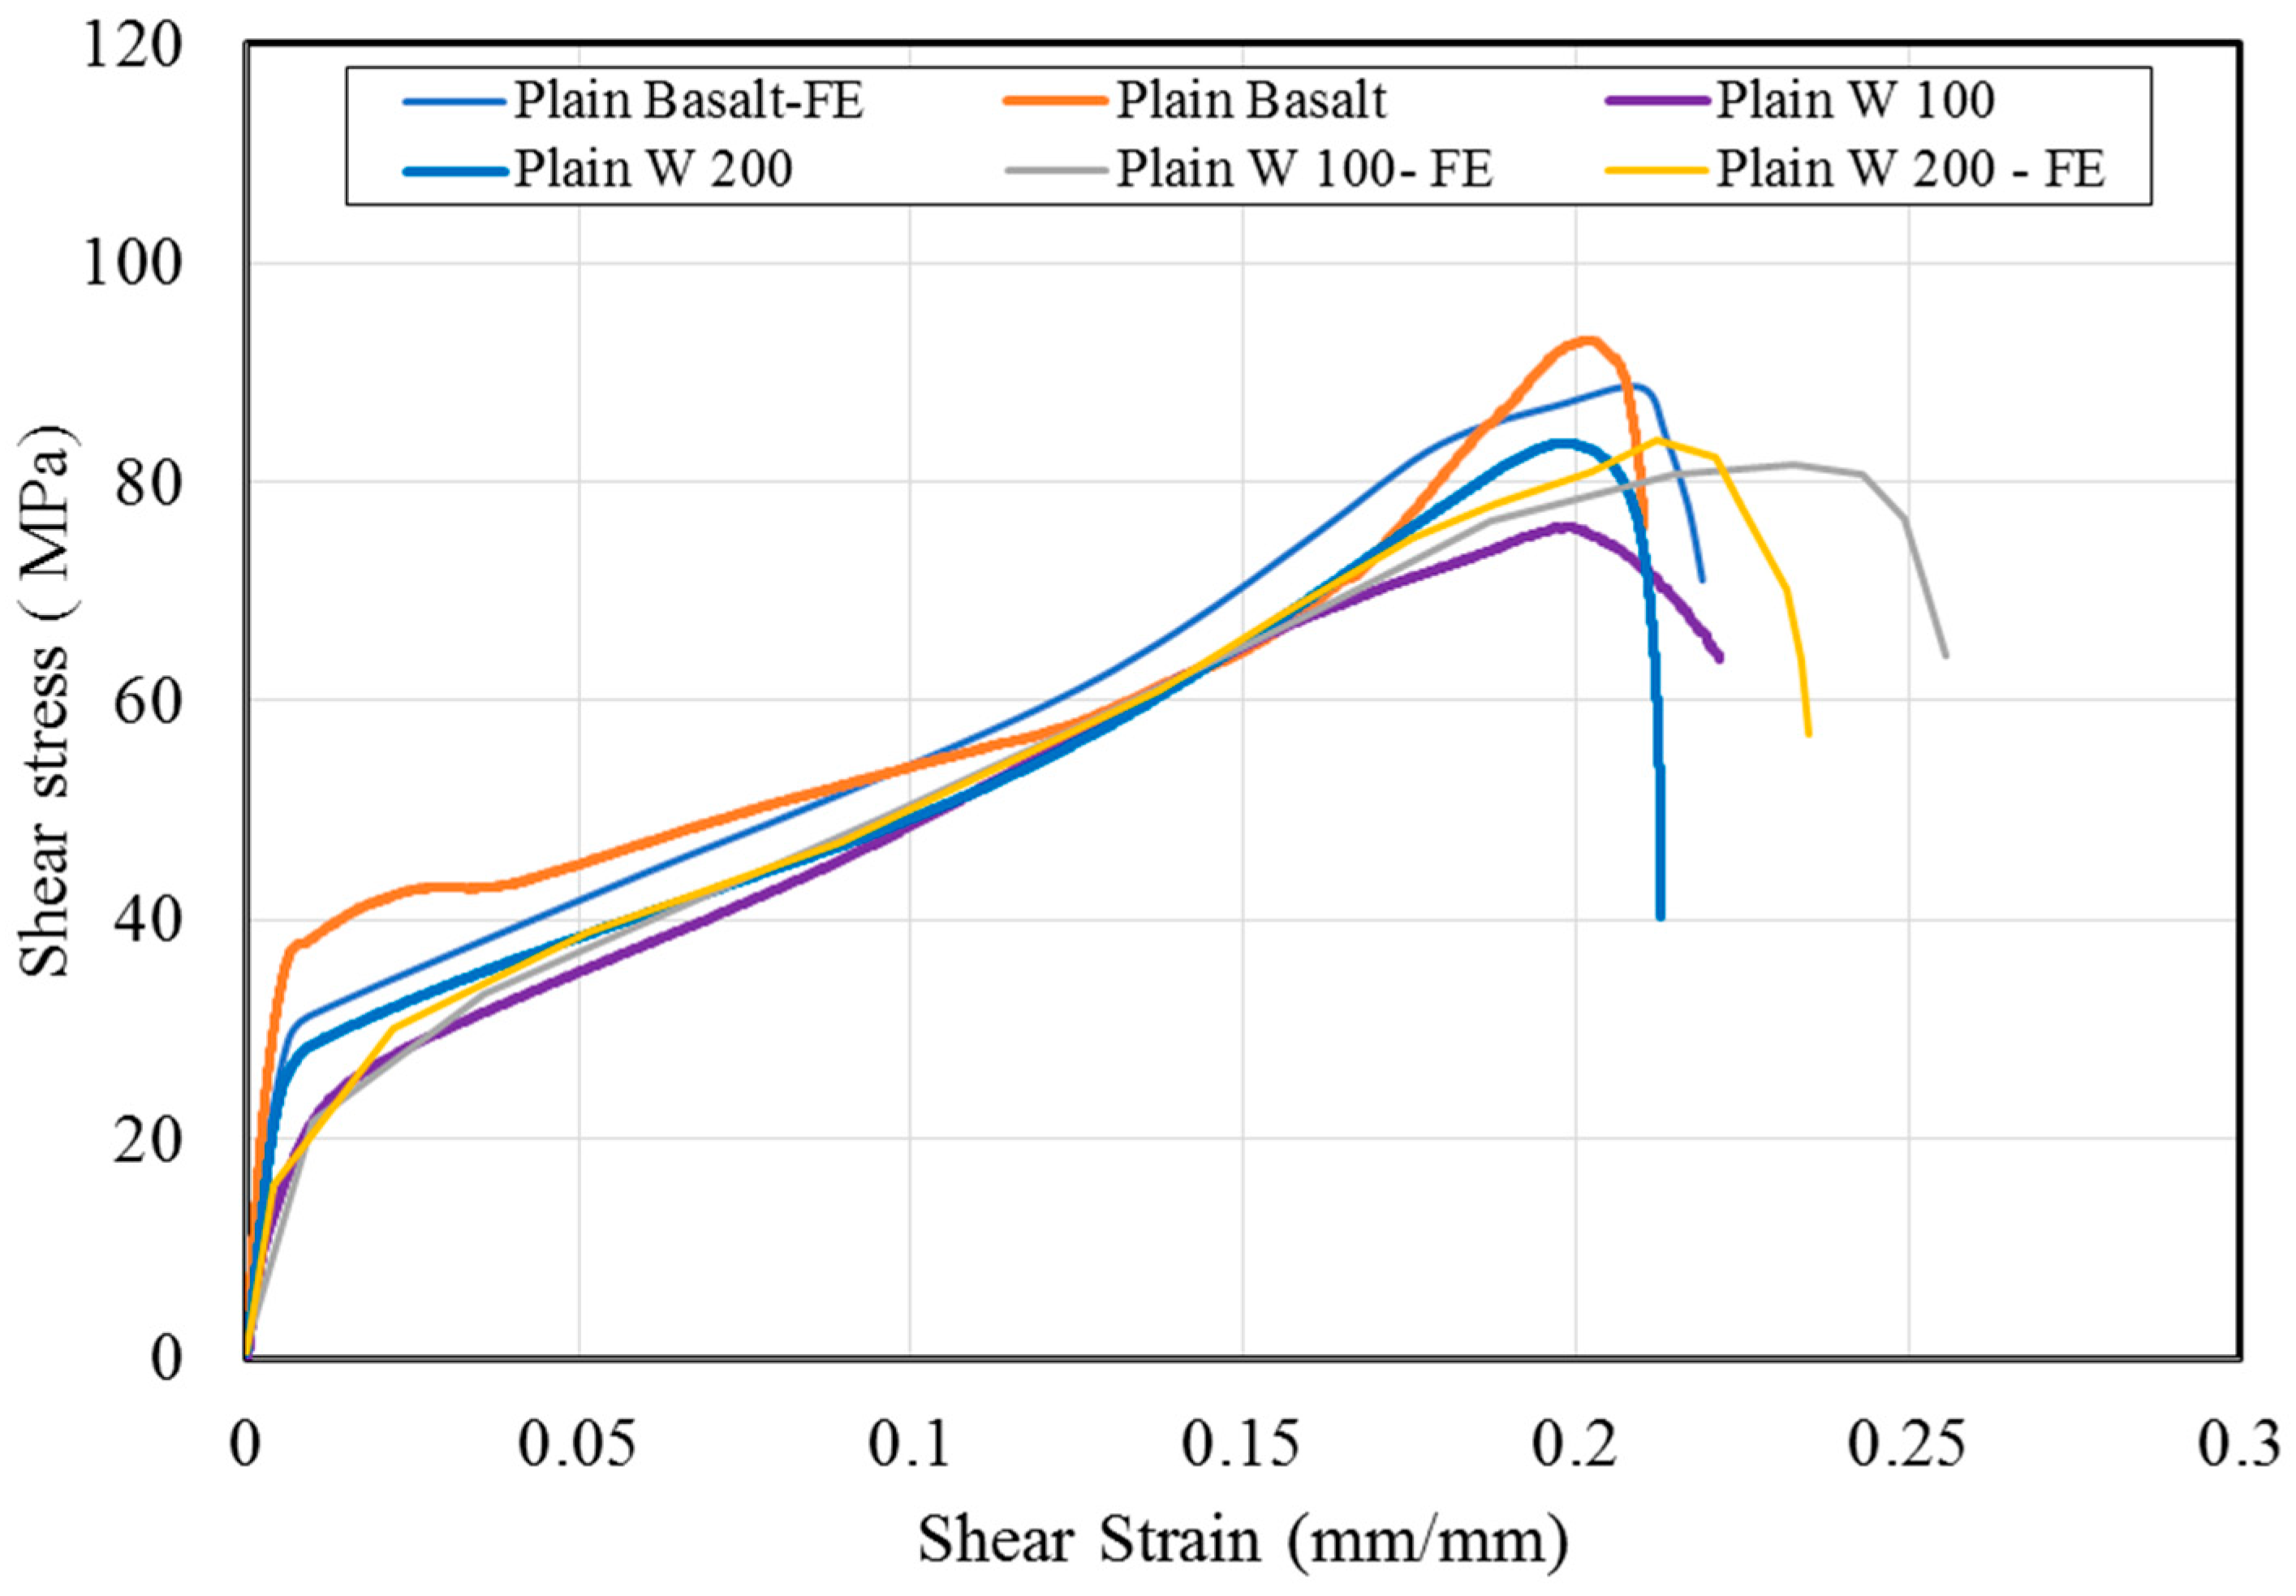
The findings are further supported by the bar graph in Figure 17, which illustrates compressive stress and compressive modules. The basalt specimen demonstrated superior strength with a maximum compression stress and compressive modules of 165.8 MPa. In contrast, the specimens with the wire mesh reinforcement, plain WM100 and WM200, exhibited reduced compression stresses of 99.2 MPa and 98.5 MPa, respectively. The compressive modulus of the specimens for basalt, W100, and W200 are 18.9 GPa, 8.9 GPa, and 9.1 GPa, respectively. The inclusion of the wire mesh impacted the load-bearing capacity and deformation characteristics of the composites. The results highlighted distinct compression behaviors between the plain basalt and the wire-mesh-reinforced specimens. While plain basalt displayed brittle behavior, leading to through-thickness shear failure, the wire-mesh-reinforced composites exhibited higher ductility, absorbing energy through micro-buckling and interfacial interactions.
Figure 18 illustrates a comparison between the outcomes of the compression test conducted in the experiments and those obtained through FE modeling. It can be asserted that the model aligns well with the experimental results, indicating that the compressive behavior of the plain specimens is sufficiently accurate for incorporation into hybrid structure modeling. For compression test cases, the error between FE results and experimental data was less than 6% for basalt, W100, and W200 specimens.

4.3. Shear Test

Moreover, the study involves the determination and comparison of shear strength and shear modulus in plain composites. Figure 19 illustrates a bar graph depicting shear strength values across various composite specimens. The plain basalt composite displays the highest shear strength, registering 99.9 MPa, followed by the plain WM200 and WM100 composites with values of 89.8 MPa and 91.3 MPa, respectively. Additionally, the shear modulus values exhibit a similar pattern, with the plain basalt composite having the highest modulus, followed by the plain WM200 and WM100 composites with respective values of 2.70 ± 0.03 MPa, 1.19 MPa, and 2.31 ± 1.1 MPa. These results emphasize the influence of composite constituents and their arrangement on the shear characteristics of plain composites.
Similar to the tensile and compressive tests, the results of the FE model are in good agreement with the experimental test (see Figure 20). The maximum calculated error between the FE results and the experimental data for the shear test is less than 8% in all three cases. Therefore, it can be verified that the material modeling was performed accurately and the combination of the results of tensile, compression, and shear behavior can be used to model the bending behavior of hybrid laminates with different layer configurations.

4.4. Flexural Test

The flexural testing of the composite materials importantly provides an understanding of their mechanical properties and structural behaviors. This section investigates the flexural characteristics of the plain composites, namely plain basalt, WM100, and WM200. The flexural modulus, maximum flexural stress, and strain at the maximum stress for each composite material were determined. Figure 21 displays the typical load–displacement curves for the flexural test. The analysis of the load–displacement curves revealed the distinctive behaviors of the specimens.
The bar chart in Figure 22 depicts the flexural strength and flexural modulus of the specimens. Plain basalt had the maximum flexural strength of 192.730 MPa, followed by plain WM100 and WM200, which had values of 146.094 MPa and 126.446 MPa, respectively. In terms of the flexural modulus, plain basalt (20,190.169 MPa) has a higher value than both plain WM100 (9733.657 MPa) and plain WM200 (9859.545 MPa). The variation in flexural strength observed between plain WM100 and plain WM200 might result from differences in wire mesh diameters and the number of layers used for fabricating the specimens.
Plain basalt exhibits a linear increase in load until it approaches its maximum load before failure, followed by a distinctive noise-like pattern due to compressive kinking and micro damage on the compression side, as seen in Figure 23a. In comparison, both the plain WM100 and plain WM200 demonstrate similar curve characteristics. Notably, the specimens exhibited plastic deformation without displaying any visible signs of damage throughout the test, as shown in Figure 23b,c, and the test was terminated shortly before the point where both ends reached the supporting span. Furthermore, immediately after the load was removed, a noticeable spring-back phenomenon was observed, which is common for sheet metal forming. This behavior reveals that plain WM100 and plain WM200 are ductile composites, whereas plain basalt is brittle. These discoveries provide substantial information on the unique behaviors of these materials and their potential applications in structural engineering. Moreover, comparing the stress contour of the FE model for plain laminate composites with experimental test samples is shown in Figure 23. It can be seen that the overall bending behavior as well as the damaged area on both sides are close to each other.

4.5. Flexural Behavior of Hybrid Laminate Composite

Figure 24 compares the deformed shape of the hybrid laminated composite specimen with the same configuration of FE modeling. It can be seen that the debonding and kinking areas in both pictures are the same. The bending stress in this case reaches 129.4 MPa at the end of the simulation.

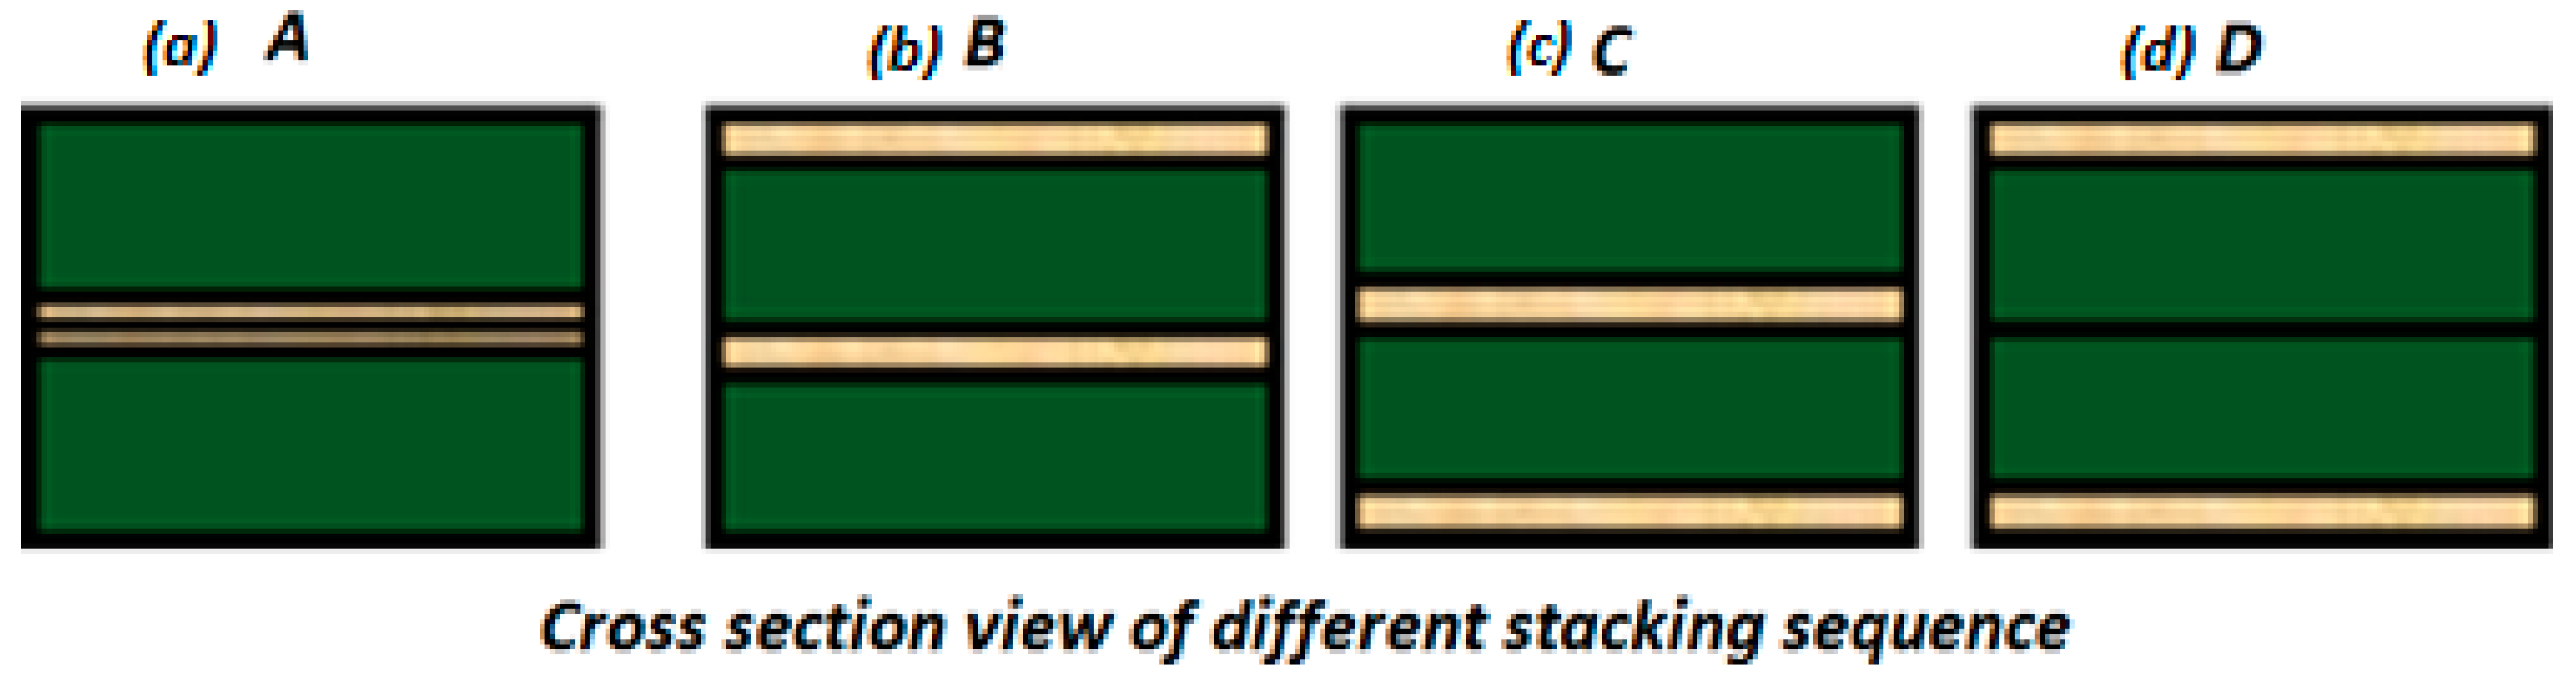
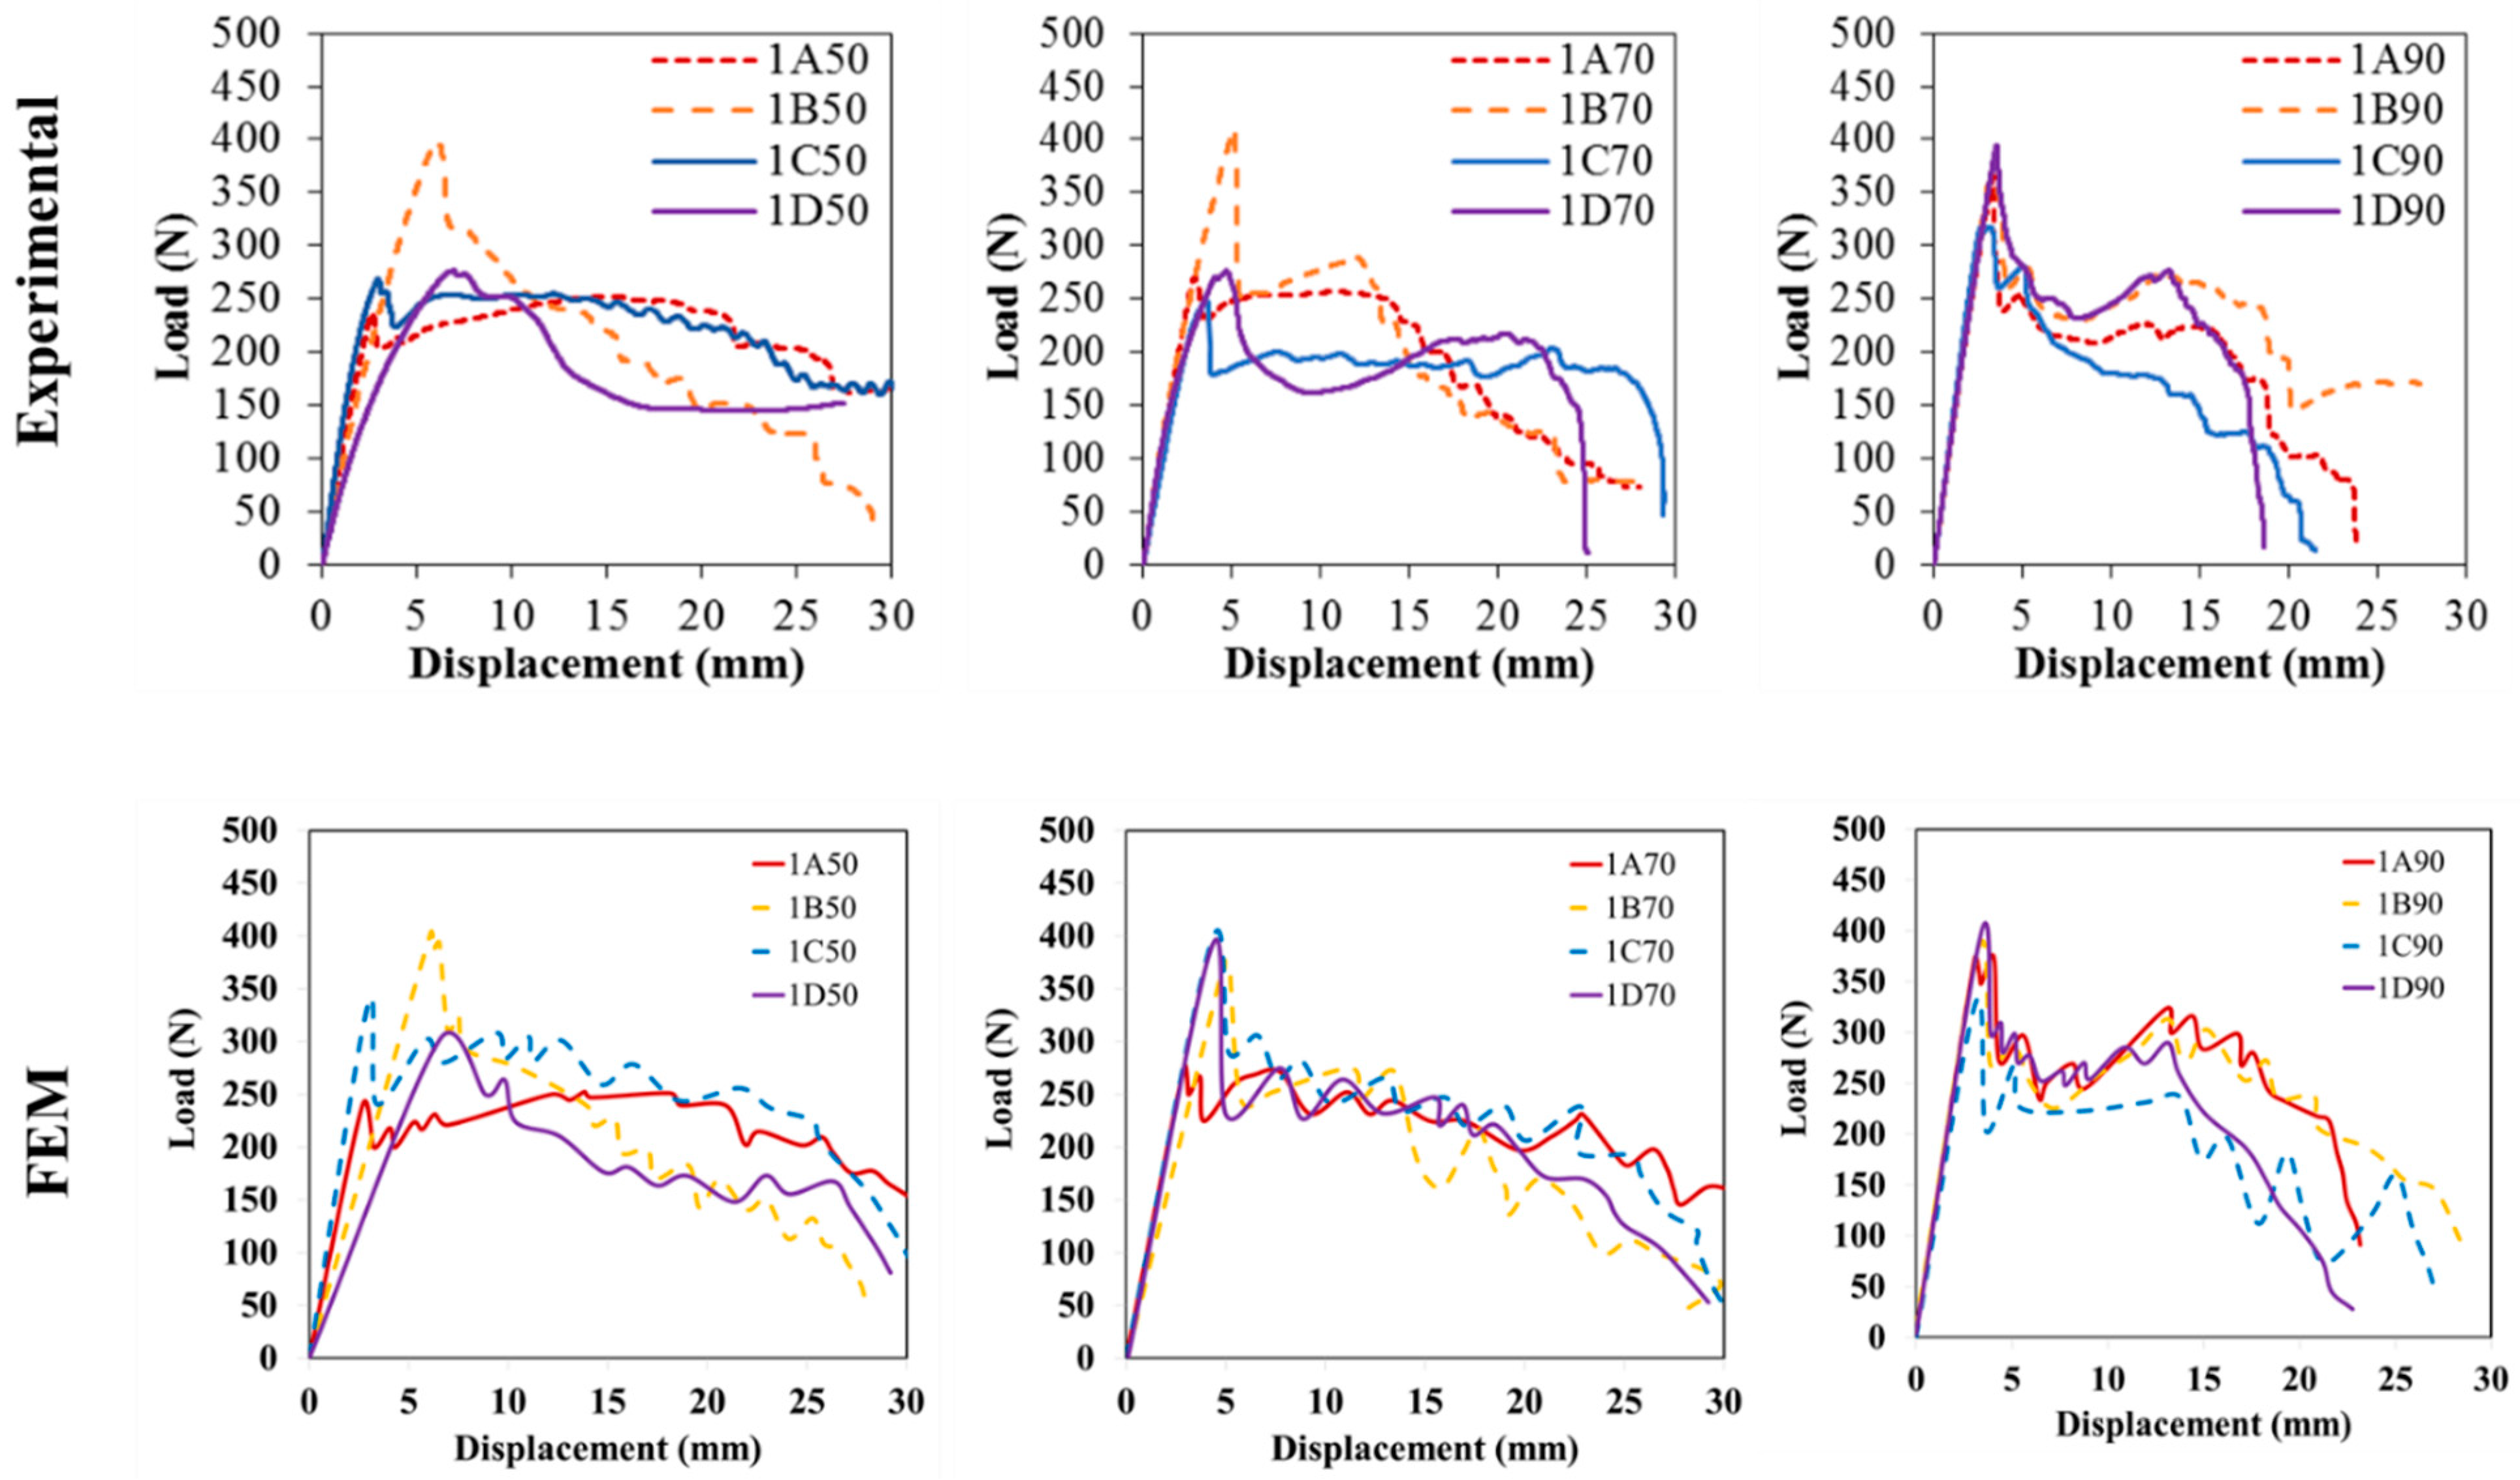
4.5.1. Effect of Stacking Sequences on the Load–Displacement Curve

The results of the flexural test and FE modeling for the stacking sequence reveal complex patterns associated with this configuration. Figure 25 provides a detailed analysis of the stacking sequence’s response to flexural loading, taking into account varying hybrid thickness ratios and wire mesh densities. In A [B/WM/B], a clear correlation exists between thickness ratio and peak load, with both increasing together. This trend is consistent across wire mesh densities, with the 200-density specimen showing a higher peak load. The load–displacement curves visually illustrate the stacking sequence’s mechanical behavior under different thickness ratios and wire mesh densities. In contrast, the B[WM/B/WM/B] stacking sequence exhibits intriguing nonlinear trends in stiffness and peak load capacity as the hybrid thickness ratio varies. The stiffness increases from 50:50 to 70:30 but decreases at 90:10. Despite the nonlinearity, all configurations surpass the plain basalt composite benchmark. This trend is consistent for both the 100 and 200 wire mesh densities. For stacking sequence C, [B/WM/B/WM], a nonlinear relationship between stiffness and thickness ratio is observed. The 70:30 configuration shows a decrease in stiffness, while the 90:10 configuration exhibits an increase, although this is slightly lower than the 50:50 configuration. The peak load response follows a similar nonlinear trend, remaining below the benchmark. Notably, the 50:50 configuration outperforms the benchmark in terms of stiffness. In the examination of the [WM/B/WM] stacking sequence, a distinct linear response is observed as the hybrid thickness ratio varies from 50:50 to 90:10. This configuration, with reversed positioning of wire mesh and basalt layers, shows enhanced stiffness and increased peak load with higher thickness ratios. This improvement is consistent across both wire mesh densities, 100 and 200, emphasizing the stacking sequence’s resilience to variations in thickness ratio.

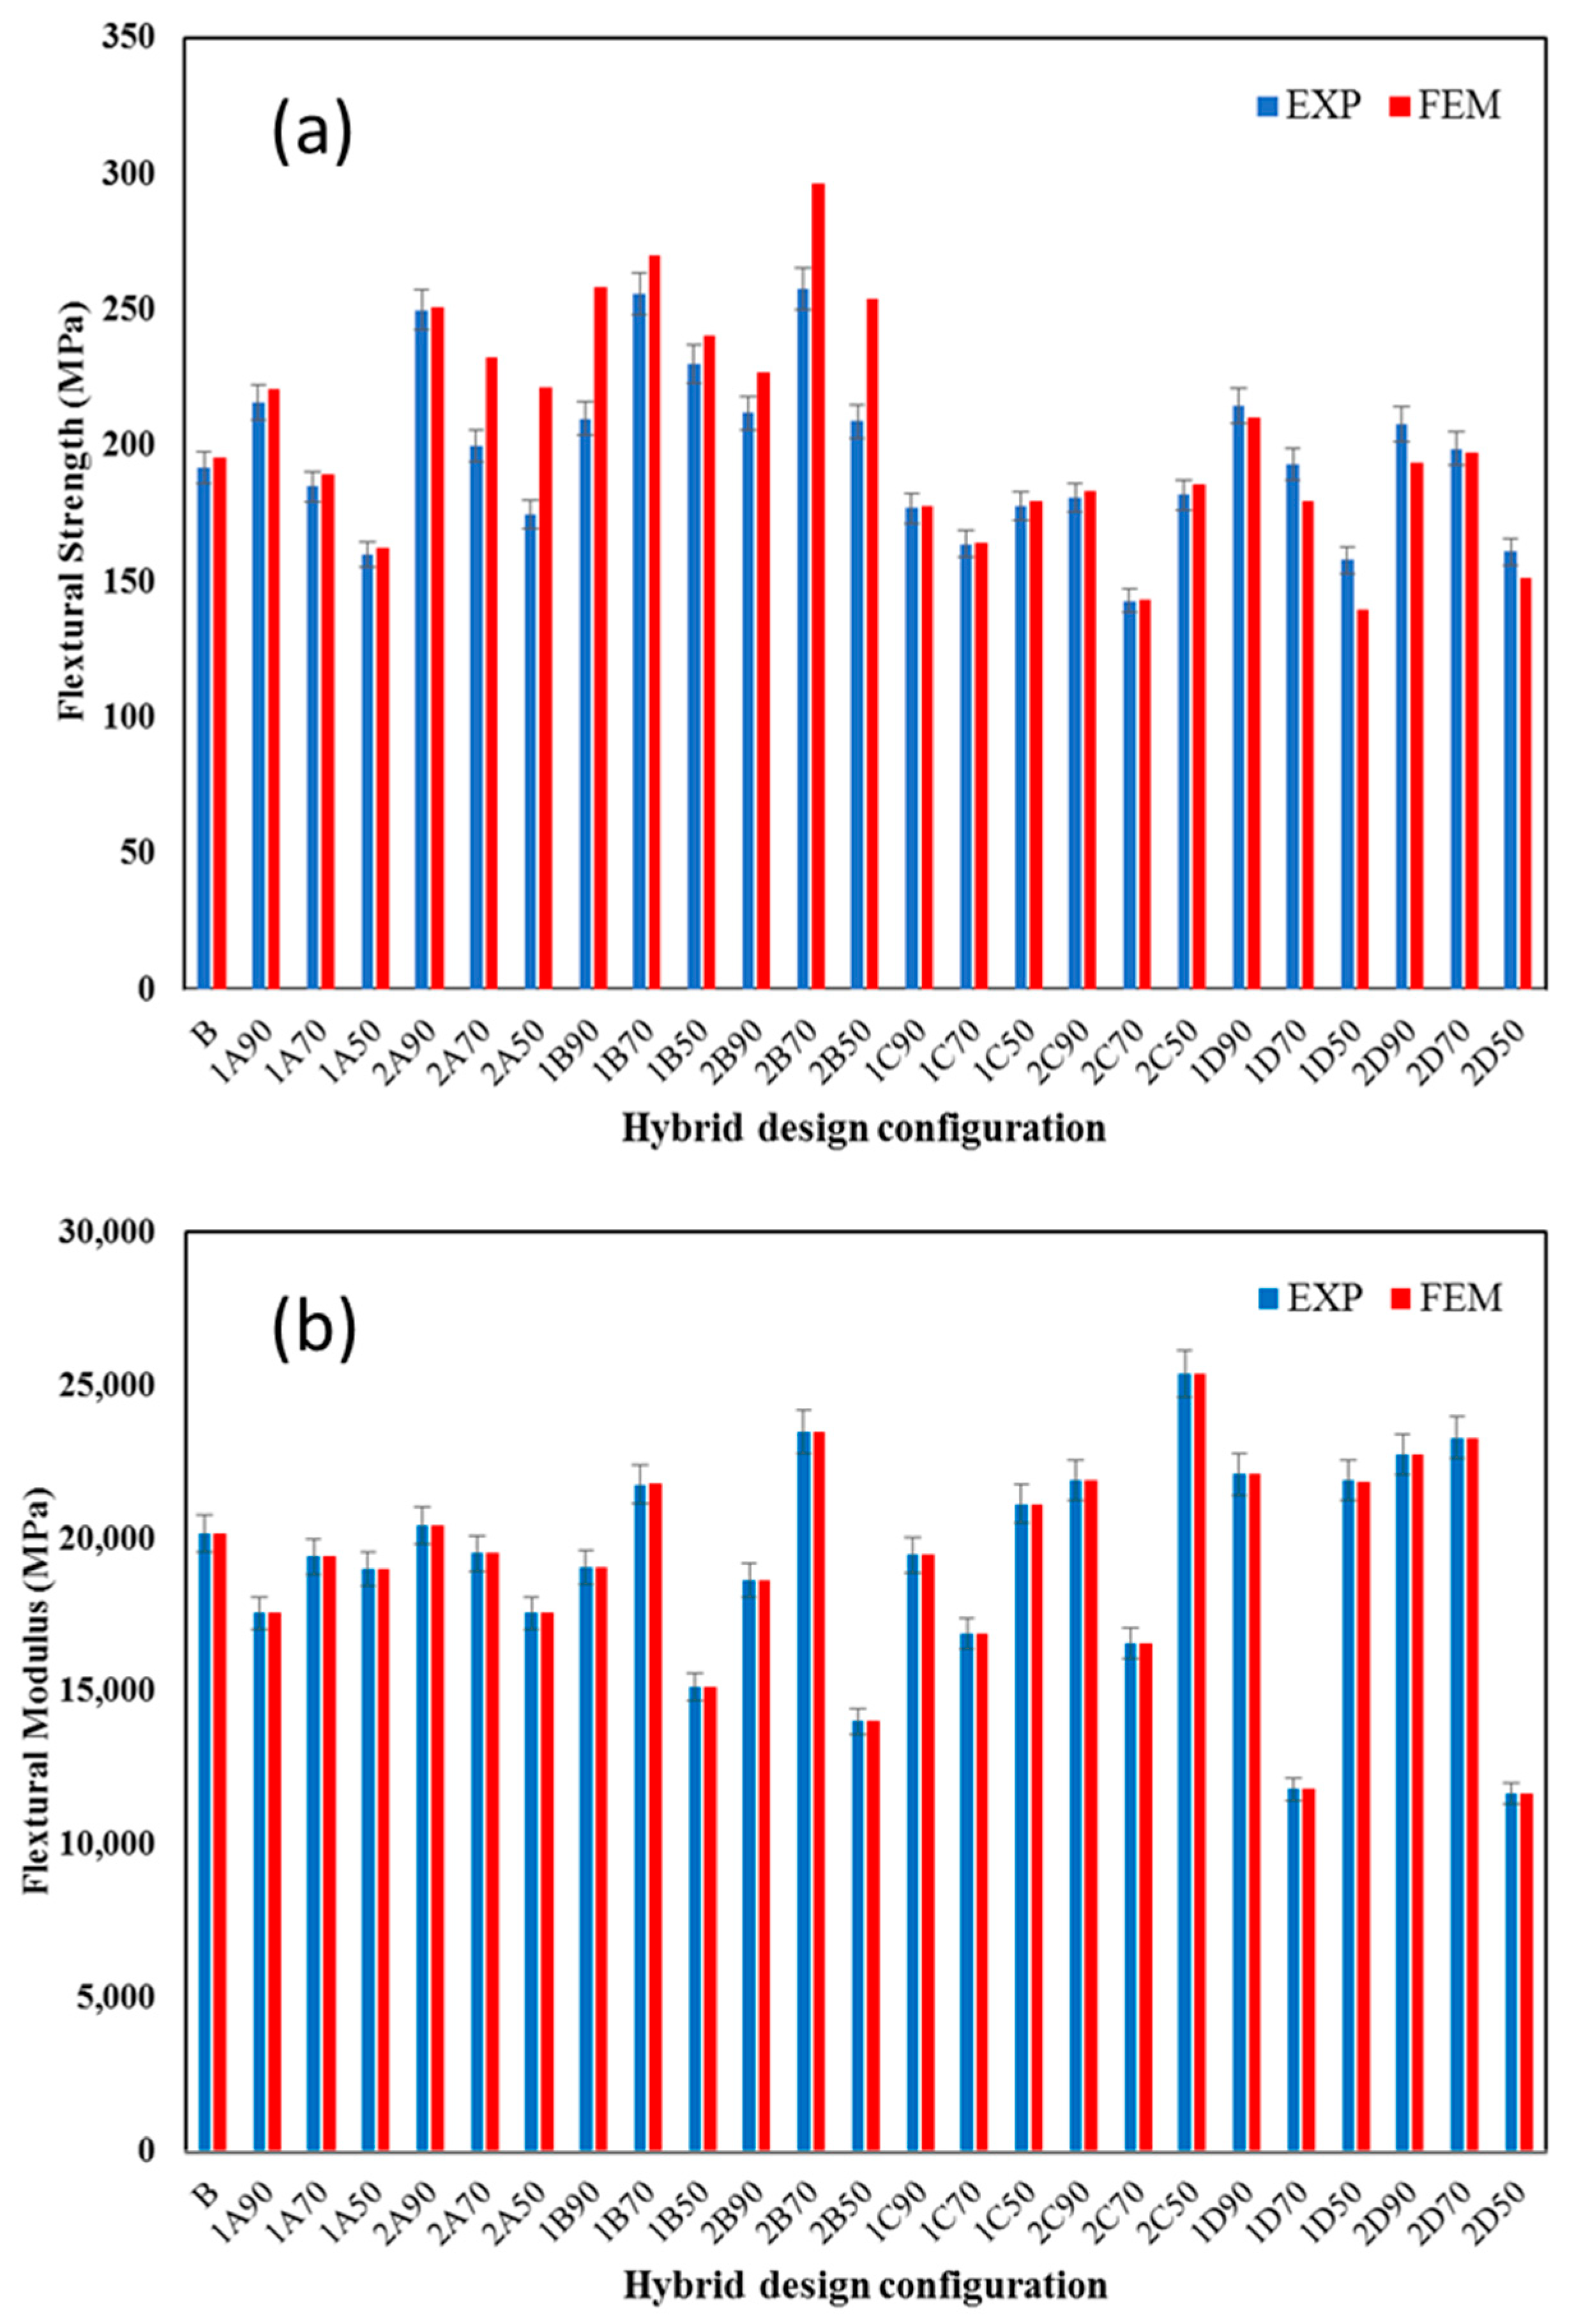
4.5.2. Effect of Stacking Sequences on the Flexural Responses

Figure 26a,b illustrate that stacking sequence A [B/WM/B] demonstrates an upward trend in both flexural strength and modulus as the hybrid thickness ratio increases. Despite variations in wire mesh densities, similar trends persist. However, compared to the plain basalt composite, stacking sequence A showed mixed outcomes. While sample 2A90 exhibited the highest flexural strength, showcasing a notable improvement of 30.112%, other samples, particularly 1A50, 2A50, and 1A70, displayed decreased performance.
The B[WM/B/WM/B] stacking sequence, represented in Figure 26a,b, surpasses the plain basalt composite benchmark in flexural strength across various configurations. Notably, 2B70 exhibits the highest increase in flexural strength, surpassing the benchmark by 34.257%, making it the only configuration to consistently outperform the benchmark. However, in terms of flexural modulus, some configurations experience reduced performance. The stacking sequence C, [B/WM/B/WM], goes against the benchmark set by the plain basalt composite. In terms of flexural strength, all hybrid configurations within stacking sequence C exhibited decreased performance compared to the plain basalt composite. Notably, hybrid composite 2C70 demonstrates the most significant reduction in flexural strength at 25.458%. Similarly, the evaluation of flexural modulus reveals that stacking sequence C generally performs inferiorly compared to the plain basalt composite, with certain configurations experiencing substantial decreases. In contrast, the D [WM/B/WM] stacking sequence exhibits varied performance in flexural strength and modulus, with certain configurations surpassing the plain basalt composite, while others experience reductions in mechanical properties. Notably, 1D90 in [WM/B/WM] demonstrates the highest flexural strength increase, while 1D50 exhibits the lowest flexural strength, showcasing the diverse impact of hybrid configurations on the mechanical properties. Using the basalt sample as the benchmarked specimen, the experimental results and numerical simulations show that the hybrid composite can change the bending strength and flexural modules in either a good or a bad way. Therefore, we can design the most optimal state of a hybrid composite structure at the beginning of the fabrication process by performing a numerical analysis to find the best layer configuration regarding infinitesimal errors. Meanwhile, this structure’s final cost will be significantly lower than that of a plain composite structure.

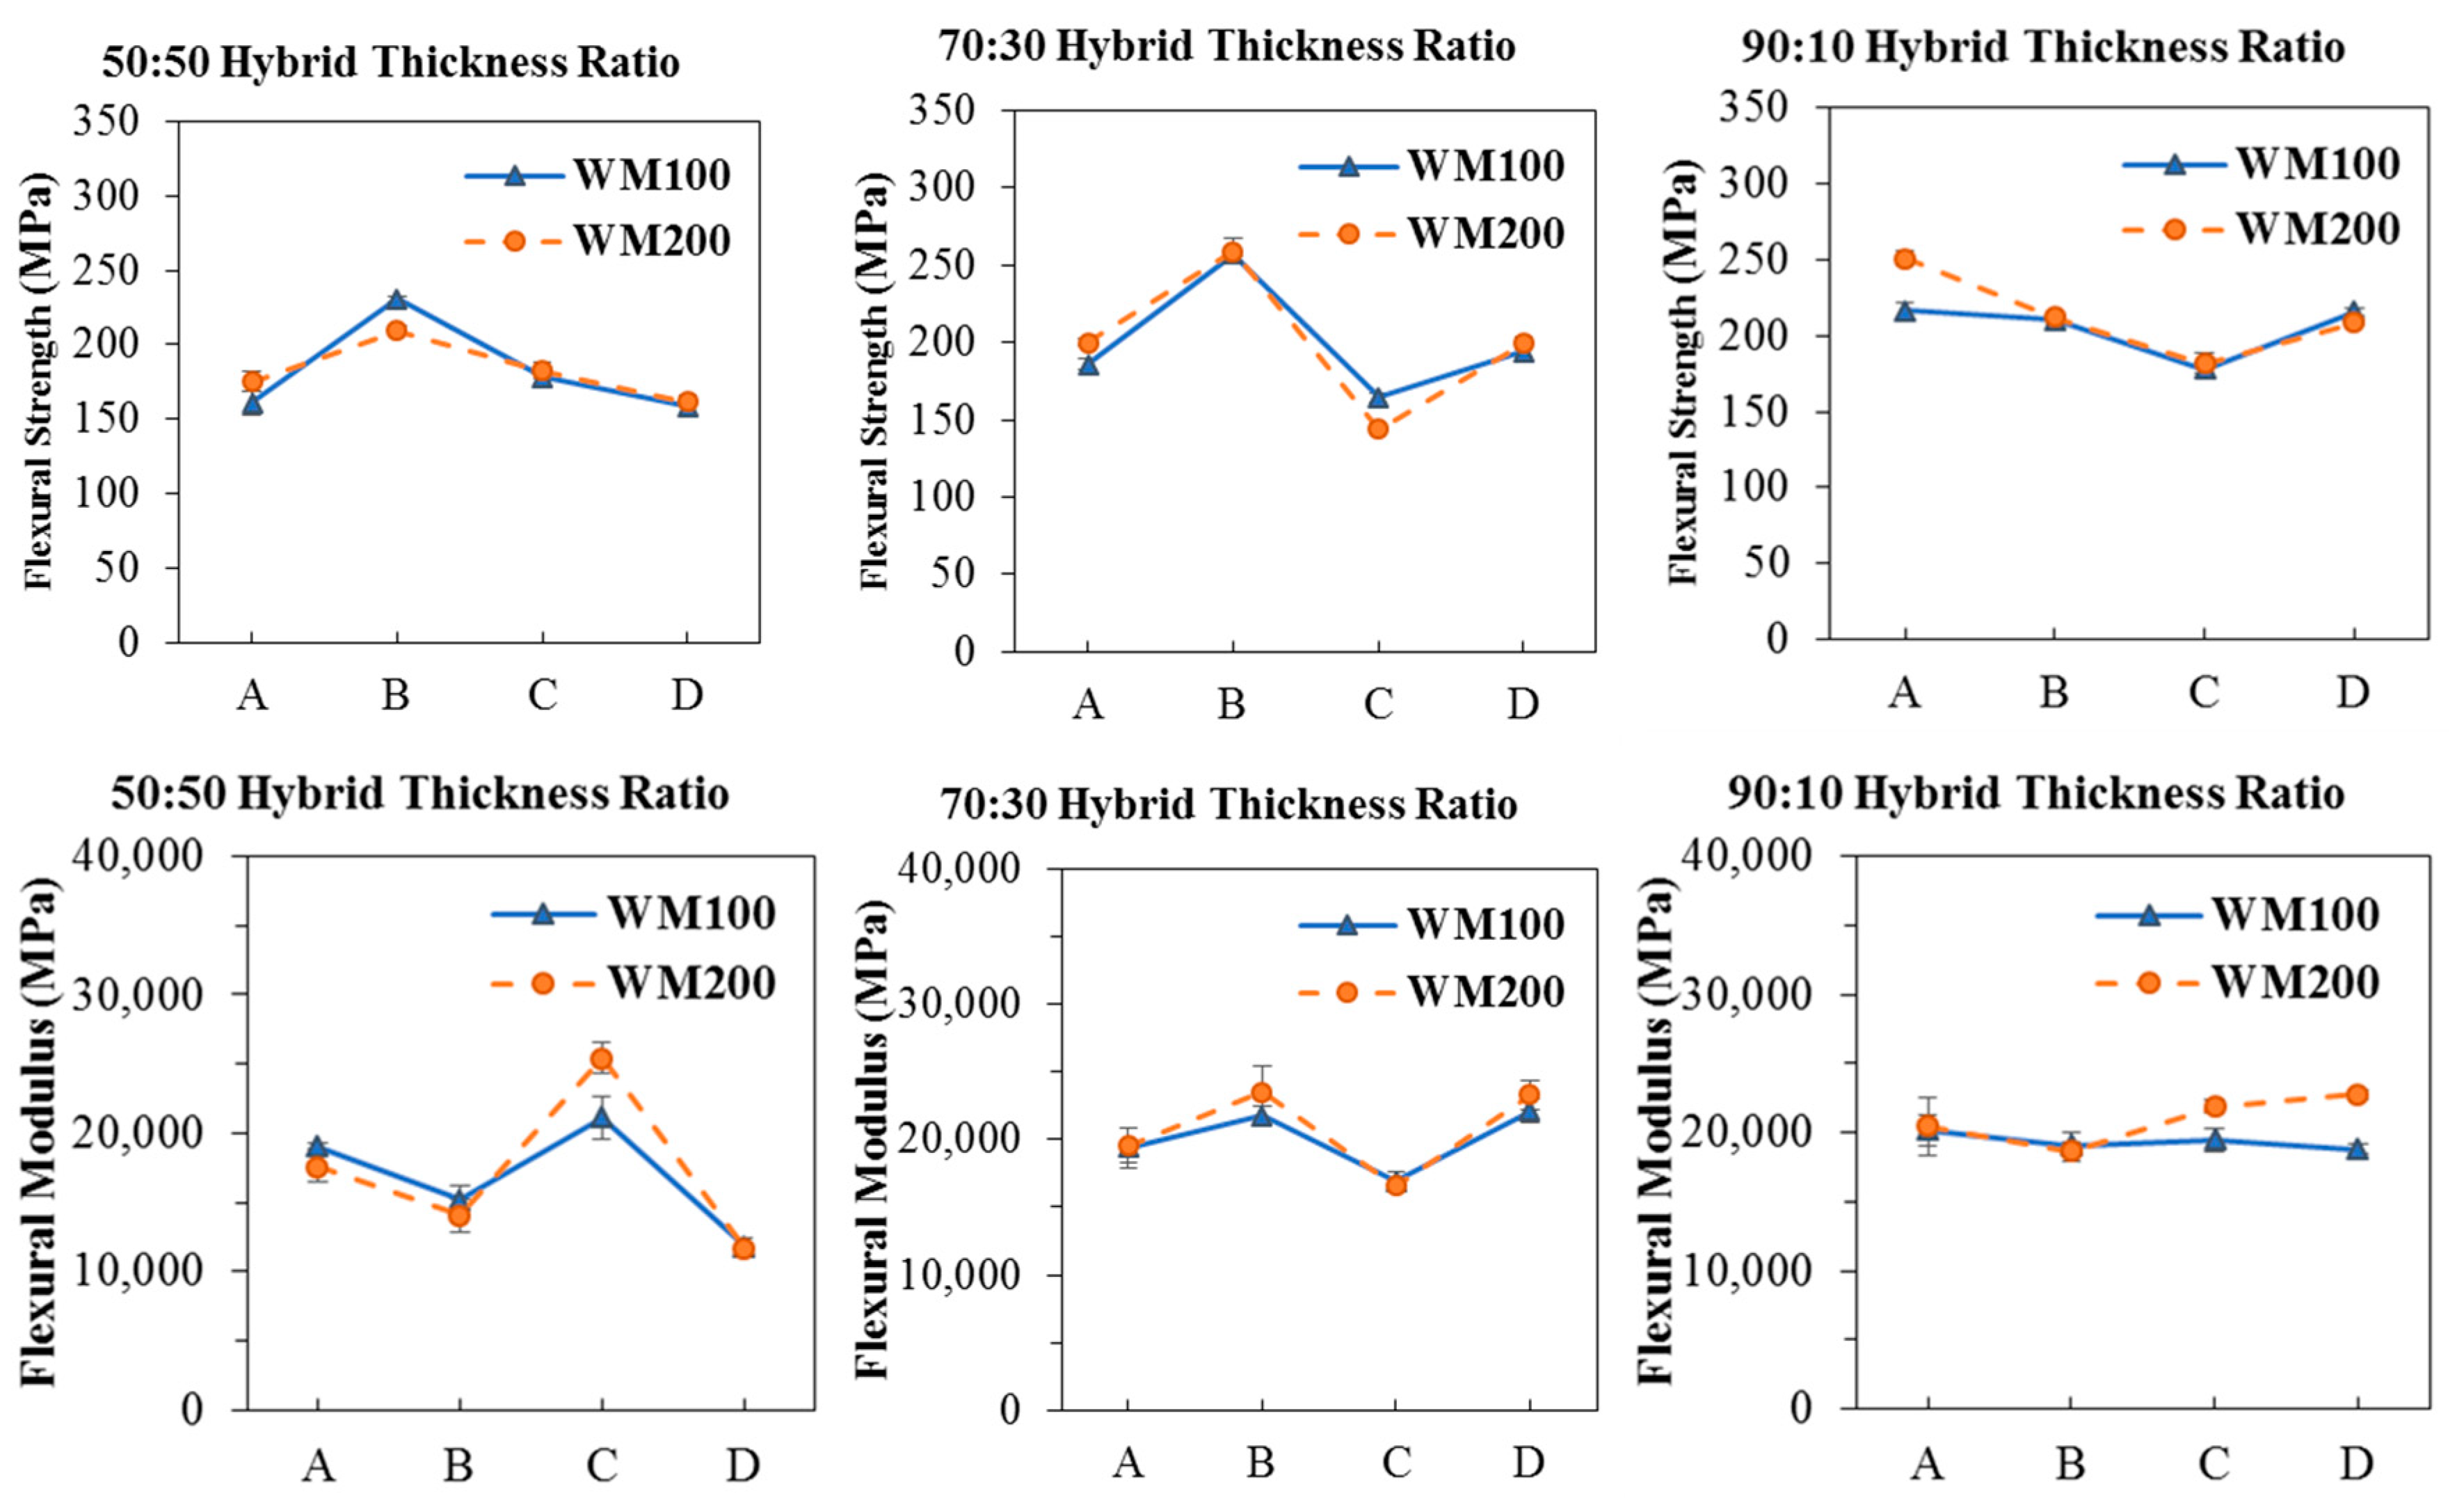
4.5.3. Design Factor Effects on the Structural Responses

The examination of flexural properties reveals distinct trends among the hybrid specimens within different stacking sequences, as shown in Figure 27. Notably, stacking sequence B consistently demonstrates the highest flexural strength, closely followed by D, A, and finally C, as illustrated in Figure 27. Comparative assessments against the plain basalt benchmark further emphasize these trends. For instance, specimens 2B70 and 1B70 exhibit significant increases in flexural strength, surpassing the benchmark by 34.257% and 33.298%, respectively. This trend is consistent across both the 100 and 200 wire mesh densities; this is particularly evident in stacking sequences B and D. In contrast, some samples exhibit reduced flexural strength, with specimen 2C70 showing a considerable decline of 25.458% compared to the benchmark. Similarly, for the flexural modulus, stacking sequence B showcases the highest values, followed by D and A, and finally C. Notably, specimen 2B70 surpasses the benchmark, with the highest modulus increase at 16.322%. Sequentially, 2D70 demonstrates a 15.375% increase, followed by 1D70 (9.446%) and 1B70 (7.864%). Conversely, specimen 2C70 displays a notable decline of 17.9% in the flexural modulus compared to the benchmark.

4.5.4. Failure Mode Analysis

Figure 28 shows the failure modes of different stacking sequences of hybrid laminates under flexural loading. The flexural testing of the A stacking sequence revealed distinct failure modes, influenced by varying thickness ratios and wire mesh densities. In the 50:50 configuration (Figure 28a), micro-buckling predominantly occurred in the basalt layers facing the composite’s surface, leading to kinks as the load increased. Limited damage was observed on the tension side, characterized by whitening regions and tension-induced fractures. The 70:30 configuration (Figure 28b) exhibited a similar failure mode, with clearer micro-buckling in the basalt layers near the neutral axis. The 90:10 configuration (Figure 28c) introduced micro-buckling in the wire mesh layers, resulting in delamination of adjacent basalt layers and tension fractures. These failure modes were consistent for both 100 and 200 wire mesh densities, emphasizing the influence of thickness ratios and wire mesh densities on the B stacking sequence’s failure modes under flexural loading. As the hybrid thickness ratio increased to 90:10, changes in the C stacking sequence’s failure modes occurred. The reduced thickness of the wire mesh layers at the first and third positions, accounting for only 5% of the overall configuration, led to failure in the second basalt layer. Stress transmission to the fourth basalt layer caused delamination due to compression and tension stresses, with tension cracks observed on the outer layer. Micro-buckling in the third wire mesh layer distinguished this configuration, highlighting the intricate role of layer interactions in its failure behavior. These insights provide valuable information on the failure mechanisms and structural behavior of the C stacking sequence during flexural testing. The examination of stacking sequence C during flexural tests revealed distinctive failure modes. Micro-buckling and kinking in the first basalt layer indicated initial signs of failure. As the load increased, the third basalt layer experienced tension forces, while the second wire mesh layer bore compression stress. This led to micro-buckling in the third basalt layer, inducing micro-buckling in the second basalt layer and resulting in delamination. The fourth wire mesh layer in the 50:50 configuration showed permanent deformation without visible cracks, persisting across the 70:30 and 90:10 configurations. Tensile cracks appeared within the 70:30 and 90:10 configurations, highlighting the complexity of the stacking sequence’s structural behavior. These failure modes were consistently observed for both the 100 and 200 wire mesh densities. The investigation of the D stacking sequence’s response to flexural loading revealed a predisposition of basalt layers to failure, primarily due to micro-buckling, as load magnitudes increased. The basalt layers’ failure mechanism led to kinks, causing the wire mesh layers on the facing side to bulge. Failure modes varied with thickness ratios: at 50:50, wire mesh layers showed resilience to tension forces; at 70:30 and 90:10, reduced thickness resulted in tensile cracks. This shift in failure modes underscored the evolving mechanical behavior of the D stacking sequence with changing thickness ratios. The similarity in failure modes between wire mesh densities of 100 and 200 further emphasizes the stacking sequence’s consistent behavior.

5. Conclusions

To characterize the mechanical properties of hybrid steel wire mesh/basalt/epoxy composite laminates, two different sets of experimental tests were carried out in this study. The first test included the characterization of the material properties of plain basalt/epoxy and two different mesh designs of steel wire mesh and epoxy composite laminates. The subsequent sections provide detailed information on the testing procedures for three-point bending flexural tests. Following the creation of samples for both plain laminates and hybrid laminates based on a design of experiments (DOE) matrix, the samples underwent cutting with a diamond saw in accordance with ASTM standards for their respective dimensions. Specifically, hybrid samples were utilized for flexural testing, applying the same testing procedure to develop a finite element (FE) model. The material properties obtained from mechanical testing were then integrated into the modeling of plain and hybrid composite laminate simulations. The second FE model was employed to simulate the behavior of hybrid laminates under flexural loading, and the results were used to validate the model against experimental data. Subsequently, the obtained results underwent statistical analysis, emphasizing the optimal configuration of hybrid composite laminates about two mechanical responses: flexural strength and flexural modulus.

Author Contributions

Conceptualization, investigation, data curation, and writing—original draft were performed by M.Y.B.S., A.F.N. and M.Y.Y.; validation, visualization, methodology, formal analysis, and revision/review/editing—original draft were performed by M.Y.B.S., A.F.N., M.Y.Y., T.D. and S.S.R.K.; supervision, project administrations, resources, and funding acquisition were performed by M.Y.Y. and S.S.R.K. All authors have read and agreed to the published version of the manuscript.

Funding

The authors acknowledge the financial support by “Universität der Bundeswehr München” for the Open Access publication fee.

Data Availability Statement

Data will be available upon a reasonable request.

Acknowledgments

The authors would like to thank the Ministry of Higher Education Malaysia and Universiti Teknologi Malaysia for supporting this work by providing the UTM Fundamental Research Grant (UTMFR) (Q.J130000.3824.22H91). The authors acknowledge the financial support by “Universität der Bundeswehr München” for the Open Access publication fee.

Conflicts of Interest

The authors declare that they have no known competing financial interests or personal relationships that could have appeared to influence the work reported in this paper.

References

  1. Correia, J.R. Fibre-reinforced polymer (FRP) composites. In Materials for Construction and Civil Engineering: Science, Processing, and Design; Springer: Berlin, Germany, 2015; pp. 501–556. [Google Scholar]
  2. Keya, K.N.; Kona, N.A.; Koly, F.A.; Maraz, K.M.; Islam, N.; Khan, R.A. Natural fiber reinforced polymer composites: History, types, advantages and applications. Mater. Eng. Res. 2019, 1, 69–85. [Google Scholar] [CrossRef]
  3. Mlýnek, J.; Koloor, S.S.R.; Martinec, T.; Petrů, M. Fabrication of High-Quality Straight-Line Polymer Composite Frame with Different Radius Parts Using Fiber Winding Process. Polymers 2021, 13, 497. [Google Scholar] [CrossRef]
  4. Diniță, A.; Ripeanu, R.G.; Ilincă, C.N.; Cursaru, D.; Matei, D.; Naim, R.I.; Tănase, M.; Portoacă, A.I. Advancements in Fiber-Reinforced Polymer Composites: A Comprehensive Analysis. Polymers 2023, 16, 2. [Google Scholar] [CrossRef]
  5. Sun, G.; Chen, D.; Zhu, G.; Li, Q. Lightweight hybrid materials and structures for energy absorption: A state-of-the-art review and outlook. Thin-Walled Struct. 2022, 172, 108760. [Google Scholar] [CrossRef]
  6. Shah, I.A.; Badshah, S.; Ahmad, S.; Amjad, M.; Koloor, S.R.; Petru, M.; Khan, R. Finite element analysis of the ballistic impact on auxetic sandwich composite human body armor. Materials 2022, 15, 2064. [Google Scholar] [CrossRef]
  7. Van de Werken, N.; Tekinalp, H.; Khanbolouki, P.; Ozcan, S.; Williams, A.; Tehrani, M. Additively manufactured carbon fiber-reinforced composites: State of the art and perspective. Addit. Manuf. 2020, 31, 100962. [Google Scholar] [CrossRef]
  8. Wang, B.; Gao, H. Fibre reinforced polymer composites. In Advances in Machining of Composite Materials: Conventional and Non-Conventional Processes; Springer: Berlin, Germany, 2021; pp. 15–43. [Google Scholar]
  9. Seffo, M.; Hamcho, M. Strength of Concrete Cylinder Confined by Composite Materials (CFRP). Energy Procedia 2012, 19, 276–285. [Google Scholar] [CrossRef]
  10. Ortiz, J.D.; Dolati, S.S.K.; Malla, P.; Nanni, A.; Mehrabi, A. FRP-reinforced/strengthened concrete: State-of-the-art review on durability and mechanical effects. Materials 2023, 16, 1990. [Google Scholar] [CrossRef]
  11. Feng, G.; Zhu, D.; Guo, S.; Rahman, Z.; Jin, Z.; Shi, C. A review on mechanical properties and deterioration mechanisms of FRP bars under severe environmental and loading conditions. Cem. Concr. Compos. 2022, 134, 104758. [Google Scholar] [CrossRef]
  12. Arora, S.; Chitkara, R.; Dhangar, A.S.; Dubey, D.; Kumar, R.; Gupta, A. A review of fatigue behavior of FRP composites. Mater. Today Proc. 2022, 64, 1272–1275. [Google Scholar] [CrossRef]
  13. Chavhan, G.R.; Wankhade, L.N. Improvement of the mechanical properties of hybrid composites prepared by fibers, fiber-metals, and nano-filler particles–A review. Mater. Today Proc. 2020, 27, 72–82. [Google Scholar] [CrossRef]
  14. Sun, G.; Tong, S.; Chen, D.; Gong, Z.; Li, Q. Mechanical properties of hybrid composites reinforced by carbon and basalt fibers. Int. J. Mech. Sci. 2018, 148, 636–651. [Google Scholar] [CrossRef]
  15. Sanjay, M.A.; Yogesha, B. Studies on mechanical properties of jute/E-glass fiber reinforced epoxy hybrid composites. J. Miner. Mater. Charact. Eng. 2016, 4, 15–25. [Google Scholar] [CrossRef]
  16. Nejad, A.F.; Bin Salim, M.Y.; Koloor, S.S.R.; Petrik, S.; Yahya, M.Y.; Abu Hassan, S.; Shah, M.K.M. Hybrid and synthetic FRP composites under different strain rates: A review. Polymers 2021, 13, 3400. [Google Scholar] [CrossRef] [PubMed]
  17. Subagia, I.A.; Sutantra, N.; Kim, Y.J. Influences Stacking of Basalt-Glass Fabrics Reinforced Epoxy Matrix Hybrid Composites towards Tension Loads. Key Eng. Mater. 2023, 941, 225–231. [Google Scholar] [CrossRef]
  18. Satish, K.; Siddeswarappa, B.; Kaleemulla, K.M. Characterization of in-plane mechanical properties of laminated hybrid composites. J. Miner. Mater. Charact. Eng. 2010, 9, 105. [Google Scholar] [CrossRef]
  19. Carrillo, J.; Cantwell, W. Mechanical properties of a novel fiber–metal laminate based on a polypropylene composite. Mech. Mater. 2009, 41, 828–838. [Google Scholar] [CrossRef]
  20. Gonzalez-Canche, N.; Flores-Johnson, E.; Carrillo, J. Mechanical characterization of fiber metal laminate based on aramid fiber reinforced polypropylene. Compos. Struct. 2017, 172, 259–266. [Google Scholar] [CrossRef]
  21. Truong, G.T.; Choi, K.-K. Tensile behavior of hybrid composites of carbon fibers—Steel wire mesh reinforced polymer. Mech. Adv. Mater. Struct. 2021, 28, 154–166. [Google Scholar] [CrossRef]
  22. Salve, A.; Mache, A. Effect of metallic reinforcement on the mechanical behaviour of a hybrid polymer composite—A review. Mater. Today Proc. 2023, 10, 2200900. [Google Scholar] [CrossRef]
  23. Nag, M.K.; Kumar, P. Fabrication and characterization of laminated natural fibers and SS303 wire mesh reinforced epoxy-based hybrid composite. Proc. Inst. Mech. Eng. Part L J. Mater. Des. Appl. 2024, 238, 73–99. [Google Scholar] [CrossRef]
  24. Megahed, A.; El-Wadoud, F.A.; Wagih, A.; Kabeel, A.M. Effect of incorporating aluminum wire mesh on the notched and un-notched strengths of glass fiber/epoxy composites. Compos. Struct. 2021, 263, 113695. [Google Scholar] [CrossRef]
  25. Pazhanivel, K.; Bhaskar, G.; Elayaperumal, A. Significance of stainless steel wire reinforcement on the mechanical properties of GFRP composites. Int. J. Eng. Technol. 2014, 6, 178–182. [Google Scholar]
  26. Karunagaran, N.; Rajadurai, A. Effect of surface treatment on mechanical properties of glass fiber/stainless steel wire mesh reinforced epoxy hybrid composites. J. Mech. Sci. Technol. 2016, 30, 2475–2482. [Google Scholar] [CrossRef]
  27. Nejad, A.F.; Koloor, S.S.R.; Arifin, M.L.H.; Shafiei, A.; Abu Hassan, S.; Yahya, M.Y. Crashworthiness assessment of carbon/glass epoxy hybrid composite tubes subjected to axial loads. Polymers 2022, 14, 4083. [Google Scholar] [CrossRef] [PubMed]
  28. Committee, D. Test Method for Tensile Properties of Polymer Matrix Composite Materials; ASTM International: West Conshohocken, PA, USA, 2014. [Google Scholar]
  29. ASTM D7264; Standard Test Method for Flexural Properties of Polymer Matrix Composite Materials. ASTM International: West Conshohocken, PA, USA, 2007.
  30. Koloor, S.S.R.; Karimzadeh, A.; Abdullah, M.R.; Petrů, M.; Yidris, N.; Sapuan, S.M.; Tamin, M.N. Linear-nonlinear stiffness responses of carbon fiber-reinforced polymer composite materials and structures: A numerical study. Polymers 2021, 13, 344. [Google Scholar] [CrossRef] [PubMed]
  31. Adams, D.O.; Moriarty, J.M.; Gallegos, A.M.; Adams, D.F. The V-notched rail shear test. J. Compos. Mater. 2007, 41, 281–297. [Google Scholar] [CrossRef]
  32. Nia, A.B.; Nejad, A.F.; Xin, L.; Ayob, A.; Yahya, M.Y. Energy absorption assessment of conical composite structures subjected to quasi-static loading through optimization based method. Mech. Ind. 2020, 21, 113. [Google Scholar] [CrossRef]
Figure 1. Fibers used: (a) basalt fabric, (b) wire mesh with density of 100, and (c) wire mesh with density of 200. (d) Wire mesh configuration.
Jcs 08 00184 g001
Figure 2. Stacking sequences (a) A (B/WM/B), (b) B (WM/B/WM/B), (c) C (B/WM/B/WM), and (d) D (WM/B/WM) for hybrid basalt (green area)–stainless-steel wire mesh (light brown).
Jcs 08 00184 g002
Figure 3. Hybrid thickness ratio for stacking sequence A.
Jcs 08 00184 g003
Figure 4. Sample fabrication procedure: (a) precut material layers weighed on the scale; (b) mold preparation and polishing; (c) placement of laminates, peel ply, and netting, as well as connector tubing; (d) placement of plastic film and sealant; (e) vacuum leaking test; (f) resin infusion through vacuum in progress.
Jcs 08 00184 g004
Figure 5. The flowchart of research methodology and procedure.
Jcs 08 00184 g005
Figure 6. (a) Tensile test setup on Instron 5980 machine; (b) tensile specimen dimension.
Jcs 08 00184 g006
Figure 7. Tensile stress–strain curve for the plain composite specimens (example curves of plain WM100, plain WM200, and plain basalt).
Jcs 08 00184 g007
Figure 8. Setup of experiment for compression test (left) Instron 5980 Compressive testing machine; (right) test specimens for compression test based on ASTM D3410.
Jcs 08 00184 g008
Figure 9. Load vs. displacement graph for plain composites specimen under compressive loading. A sample curves of plain WM100, plain WM200, and plain basalt.
Jcs 08 00184 g009
Figure 10. (a) Specimen with a strain gauge attached; (b) two halves of shear fixture; (c) experimental setup on Instron 5980; (d) specimen placement on the fixture.
Jcs 08 00184 g010
Figure 11. Stress–strain curve of all plain composite specimens under shear loading (example curves of plain WM100, plain WM200, and plain basalt).
Jcs 08 00184 g011
Figure 12. (Left) Schematic view of the sample subjected to three-point bending; (right) flexural testing setup.
Jcs 08 00184 g012
Figure 13. Finite element model for simulation: (a) tensile testing, (b) compression testing, and (c) shear testing.
Jcs 08 00184 g013
Figure 14. A perspective view of the FE model to simulate the sample under a three-point bending test.
Jcs 08 00184 g014
Figure 15. Experimental data for (a) tensile strength and (b) tensile modulus of plain composites specimen.
Jcs 08 00184 g015
Figure 16. Comparison between the experimental and FEM tensile stress–strain curves for plain composite specimens.
Jcs 08 00184 g016
Figure 17. Experimental data for compressive stress of plain composite specimens.
Jcs 08 00184 g017
Figure 18. Comparison between experimental and FEM compressive stress–strain curve for plain composite specimens.
Jcs 08 00184 g018
Figure 19. Experimental data for (a) shear stress and (b) shear modulus of plain composite specimens.
Jcs 08 00184 g019
Figure 20. Comparison between the experimental and FEM shear stress–strain curve for the plain composite specimens.
Jcs 08 00184 g020
Figure 21. Load–displacement curves for plain composites under flexural loading.
Jcs 08 00184 g021
Figure 22. Experimental data for (a) flexural strength and (b) flexural modulus of plain composite specimens.
Jcs 08 00184 g022
Figure 23. Damage failures of (a) plain basalt, (b) plain WM100, and (c) plain WM200.
Jcs 08 00184 g023
Figure 24. Damaged zone and bending stress at the deformed part of a hybrid composite, FEM vs. experiment.
Jcs 08 00184 g024
Figure 25. Comparison between load–displacement curves of flexural test for different configurations of hybrid composite laminates through FEM and experimental test for results validation.
Jcs 08 00184 g025
Figure 26. Mechanical responses of hybrid composite laminate with different configurations under flexural testing: (a) flexural strength and (b) flexural modulus.
Jcs 08 00184 g026
Figure 27. Effect of different factors on the mechanical responses of hybrid composite laminate under flexural loading.
Jcs 08 00184 g027
Figure 28. Failure mode and fracture cross-section of different hybrid laminate designs (a) 50:50 B/W configuration (b) 70:30 B/W configuration (c) 90:10 B/W configuration under flexural loading.
Jcs 08 00184 g028
Table 1. Stainless-steel wire mesh density properties.
TypeMesh Densities
(Mesh Number)
Wire Diameter
(mm)
Aperture Size
(mm)
Open Area
(%)
11000.10.15436.76
22000.050.0736.76
Table 2. Epoxy and hardener properties.
DER 331 Epoxy ResinDescription
TypeDGEBA
Epoxide Equivalent Weight182–192
Viscosity@25 °C11,000–14,000
Density (25 °C, g/cm3)1.16
Jointmine 903 hardener
Viscosity@25 °C200–400
Thin Film Set Time (@25 °C)5 h
Hardness (Shore D)85
Table 3. Plain and hybrid designation and their fiber volume fractions.
Sample DesignationNumber of LayersFiber Volume Fraction (%)
BasaltWire MeshBasaltWire MeshTotal
B24-47.120-47.120
WM100-20-38.48238.482
WM200-38-32.79732.797
1A9022244.1753.04147.215
1A7016634.5139.52844.041
1A50121025.37315.42940.802
2A9022444.2133.20747.420
2A70161234.6169.71644.332
2A50121826.80415.67342.477
1B9022245.6683.63249.299
1B7016634.3619.46343.824
1B50121025.77915.66341.442
2B9022444.7083.14147.849
2B70161236.11710.08046.197
2B50121825.31014.60039.910
1C9022246.0373.76749.804
1C7016634.93611.61246.547
1C50121025.12818.69143.820
2C9022445.9043.15949.063
2C70161235.70810.29846.005
2C50121826.57315.44442.017
1D9022244.5732.90547.478
1D7016636.56211.99648.557
1D50121024.51518.63243.147
2D9022446.6353.26149.896
2D70161234.3269.83044.156
2D50121826.37615.13241.508
Table 4. Design of experiment matrix for flexural testing.
RunFactor 1Factor 2Factor 3
A: Thickness RatioB: Mesh DensityC: Layer Config
150/50100B
290/10200A
390/10200B
470/30100B
550/50200C
690/10200D
790/10100C
890/10100A
970/30200B
1050/50100C
1170/30200D
1290/10100D
1390/10200C
1450/50200A
1590/10100B
1670/30100D
1770/30100C
1850/50200B
1970/30200C
2070/30100A
2150/50200D
2250/50100A
2350/50100D
2470/30200A
25100% Basalt-------
26100% steel wire mesh100----
Table 5. Mechanical properties data for all plain composites.
PropertiesDescriptionBasalt/EpoxySteel Wire Mesh/Epoxy 100Steel Wire Mesh/Epoxy 200
ρ Density (kg/m3)160023002280
E 11 Young’s modulus in the longitudinal direction (GPa)19.92.82.3
E 22 Young’s modulus in transverse direction (GPa)19.92.82.3
ϑ 12 Poisson’s ratio0.290.30.3
G 12 In-plane shear modulus (GPa)2.71.912.31
G 23 Out-of-plane shear modulus (GPa)2.71.912.31
X T Longitudinal tensile strength (MPa)455128102
X C Longitudinal compressive strength (MPa)455128102
Y T Transverse tensile strength (MPa)1207876
Y C Transverse compressive strength (MPa)1207876
S C Shear strength (MPa)1009189
Disclaimer/Publisher’s Note: The statements, opinions and data contained in all publications are solely those of the individual author(s) and contributor(s) and not of MDPI and/or the editor(s). MDPI and/or the editor(s) disclaim responsibility for any injury to people or property resulting from any ideas, methods, instructions or products referred to in the content.

