
Genetic Basis for Morphological Variation in the Zebrafish Danio rerio: Insights from a Low-Heterozygosity Line


Department of Biological Sciences, University of North Texas, Denton, TX 76203, USA
*
Author to whom correspondence should be addressed.
Fishes 2024, 9(5), 164; https://doi.org/10.3390/fishes9050164
Submission received: 10 April 2024
/
Revised: 23 April 2024
/
Accepted: 30 April 2024
/
Published: 2 May 2024
(This article belongs to the Section Genetics and Biotechnology)
Abstract
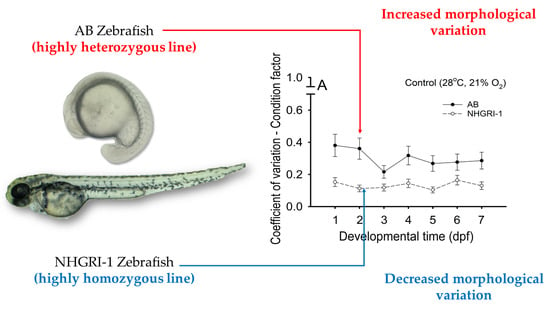
:Data variability complicates reproducibility and the interpretation of experimental results. Different animal models have been employed to decrease variability to enhance experimental power. However, variation frequently persists among and within strains/lines. In zebrafish (Danio rerio), inbred lines (e.g., NHGRI-1) derived from wild-type lines have been produced to greatly decrease genetic variation, with the goal of providing better understanding of genetic backgrounds that may influence the experimental outcome of studies employing such lines. We hypothesized that variations in morphological phenotypes shaped by environmental stressors early in development are correlated with the intrinsic degree of genetic variability of zebrafish lines. We compared morphological variability (yolk–chorion ratio, body mass, embryo mass, total length, condition factor, and specific growth rate) in wild-type AB and NHGRI-1 zebrafish lines as a function of their responses to altered temperature and oxygen availability during the first 7 days post-fertilization. Overall, both lines showed similar developmental trajectories for yolk–chorion ratio, embryo mass, and total length. Additionally, condition factor and specific growth rate showed similar responses within each line, regardless of temperature and hypoxia. Importantly, the coefficient of variation for each variable was significantly lower in NHGRI-1 than AB larvae for 151 of 187 assessed morphological endpoints. Thus, the low-heterozygosity NHGRI-1 zebrafish line can be useful for decreasing inter-individual variation in morphological responses to environmental stressors, thereby aiding in the interpretation of results and enhancing experimental reproducibility.
Keywords:
variation; low heterozygosity; condition factor; specific growth rate; coefficient of variation; NHRGI-1 zebrafishKey Contribution: Using animal models with low genetic variability during experimentation facilitates reproducibility. Here, we show how the morphology of early NHGRI-1 zebrafish (low-heterozygosity line) has less variation than wild-type AB zebrafish.
1. Introduction
The reproducibility of experiments is of increasing concern in scientific research [1]. In a 2016 survey, ~70% of researchers stated that they were not able to reproduce data from other researchers and, occasionally, their own [2]. The reliability of data acquisition and processing depends on numerous factors, including researcher biases, experimental power, number of studies about a certain topic, insufficient reporting of methods, and animal husbandry—that is, variation produced by how data are collected by researchers [3,4,5]. However, a lack of reproducibility can also result from differences in phenotypes or genotypes between individuals in the experiments [4,6,7,8,9].
The zebrafish (Danio rerio) is a widely used animal model for biological and medical research (among other fields) because of their similarities with human genomes, transparent embryos to assess development, low husbandry costs, etc.—for a recent review, see [10,11,12,13]. However, the lack of uniformity in zebrafish genetic backgrounds has limited their definition as ‘inbred strains’ (to reduce genetic variability) or ‘outbred stocks’ (to increase genetic variability), both of which limit their reproducibility [7]. Zebrafish from natural populations show higher genetic variation than laboratory lines [14], and the genetic background of zebrafish lines varies among laboratories and/or facilities [15]. Differences in the swimming performance, behavior, growth, and regulation of gene expression have been identified among different zebrafish lines [16,17,18,19,20,21,22,23].
The use of homozygous strains/lines is generally employed in experimentation which requires low variability in their genetic background to facilitate the reproducibility of results because of their lower heterozygosity and long-term stability [24,25]. Despite the existing evaluation of different traits between homozygous and heterozygous strains/lines (see references above), most information is related to genetic studies including single-nucleotide polymorphism (SNP) variation, assessing copy number variants between zebrafish lines, the role of xenosensors in nuclear receptor function, building genetic repositories, and comparing genetic backgrounds from wild and inbred populations, [14,15,25,26,27,28], with little study in this context of morphology, physiology, or behavior.
The AB line was a zebrafish line produced for laboratory work, and it is still widely used [7]. AB fish are believed to come from the ornamental fish trade in North America, farmed in Southeast Asia and the southeast USA [29]. Their genetic variability is high because of the great number of sublines globally available [7]. The need for a strain with a better-understood genetic background has led to the generation of the NHGRI-1 line, which possesses a lower degree of heterozygosity than wild-type lines (~10–15% from AB wild-type) [7,30].
The aim of the current study was to assess the variability in yolk–chorion ratio, body mass, embryo mass, total length, condition factor, and specific growth rate in AB and NHGRI-1 zebrafish lines as a function of temperature and oxygen availability during the first 7 dpf (day post-fertilization). We hypothesized that key characteristics of morphological phenotypes would show lower variation in embryos and larvae of the inbred NHGRI-1 line compared to the wild-type AB zebrafish. We tested this hypothesis specifically in the early developmental stages to eliminate potential epigenetic effects or uncontrolled environmentally induced variation accumulated over the period of growth throughout the first seven days of development, and because zebrafish are an important model system of ontogenetic development [31,32].
2. Materials and Methods
2.1. Fish Sources and Breeding
Embryos and larvae of AB and NHGRI-1 zebrafish were obtained from colonies of breeding adults held at the Department of Biological Sciences, University of North Texas. AB fish were originally purchased from Ekkwill Waterlife Resources (Ruskin, FL, USA), while adult NHGRI-1 fish were purchased from the Zebrafish International Resource Center (ZIRC) (Eugene, OR, USA). One hour after breeding, fertilized eggs were divided into experimental groups (described below). Larvae were fasted and maintained in an adequate medium for rearing embryonic and larval fish—E3 medium [31,33]—throughout experimentation. Fifty percent of the medium was gently replaced daily. Dead embryos/larvae were removed using a plastic pipette. Larvae at all stages were maintained in 14/10 h light and darkness, respectively.
2.2. Experimental Design
Five groups were generated for each of the two lines: (1) control at 28 °C in normoxia at ~7.8 mg L−1 O2 (~21 kPaO2), (2) low temperature (23 °C in normoxia), (3) high temperature (33 °C in normoxia), (4) moderate hypoxia at ~4.9 mg L−1 O2 (~13 kPaO2at 28 °C), and (5) severe hypoxia at ~3.7 mg L−1 O2 (~10 kPaO2 at 28 °C). Each group contained three replicates and 100 viable embryos were utilized per replicate. Individuals were exposed to each condition from 1 hpf (hour post fertilization) through 7 dpf. Control and high temperature groups were maintained in incubators (Hera Cell 240i, Fisher Scientific, Pittsburgh, PA, USA) provided with airflow throughout experimentation. Hypoxic groups were maintained in incubators (MCO-5M-PA, Panasonic, American Laboratory Trading, East Lyme, CT, USA) supplied with a controlled mix of air and nitrogen generating the required oxygen level. Air and nitrogen were regulated with flow meters (Lab-Crest Century 100H, Cole-Palmer, Vernon Hills, IL, USA) and empirically adjusted to ~4.86 and 3.73 mg L−1 O2 for moderate and severe hypoxia, respectively. Oxygen levels were assessed every 24 h using a Beckman oxygen analyzer (OM-11, Beckman Coulter Inc., Brea, CA, USA) calibrated to 100% air saturation.
All procedures in this study were carried out under approval of the Institutional Animal Care and Use Committee of the University of North Texas (IACUC—21002).
2.3. Assessed Variables
All morphological variables were measured every 24 h throughout experimentation. Fifteen fish were sampled to assess each variable. Embryos were mechanically dechorionated under a dissecting microscope using fine-tip forceps before processing, except for Yolk/Chorion ratio calculations. Embryos and larvae were fixed in 10% aqueous buffered zinc formalin (Z-Fix; Electron Microscopy Sciences, Hatfield, PA, USA) for 24 h, rinsed in 1X PBS, and immediately processed.
Yolk/chorion Ratio (YCR). Embryos were photographed under a dissecting microscope before fixation with a camera (Leica MDC6200) using the software Leica Application Suite V 3.4.0. Images were analyzed in the software ImageJ 1.53k [34]. The area of the egg and the area occupied by the embryo were calculated. The area of the embryo was divided by the total area of the egg and multiplied by 100 to obtain YCR as a percentage.
Body Mass (BM). Embryos and larvae were weighed using a Mettler Toledo XA105 digital scale to determine ‘body mass’. Then, the yolk was removed from the embryos/larvae, which were then re-weighed under the same protocol to obtain the ‘embryo mass’ (EM).
Total length (LT). Embryos and larvae were photographed and measured using ImageJ 1.53k to obtain LT in millimeters.
Specific growth rate (SGR). Percentage growth per day was calculated as SGR = 100 × (ln EMt − ln EMi) ÷ t [36], where EMt represents wet body mass of the embryo at each specific endpoint, EMi represents the wet mass of the embryo at 24 hpf, and t represents time.
2.4. Statistics
Data were separated as temperature and hypoxia experiments for analysis. The graphical representation of results is presented only for the integrated variables condition factor (K) and specific growth rate (SGR); the rest are presented as tables. Changes in variables as a function of developmental time and experimental groups were assessed with two-way ANOVAs. Multiple comparison Holm–Sidak tests [37,38] were carried out to determine differences within time and experimental groups.
Variability between fish lines for each variable at a given time was quantified by calculating the coefficient of variability, CV, associated with the mean values of each morphological variable. Microsoft Excel 2023 was used to calculate CV from the equation CV = σ’ ÷ ; where σ’ represents the standard deviation and represents the mean [39]. Differences between CV of wild-type AB and NHGRI-1 lines were tested for significance using a Z-test. Two-way ANOVAs at a 0.05 confidence level and figures were generated in SigmaPlot V.12.3.
3. Results
3.1. Body and Embryo Mass
Body mass in the AB control embryos at 1 dpf was 248 ± 8 mg, rising to 314 ± 11 mg in 7 dpf larvae. All experimental groups showed gradual increases in body mass from 1 to 7 dpf (p < 0.001, Table 1), apart from the high-temperature groups from both lines. Larvae from the high-temperature groups from both lines showed an initial increase (p < 0.001) in BM (301 ± 8 to 337 ± 13 µg in AB larvae; 243 ± 4 to 300 ± 5 µg in NHGRI-1 larvae). However, by the end of the experiment at 7 dpf, both lines showed significantly decreased (p < 0.001) BM (293 ± 9 µg, 276 ± 5 µg) compared to their highest values (Table 1). Significant differences were more evident in NHGRI-1 fish than in AB individuals. By the end of the hypoxic experiments, larvae from severe hypoxia treatments showed significantly lower (p < 0.001) BM compared to controls (266 ± 3 and 286 ± 4 µg, respectively) (Table 1).
The control larvae and the low- and high-temperature (only NHGRI-1), moderate hypoxia, and severe hypoxia larval groups showed significant (p < 0.001), gradual increases in EM. In contrast, high-temperature AB embryos and larvae increased (120 ± 4 to 300 ± 11 µg) from 1 to 6 dpf, but by 7 dpf, the EM of high-temperature larvae decreased (280 ± 8 µg; p < 0.001; Table 1). By the end of the experiments, AB larvae from the high-temperature, moderate hypoxia, and severe hypoxia treatments showed significantly (p < 0.001) lower EM (280 ± 8 µg; 270 ± 9 µg, and 260 ± 9 µg, respectively) compared to control larvae (300 ± 10 µg; Table 1). Low- and high-temperature NHGRI-1 larvae showed increased EM (260 ± 4.2 µg and 270 ± 5.6 µg, respectively) compared to controls (250 ± 4 µg), while larvae from mild and severe hypoxia showed significantly (p < 0.001) decreased EM (230 ± 38 µg and 210 ± 2 µg, respectively) (Table 1).
3.2. Total Length
The total length in control embryos-to-larvae increased from 2.5 ± 0.03 mm at 1 dpf to 4.4 ± 0.1 mm at 7 dpf. Continuous, significant (p < 0.001) increases in LT occurred in all experimental groups across developmental time. After 7 dpf, the highest LT was observed in high-temperature larvae from both lines (4.7 ± 0.2 mm in AB larvae, 4.2 ± 0.04 mm in NHGRI-1; p < 0.001; Table 1). Neither high-temperature nor moderately hypoxic larvae showed a significant difference (p > 0.05) (4.1 ± 0.1 mm in AB, 3.4 ± 0.1 mm in NHGRI-1) from their controls, which were themselves significantly (p < 0.001) different (4.4 ± 0.1 mm in AB, 3.9 ± 0.1 in NHGRI-1; Table 1). AB and NHGRI-1 larvae from severe hypoxia showed significantly (p < 0.001) lower LT (4.0 ± 0.1 mm and 3.3 ± 0.04 mm, respectively) than their respective controls by 7 dpf (Table 1).
3.3. Yolk/Chorion Ratio
The yolk/chorion ratio in control AB embryos at 1 dpf was 38 ± 1%, rising to 56 ± 2% at 2 dpf and peaking at 64 ± 2 before hatching at 3 dpf (Table 1). Both low- and high-temperature AB embryos had increased YCR (47 ± 1.4 and 50 ± 2%, respectively) compared to their controls by 1 dpf. Prior to hatch, no differences (p > 0.05) were observed in YCR between low-temperature AB embryos and their controls. Moderate and severe hypoxic AB embryos showed significantly lower YCR than their controls from 1 to 3 dpf, ranging from 38 ± 1.5 to 54 ± 2%. Control NHGRI-1 embryos had a YCR of 43 ± 0.7% by 1 dpf and 52 ± 1.6 prior to hatching (Table 1). By 1 dpf, only high-temperature NHGRI-1 embryos showed significant differences compared to their controls (53 ± 2 vs. 43 ± 0.7%). No significant differences (p > 0.05) in YCR were observed among NHGRI-1 groups prior to hatch. No significant differences (p > 0.05) across developmental time were observed in any NHGRI-1 group, except for the high-temperature group.
Additionally, the time to hatch in control AB zebrafish was ~4 dpf, and it was delayed by low temperature and accelerated by high temperature (~5 and ~2 dpf, respectively). Hypoxia did not affect the time to hatch in AB zebrafish (Table 1). Similarly, control NHGRI-1 zebrafish hatched at ~3 dpf. Time to hatch was delayed (~4 dpf) in the low temperature and both hypoxic groups, while high temperature decreased the time to hatch to ~2 dpf (Table 1).
3.4. Condition Factor
The condition factor in control larvae decreased from ~1.0 at 1 dpf to ~0.5 at 7 dpf in AB individuals and from ~1.9 (1 dpf) to ~0.5 (7 dpf) in NHGRI-1 embryos and larvae. Gradual decreases in K occurred during development in larvae from all experimental groups (Figure 1A–D). In general, no significant differences (p > 0.05) occurred among experimental groups after low/high temperature or hypoxia exposure in AB larvae (Figure 1A,B). At 1 dpf, NHGRI-1 embryos from low- and high-temperature groups showed significantly (p < 0.001) lower K (1.7 ± 0.1 and 1.2 ± 0.04, respectively) compared to control embryos (1.9 ± 0.1; Figure 1C). At the end of the exposures on 7 dpf, low-temperature NHGRI-1 larvae showed the highest K (0.7 ± 0.03), and high-temperature NHGRI-1 larvae showed the lowest K (0.4 ± 0.01; p < 0.001; Figure 1C). Among the hypoxic exposures in NHGRI-1 embryos and larvae, significant differences (p < 0.001) were observed only at 1, 2, and 7 dpf (Figure 1D). By 1 dpf, control embryos exhibited significantly (p < 0.001) lower K (1.9 ± 0.1) than embryos from moderate and severe hypoxia (2.5 ± 0.2 and 2.2 ± 0.1, respectively; Figure 1D). The highest K at 2 dpf was observed in severe hypoxia embryos (1.4 ± 0.1; p < 0.001), while moderate hypoxia embryos and controls were not significantly (p > 0.05) different (1.1 ± 0.04 and 1.2 ± 0.04, respectively; Figure 1D). By 7 dpf, only the severely hypoxic larvae had significantly (p < 0.001) different K from controls (0.7 ± 0.02 and 0.5 ± 0.02, respectively; Figure 1D).
3.5. Specific Growth Rate
The specific growth rate in control larvae ranged from ~13 to ~18% day−1 in AB embryos and larvae and from ~4 to 27% day−1 in NHGRI-1 fish. In AB larvae, SGR from 2 to 5 dpf was lower in low-temperature embryos and larvae compared to controls (p < 0.001; Figure 2A). In contrast, from 1 to 2 to 4 dpf, high-temperature embryos and larvae had significantly (p < 0.001) higher SGR than controls (Figure 2A). No significant (p > 0.05) differences occurred at 6 and 7 dpf. Both moderate and severe hypoxia AB embryo and larval groups from 2 to 5 dpf exhibited significantly (p < 0.001) lower SGR than in controls (Figure 2B). No significant (p > 0.05) differences occurred at the end of the experiment on 7 dpf. NHGRI-1 embryos and larvae from both low- and high-temperature groups showed significantly (p < 0.001) higher SGR than controls from 2 to 6 dpf. By 7 dpf, low-temperature larvae showed significantly (p < 0.001) higher SGR (35.0 ± 0.6% day−1) than control and high-temperature larvae (both 27 ± 1% day−1; Figure 2C). The hypoxic larvae group had significantly (p < 0.001) increased SGR compared to controls throughout development (Figure 2D).
3.6. Coefficients of Variation
The coefficient of variation for the yolk–chorion ratio ranged from 0.06 to 0.12 during early development in control embryos (Table 2). YCR was significantly (p < 0.001) lower in NHGRI-1 embryos compared to AB embryos at 1 dpf in control (0.06 ± 0.01 and 0.08 ± 0.02, respectively; Zcalc 0.86962 > Ztab 0.80785) and severely hypoxic groups (0.10 ± 0.02 and 0.14 ± 0.03, respectively; Zcalc 0.88340 > Ztab 0.81057). NHGRI-1 embryos from moderate hypoxia had lower CV compared to controls (0.13 ± 0.02 and 0.21 ± 0.04, respectively; Zcalc 1.26392 > Ztab 0.89617; Table 2).
NHGRI-1 larvae from most developmental days in all experimental groups had a significantly (p < 0.001) lower CV compared to AB embryos for BM, EM, LT (Table 2), K, and SGR (Figure 3 and Figure 4). Only 36 of 187 of quantified endpoints showed any significant differences in CV between fish lines (Table 2; Figure 3 and Figure 4).
4. Discussion
4.1. Animal Models and Variation
The genetics of animal models per se represent one of the most important factors that influence variability in experimental biology [3,8]. The genetic (and epigenetic) background of experimental subjects can modulate individual and group responses during experimentation, and its correct understanding may facilitate the interpretation and reproducibility of the results [4,6,7,9]. As an additional tool, highly inbred strains/lines have been developed to reduce genetic variability and minimize the effect of genetic backgrounds on assessed variables.
The nematode Caenorhabditis elegans has become a suitable model for assessing the genetic basis of quantitative traits in both natural and laboratory populations [40]. Variation among wild-type C. elegans isolates has been documented [41,42,43], and the most diverged wild-type strains (N2 and CB4856) show variation in one SNP every 840 bp in their nuclear genome [44,45]. Genetic variation between wild-type and recombinant inbred C. elegans lines promotes differences in maternal hatching and lifespan after dietary restriction [45,46]. Moreover, responses to different compounds (e.g., ethanol [47] and protein abundance [48]) vary among genetic variants from inbred C. elegans strains. Furthermore, homozygous C. elegans do not suffer from inbreeding depression, but outbreeding depression is commonly observed after crossing of inbred lines. This suggests that inbreeding is a naturally occurring process in C. elegans [49,50,51]. In contrast to C. elegans, C. ramanei (an outcrossed species) holds higher nucleotide variation [52,53]. These data suggest that variation is widely spread within the same taxon and genus, and even among populations of the same species.
Compared to Caenorhabditis, Drosophila possesses relatively greater variation among wild-type strains [54]. However, the employment of the two models underlies different types of investigation. Research regarding genetic variation in C. elegans includes the simplification of quantitative genetic studies to enhance the understanding of gene–phenotype associations across inbred individuals [55]. In contrast, studies in Drosophila are generally targeted to reveal complex trait variation and evolutionary dynamics [56]. The comprehensive genetic diversity in Drosophila influences complex traits and phenotypic variation, and contributes to its ability to adapt to different environments [56,57,58]. Although some studies have focused on mutations, quantitative genetic variation, and the exploration of mechanisms underlaying variability [58,59], other studies have revealed significant variation among different Drosophila genotypes. Differences have been observed in immune response and pathogen susceptibility, macronutrient tolerance, the modulation of apoptosis pathways, and quantitative trait loci [56,59,60,61].
In vertebrates, studies have shown significant differences in genetic backgrounds from wild vs. captive animals of various species [62]. Natural and captive populations of Elliot’s pheasant Syrmaticus ellioti exhibit varying nucleotide and haplotype diversity that reflects higher variation in wild animals [63]. The African clawed frog Xenopus laevis and Axolotl Ambystoma mexicanum show contrasting evidence regarding the importance of the correct understanding of genetic backgrounds. X. laevis exhibited little genetic variation from wild populations compared to an isolated population in a novel environment for ~50 years [64]. In contrast, different degrees of heterozygosity and total number of single nucleotide variants (SNVs) occurred in A. mexicanum from captive (domesticated) and wild populations [65]. In these cases, experimental outcomes may be influenced by genetic variability, which could mask key findings during the interpretation of the results.
Mice are one of the most commonly used animal models in biomedical research. The genetic quality (and background) of mice strains is an important factor to consider for enhancing experimental outcomes [66]. Higher levels of polymorphism in wild-derived mice have been described compared to classical inbred strains [67]. Numerous examples have shown how genetic variation among mice strains (wild, inbred, and outbred) modulates their biology. Examples include studies regarding developmental progression of psoriasis disease [68]; vocal signature [69]; physical performance and anxiety-like behavior [70]; microbiome composition; [71]; lumen narrowing during vascular remodeling [72]; copy number variation [73]; and phenotypic robustness in response to environmental variation [74], among other traits. Furthermore, different epigenetic states and transcriptional outcomes depend on genetic variation in the ribosomal DNA in multiple strains [75].
4.2. The Zebrafish Model for Studying Mechanisms for Morphological Variation
Examples of inbred fish strains and lines include the clean livebearer Poeciliopsis lucida [76,77,78], species of Xiphophorus—platyfish and swordtails [79,80], and the Japanese medaka Oryzias latipes, in which strains have been inbred for more than 100 generations [81]. Inbreeding promotes stronger long-term effects, primarily in reproduction (e.g., reduction in fecundity) or sex-ratio skewing, with growth performance being less affected [25,82,83]. However, variation in growth performance occurs in inbred zebrafish [19].
The need for a zebrafish line with a less-variable genetic background led to the production of the NHGRI-1 line [7,30]. Most studies with NHGRI-1 zebrafish address genetic/molecular research [30,84,85,86,87]. However, in the current study, we have employed this line to explore sources of morphological variation in the early developmental stages.
Despite the vast changes in fish larval morphology throughout development, embryos and early larvae show remarkable similarities among species (i.e., enlarged body, continuous fin fold, etc.) [88]. These similarities may suggest that the early life stages of fish cope with similar developmental constraints, including those for foraging, metabolism, and survival [88,89]. For example, the nutritional regime in adult zebrafish modulates epigenetically inherited patterns and gene expression in the offspring [90,91,92,93]. Furthermore, the nutritional regime determines hatching rate and larval growth performance [94,95,96]. A reduction (or lack) in feeding affects fishes’ metabolic rate, survival, growth, and fitness [97]. Moreover, irregular feeding promotes size heterogeneity in juvenile zebrafish [98]. Additionally, most changes (morphological, physiological, behavioral, etc.) in larval fish occur within the first days of exogenous feeding [99,100,101]. However, the zebrafish larvae in the current study were not fed to minimize sources of variation as it occurs in other species under poor conditions, increased competition for resources, or behavioral interactions [35,102,103,104].
4.3. Comparison of Variation in Wild-type and Inbred Zebrafish Embryos and Larvae
Of the six variables that we evaluated, 151 of 187 endpoints showed lower variation in NHGRI-1 zebrafish, as evident from their low coefficients of variation. Additionally, morphological characters in NHGRI-1 showed less variability throughout the measurement period than in AB fish. Consequently, fewer significant differences were observed in AB fish because of the higher variation in their data, evident as overlaps of the SEMs. Variable developmental progression and growth has been observed in zebrafish [105], especially during the embryonic stage [106]. This variation in developmental progression may have contributed to increased variation among NHGRI-1 compared to AB fish, where SGR showed a slight increase instead of a slight decrease.
The body mass in AB fish increased ~30 µg from 1 to 7 dpf, while for NHGRI-1 fish increased only 10 µg. This result suggests that BM in fish early stages changes slightly because of the transfer of yolk to the embryo, as reported for other species [107,108]. Of note, SGR decreased after 5 dpf in AB fish in the control and higher-temperature groups. In contrast, NHGRI-1 fish from higher temperatures had a steady SGR from 5 to 7 dpf, but controls continued to increase. The decrease in EM (and SGR in consequence) may be related to the effect of temperature to accelerate metabolism [105,109], suggesting that fish at higher temperatures depleted yolk reserves and lacked a source of energy to sustain growth, as observed in lower-temperature and hypoxic groups. These results, together with food deprivation, may indicate that the change from feeding on egg yolk to exotrophy occurs earlier in development when temperature is increased, and food sources are needed to promote growth [108]. In addition, development was delayed by hypoxia in AB fish. Considering EM at 1 and 7 dpf, AB fish exposed to moderate hypoxia showed an increase of ~160% compared to controls (~150%) and fish from severe hypoxia (136%). These changes translated into a ~12% growth (SGR) in the three groups by 7 dpf. However, hypoxic fish showed decreased SGR during the previous days. These results are consistent with the fact that hypoxia decreases embryonic growth and developmental progression in zebrafish [110,111,112,113]. Contrarily, hypoxic NHGRI-1 fish showed increases in EM of ~188% in fish exposed to moderate hypoxia, 175% in fish from severe hypoxia, ~127% in controls, and had higher growth rates compared to controls, especially after 5 dpf. These increases in EM led to increased SGR in hypoxic fish, compared to controls. Breakdance (bre) zebrafish mutants showed enhanced connective oxygen transport after the improvement of their cardiac performance, even though this line is known to possess decreased cardiac performance, compared to wild-type fish [114]. This characteristic ensured optimized oxygen and nutrient delivery, which increased fishes’ survival. It is suggested by Kopp et al. [114] that the optimized energy metabolism in hypoxic bre zebrafish may be a determinant for highly energy-demanding processes including organogenesis, growth, and activity. It may be possible that the hypoxic NHGRI-1 fish in the current study could optimize their energy budget similarly to bre fish, especially because they show differences in cardiac function (e.g., lower heart rate) compared to the AB line [115].
Zebrafish exhibit determinate growth because of the lack of hyperplasia in juveniles and adults [116]. In fact, post-larval zebrafish treated with growth hormones showed no modification in growth rate [117]. The relationship between fish size and development is temperature- and growth rate-dependent in wild-type zebrafish [105], zebrafish mutants [118], and other fishes [119,120,121]. It is equally important to assess the ‘relative’ health of the fish through the implementation of indexes such as K [35]. In the current study, K showed very few differences between AB fish across the experiment, but it decreased from ~1 to ~0.5. Decreased K has been observed in fish right after hatching and then increases after first feeding [122,123]. These changes were attributed to food deprivation and nonlinear allometric length–weight relationships. Moreover, this change can occur because of developmental progression and yolk depletion, which significantly increases length, while body mass shows slight changes [108]. NHGRI-1 fish also showed decreased K across time (from ~2.5 to ~0.5); however, significant differences were observed between groups, especially in the temperature experiment and between fish from the control and severe hypoxia treatment. Measurements of K are useful to compare fish of about the same size [35]. In the current study, fish from different groups within each line showed comparable sizes. Of particular interest is that decreased variation in K from NHGRI-1 fish enabled the observation of differences between groups, as described above.
5. Conclusions
NHGRI-1 zebrafish embryos and larvae showed decreased variation in morphological responses to low and high temperatures and moderate and severe hypoxia. This low variation may result from the lower heterozygosity of this inbred line compared to AB fish. Despite major developmental changes occurring across time, the low variation in temperature and oxygen responses in every variable enabled the quantification of significant differences among individuals of the NHGRI-1 line. These differences were difficult to observe in AB fish because of their relatively high genetic variation, promoting the occurrence of a wider range of phenotypes. Of note, the coefficient of variation was lower in NHGRI-1 fish compared to the AB line. With these data, our results indicate that using a well-described inbred zebrafish line like NHGRI-1 can facilitate the understanding of environmentally modulated responses that could be masked by increased genetic variation. Finally, reproducibility and replicability may be improved if, in addition to providing detailed information about experimental designs and conditions, the research uses appropriate animal models matched to specific research questions.
Future research regarding low variability in morphological traits in NHGRI-1 zebrafish is warranted, especially during the development of certain characters (e.g., fin growth, pigmentation pattern, etc.) under a climate change scenario. For example, lower temperatures promote morphological changes in zebrafish at somewhat larger post-larval sizes, while higher temperatures lead to changes in a wide range of sizes [105]. It would be interesting to assess whether the low morphological variation observed in the current study is observed at other levels of organization (e.g., physiological, behavioral, and molecular).
Author Contributions
Conceptualization, G.M.-B. and W.W.B.; methodology, G.M.-B.; validation, G.M.-B., P.P. and W.W.B.; formal analysis, G.M.-B.; investigation, G.M.-B.; resources, W.W.B. and P.P.; data curation, G.M.-B.; writing—original draft preparation, G.M.-B.; writing—review and editing, G.M.-B., P.P. and W.W.B.; visualization, G.M.-B.; supervision, G.M.-B., P.P. and W.W.B.; project administration, G.M.-B., P.P. and W.W.B.; funding acquisition, W.W.B. and P.P. All authors have read and agreed to the published version of the manuscript.
Funding
This research was funded in part by the National Science Foundation, grant number IOS 2103499.
Institutional Review Board Statement
All procedures in the current research were approved by the Institutional Animal Care and Use Committee of the University of North Texas (IUACUC-21002).
Data Availability Statement
Data will be provided upon request.
Acknowledgments
The authors would like to acknowledge Crystelle Lee, Karol Tang, and Neha Nagarajan, undergraduate students from the Texas Academy of Mathematics and Science from the University of North Texas, for their assistance in fish care and data collection.
Conflicts of Interest
The authors declare no conflicts of interest.
References
- National Academies of Sciences; Engineering, and Medicine, Policy and Global Affairs; Committee on Science, Engineering, Medicine, and Public Policy; Board on Research Data and Information, Division on Engineering and Physical Sciences; Committee on Applied and Theoretical Statistics; Board on Mathematical Sciences and Analytics; Division on Earth and Life Studies, Nuclear and Radiation Studies Board; Division of Behavioral and Social Sciences and Education; Committee on National Statistics; Board on Behavioral, Cognitive, and Sensory Sciences; et al. Reproducibility and Replicability in Science; National Academies Press (US): Washington, DC, USA, 2019. [Google Scholar]
- Baker, M. 1500 scientists lift the lid on reproducibility. Nature 2016, 533, 452–454. [Google Scholar] [CrossRef] [PubMed]
- Ioannidis, J.P. Why most published research findings are false. PLoS Med. 2005, 2, e124. [Google Scholar] [CrossRef] [PubMed]
- Göpel, T.; Burggren, W.W. Insufficient reporting of experimental variables as a cause for nonreproducibility in animal physiology? A case study. Am. J. Physiol.-Regul. Integr. Comp. Physiol. 2022, 323, R363–R374. [Google Scholar] [CrossRef] [PubMed]
- Varga, Z.M.; Ekker, S.C.; Lawrence, C. Workshop Report: Zebrafish and Other Fish Models-Description of Extrinsic Environmental Factors for Rigorous Experiments and Reproducible Results. Zebrafish 2018, 15, 533–535. [Google Scholar] [CrossRef] [PubMed]
- Chan, J.C.; Houghton, A.B.; Bale, T.L. Strained in Planning Your Mouse Background? Using the HPA Stress Axis as a Biological Readout for Backcrossing Strategies. Neuropsychopharmacology 2017, 42, 1749–1751. [Google Scholar] [CrossRef] [PubMed]
- Crim, M.J.; Lawrence, C. A fish is not a mouse: Understanding differences in background genetics is critical for reproducibility. Lab Anim. 2021, 50, 19–25. [Google Scholar] [CrossRef] [PubMed]
- Franklin, C.L.; Ericsson, A.C. Microbiota and reproducibility of rodent models. Lab Anim. 2017, 46, 114–122. [Google Scholar] [CrossRef] [PubMed]
- Mandillo, S.; Tucci, V.; Hölter, S.M.; Meziane, H.; Banchaabouchi, M.A.; Kallnik, M.; Lad, H.V.; Nolan, P.M.; Ouagazzal, A.M.; Coghill, E.L.; et al. Reliability, robustness, and reproducibility in mouse behavioral phenotyping: A cross-laboratory study. Physiol. Genom. 2008, 34, 243–255. [Google Scholar] [CrossRef] [PubMed]
- Subramanian, S. Zebrafish as a model organism—Can a fish mimic human? J. Basic. Clin. Physiol. Pharmacol. 2023, 34, 559–575. [Google Scholar] [CrossRef] [PubMed]
- Chia, K.; Klingseisen, A.; Sieger, D.; Priller, J. Zebrafish as a model organism for neurodegenerative disease. Front. Mol. Neurosci. 2022, 15, 940484. [Google Scholar] [CrossRef]
- Ruchika; Sharma, A.; Saneja, A. Zebrafish as a powerful alternative model organism for preclinical investigation of nanomedicines. Drug Discov. Today 2022, 27, 1513–1522. [Google Scholar] [CrossRef] [PubMed]
- Chowdhury, S.; Saikia, S.K. Use of Zebrafish as a Model Organism to Study Oxidative Stress: A Review. Zebrafish 2022, 19, 165–176. [Google Scholar] [CrossRef] [PubMed]
- Suurväli, J.; Whiteley, A.R.; Zheng, Y.; Gharbi, K.; Leptin, M.; Wiehe, T. The Laboratory Domestication of Zebrafish: From Diverse Populations to Inbred Substrains. Mol. Biol. Evol. 2019, 37, 1056–1069. [Google Scholar] [CrossRef] [PubMed]
- Whiteley, A.R.; Bhat, A.; Martins, E.P.; Mayden, R.L.; Arunachalam, M.; Uusi-Heikkilä, S.; Ahmed, A.T.; Shrestha, J.; Clark, M.; Stemple, D.; et al. Population genomics of wild and laboratory zebrafish (Danio rerio). Mol. Ecol. 2011, 20, 4259–4276. [Google Scholar] [CrossRef] [PubMed]
- Audira, G.; Siregar, P.; Strungaru, S.A.; Huang, J.C.; Hsiao, C.D. Which Zebrafish Strains Are More Suitable to Perform Behavioral Studies? A Comprehensive Comparison by Phenomic Approach. Biology 2020, 9, 200. [Google Scholar] [CrossRef] [PubMed]
- Liu, X.; Guo, N.; Lin, J.; Zhang, Y.; Chen, X.Q.; Li, S.; He, L.; Li, Q. Strain-dependent differential behavioral responses of zebrafish larvae to acute MK-801 treatment. Pharmacol. Biochem. Behav. 2014, 127, 82–89. [Google Scholar] [CrossRef] [PubMed]
- Mahabir, S.; Chatterjee, D.; Gerlai, R. Short exposure to low concentrations of alcohol during embryonic development has only subtle and strain- dependent effect on the levels of five amino acid neurotransmitters in zebrafish. Neurotoxicol. Teratol. 2018, 68, 91–96. [Google Scholar] [CrossRef]
- Meyer, B.M.; Froehlich, J.M.; Galt, N.J.; Biga, P.R. Inbred strains of zebrafish exhibit variation in growth performance and myostatin expression following fasting. Comp. Biochem. Physiol. A Mol. Integr. Physiol. 2013, 164, 1–9. [Google Scholar] [CrossRef] [PubMed]
- Siregar, P.; Juniardi, S.; Audira, G.; Lai, Y.H.; Huang, J.C.; Chen, K.H.; Chen, J.R.; Hsiao, C.D. Method Standardization for Conducting Innate Color Preference Studies in Different Zebrafish Strains. Biomedicines 2020, 8, 271. [Google Scholar] [CrossRef] [PubMed]
- Volgin, A.D.; Yakovlev, O.A.; Demin, K.A.; de Abreu, M.S.; Alekseeva, P.A.; Friend, A.J.; Lakstygal, A.M.; Amstislavskaya, T.G.; Bao, W.; Song, C.; et al. Zebrafish models for personalized psychiatry: Insights from individual, strain and sex differences, and modeling gene x environment interactions. J. Neurosci. Res. 2019, 97, 402–413. [Google Scholar] [CrossRef] [PubMed]
- Wakamatsu, Y.; Ogino, K.; Hirata, H. Swimming capability of zebrafish is governed by water temperature, caudal fin length and genetic background. Sci. Rep. 2019, 9, 16307. [Google Scholar] [CrossRef] [PubMed]
- van den Bos, R.; Althuizen, J.; Tschigg, K.; Bomert, M.; Zethof, J.; Filk, G.; Gorissen, M. Early life exposure to cortisol in zebrafish (Danio rerio): Similarities and differences in behaviour and physiology between larvae of the AB and TL strains. Behav. Pharmacol. 2019, 30, 260–271. [Google Scholar] [CrossRef] [PubMed]
- Festing, M.F. Evidence should trump intuition by preferring inbred strains to outbred stocks in preclinical research. ILAR J. 2014, 55, 399–404. [Google Scholar] [CrossRef]
- Pathan, M.; Chaudhari, A.; Krishna, G.; Madhira, S. Inbred zebrafish lines: A genetic repository for zebrafish researchers. Indian J. Genet. Plant Breed. 2019, 79, 150–159. [Google Scholar] [CrossRef]
- Butler, M.G.; Iben, J.R.; Marsden, K.C.; Epstein, J.A.; Granato, M.; Weinstein, B.M. SNPfisher: Tools for probing genetic variation in laboratory-reared zebrafish. Development 2015, 142, 1542–1552. [Google Scholar] [CrossRef] [PubMed]
- Holden, L.A.; Wilson, C.; Heineman, Z.; Dobrinski, K.P.; Brown, K.H. An Interrogation of Shared and Unique Copy Number Variants Across Genetically Distinct Zebrafish Strains. Zebrafish 2019, 16, 29–36. [Google Scholar] [CrossRef] [PubMed]
- Lille-Langøy, R.; Karlsen, O.A.; Myklebust, L.M.; Goldstone, J.V.; Mork-Jansson, A.; Male, R.; Blumberg, B.; Stegeman, J.J.; Goksøyr, A. Sequence Variations in pxr (nr1i2) From Zebrafish (Danio rerio) Strains Affect Nuclear Receptor Function. Toxicol. Sci. 2019, 168, 28–39. [Google Scholar] [CrossRef]
- Chapman, F.A.; Fitz-Coy, S.A.; Thunberg, E.M.; Adams, C.M. United States of America Trade in Ornamental Fish. J. World Aquac. Soc. 1997, 28, 1–10. [Google Scholar] [CrossRef]
- LaFave, M.C.; Varshney, G.K.; Vemulapalli, M.; Mullikin, J.C.; Burgess, S.M. A defined zebrafish line for high-throughput genetics and genomics: NHGRI-1. Genetics 2014, 198, 167–170. [Google Scholar] [CrossRef] [PubMed]
- Meyers, J.R. Zebrafish: Development of a Vertebrate Model Organism. Curr. Protoc. Essent. Lab. Tech. 2018, 16, e19. [Google Scholar] [CrossRef]
- Tavares, B.; Santos Lopes, S. The importance of Zebrafish in biomedical research. Acta Med. Port. 2013, 26, 583–592. [Google Scholar] [CrossRef] [PubMed]
- Williams, S.Y.; Renquist, B.J. High Throughput Danio rerio Energy Expenditure Assay. J. Vis. Exp. 2016, 107, e53297. [Google Scholar] [CrossRef] [PubMed]
- Schneider, C.A.; Rasband, W.S.; Eliceiri, K.W. NIH Image to ImageJ: 25 years of image analysis. Nat. Methods 2012, 9, 671–675. [Google Scholar] [CrossRef] [PubMed]
- Ricker, W. Computation and Interpretation of Biological Statistics of Fish Populations. J. Fish. Res. Board Can. 1975, 191, 1–382. [Google Scholar]
- Brett, J.R.; Groves, T.D.D. 6—Physiological Energetics. In Fish Physiology; Hoar, W.S., Randall, D.J., Brett, J.R., Eds.; Academic Press: Cambridge, MA, USA, 1979; Volume 8, pp. 279–352. [Google Scholar]
- Holm, S. A Simple Sequentially Rejective Multiple Test Procedure. Scand. J. Stat. 1979, 6, 65–70. [Google Scholar]
- Aickin, M.; Gensler, H. Adjusting for multiple testing when reporting research results: The Bonferroni vs Holm methods. Am. J. Public Health 1996, 86, 726–728. [Google Scholar] [CrossRef] [PubMed]
- Irvin, H. A Report on the Statistical Properties of the Coefficient of Variation and Some Applications. Master’s Thesis, Utah State University, Logan, UT, USA, 1970. [Google Scholar]
- Gaertner, B.E.; Phillips, P.C. Caenorhabditis elegans as a platform for molecular quantitative genetics and the systems biology of natural variation. Genet. Res. 2010, 92, 331–348. [Google Scholar] [CrossRef]
- Barrière, A.; Félix, M.A. High local genetic diversity and low outcrossing rate in Caenorhabditis elegans natural populations. Curr. Biol. 2005, 15, 1176–1184. [Google Scholar] [CrossRef] [PubMed]
- Cutter, A.D. Nucleotide polymorphism and linkage disequilibrium in wild populations of the partial selfer Caenorhabditis elegans. Genetics 2006, 172, 171–184. [Google Scholar] [CrossRef] [PubMed]
- Sivasundar, A.; Hey, J. Population genetics of Caenorhabditis elegans: The paradox of low polymorphism in a widespread species. Genetics 2003, 163, 147–157. [Google Scholar] [CrossRef] [PubMed]
- Swan, K.A.; Curtis, D.E.; McKusick, K.B.; Voinov, A.V.; Mapa, F.A.; Cancilla, M.R. High-throughput gene mapping in Caenorhabditis elegans. Genome Res. 2002, 12, 1100–1105. [Google Scholar] [CrossRef] [PubMed]
- Wicks, S.R.; Yeh, R.T.; Gish, W.R.; Waterston, R.H.; Plasterk, R.H. Rapid gene mapping in Caenorhabditis elegans using a high density polymorphism map. Nat. Genet. 2001, 28, 160–164. [Google Scholar] [CrossRef] [PubMed]
- Stastna, J.J.; Snoek, L.B.; Kammenga, J.E.; Harvey, S.C. Genotype-dependent lifespan effects in peptone deprived Caenorhabditis elegans. Sci. Rep. 2015, 5, 16259. [Google Scholar] [CrossRef]
- van Wijk, M.H.; Davies, A.G.; Sterken, M.G.; Mathies, L.D.; Quamme, E.C.; Blackwell, G.G.; Riksen, J.A.G.; Kammenga, J.E.; Bettinger, J.C. Natural allelic variation modifies acute ethanol response phenotypes in wild strains of C. elegans. Alcohol. Clin. Exp. Res. 2023, 47, 1505–1517. [Google Scholar] [CrossRef] [PubMed]
- Kamkina, P.; Snoek, L.B.; Grossmann, J.; Volkers, R.J.; Sterken, M.G.; Daube, M.; Roschitzki, B.; Fortes, C.; Schlapbach, R.; Roth, A.; et al. Natural Genetic Variation Differentially Affects the Proteome and Transcriptome in Caenorhabditis elegans. Mol. Cell. Proteom. 2016, 15, 1670–1680. [Google Scholar] [CrossRef] [PubMed]
- Dolgin, E.S.; Félix, M.A.; Cutter, A.D. Hakuna Nematoda: Genetic and phenotypic diversity in African isolates of Caenorhabditis elegans and C. briggsae. Heredity 2008, 100, 304–315. [Google Scholar] [CrossRef]
- Kammenga, J.E.; Phillips, P.C.; De Bono, M.; Doroszuk, A. Beyond induced mutants: Using worms to study natural variation in genetic pathways. Trends Genet. 2008, 24, 178–185. [Google Scholar] [CrossRef] [PubMed]
- Johnson, T.E.; Hutchinson, E.W. Absence of strong heterosis for life span and other life history traits in Caenorhabditis elegans. Genetics 1993, 134, 465–474. [Google Scholar] [CrossRef] [PubMed]
- Graustein, A.; Gaspar, J.M.; Walters, J.R.; Palopoli, M.F. Levels of DNA polymorphism vary with mating system in the nematode genus caenorhabditis. Genetics 2002, 161, 99–107. [Google Scholar] [CrossRef] [PubMed]
- Jovelin, R.; Ajie, B.C.; Phillips, P.C. Molecular evolution and quantitative variation for chemosensory behaviour in the nematode genus Caenorhabditis. Mol. Ecol. 2003, 12, 1325–1337. [Google Scholar] [CrossRef] [PubMed]
- Berger, J.; Suzuki, T.; Senti, K.A.; Stubbs, J.; Schaffner, G.; Dickson, B.J. Genetic mapping with SNP markers in Drosophila. Nat. Genet. 2001, 29, 475–481. [Google Scholar] [CrossRef] [PubMed]
- Andersen, E.C.; Rockman, M.V. Natural genetic variation as a tool for discovery in Caenorhabditis nematodes. Genetics 2022, 220, iyab156. [Google Scholar] [CrossRef] [PubMed]
- Tinsley, M.C.; Blanford, S.; Jiggins, F.M. Genetic variation in Drosophila melanogaster pathogen susceptibility. Parasitology 2006, 132, 767–773. [Google Scholar] [CrossRef] [PubMed]
- Chakraborty, M.; VanKuren, N.W.; Zhao, R.; Zhang, X.; Kalsow, S.; Emerson, J.J. Hidden genetic variation shapes the structure of functional elements in Drosophila. Nat. Genet. 2018, 50, 20–25. [Google Scholar] [CrossRef] [PubMed]
- Mackay, T.F. Mutations and quantitative genetic variation: Lessons from Drosophila. Philos. Trans. R. Soc. Lond. B Biol. Sci. 2010, 365, 1229–1239. [Google Scholar] [CrossRef] [PubMed]
- Shorter, J.; Couch, C.; Huang, W.; Carbone, M.A.; Peiffer, J.; Anholt, R.R.H.; Mackay, T.F.C. Genetic architecture of natural variation in Drosophila melanogaster aggressive behavior. Proc. Natl. Acad. Sci. USA 2015, 112, E3555–E3563. [Google Scholar] [CrossRef] [PubMed]
- Havula, E.; Ghazanfar, S.; Lamichane, N.; Francis, D.; Hasygar, K.; Liu, Y.; Alton, L.A.; Johnstone, J.; Needham, E.J.; Pulpitel, T.; et al. Genetic variation of macronutrient tolerance in Drosophila melanogaster. Nat. Commun. 2022, 13, 1637. [Google Scholar] [CrossRef] [PubMed]
- Palu, R.A.S.; Ong, E.; Stevens, K.; Chung, S.; Owings, K.G.; Goodman, A.G.; Chow, C.Y. Natural Genetic Variation Screen in Drosophila Identifies Wnt Signaling, Mitochondrial Metabolism, and Redox Homeostasis Genes as Modifiers of Apoptosis. G3 Genes Genomes Genet. 2019, 9, 3995–4005. [Google Scholar] [CrossRef] [PubMed]
- Frankham, R.; Briscoe, D.A.; Ballou, J.D. Introduction to Conservation Genetics; Cambridge University Press: Cambridge, UK, 2002. [Google Scholar]
- Jiang, P.P.; Lang, Q.L.; Fang, S.G.; Ding, P.; Chen, L.M. A genetic diversity comparison between captive individuals and wild individuals of Elliot’s Pheasant (Syrmaticus ellioti) using mitochondrial DNA. J. Zhejiang Univ. Sci. B 2005, 6, 413–417. [Google Scholar] [CrossRef]
- Mable, B.K.; Kilbride, E.; Viney, M.E.; Tinsley, R.C. Copy number variation and genetic diversity of MHC Class IIb alleles in an alien population of Xenopus laevis. Immunogenetics 2015, 67, 591–603. [Google Scholar] [CrossRef] [PubMed]
- Torres-Sánchez, M. Variation under domestication in animal models: The case of the Mexican axolotl. BMC Genom. 2020, 21, 827. [Google Scholar] [CrossRef] [PubMed]
- Yoshiki, A.; Ballard, G.; Perez, A.V. Genetic quality: A complex issue for experimental study reproducibility. Transgenic Res. 2022, 31, 413–430. [Google Scholar] [CrossRef] [PubMed]
- Poltorak, A.; Apalko, S.; Sherbak, S. Wild-derived mice: From genetic diversity to variation in immune responses. Mamm. Genome 2018, 29, 577–584. [Google Scholar] [CrossRef] [PubMed]
- Badanthadka, M.; D’Souza, L.; Salwa, F. Strain specific response of mice to IMQ-induced psoriasis. J. Basic Clin. Physiol. Pharmacol. 2021, 32, 959–968. [Google Scholar] [CrossRef] [PubMed]
- Caruso, A.; Marconi, M.A.; Scattoni, M.L.; Ricceri, L. Ultrasonic vocalizations in laboratory mice: Strain, age, and sex differences. Genes. Brain Behav. 2022, 21, e12815. [Google Scholar] [CrossRef] [PubMed]
- Corder, K.M.; Hoffman, J.M.; Sogorovic, A.; Austad, S.N. Behavioral comparison of the C57BL/6 inbred mouse strain and their CB6F1 siblings. Behav. Process. 2023, 207, 104836. [Google Scholar] [CrossRef] [PubMed]
- Khan, A.A.; Yurkovetskiy, L.; O’Grady, K.; Pickard, J.M.; de Pooter, R.; Antonopoulos, D.A.; Golovkina, T.; Chervonsky, A. Polymorphic Immune Mechanisms Regulate Commensal Repertoire. Cell Rep. 2019, 29, 541–550.e4. [Google Scholar] [CrossRef] [PubMed]
- Harmon, K.J.; Couper, L.L.; Lindner, V. Strain-dependent vascular remodeling phenotypes in inbred mice. Am. J. Pathol. 2000, 156, 1741–1748. [Google Scholar] [CrossRef] [PubMed]
- Locke, M.E.; Milojevic, M.; Eitutis, S.T.; Patel, N.; Wishart, A.E.; Daley, M.; Hill, K.A. Genomic copy number variation in Mus musculus. BMC Genom. 2015, 16, 497. [Google Scholar] [CrossRef] [PubMed]
- Loos, M.; Koopmans, B.; Aarts, E.; Maroteaux, G.; van der Sluis, S.; Verhage, M.; Smit, A.B. Within-strain variation in behavior differs consistently between common inbred strains of mice. Mamm. Genome 2015, 26, 348–354. [Google Scholar] [CrossRef] [PubMed]
- Rodriguez-Algarra, F.; Seaborne, R.A.E.; Danson, A.F.; Yildizoglu, S.; Yoshikawa, H.; Law, P.P.; Ahmad, Z.; Maudsley, V.A.; Brew, A.; Holmes, N.; et al. Genetic variation at mouse and human ribosomal DNA influences associated epigenetic states. Genome Biol. 2022, 23, 54. [Google Scholar] [CrossRef] [PubMed]
- Angus, R.A.; Schultz, J. Clonal diversity in the unisexual fish poeciliopsis monacha-lucida: A tissue graft analysis. Evolution 1979, 33, 27–40. [Google Scholar] [CrossRef] [PubMed]
- Schultz, M.E.; Schultz, R.J. Differences in response to a chemical carcinogen within species and clones of the livebearing fish, Poeciliopsis. Carcinogenesis 1988, 9, 1029–1032. [Google Scholar] [CrossRef] [PubMed]
- Vrijenhoek, R.C.; Angus, R.A.; Schultz, R.J. Variation and heterozygosity in sexually vs. clonally reproducing populations of poeciliopsis. Evolution 1977, 31, 767–781. [Google Scholar] [CrossRef] [PubMed]
- Shen, Y.; Chalopin, D.; Garcia, T.; Boswell, M.; Boswell, W.; Shiryev, S.A.; Agarwala, R.; Volff, J.N.; Postlethwait, J.H.; Schartl, M.; et al. X. couchianus and X. hellerii genome models provide genomic variation insight among Xiphophorus species. BMC Genom. 2016, 17, 37. [Google Scholar] [CrossRef] [PubMed]
- Walter, R.; Hazlewood, L.; Kazianis, S. The Xiphophorus Genetic Stock Center Manual, 1st ed.; Kallman, K., Schartl, M., Eds.; Texas State University: San Marcos, TX, USA, 2006. [Google Scholar]
- Kirchmaier, S.; Naruse, K.; Wittbrodt, J.; Loosli, F. The genomic and genetic toolbox of the teleost medaka (Oryzias latipes). Genetics 2015, 199, 905–918. [Google Scholar] [CrossRef] [PubMed]
- Mrakovčič, M.; Haley, L.E. Inbreeding depression in the Zebra fish Brachydanio rerio (Hamilton Buchanan). J. Fish Biol. 1979, 15, 323–327. [Google Scholar] [CrossRef]
- Trevarrow, B.; Robison, B. Genetic backgrounds, standard lines, and husbandry of zebrafish. Methods Cell Biol. 2004, 77, 599–616. [Google Scholar] [CrossRef] [PubMed]
- Balik-Meisner, M.; Truong, L.; Scholl, E.H.; Tanguay, R.L.; Reif, D.M. Population genetic diversity in zebrafish lines. Mamm. Genome 2018, 29, 90–100. [Google Scholar] [CrossRef] [PubMed]
- Colón-Rodríguez, A.; Uribe-Salazar, J.M.; Weyenberg, K.B.; Sriram, A.; Quezada, A.; Kaya, G.; Jao, E.; Radke, B.; Lein, P.J.; Dennis, M.Y. Assessment of Autism Zebrafish Mutant Models Using a High-Throughput Larval Phenotyping Platform. Front. Cell Dev. Biol. 2020, 8, 586296. [Google Scholar] [CrossRef] [PubMed]
- Uribe-Salazar, J.M.; Kaya, G.; Sekar, A.; Weyenberg, K.; Ingamells, C.; Dennis, M.Y. Evaluation of CRISPR gene-editing tools in zebrafish. BMC Genom. 2022, 23, 12. [Google Scholar] [CrossRef]
- Venta, P.J.; Nguyen, A.K.; Senut, M.C.; Poulos, W.G.; Prukudom, S.; Cibelli, J.B. A 13-plex of tetra- and penta-STRs to identify zebrafish. Sci. Rep. 2020, 10, 3851. [Google Scholar] [CrossRef]
- Kendall, A.J.; Ahlstrom, E.; Moser, H. Early Life History Stages of Fishes and Their Characters; American Society of Ichthyologists and Herpetologists Special Publication: Glen Allen, VA, USA, 1984; pp. 11–22. [Google Scholar]
- Voesenek, C.J.; Muijres, F.T.; van Leeuwen, J.L. Biomechanics of swimming in developing larval fish. J. Exp. Biol. 2018, 221, jeb149583. [Google Scholar] [CrossRef] [PubMed]
- Lucas, A. Programming by early nutrition: An experimental approach. J. Nutr. 1998, 128, 401s–406s. [Google Scholar] [CrossRef] [PubMed]
- Rocha, F.; Dias, J.; Engrola, S.; Gavaia, P.; Geurden, I.; Dinis, M.T.; Panserat, S. Glucose overload in yolk has little effect on the long-term modulation of carbohydrate metabolic genes in zebrafish (Danio rerio). J. Exp. Biol. 2014, 217, 1139–1149. [Google Scholar] [CrossRef]
- Symonds, M.E.; Sebert, S.P.; Hyatt, M.A.; Budge, H. Nutritional programming of the metabolic syndrome. Nat. Rev. Endocrinol. 2009, 5, 604–610. [Google Scholar] [CrossRef] [PubMed]
- Waterland, R.A.; Jirtle, R.L. Early nutrition, epigenetic changes at transposons and imprinted genes, and enhanced susceptibility to adult chronic diseases. Nutrition 2004, 20, 63–68. [Google Scholar] [CrossRef] [PubMed]
- Diogo, P.; Martins, G.; Gavaia, P.; Pinto, W.; Dias, J.; Cancela, L.; Martínez-Páramo, S. Assessment of nutritional supplementation in phospholipids on the reproductive performance of zebrafish, Danio rerio (Hamilton, 1822). J. Appl. Ichthyol. 2015, 31, 3–9. [Google Scholar] [CrossRef]
- Jaya-Ram, A.; Kuah, M.-K.; Lim, P.-S.; Kolkovski, S.; Shu-Chien, A.C. Influence of dietary HUFA levels on reproductive performance, tissue fatty acid profile and desaturase and elongase mRNAs expression in female zebrafish Danio rerio. Aquaculture 2008, 277, 275–281. [Google Scholar] [CrossRef]
- Monteiro, J.F.; Martins, S.; Farias, M.; Costa, T.; Certal, A.C. The Impact of Two Different Cold-Extruded Feeds and Feeding Regimens on Zebrafish Survival, Growth and Reproductive Performance. J. Dev. Biol. 2018, 6, 15. [Google Scholar] [CrossRef] [PubMed]
- Tocher, D.R. Metabolism and Functions of Lipids and Fatty Acids in Teleost Fish. Rev. Fish. Sci. 2003, 11, 107–184. [Google Scholar] [CrossRef]
- Purushothaman, K.; Tan, J.K.H.; Lau, D.; Saju, J.M.; Thevasagayam, N.M.; Wee, C.L.; Vij, S. Feed Restriction Modulates Growth, Gut Morphology and Gene Expression in Zebrafish. Int. J. Mol. Sci. 2021, 22, 1814. [Google Scholar] [CrossRef] [PubMed]
- Dąbrowski, K. The feeding of fish larvae: Present «state of the art» and perspectives. Reprod. Nutr. Dévelop. 1984, 24, 807–833. [Google Scholar] [CrossRef]
- Gatesoupe, J.; Zambonino-Infante, J.; Cahu, C.; Bergot, P. Ontogeny, Development and Digestive Physiology of Fish Larvae. In Nutrition et Alimentation des Poissons et Crustaces; Guillaume, J., Kaushik, S., Bergot, P., Métailler, R., Eds.; Inra Editions: Versailles, France, 1999; pp. 249–264. [Google Scholar]
- Zambonino Infante, J.L.; Cahu, C.L. Ontogeny of the gastrointestinal tract of marine fish larvae. Comp. Biochem. Physiol. C Toxicol. Pharmacol. 2001, 130, 477–487. [Google Scholar] [CrossRef] [PubMed]
- Brown, M.E. Chapter IX—Experimental Studies on Growth. In The Physiology of Fishes, Brown, M.E., Ed.; Academic Press: Cambridge, MA, USA, 1957; pp. 361–400. [Google Scholar]
- Eaton, R.C.; Farley, R.D. Growth and the Reduction of Depensation of Zebrafish, Brachydanio rerio, Reared in the Laboratory. Copeia 1974, 1974, 204–209. [Google Scholar] [CrossRef]
- Ward, A.J.W.; Webster, M.M.; Hart, P.J.B. Intraspecific food competition in fishes. Fish Fish. 2006, 7, 231–261. [Google Scholar] [CrossRef]
- Parichy, D.M.; Elizondo, M.R.; Mills, M.G.; Gordon, T.N.; Engeszer, R.E. Normal table of postembryonic zebrafish development: Staging by externally visible anatomy of the living fish. Dev. Dyn. 2009, 238, 2975–3015. [Google Scholar] [CrossRef] [PubMed]
- Kimmel, C.B.; Ballard, W.W.; Kimmel, S.R.; Ullmann, B.; Schilling, T.F. Stages of embryonic development of the zebrafish. Dev. Dyn. 1995, 203, 253–310. [Google Scholar] [CrossRef] [PubMed]
- Burggren, W.W.; Bautista, G.M.; Coop, S.C.; Couturier, G.M.; Delgadillo, S.P.; García, R.M.; González, C.A.A. Developmental cardiorespiratory physiology of the air-breathing tropical gar, Atractosteus tropicus. Am. J. Physiol. Regul. Integr. Comp. Physiol. 2016, 311, R689–R701. [Google Scholar] [CrossRef] [PubMed]
- Martínez, G.; Peña, E.; Martínez, R.; Camarillo, S.; Burggren, W.; Álvarez, A. Survival, Growth, and Development in the Early Stages of the Tropical Gar Atractosteus tropicus: Developmental Critical Windows and the Influence of Temperature, Salinity, and Oxygen Availability. Fishes 2021, 6, 5. [Google Scholar] [CrossRef]
- Pankhurst, N.W.; Munday, P.L. Effects of climate change on fish reproduction and early life history stages. Mar. Freshw. Res. 2011, 62, 1015–1026. [Google Scholar] [CrossRef]
- Kamei, H.; Lu, L.; Jiao, S.; Li, Y.; Gyrup, C.; Laursen, L.S.; Oxvig, C.; Zhou, J.; Duan, C. Duplication and diversification of the hypoxia-inducible IGFBP-1 gene in zebrafish. PLoS ONE 2008, 3, e3091. [Google Scholar] [CrossRef] [PubMed]
- Kamei, H.; Ding, Y.; Kajimura, S.; Wells, M.; Chiang, P.; Duan, C. Role of IGF signaling in catch-up growth and accelerated temporal development in zebrafish embryos in response to oxygen availability. Development 2011, 138, 777–786. [Google Scholar] [CrossRef] [PubMed]
- Kajimura, S.; Aida, K.; Duan, C. Insulin-like growth factor-binding protein-1 (IGFBP-1) mediates hypoxia-induced embryonic growth and developmental retardation. Proc. Natl. Acad. Sci. USA 2005, 102, 1240–1245. [Google Scholar] [CrossRef] [PubMed]
- Zhang, P.; Yao, Q.; Lu, L.; Li, Y.; Chen, P.J.; Duan, C. Hypoxia-inducible factor 3 is an oxygen-dependent transcription activator and regulates a distinct transcriptional response to hypoxia. Cell Rep. 2014, 6, 1110–1121. [Google Scholar] [CrossRef] [PubMed]
- Kopp, R.; Bauer, I.; Ramalingam, A.; Egg, M.; Schwerte, T. Prolonged hypoxia increases survival even in Zebrafish (Danio rerio) showing cardiac arrhythmia. PLoS ONE 2014, 9, e89099. [Google Scholar] [CrossRef] [PubMed]
- Bautista, G.M.; Padilla, P.; Burggren, W. Decreased physiological variation in the developing Zebrafish Danio rerio from a low heterozigosity line. In preparation.
- Biga, P.R.; Goetz, F.W. Zebrafish and giant danio as models for muscle growth: Determinate vs. indeterminate growth as determined by morphometric analysis. Am. J. Physiol. Regul. Integr. Comp. Physiol. 2006, 291, R1327–R1337. [Google Scholar] [CrossRef] [PubMed]
- Biga, P.R.; Meyer, J. Growth hormone differentially regulates growth and growth-related gene expression in closely related fish species. Comp. Biochem. Physiol. A Mol. Integr. Physiol. 2009, 154, 465–473. [Google Scholar] [CrossRef] [PubMed]
- Parichy, D.M.; Turner, J.M. Zebrafish puma mutant decouples pigment pattern and somatic metamorphosis. Dev. Biol. 2003, 256, 242–257. [Google Scholar] [CrossRef] [PubMed]
- Georgakopoulou, E.; Sfakianakis, D.G.; Kouttouki, S.; Divanach, P.; Kentouri, M.; Koumoundouros, G. The influence of temperature during early life on phenotypic expression at later ontogenetic stages in sea bass. J. Fish Biol. 2007, 70, 278–291. [Google Scholar] [CrossRef]
- Klimogianni, A.; Koumoundouros, G.; Kaspiris, P.; Kentouri, M. Effect of temperature on the egg and yolk-sac larval development of common pandora, Pagellus erythrinus. Mar. Biol. 2004, 145, 1015–1022. [Google Scholar] [CrossRef]
- Martell, D.J.; Kieffer, J.D.; Trippel, E.A. Effects of temperature during early life history on embryonic and larval development and growth in haddock. J. Fish Biol. 2005, 66, 1558–1575. [Google Scholar] [CrossRef]
- de Ciechomski, J.D.; Sánchez, R.P.; Alespeiti, G.; Regidor, H. Estudio sobre el crecimiento en peso y factor de condición en larvas de anchoíta, Engraulis anchoita Hubbs & Marini. Variaciones regionales, estacionales y anuales. Rev. Investig. Desarro. Pesq. 1986, 5, 83–193. [Google Scholar]
- Westernhagen, H.V.; Rosenthal, H. On condition factor measurements in Pacific herring larvae. Helgoländer Meeresunters 1981, 34, 257–262. [Google Scholar] [CrossRef]
Figure 1.
Condition factor (K) of AB (Panels A,B) and NHGRI-1 (Panels C,D) Danio rerio during temperature (Panels A,C) and hypoxia (Panels B,D) exposure experiments. Boxes surround mean values that are not significantly different from each other on any given developmental day. p values for each experimental group at the right of the figure indicate whether significant differences exist across time. n = 15 for each data point.

Figure 2.
Specific growth rate (SGR) of AB (A,B) and NHGRI-1 (C,D) Danio rerio during temperature (A,C) and hypoxia (B,D) experiments. Boxes surround mean values that are not significantly different from each other on any given developmental day. p values for each experimental group at the right of the figure indicate whether significant differences exist across time. n = 15 for each data point.

Figure 3.
Coefficient of variation (CV) for condition factor (K) between AB and NHGRI-1 Danio rerio within experimental groups throughout larval development. (A) Control; (B) low temperature; (C) high temperature; (D) moderate hypoxia; and (E) severe hypoxia. Boxes surround mean values that are not significantly different from each other on any given developmental day. p values for each experimental group at the right of the figure indicate whether significant differences exist across time. n = 15 for each data point.

Figure 4.
Coefficient of variation (CV) for specific growth rate (SGR) for AB and NHGRI-1 Danio rerio within experimental groups throughout larval development. (A) Control, (B) low temperature; (C) high temperature; (D) moderate hypoxia; and (E) severe hypoxia. Boxes surround mean values that are not significantly different from each other on any given developmental day. p values at the right of the figure for each experimental group indicate whether significant differences exist across time. n = 15 for each data point.


Table 1.
Morphological variables determined in AB and NHGRI-1 lines of zebrafish (Danio rerio). Data per day and experimental group are presented as mean ± SEM (n = 15). Asterisks on values in bold represent differences from controls at any given day. p values after the day 7 entry indicate differences within each experimental group across developmental time.
| TEMP (°C) | O2 (mg L−1)) | AGE (dpf) | Yolk/Chorion Ratio (%) | Body Mass (µg) | Embryo Mass (µg) | Total Length (mm) | ||||
|---|---|---|---|---|---|---|---|---|---|---|
| WT AB | NHGRI-1 | WT AB | NHGRI-1 | WT AB | NHGRI-1 | WT AB | NHGRI-1 | |||
| 28 | 7.8 | 1 | 38 ± 1 | 43 ± 1 | 284 ± 8 | 276 ± 4 | 120 ± 3 | 110 ± 2 | 3.1 ± 0.1 | 2.5 ± 0.03 |
| 2 | 55.8 ± 2 | 51.6 ± 1.6 | 278 ± 10 | 266 ± 5 | 150 ± 4 | 120 ± 2 | 3.3 ± 0.1 | 2.8 ± 0.02 | ||
| 3 | 63.7 ± 2.2 | - | 305 ± 9 | 256 ± 4 | 180 ± 7 | 120 ± 2 | 3.9 ± 0.1 | 2.9 ± 0.03 | ||
| 4 | - | - | 315 ± 9 | 268 ± 3 | 230 ± 7 | 160 ± 2 | 4.2 ± 0.2 | 3.2 ± 0.04 | ||
| 5 | - | - | 349 ± 12 | 285 ± 4. | 280 ± 10 | 190 ± 3 | 4.2 ± 0.1 | 3.4 ± 0.03 | ||
| 6 | - | - | 329 ± 15 | 270 ± 6 | 290 ± 13 | 220 ± 5 | 4.2 ± 1 | 3.5 ± 0.04 | ||
| 7 | - | - | 314 ± 11 | 286 ± 4 | 300 ± 10 | 250 ± 4 | 4.4 ± 0.1 | 3.9 ± 0.05 | ||
| p < 0.001 | p < 0.001 | p < 0.001 | p < 0.001 | p < 0.001 | p < 0.001 | p < 0.001 | p < 0.001 | |||
| 23 | 7.8 | 1 | 47 ± 1.4 * | 39.9 ± 1.0 | 290 ± 7.2 | 215 ± 3 * | 120 ± 7 * | 90 ± 2. | 3.2 ± 0.10 | 2.3 ± .0.02 |
| 2 | 54.1 ± 1.3 | 54.9 ± 1.7 | 306 ± 7.3 | 215 ± 4 * | 130 ± 4 * | 130 ± 2 * | 3.4 ± 0.1 * | 2.4 ± 0.03 | ||
| 3 | 55.5 ± 2.2 | 53.8 ± 1.7 | 291 ± 8.5 | 227 ± 5 * | 130 ± 6 * | 130 ± 3 * | 3.7 ± 0.1 * | 2.9 ± 0.03 | ||
| 4 | 64.1 ± 2.3 | - | 297 ± 5.6 | 234 ± 5 * | 180 ± 6* | 160 ± 3 * | 3.8 ± 0.1 * | 3.2 ± 0.03 * | ||
| 5 | - | - | 306 ± 5.9 * | 253 ± 6 * | 210 ± 6 * | 200 ± 5 * | 3.8 ± 0.1 | 3.2 ± 0.04 | ||
| 6 | - | - | 339 ± 11.2 | 269 ± 4 | 280 ± 11 | 230 ± 4 * | 4.1 ± 0.1 | 3.2 ± 0.04 | ||
| 7 | - | - | 334 ± 10 | 279 ± 4. | 300 ± 10 * | 260 ± 4 * | 4.1 ± 0.1 | 3.4 ± 0.05 | ||
| p < 0.001 | p < 0.001 | p < 0.006 | p < 0.001 | p < 0.001 | p < 0.001 | p < 0.001 | p < 0.001 | |||
| 33 | 7.82 | 1 | 49.8 ± 2.2 * | 53 ± 2 * | 301 ± 7.9 | 243 ± 3.8 * | 120 ± 4 | 120 ± 2.1 * | 3.43 ± 0.1 | 2.7 ± 0.03 |
| 2 | - | - | 295 ± 7.2 | 300 ± 4.8 * | 170 ± 5 | 200 ± 3.3 | 3.98 ± 0.1 * | 3.1 ± 0.03 * | ||
| 3 | - | - | 317 ± 8.5 | 273 ± 5.8 * | 210 ± 6 * | 180 ± 3.7 * | 4.17 ± 0.1 * | 3.3 ± 0.03 * | ||
| 4 | - | - | 337 ± 11.3 * | 298 ± 3.8 * | 260 ± 9 | 220 ± 3.2 | 4.47 ± 0.1 * | 3.4 ± 0.04 * | ||
| 5 | - | - | 327 ± 9.3 | 300 ± 5.2 * | 280 ± 8 | 260 ± 4.5 | 4.51 ± 0.1 * | 3.5 ± 0.04 * | ||
| 6 | - | - | 337 ± 12.7 | 284 ± 3.4 | 300 ± 11 * | 250 ± 3.3 * | 4.59 ± 0.1 * | 3.7 ± 0.04 * | ||
| 7 | - | - | 293 ± 8.7 * | 276 ± 5.2 | 280 ± 8 | 270 ± 5.6 * | 4.65 ± 0.2 * | 4.2 ± 0.04 * | ||
| p < 0.001 | - | p < 0.026 | p < 0.001 | p < 0.001 | p < 0.001 | p < 0.001 | p < 0.001 | |||
| 28 | 4.9 | 1 | 38.1 ± 1.5 | 42.3 ± 2.2 | 294 ± 8.8 | 242 ± 5.7 * | 100 ± 7 * | 80 ± 2.2 * | 3.08 ± 0.1 | 2.1 ± 0.02 |
| 2 | 52 ± 1.6 | 55.1 ± 2.3 | 279 ± 7.7 | 233 ± 3.0 * | 110 ± 6 * | 100 ± 1.7 * | 3.30 ± 0.1 | 2.8 ± 0.03 | ||
| 3 | 43.9 ± 2.4 * | 50.5 ± 1.7 | 295 ± 7.8 | 229 ± 4.1 | 130 ± 8 * | 100 ± 1.9 * | 3.40 ± 0.2 * | 2.9 ± 0.04 * | ||
| 4 | - | - | 293 ± 7.6 | 209 ± 3.0 * | 170 ± 4 * | 120 ± 1.9 | 3.63 ± 0.2 * | 3 ± 0.04* | ||
| 5 | - | - | 297 ± 7.5 * | 245 ± 4.5 * | 190 ± 5 * | 150 ± 3.0 | 3.80 ± 0.1 * | 3.2 ± 0.04 * | ||
| 6 | - | - | 303 ± 7.0 | 260 ± 5.3 | 230 ± 9 * | 190 ± 4.0 * | 4.11 ± 0.1 | 3.4 ± 0.05 | ||
| 7 | - | - | 312 ± 9.7 | 275 ± 3.5 | 270 ± 9 * | 230 ± 2.8 * | 4.20 ± 0.1 | 3.6 ± 0.04 | ||
| p < 0.001 | p < 0.001 | p = 0.189 | p < 0.001 | p < 0.001 | p < 0.001 | p < 0.001 | p < 0.001 | |||
| 28 | 3.7 | 1 | 39.3 ± 1.5 | 46.2 ± 1.2 | 296 ± 7.0 | 219 ± 5 * | 110 ± 4 * | 80 ± 1.7 * | 3.0 ± 0.1 | 2.2 ± 0.02 |
| 2 | 54.1 ± 2 | 50.7 ± 1.8 | 288 ± 6.4 | 220 ± 4.1 * | 120 ± 6 * | 90 ± 2.0 * | 3.2 ± 0.1 | 2.5 ± 0.04 | ||
| 3 | 42.4 ± 2 * | 50.6 ± 3.4 | 291 ± 6.5 | 210 ± 3.4 | 140 ± 5 * | 90 ± 1.7 * | 3.3 ± 0.1 * | 2.9 ± 0.04 * | ||
| 4 | - | - | 302 ± 9.4 | 209 ± 3.6 * | 170 ± 1 * | 120 ± 2.4 | 3.5 ± 0.1 * | 3.0 ± 0.04 * | ||
| 5 | - | - | 293 ± 6.3 * | 250 ± 4.4 * | 180 ± 6 * | 150 ± 2.6 | 3.6 ± 0.1 * | 3.1 ± 0.05 * | ||
| 6 | - | - | 291 ± 7.2 | 263 ± 4.6 | 210 ± 7 * | 180 ± 3.2 * | 3.8 ± 0.1 | 3.3 ± 0.05 | ||
| 7 | - | - | 320 ± 9.6 | 266 ± 3.2 * | 260 ± 9 * | 210 ± 1.9 * | 4.0 ± 0.1 * | 3.3 ± 0.04 * | ||
| p < 0.001 | p = 0.264 | p = 0.217 | p < 0.001 | p < 0.001 | p < 0.001 | p < 0.001 | p < 0.001 | |||
Table 2.
Coefficient of variation (CV) for morphological variables presented in Table 1 in AB and NHGRI-1 lines of zebrafish (Danio rerio). Asterisks on values in bold represent differences from controls at any given day. Data per day and experimental group are presented as mean ± SEM (n = 15). p values after the day 7 entry indicate differences within each experimental group across developmental time.
| TEMP (°C) | O2 (mg L−1) | AGE (dpf) | Yolk/Chorion Ratio | Body Mass | Embryo Mass | Total Length | ||||
|---|---|---|---|---|---|---|---|---|---|---|
| WT AB | NHGRI-1 | WT AB | NHGRI-1 | WT AB | NHGRI-1 | WT AB | NHGRI-1 | |||
| 28 | 7.8 | 1 | 0.08 ± 0.02 | 0.06 ± 0.01 * | 0.10 ± 0.02 | 0.05 ± 0.01 * | 0.08 ± .02 | 0.07 ± 0.01 | 0.09 ± 0.02 | 0.05 ± 0.01 * |
| 2 | 0.14 ± 0.02 | 0.12 ± 0.02 | 0.14 ± 0.03 | 0.07 ± 0.01 * | 0.11 ± 0.02 | 0.07 ± 0.01 * | 0.11 ± 0.02 | 0.03 ± 0.01 * | ||
| 3 | 0.13 ± 0.02 | - | 0.12 ± 0.02 | 0.06 ± 0.01 * | 0.14 ± 0.03 | 0.06 ± 0.01 * | 0.06 ± 0.01 | 0.04 ± 0.01 * | ||
| 4 | - | - | 0.11 ± 0.02 | 0.4 ± 0.02 * | 0.2 ± 0.03 | 0.05 ± 0.01 * | 0.08 ± 0.02 | 0.05 ± 0.01 * | ||
| 5 | - | - | 0.13 ± 0.02 | 0.05 ± 0.01 * | 0.14 ± 0.03 | 0.05 ± 0.01 * | 0.09 ± 0.02 | 0.04 ± 0.01 * | ||
| 6 | - | - | 0.18 ± 0.08 | 0.08 ± 0.02 * | 0.18 ± 0.03 | 0.09 ± 0.02 * | 0.09 ± 0.02 | 0.05 ± 0.01 * | ||
| 7 | - | - | 0.14 ± 0.02 | 0.05 ± 0.01 * | 0.14 ± 0.03 | 0.06 ± 0.01 * | 0.09 ± 0.02 | 0.05 ± 0.01 * | ||
| 23 | 7.8 | 1 | 0.11 ± 0.02 | 0.10 ± 0.02 | 0.10 ± 0.02 | 0.06 ± 0.01 * | 0.21 ± 0.04 | 0.08 ± 0.02 * | 0.13 ± 0.02 | 0.04 ± 0.01 * |
| 2 | 0.15 ± 0.03 | 0.12 ± 0.02 | 0.09 ± 0.02 | 0.07 ± 0.01 * | 0.13 ± 0.03 | 0.07 ± 0.01 * | 0.10 ± 0.02 | 0.04 ± .0.01 * | ||
| 3 | 0.15 ± 0.03 | 0.12 ± 0.02 | 0.11 ± 0.02 | 0.08 ± 0.01 * | 0.18 ± 0.03 | 0.09 ± 0.02 * | 0.08 ± 0.01 | 0.05 ± 0.01 * | ||
| 4 | 0.14 ± 0.03 | - | 0.07 ± 0.01 | 0.08 ± 0.01 | 0.13 ± 0.02 | 0.08 ± 0.01 * | 0.08 ± 0.02 | 0.04 ± 0.01 * | ||
| 5 | - | - | 0.07 ± 0.01 | 0.10 ± 0.02 | 0.10 ± 0.02 | 0.10 ± 0.02 | 0.13 ± 0.02 | 0.05 ± 0.01 * | ||
| 6 | - | - | 0.13 ± 0.02 | 0.06 ± 0.01 * | 0.15 ± 0.03 | 0.06 ± 0.01 * | 0.09 ± 0.02 | 0.05 ± 0.01 * | ||
| 7 | - | 0.12 ± 0.02 | 0.06 ± 0.01 * | 0.13 ± 0.02 | 0.06 ± 0.01 * | 0.10 ± 0.02 | 0.06 ± 0.01 * | |||
| 33 | 7.8 | 1 | 0.17 ± 0.03 | 0.20 ± 0.04 | 0.10 ± 0.02 | 0.06 ± 0.01 * | 0.14 ± 0.02 | 0.07 ± 0.01 * | 0.10 ± 0.02 | 0.04 ± 0.01 * |
| 2 | - | - | 0.09 ± 0.02 | 0.06 ± 0.01 * | 0.11 ± .0.02 | 0.06 ± 0.01 * | 0.05 ± 0.01 | 0.04 ± 0.01 | ||
| 3 | - | - | 0.10 ± 0.02 | 0.08 ± .0.02 | 0.11 ± 0.02 | 0.08 ± 0.01 * | 0.09 ± 0.02 | 0.04 ± 0.01 * | ||
| 4 | - | - | 0.13 ± 0.02 | 0.05 ± 0.01 * | 0.14 ± 0.03 | 0.06 ± 0.01 * | 0.09 ± 0.02 | 0.05 ± 0.01 * | ||
| 5 | - | - | 0.11 ± 0.02 | 0.07 ± 0.01 * | 0.10 ± 0.02 | 0.07 ± 0.01 * | 0.12 ± 0.02 | 0.04 ± 0.01 * | ||
| 6 | - | - | 0.15 ± 0.03 | 0.05 ± 0.01 * | 0.14 ± 0.03 | 0.05 ± 0.01 * | 0.10 ± 0.02 | 0.04 ± 0.01 * | ||
| 7 | 0.11 ± 0.02 | 0.07 ± 0.01 * | 0.11 ± 0.02 | 0.08 ± 0.01 * | 0.12 ± 0.02 | 0.04 ± 0.01 * | ||||
| 28 | 4.9 | 1 | 0.15 ± 0.03 | 0.20 ± 0.04 | 0.12 ± 0.02 | 0.09 ± 0.02 | 0.26 ± 0.05 | 0.10 ± 0.02 * | 0.07 ± 0.01 | 0.04 ± 0.01 * |
| 2 | 0.12 ± .02 | 0.16 ± 0.03 | 0.11 ± .0.02 | 0.05 ± 0.01 * | 0.19 ± 0.03 | 0.07 ± 0.01 * | 0.09 ± 0.02 | 0.04 ± 0.01 * | ||
| 3 | 0.21 ± 0.04 | 0.13 ± 0.02 * | 0.10 ± 0.02 | 0.07 ± 0.01 * | 0.24 ± 0.04 | 0.07 ± 0.01 * | 0.19 ± 0.04 | 0.10 ± 0.02 * | ||
| 4 | - | - | 0.10 ± 0.02 | 0.06 ± 0.01 * | 0.09 ± .0.02 | 0.06 ± 0.01 * | 0.18 ± 0.03 | 0.05 ± 0.01 * | ||
| 5 | - | - | 0.10 ± 0.02 | 0.07 ± 0.01 * | 0.10 ± 0.02 | 0.08 ± 0.01 | 0.11 ± 0.02 | 0.05 ± 0.01 * | ||
| 6 | - | - | 0.09 ± 0.02 | 0.08 ± 0.01 | 0.14 ± 0.03 | 0.08 ± 0.01 * | 0.07 ± 0.01 | 0.05 ± 0.01 | ||
| 7 | - | - | 0.12 ± 0.02 | 0.05 ± 0.01 * | 0.12 ± 0.02 | 0.05 ± 0.01 * | 0.09 ± 0.02 | 0.04 ± 0.01 * | ||
| 28 | 3.7 | 1 | 0.14 ± 0.03 | 0.10 ± 0.02 * | 0.09 ± 0.02 | 0.09 ± 0.02 | 0.14 ± 0.02 | 0.08 ± 0.02 * | 0.09 ± 0.02 | 0.04 ± 0.01 * |
| 2 | 0.14 ± 0.03 | 0.13 ± 0.02 | 0.09 ± 0.08 | 0.07 ± 0.01 | 0.19 ± 0.03 | 0.09 ± 0.02 * | 0.16 ± 0.03 | 0.07 ± 0.01 * | ||
| 3 | 0.18 ± 0.03 | 0.26 ± 0.05 | 0.09 ± 0.02 | 0.06 ± 0.01 * | 0.13 ± 0.02 | 0.07 ± 0.01 * | 0.15 ± 0.03 | 0.06 ± 0.01 * | ||
| 4 | - | - | 0.12 ± 0.02 | 0.07 ± 0.01 * | 0.22 ± 0.04 | 0.08 ± 0.01 * | 0.14 ± 0.03 | 0.05 ± 0.01 * | ||
| 5 | - | - | 0.08 ± 0.02 | 0.07 ± 0.01 | 0.12 ± 0.02 | 0.07 ± 0.01 * | 0.10 ± 0.02 | 0.06 ± 0.01 * | ||
| 6 | - | - | 0.10 ± 0.02 | 0.07 ± 0.01 * | 0.13 ± 0.02 | 0.07 ± 0.01 * | 0.12 ± 0.02 | 0.05 ± 0.01 * | ||
| 7 | - | - | 0.12 ± 0.02 | 0.04 ± 0.01 * | 0.13 ± 0.02 | 0.03 ± 0.01 * | 0.08 ± 0.01 | 0.04 ± 0.01 * | ||
Disclaimer/Publisher’s Note: The statements, opinions and data contained in all publications are solely those of the individual author(s) and contributor(s) and not of MDPI and/or the editor(s). MDPI and/or the editor(s) disclaim responsibility for any injury to people or property resulting from any ideas, methods, instructions or products referred to in the content. |
© 2024 by the authors. Licensee MDPI, Basel, Switzerland. This article is an open access article distributed under the terms and conditions of the Creative Commons Attribution (CC BY) license (https://creativecommons.org/licenses/by/4.0/).
Share and Cite
MDPI and ACS Style
Martinez-Bautista, G.; Padilla, P.; Burggren, W.W. Genetic Basis for Morphological Variation in the Zebrafish Danio rerio: Insights from a Low-Heterozygosity Line. Fishes 2024, 9, 164. https://doi.org/10.3390/fishes9050164
AMA Style
Martinez-Bautista G, Padilla P, Burggren WW. Genetic Basis for Morphological Variation in the Zebrafish Danio rerio: Insights from a Low-Heterozygosity Line. Fishes. 2024; 9(5):164. https://doi.org/10.3390/fishes9050164
Chicago/Turabian StyleMartinez-Bautista, Gil, Pamela Padilla, and Warren W. Burggren. 2024. "Genetic Basis for Morphological Variation in the Zebrafish Danio rerio: Insights from a Low-Heterozygosity Line" Fishes 9, no. 5: 164. https://doi.org/10.3390/fishes9050164