Abstract
This study aims to optimize the thermodynamic performance of a cold storage distribution box through the integration of a ventilation system. To achieve this goal, a prototype constructed from expanded polystyrene is developed, incorporating an active ventilation system to ensure cold temperature uniformity. Thermocouples are integrated into the device to monitor the temporal temperature evolution with and without ventilation. Concurrently, a 2D thermo-aerodynamic investigation is conducted using computational fluid dynamics (CFD). The numerical modeling of the thermodynamic behavior of the cold source employs polynomial laws as input data for the computational code (UDF functions). A comparison between experimental and numerical results reveals the computational code’s accurate prediction of the temporal temperature evolution in the cold storage distribution box, particularly under forced convection conditions. The findings indicate that in the absence of ventilation, thermal exchanges primarily occur through air conduction, whereas with ventilation, exchanges are facilitated by convection. Overall, forced convection induced by the inclusion of a ventilation device enhances thermal transfers and the thermodynamic performance of the cold storage distribution box. Furthermore, air mixing limits thermal stratification, thereby facilitating temperature homogenization.
1. Introduction
Societal shifts are prompting significant changes in dietary behaviors, particularly among young professionals who have less time to devote to meal preparation. This trend has led to a surge in the popularity of ready-to-cook meals and meal delivery services to residences, workplaces, and educational institutions across numerous countries [1,2]. Given that these meals are often delivered via specialized delivery services, the use of insulated boxes is paramount to ensuring food safety and quality during non-refrigerated transportation [3,4]. Specifically, an effective box design must uphold food temperatures at or below 4 °C throughout transportation, which may extend over several hours. Thus, designing a box that meets food safety standards while also considering economic constraints is imperative.
One of the preferred methods for optimizing the design of a food transport box is through prototype development. By employing a hybrid approach that combines practical experimentation with numerical simulations, it becomes possible to thoroughly analyze the prototype’s performance and gain insight into the underlying physical phenomena. Previous studies have developed heat transfer models that describe various designs of insulated boxes and the materials used for food transport. These investigations have identified key heat transfer mechanisms, including conduction, radiation, and phase change within the box, as well as forced, natural, or mixed convection, and radiation on its surface [5,6,7,8,9,10,11,12,13]. Notably, Burgess [5], Choi and Burgess [6], and Navaranjan et al. [13] have conducted comparative analyses of thermal resistance (R-value) among insulated boxes constructed from different materials, geometries, and thicknesses. These comparisons were conducted using multilayer heat transfer models and ice melting tests. Additionally, Gospavic et al. [10] have provided insights into heat transfer within an insulated box by utilizing the analytical solution of a simplified 3D heat transfer model and validating this approach through experimental measurements of the temperature of fresh fish fillets transported in expanded polystyrene.
East and Smale [9], along with East et al. [8], devised an optimization methodology leveraging a 3D heat transfer model, cost analysis, and a hybrid genetic algorithm to engineer insulated boxes. Their research underscored the satisfactory efficacy of expanded polystyrene and polyurethane as insulation materials. Additionally, Margeirsson et al. [11,12] formulated and validated a 3D heat transfer model for transporting fresh fish fillets in expanded polystyrene and corrugated plastic containers, assessing both stable and dynamic conditions. Their investigation underscored the pivotal role of gel packs in preserving food quality. Furthermore, the configuration of contents within the box stands as a critical factor influencing its performance. Typically, pre-frozen gel packs are incorporated within the box to delay temperature elevation. The conventional practice of situating food items inside the box alongside gel packs introduces an extra layer of thermal resistance against heat conduction while augmenting the distance between the food items and the warmer ambient surroundings.
Traditionally, research in food preservation has predominantly centered around the utilization of passive transport boxes, which rely on ice packs or gel packs to maintain the cold chain for food items. An alternative approach to enhance these transport boxes involves integrating a ventilation system based on the principle of forced convection. Across various systems, the incorporation of such a ventilation mechanism facilitates heat exchange by actively promoting forced convection. Particularly within the realm of heat exchangers, forced convection enhances the heat transfer coefficient by minimizing the temperature differential between the air and the heat exchanger. This enhancement translates into improved energy efficiency within the refrigeration cycle compared to systems operating solely on natural convection principles [14]. Likewise, in the domain of data centers, where energy conservation is paramount, leveraging forced convection presents itself as a promising strategy to optimize heat dissipation [15]. In contrast to natural convection, forced convection has the potential to augment both the drying kinetics and the overall performance of solar dryers [16].
The primary aim of this research is to optimize thermal dynamics within a cold storage distribution box by incorporating a ventilation system that fosters air circulation within the refrigerated environment. The strategy involves drawing in the denser, colder air from the box’s lower section and channeling it upward through a network of pathways. Given the box’s dimensions, employing an energy-efficient, computer-type fan for this purpose is viable. Power could be supplied by batteries or a small solar panel. For this investigation, a prototype box constructed from expanded polystyrene has been developed. Pre-cooled ice packs, prepared according to a predetermined protocol, are employed to reduce the box’s internal temperature. Thermocouples, strategically positioned at different heights within the refrigerated compartment, monitor the temporal temperature evolution. Measurements are conducted both with and without ventilation to assess the impact of forced convection on temperature fluctuations within the transport box. Additionally, a thermo-aerodynamic analysis is performed using computational fluid dynamics (CFD). This numerical approach enables the examination of airflow patterns within the cold storage distribution box and assesses how forced convection can optimize thermo-convective interactions.
2. Materials and Methods
2.1. Experimental Device
The diagram of the cold storage distribution box and the associated experimental setup is shown in Figure 1. The cold storage distribution box consists of a rectangular polystyrene box with internal dimensions of height 0.28 m, depth 0.19 m, and width 0.29 m. The walls and lid of the box are made of polystyrene with a thickness of 0.05 m. The dimensions of the box as well as the thermophysical properties of the materials are indicated in Table 1. For the purposes of this study, we designed a ventilation system aimed at drawing in cold air from the lower part of the cold storage distribution box and then reintroducing it at the upper part. The system is based on a fan commonly used in the computer field (P = 3.7 W), which requires a 12 V direct current power supply for operation. Due to its low power consumption, the fan’s electrical supply could also be provided by an external battery or through a small solar panel.
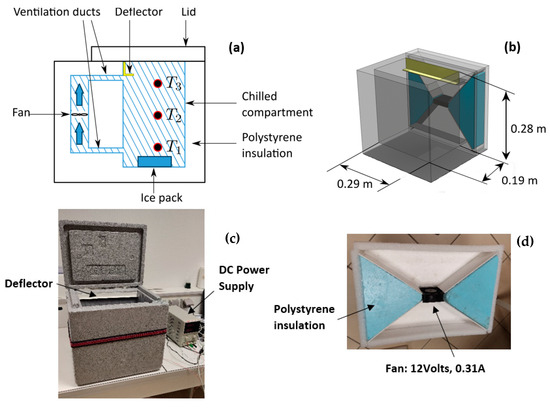
Figure 1.
Schematic diagram illustrating the operation principle of the cold storage distribution box; side cross-sectional view (a), perspective view (b). Photograph of the experimental prototype of the cold storage distribution box (c) and overview of the ventilation device (d).

Table 1.
Dimensions and thermal properties of transport box and ice pack.
To enhance air circulation within the cold storage distribution box, an additional system was devised and integrated with the box structure (Figure 1d). To establish a connection between the ventilation system and the box’s interior, rectangular grooves were cut into the walls’ thickness. Upstream and downstream of the fan, Honeycomb material was used to ensure a uniformly distributed airflow rate. To guide the air out of the ventilation channel (positioned at the upper section of the cooler), a 10 mm deep PVC deflector was affixed to the inner wall of the cold storage distribution box. The air velocity was measured using a KIMO VTS hot-wire thermo-anemometer (KIMO Instruments, Montpon, France) at the exit of the upper grooves. The velocity, measured at various locations, was estimated to be 0.5 m/s, roughly corresponding to an airflow rate of .
Temperature measurements are conducted using 3 miniature type K thermocouples, each with a 0.2 mm diameter, coupled with a GRAPHTEC Midi Logger GL840 data acquisition unit (Graphtec Corporation, Yokohama, Japan). Thermocouples T1, T2, and T3 (refer to Figure 1a) are positioned along the box’s vertical symmetry axis, at distances of 0.03 m, 0.14 m, and 0.22 m from the bottom, respectively. A 30-s acquisition interval is set for all measurements. The initial temperature (t = 0 s) is defined as the temperature recorded during the first measurement interval at t = 30 s following the start of the protocol. An ice pack is positioned at the box’s base to cool the refrigerated compartment. Following each experiment, the ice pack undergoes a freezing cycle in a −18 °C freezer for at least 48 h before being reused for subsequent measurements. Notably, this study primarily aims to compare thermal performances between a ventilated cold storage distribution box and a non-ventilated one. The conclusions outlined in this study stem from experimental observations performed with a single ice pack. We recognize that this setup is inadequate for sustaining the average temperature within the cooler below the critical threshold of 4 °C, as advised by ANSES (French Agency for Food, Environmental and Occupational Health and Safety) for optimal food preservation. However, it is crucial to clarify that the primary objective of this research is not to ascertain the precise quantity of ice packs necessary for optimal food preservation. Instead, our focus lies in examining the thermodynamic efficacy of the storage box under conditions of forced convection.
All measurements were conducted within a temperature-controlled room, maintaining a constant temperature of approximately 20 ± 1 °C. Each experiment or measurement cycle was repeated 3 times to ensure the reproducibility of results. The potential impact of the heat generated by the fan needs precise evaluation. For this purpose, measurements were conducted at room temperature, devoid of any cold source influence, with a specific focus on analyzing the heat emitted by the fan. The findings indicated an average temperature rise of 0.08 °C per hour at a 6 Volts voltage and 0.4 °C per hour at a 12 Volts voltage.
2.2. AI Tool Use
The authors have used ChatGPT 3.5 (Open AI, https://chat.openai.com) for language improvement purposes. The prompt used was “Rephrase to scientific English”.
3. Experimental Results
Time-Dependent Temperature Evolution under Different Heat Transfer Regimes
A preliminary series of measurements was conducted over a period of approximately 3 h, deemed sufficient for food preservation in such transport boxes lacking active cooling systems. The experimental measurements aim to compare the temperature trends in the refrigerated compartment with ventilation (forced convection) and without ventilation (conduction + natural convection). Figure 2 illustrates the temperature trends in both scenarios. It is evident that the temperatures recorded by thermocouples T2 (Middle) and T3 (Top) in the forced convection box are lower than those in the unventilated box. However, it is noteworthy that temperatures recorded at thermocouple T1 in the ventilated transport box are higher than those in the non-ventilated one. It is crucial to note that the temperature recorded at thermocouple T1 does not represent the ice pack’s temperature but rather the air temperature approximately 1 cm above it. In this region where air circulates, we observe a phenomenon of “parasitic heating”, leading to a decreased temperature gradient and a reduction in thermal stratification [18]. The ventilation process, by drawing in cold air from the cooler’s bottom, tends to locally increase the temperature in this area while simultaneously lowering the temperature in the rest of the volume.
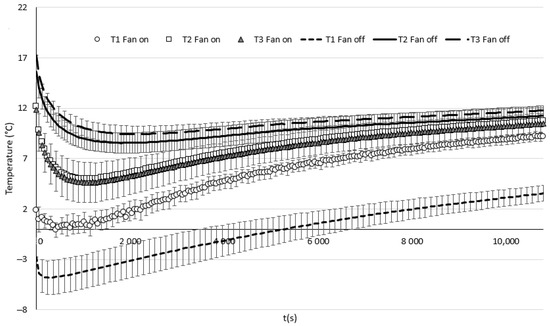
Figure 2.
Thermocouples T1, T2, and T3 temperature profiles in ventilated (fan on) versus non-ventilated (fan off) boxes. The average temperatures are derived from three consecutive measurements, with error bars depicting the standard deviations calculated based on these three measurements.
Additionally, the findings depicted in Figure 2 indicate that air circulation mitigates the thermal layering typical of natural convection. This effect is especially pronounced between thermocouples T2 and T3, where a temperature difference of 0.67 °C without ventilation contrasts with 0.32 °C with ventilation. The air circulation aids in achieving temperature homogenization throughout the refrigerated compartment.
Figure 3 illustrates the evolution of the average temperature between thermocouples T2 and T3, covering the upper half of the cold storage distribution box, for both scenarios under investigation.
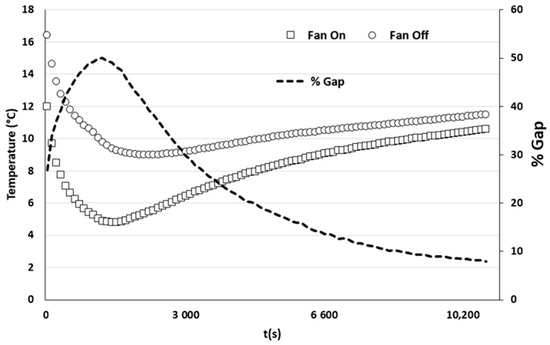
Figure 3.
Temperature evolution averaged between thermocouples T2 and T3 with and without ventilation, along with the percentage difference between the two studied scenarios.
Additionally, it presents the percentage difference between the results obtained with and without ventilation. Despite a gradual decrease over time, the temperature difference between the two configurations remains significant even after three hours of measurements. By examining the curve trends, it becomes evident that air circulation enhances the system’s thermal efficiency by up to 50%. The peak gain is achieved approximately half an hour into the experiment before stabilizing around 8% after 3 h. Notably, the lowest temperatures are observed around 1000 s after the measurement protocol commences. This phenomenon can be attributed to thermal inertia effects, where the temperature of the walls and the air inside the transport box decreases initially before rising again in pursuit of thermal equilibrium.
4. Numerical Methods
In our endeavor to enhance the thermodynamic performance of the system, it is crucial to obtain specific quantitative data regarding the topology and unsteady dynamics of airflow with and without ventilation. To accomplish this objective, we set out to develop a simplified 2D numerical model integrating heat transfer. The initial stage of the numerical process entails defining the 2D geometry, which includes the cold storage distribution box, the ventilation system, the ice pack, and the surrounding air. To accomplish this, we employed the Computer-Aided Design (CAD) software ANSYS Workbench© Design Modeler (ANSYS 2020 R2, ANSYS, Inc., Canonsburg, PA, USA). The dimensions of the cold storage distribution box align with those of the prototype outlined in the experimental methods section. However, for the sake of model simplification, we opted to conduct the analysis in the symmetry plane, as we deemed this approach to provide a satisfactory means of comprehending thermo-convective phenomena holistically. The geometry of the system under examination is depicted in Figure 4, comprising surfaces designated as fluids (i.e., air) and a solid surface (i.e., polystyrene).
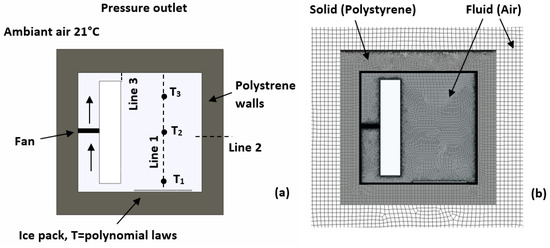
Figure 4.
System geometry and boundary conditions (a); domain meshing illustration (b).
The ambient air temperature surrounding the cold storage distribution box is assumed to remain constant at 21 °C. Meanwhile, the temperature inside the cold storage distribution box evolves throughout the calculation based on external conditions and the rising temperature of the ice pack.
4.1. Computational Grid
Figure 4b depicts the meshing of the computational domain, with a surface mesh generated for both the fluids and the solid. To accurately model heat transfer through the materials, edge sizing was applied within the body of the cold storage distribution box. Special consideration was given to the surface representing the interior of the box. Here, the element size on the walls and within this area is 0.0025 m, while it is 0.01 m for the surrounding air domain. Most elements are rectangular, although some are triangular near the walls. The final mesh comprises approximately 3.8 × 10⁴ cells. To ensure result reliability, meshes of various sizes were tested, with the initial mesh element size being halved iteratively until results became independent of mesh size.
4.2. Boundary Conditions
Figure 4 also illustrates the computational domain and the boundary conditions of the system under study. Heat exchange primarily occurs through conduction across the walls of the cold storage distribution box, supplemented by natural and forced convection within the air enclosed within. Air circulation within the cold storage distribution box is induced by a fan operating on a pressure differential principle between the upstream and downstream of the device. The horizontal air velocity, plotted along Line 3, is monitored and adjusted to correspond with the experimentally determined velocity, which was recorded at an average of 0.5 m/s at the exit of the rectangular grooves, positioned just beneath the deflector (refer to Figure 1). With upward air circulation, the fan extracts cold air near the ice pack to reintroduce it into the upper part of the cold storage distribution box. Numerically modeling the phase change and thermodynamic behavior of an ice pack poses a complex challenge. To simplify this task while preserving realistic fidelity, we used temperature measurements taken directly above the ice pack to define the thermal boundary conditions for cooling production. By analyzing temperature variations just above the cold source in two distinct scenarios (with and without ventilation), we identified four polynomial laws of the second and third degree. Please note that the initial set of equations, spanning the time interval of 0–540 s, represents a cooling phase, whereas the subsequent two equations, spanning the time interval of 540–10,800 s, signify a warming phase.
Figure 5 illustrates the temperature evolution, based on experimental measurements, as well as the trend curves derived from the polynomial laws, which are then used as input data for the calculation code (UDF functions). The temperature evolution in the immediate vicinity of the ice packs in the two studied scenarios is represented by the synthesized equations in Table 2. To accurately model the thermal exchanges between the ambient air and the air inside the cold storage distribution box, a conduction phenomenon is considered through the box walls, consisting of 5 cm of polystyrene.
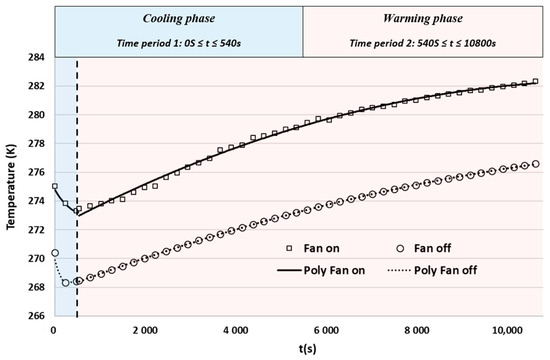
Figure 5.
Graphs derived from experimental measurements conducted with and without ventilation. The trend lines plotted for two intervals (0–540 s and 540–10,800 s) facilitate the derivation of four polynomial laws utilized as input data for the computational code.
Table 2.
Polynomial laws derived from the experimental measurements conducted for the two studied cases (fan off and fan on).
In complement, polynomial laws are integrated into the computational code to incorporate variations in the thermo-physical properties of air with temperature. These laws facilitate the calculation of density, dynamic viscosity, thermal conductivity, and specific heat at each time step within the temperature range of interest (−5 °C to 21 °C). Iterative computation is then performed to simulate the 3-h experimental protocol with a time step of 0.01 s. It is worth noting that the choice of time step aims to optimize computational efficiency while ensuring that the Courant number remains below the limit of 1.
4.3. Fluid Flow and Heat Transfer Modeling
For this study, we employed the commercial computational code ANSYS Fluent® 2020 R2, utilizing the finite volume method to solve the equations governing fluid flow. This computational fluid dynamics (CFD) code facilitated the analysis of a two-dimensional, time-dependent, and non-isothermal numerical approach. The pressure-velocity coupling was resolved using the SIMPLE algorithm, implementing a first-order discretization scheme [19]. The heat transfer regime varies depending on the presence or absence of ventilation. Thus, for the case without ventilation, simulations were conducted with a laminar model, while the standard k-ε turbulence model was chosen for simulations with ventilation. To model radiation effects, the surface-to-surface heat transfer module S2S was utilized. An emissivity of 0.9 was adopted for the box walls according to Margeirsson et al. [11]. The following equations were used to describe heat and mass transfer by convection:
Mass conservation equation
Momentum conservation equation
Energy conservation equation (heat transfer)
where is the pressure, is the fluid density, is the time, is the fluid velocity vector, is the viscous stress tensor, is the specific internal energy, is the conductive heat flux vector, and represents the turbulent heat flux vector.
5. Numerical Results
5.1. Comparison between Experimental and Numerical Findings
The assessment of the computational code’s performance hinges on its ability to faithfully reproduce the temperature evolution within the cold storage distribution box over time. Figure 6 illustrates the comparison between the experimental results and those obtained through CFD calculations for measurement points T2 and T3.
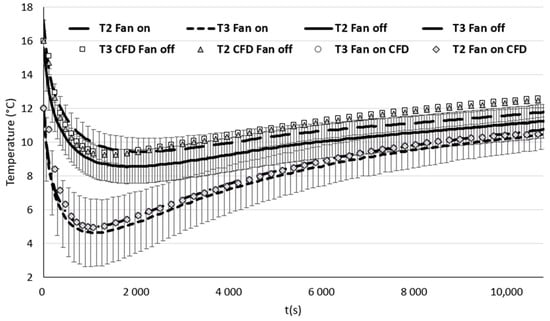
Figure 6.
Comparative analysis of experimental versus numerical data for points T2 and T3. The average temperatures are derived from three consecutive measurements, with error bars depicting the standard deviations calculated based on these three measurements.
The temperature evolution at point T1 is omitted from the graph because the thermal boundary conditions of the numerical model are based on experimental findings. Therefore, the numerical data at point T1 should closely align with the experimental measurements. The comparative analysis depicted in Figure 6 reveals relatively minor deviations between the experimental and numerical datasets for the case without ventilation, particularly in the initial half hour. Following this, the computational code tends to marginally overstate temperatures, albeit with differences hovering around 1 °C by t = 3 h. Conversely, simulations conducted under forced convection impeccably mirror the experimental outcomes. The computational model adeptly forecasts the temperature progression in both scenarios. Ultimately, employing a 2D modeling approach appears to produce consistent results when compared to experimental data, and the development of a 3D model, which is more computationally and developmentally intensive, does not appear necessary. Figure 7 delineates the resultant temperature fields from the computations, firstly without ventilation (predominantly conduction) and subsequently with ventilation (forced convection) at various time points post-initiation of the process. Notably, the temperature scale is deliberately confined to the range [0–12 °C] to accentuate even the subtlest temperature differentials.
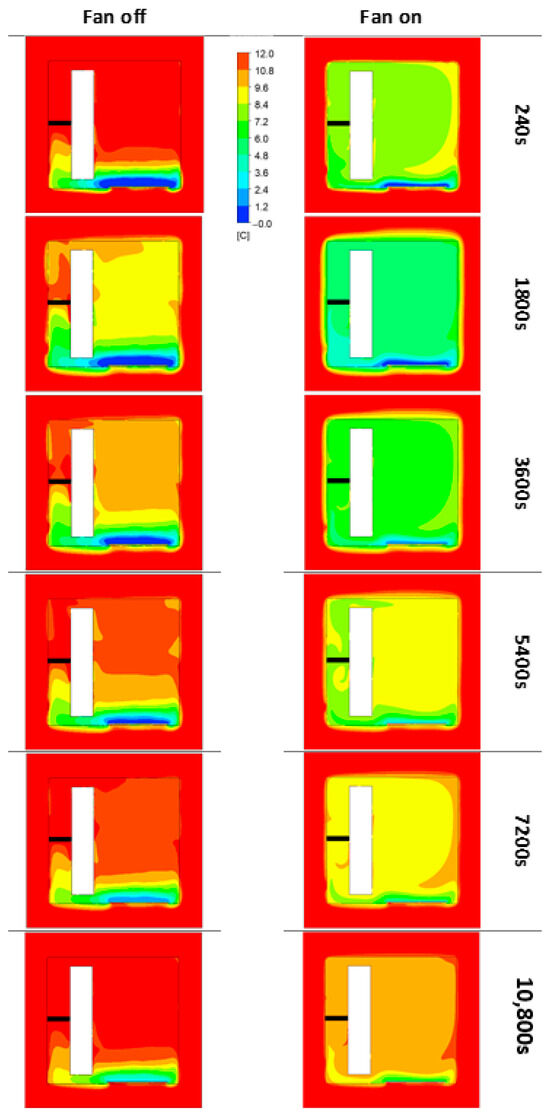
Figure 7.
Temperature distribution of the air inside the cold storage distribution box under conduction (fan off) and forced convection (fan on) conditions at different time intervals from the beginning of the protocol.
Figure 7 distinctly showcases the gradual rise in ice pack temperature, prompting discernible alterations in the temperature distribution, irrespective of the presence or absence of ventilation.
To complete our analysis, Figure 8 illustrates the temperature evolution along Line 1 (refer to Figure 4) at various time points, comparing scenarios with and without ventilation. The results reveal a clear trend depending on the presence of air circulation. With ventilation, temperatures quickly homogenize, as indicated by the linear curves from 0.04 m to 0.27 m. Conversely, without ventilation, we observe pronounced thermal stratification in the lower third of the cold storage distribution box, followed by a gradual temperature increase towards the top.
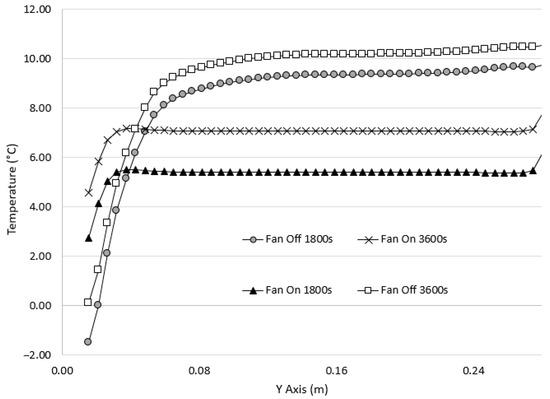
Figure 8.
Temperature evolution along Line 1 at different time intervals from the start of the protocol, with and without ventilation.
It is evident that within the initial four centimeters from the bottom, there is a positive temperature differential between measurements taken with and without ventilation. This implies that in this region, temperatures are lower in the absence of ventilation, indicative of substantial thermal stratification. However, this pattern shifts thereafter, as temperatures recorded with ventilation become lower than those without ventilation, revealing notable temperature disparities ranging between 45 and 75%.
5.2. Heat Conduction across Walls
Thermal conduction through a single-layer wall depends on the temperature difference across the wall, , the thermal conductivity of the material (W/mK), and the heat transfer surface area (m2), while being inversely proportional to the wall thickness (m). The temperature difference acts as the driving force for heat transfer, similar to the voltage difference for electrical current. Experimentally, it has been observed that the rate of thermal conduction through a wall, (W), is directly proportional to the temperature difference (°C) across the wall and the heat transfer surface area (m2), but inversely proportional to the wall thickness.
Heat transfers from the side of the hot fluid to the cold fluid side, with temperature influenced by wall thickness and the overall heat transfer coefficient. Thermal processes involve convection heat transfer from the hot fluid to the wall, conduction through the wall layers, and convection from the wall to the cold fluid. Typically, the heat transfer coefficient by convection from the hot fluid (in our case, external air) to the inner wall surface is lower than that from the cold fluid (indoor air) to the outer wall surface [20]. Figure 9 demonstrates the impact of thermal conduction through a polystyrene wall of 0.05 m thickness at various time points in the protocol, with and without ventilation. Forced convection notably affects the inner wall temperature. Remarkably, the temperature of the outer wall, held constant at 21 °C, remains consistent regardless of ventilation and time elapsed in the protocol. These findings suggest that the chosen wall thickness and material offer effective insulation for the cold storage distribution box, at least under this study’s conditions.
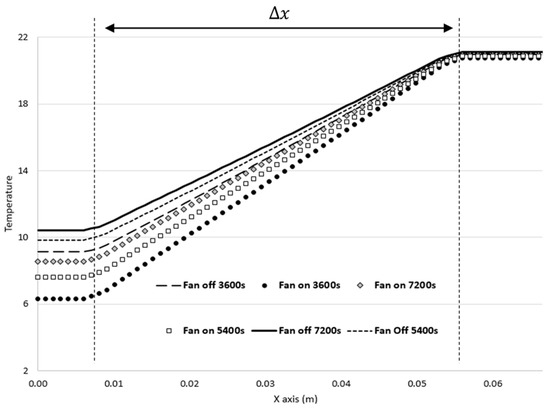
Figure 9.
Temperature variation across the 0.05 m thick polystyrene wall depicted along Line 2 at various protocol time points, with and without ventilation.
Regarding , which signifies the temperature gradient between the inner and outer walls, it spans from 10.7 to 14.4 °C, with the most significant gradient observed under forced convection. Furthermore, there is a noticeable alteration in the temperature gradient across the box walls. Conduction aims to establish thermal equilibrium between the exterior and interior of the box. However, owing to temporary temperature fluctuations, this thermal equilibrium will be attained only when the exterior temperature aligns with that of the interior.
5.3. Influence of Air Velocity on Heat Transfer
In accordance with Newton’s law, fluid motion enhances heat transfer efficiency. The higher the velocity, the greater the heat transfer rate. Therefore, we aimed to validate this correlation by comparing the outcomes of forced convection simulations at two air circulation speeds with those obtained from the simulation conducted without ventilation. It is important to note that the thermal boundary condition remains strictly identical for both investigated velocities. The results depicted in Figure 10 vividly demonstrate enhanced thermodynamic performance of the cold storage distribution box as air velocity increases.
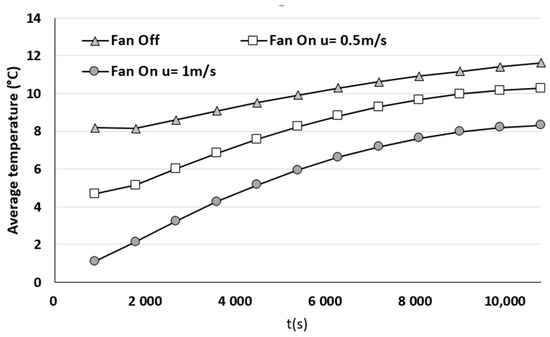
Figure 10.
Temporal evolution of the average temperature measured inside the cold storage distribution box for the case without ventilation and then for both cases with ventilation (u = 0.5 and 1 m/s).
Figure 11 depicts the velocity fields and streamlines at t = 900 s for both studied velocities, as well as for the case without ventilation. The streamlines and velocity fields reveal a prominent swirling structure, rotating clockwise. This flow, circulated through the fan via the network of channels on the left side of the box, enhances heat exchange and mitigates thermal stratification. As a result, a relative temperature homogeneity is observed in the upper two-thirds of the box.
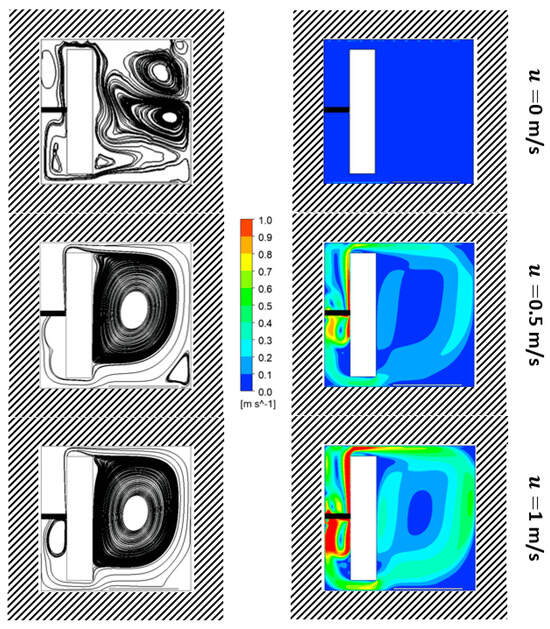
Figure 11.
Streamlines and average velocity fields of the air flow inside the cold storage distribution box with ventilation for the two cases of forced convection (u = 0.5 m/s and 1 m/s), as well as the case without ventilation (u = 0 m/s), at t = 900 s following the start of the protocol.
It is noteworthy that the flow topology remains relatively stable throughout the simulation, thanks to the consistent airflow conditions. With the exception of the ventilation-free case, the flow topology exhibits considerable similarity for both studied velocities. However, flow velocities and air recirculation occur more rapidly at a velocity of u = 1 m/s, exerting a significant impact on heat exchange. In the absence of ventilation, it is primarily the conduction phenomenon that drives air movement. As a result, air movements are less intense compared to those observed under forced convection. Velocities on the order of a few centimeters per second are observed. This finding aligns with velocities observed in natural convection within an insulated box subjected to equivalent temperature gradients [21] and can also be corroborated by experimental measurements conducted in a domestic refrigerator [17].
6. Discussion
The temperature at which food is stored plays a critical role in preventing the growth of harmful bacteria and reducing the risk of foodborne illnesses [22]. According to guidelines from food safety organizations like ANSES, this temperature is typically maintained between 0 °C and +4 °C, at the coldest setting of refrigeration devices [23]. Maintaining food below +4 °C significantly inhibits the growth of pathogenic microorganisms, including notorious bacteria like Listeria monocytogenes and Salmonella enterica. This ensures the freshness and safety of food for consumption. Moreover, maintaining the appropriate storage temperature is vital for preserving the sensory attributes of food, including texture, flavor, and visual appeal. In summary, the storage temperature of food plays a central role in preventing foodborne illnesses and preserving the quality of food items, underscoring its crucial significance in food safety.
To ensure the safety and quality of food during unrefrigerated transportation, insulated boxes are commonly used [9]. These boxes, crafted from insulating materials such as expanded polystyrene (EPS), polyurethane, or cross-linked polyethylene (PEX), are engineered to minimize heat exchange between the interior and exterior environments, thereby maintaining stable temperatures over prolonged durations. They are instrumental in safeguarding food items, particularly perishable goods like dairy, meat, seafood, and fresh produce, by mitigating temperature fluctuations during transit. As a result, insulated boxes help preserve the freshness and quality of food products while reducing the risk of spoilage.
Most cold storage distribution boxes are typically passive, lacking a ventilation system for cooling. However, our research reveals that incorporating ventilation can significantly enhance the thermodynamic efficiency of these so-called passive cold storage distribution boxes. In the absence of ventilation, thermal exchanges occur solely through natural convection, driven primarily by temperature gradients, which can result in thermal stratification (see Figure 7 and Figure 8). This may lead to uneven preservation of products, with lower sections of the container being colder than upper sections [24]. In contrast to natural convection, where cold air tends to settle at the bottom and warm air at the top, forced ventilation actively circulates air, preventing the formation of distinct temperature layers. Without ventilation, thermal stratification occurs, with colder, denser air remaining at the bottom while warmer, lighter air rises. Introducing ventilation allows cold air emitted by the ice pack to be drawn into the bottom and redistributed to the top via the fan. This continuous airflow promotes temperature homogenization and reduces thermal stratification. Our results demonstrate that overall air temperature inside the cold storage distribution box is significantly lower under forced convection. Discrepancies observed in our experimental results (Figure 2 and Figure 3) may vary between 8 and 50% depending on the protocol duration. Thus, it is evident that air circulation significantly enhances the system’s thermal efficiency, with active ventilation facilitating better dispersion of cold air, thereby improving heat exchange efficiency.
Our numerical study, conducted at two different velocities, established a clear causal relationship between flow velocity and the enhancement of heat transfer. For instance, compared to the case without ventilation where air movements can be considered negligible, the average temperature decreases by up to 43% for a velocity of 0.5 m/s, and even up to 76% for a velocity of 1 m/s (see Figure 11). These findings convincingly demonstrate the direct correlation between velocity and heat transfer enhancement.
Nevertheless, even though heat exchanges primarily occur through conduction in the absence of ventilation, the role of convection should not be underestimated. To confirm this, it is necessary to calculate the Peclet number , which quantifies the ratio between heat transfer by convection and conduction:
when considering an air velocity below 0.05 m/s, with a characteristic length equal to the interior height of the box (0.28 m), and , the Peclet number stands at approximately 700. However, with a velocity of 0.5 m/s, the Peclet number increases tenfold, reaching 14,000 for a velocity of 1 m/s. This clearly illustrates that without ventilation, heat transfer is primarily conducted, whereas higher ventilation velocities promote convection. However, it should be noted that in the presence of food, the proportion of heat exchanges conducted through thermal conduction will increase, and the balance between conduction and convection will shift in one direction or the other.
Another benefit of the ventilation system is its ability to maintain a more uniform temperature throughout the transport box, thereby minimizing temperature variations between different regions of the cooler. This ensures optimal storage conditions for the perishable goods. Forced convection also contributes to lowering the temperature at the inner walls of the transport box (refer to Figure 9), thus reducing the thermal gradient between the box’s interior and exterior. For example, one hour after initiating the protocol, the temperature at the inner wall is 2.8 °C lower compared to the wall temperature in the absence of ventilation.
7. Conclusions
This study aimed to optimize the thermodynamic performance of a cold storage distribution box by integrating a ventilation system, in line with Newton’s principle. To achieve this, a prototype made of expanded polystyrene was developed, incorporating an active ventilation system to homogenize temperatures. Thermocouples were used to monitor temperature evolution at various heights within the refrigerated compartment. Measurements were taken with and without ventilation to assess the latter’s impact on the box’s performance. An initial series of measurements, spanning approximately 3 h, was conducted to observe the air temperature evolution in the cold storage distribution boxes with and without active cooling systems.
Concurrently, a 2D thermo-aerodynamic study, employing computational fluid dynamics (CFD), analyzed air movement and evaluated the enhancement of thermo-convective exchanges through forced convection. Numerical modeling of the thermodynamic behavior of the cold source was performed using polynomial laws as input data for the calculation code (UDF functions). The results showed that without ventilation, thermal exchanges primarily occurred through air conduction, whereas with ventilation, exchanges took place via convection. A comparison of experimental and numerical results revealed that the calculation code accurately predicted the temporal evolution of temperature within the cold storage distribution box, particularly under forced convection.
The main findings from the experimental and numerical results are as follows:
- Temperatures recorded in the box with ventilation were lower than those recorded in the box without ventilation;
- The fan releases heat while in operation, but this emitted heat does not significantly diminish the advantages of forced convection in improving heat transfer within the cold storage distribution box;
- Air circulation limited thermal stratification, thereby promoting temperature homogenization;
- The system’s thermal efficiency improved by up to 50%, with the maximum gain achieved after approximately half an hour;
- The average temperature decreased by up to 43% for a velocity of 0.5 m/s, and up to 76% for a velocity of 1 m/s;
- Increasing air velocity facilitated heat exchange and improved the thermodynamic performance of the cold storage distribution box.
The findings outlined in this study should be understood within the context of particular experimental circumstances, notably the utilization of a single ice pack to cool the interior space of the box. In practical scenarios, employing multiple ice packs might become necessary, and the impact of food items on the overall energy balance should also be factored in. The forced convection method represents an efficient solution for preserving food for short periods, not exceeding a few hours, which is particularly suitable for various contexts such as the rapid transport of food items for meal delivery services. Further studies will be necessary, with temperature measurements taken over much longer periods and including heat exchanges with the food.
Author Contributions
Conceptualization, F.B. (Fabien Beaumont) and G.P.; methodology, S.M. and F.B. (Fabien Bogard); software, F.B. (Fabien Beaumont); validation, G.P., F.B. (Fabien Bogard) and S.M.; formal analysis, F.B. (Fabien Beaumont); investigation, G.P.; resources, S.M.; data curation, G.P. and F.B. (Fabien Bogard); writing—original draft preparation, F.B. (Fabien Beaumont); writing—review and editing, S.M.; visualization, G.P. and F.B. (Fabien Bogard); supervision, G.P.; project administration, S.M. All authors have read and agreed to the published version of the manuscript.
Funding
This research received no external funding.
Data Availability Statement
The datasets generated during the current study are available from the first author upon reasonable request.
Acknowledgments
The authors acknowledge the use of ChatGPT 3.5 (Open AI, https://chat.openai.com) for language improvement purposes only.
Conflicts of Interest
The authors declare no conflicts of interest.
Nomenclature
| Heat transfer area [m2] | |
| Specific heat [J·kg−1·K−1] | |
| Acceleration due to gravitation [m·s−2] | |
| Grashof number [–] | |
| Heat transfer coefficient [W·m−2·K−1] | |
| Height [m] | |
| Rate of heat transfer [W] | |
| Prandtl number [–] | |
| Rayleigh number [–] | |
| Time [s] | |
| Temperature [°C] | |
| Wall temperature [°C] | |
| Fluid temperature near the wall [°C] | |
| Temperature difference [°C] | |
| Wall thickness [m] | |
| Greek letters | |
| Thermal diffusivity [m2·s−1] | |
| Thermal expansion coefficient [K−1] | |
| Thermal conductivity [W·m−1·K−1] | |
| Density [kg·m−3] | |
| Convective heat flux [W] | |
References
- Costa, A.I.A.; Schoolmeester, D.; Dekker, M.; Jongen, W.M.F. To Cook or Not to Cook: A Means-End Study of Motives for Choice of Meal Solutions. Food Qual. Prefer. 2007, 18, 77–88. [Google Scholar] [CrossRef]
- Geeroms, N.; Verbeke, W.; Van Kenhove, P. Consumers’ Health-Related Motive Orientations and Ready Meal Consumption Behaviour. Appetite 2008, 51, 704–712. [Google Scholar] [CrossRef]
- Ahmeda, M.; Meadeb, O.; Medina, M.A. Reducing Heat Transfer Across the Insulated Walls of Refrigerated Truck Trailers by the Application of Phase Change Materials. Energy Convers. Manag. 2010, 51, 383–392. [Google Scholar] [CrossRef]
- Oró, E.; Miró, L.; Farid, M.M.; Cabeza, L.F. Thermal Analysis of a Low Temperature Storage Unit Using Phase Change Materials without Refrigeration System. Int. J. Refrig. 2012, 35, 1709–1714. [Google Scholar] [CrossRef]
- Burgess, G. Practical Thermal Resistance and Ice Requirement Calculations for Insulating Packages. Packag. Technol. Sci. 1999, 12, 75–80. [Google Scholar] [CrossRef][Green Version]
- Choi, S.J.; Burgess, G. Practical Mathematical Model to Predict the Performance of Insulating Packages. Packag. Technol. Sci. 2007, 20, 369–380. [Google Scholar] [CrossRef]
- Defraeye, T.; Cronjé, P.; Berry, T.; Opara, U.L.; East, A.; Hertog, M.; Verboven, P.; Nicolai, B. Towards Integrated Performance Evaluation of Future Packaging for Fresh Produce in the Cold Chain. Trends Food Sci. Technol. 2015, 44, 201–225. [Google Scholar] [CrossRef]
- East, A.; Smale, N.J.; Kang, S. A Method for Quantitative Risk Assessment of Temperature Control in Insulated Boxes. Int. J. Refrig. 2009, 32, 1505–1513. [Google Scholar] [CrossRef]
- East, A.R.; Smale, N.J. Combining a Hybrid Genetic Algorithm and a Heat Transfer Model to Optimise an Insulated Box for Use in the Transport of Perishables. Vaccine 2008, 26, 1322–1334. [Google Scholar] [CrossRef]
- Gospavić, R.; Margeirsson, B.; Popov, V. Mathematical Model for Estimation of the Three-Dimensional Unsteady Temperature Variation in Chilled Packaging Units. Int. J. Refrig. 2012, 35, 1304–1317. [Google Scholar] [CrossRef]
- Margeirsson, B.; Gospavić, R.; Pálsson, H.; Arason, S.; Popov, V. Experimental and Numerical Modelling Comparison of Thermal Performance of Expanded Polystyrene and Corrugated Plastic Packaging for Fresh Fish. Int. J. Refrig. 2011, 34, 573–595. [Google Scholar] [CrossRef]
- Margeirsson, B.; Pálsson, H.; Popov, V.; Gospavić, R.; Arason, S.; Sveinsdóttir, K.; Jónsson, M. Numerical Modelling of Temperature Fluctuations in Superchilled Fish Loins Packaged in Expanded Polystyrene and Stored at Dynamic Temperature Conditions. Int. J. Refrig. 2012, 35, 1318–1326. [Google Scholar] [CrossRef]
- Navaranjan, N.; Fletcher, G.C.; Summers, G.; Parr, R.; Anderson, R. Thermal Insulation Requirements and New Cardboard Packaging for Chilled Seafood Exports. J. Food Eng. 2013, 119, 395–403. [Google Scholar] [CrossRef]
- Zoughaib, A.; Clodic, D. Comparison of Energy Consumption of Ventilated and Natural Convection Evaporators of Refrigerators and Freezers. In Proceedings of the International Refrigeration and Air Conditioning Conference, West Lafayette, IN, USA, 9–12 July 2002. Paper 621. [Google Scholar]
- Huang, Y.; Ge, J.; Chen, Y.; Zhang, C. Natural and Forced Convection Heat Transfer Characteristics of Single-Phase Immersion Cooling Systems for Data Centers. Int. J. Heat Mass Transf. 2023, 207, 124023. [Google Scholar] [CrossRef]
- Gilago, M.C.; Chandramohan, V.P. Performance Evaluation of Natural and Forced Convection Indirect Type Solar Dryers During Drying Ivy Gourd: An Experimental Study. Renew. Energy 2022, 182, 934–945. [Google Scholar] [CrossRef]
- Laguerre, O.; Ben Amara, S.; Moureh, J.; Flick, D. Numerical Simulation of Air Flow and Heat Transfer in Domestic Refrigerators. J. Food Eng. 2007, 81, 144–156. [Google Scholar] [CrossRef]
- Saury, D.; Rouger, N.; Djanna, F.; Penot, F. Natural Convection in an Air-Filled Cavity: Experimental Results at Large Rayleigh Numbers. Int. Commun. Heat Mass Transf. 2011, 38, 679–687. [Google Scholar] [CrossRef]
- Elfahem, R.; Bouchet, B.; Abbes, B.; Legrand, F.; Polidori, G.; Beaumont, F. Investigating Heat Transfer in Whole-Body Cryotherapy: A 3D Thermodynamic Modeling Approach with Participant Variability. Fluids 2024, 9, 61. [Google Scholar] [CrossRef]
- Paraschiv, L.S.; Acomi, N.; Serban, A.; Paraschiv, S. A Web Application for Analysis of Heat Transfer Through Building Walls and Calculation of Optimal Insulation Thickness. Energy Rep. 2020, 6, 343–353. [Google Scholar] [CrossRef]
- Leungtongkum, T.; Laguerre, O.; Flick, D.; Denis, A.; Duret, S.; Chaomuang, N. Experimental Investigation of Airflow and Heat Transfer by Natural Convection in an Insulated Box with a Phase Change Material Using a Particle Image Velocimetry Technique. J. Food Eng. 2023, 336, 111207. [Google Scholar] [CrossRef]
- Amit, S.K.; Uddin, M.M.; Rahman, R.; Islam, S.M.R.; Khan, M.S. A Review on Mechanisms and Commercial Aspects of Food Preservation and Processing. Agric. Food Secur. 2017, 6, 51. [Google Scholar] [CrossRef]
- Derens-Bertheau, E.; Osswald, V.; Laguerre, O.; Alvarez, G. Cold Chain of Chilled Food in France. Int. J. Refrig. 2015, 52, 161–167. [Google Scholar] [CrossRef]
- Laguerre, O.; Ben Amara, S.; Flick, D. Experimental Study of Heat Transfer by Natural Convection in a Closed Cavity: Application in a Domestic Refrigerator. J. Food Eng. 2005, 70, 523–537. [Google Scholar] [CrossRef]


Disclaimer/Publisher’s Note: The statements, opinions and data contained in all publications are solely those of the individual author(s) and contributor(s) and not of MDPI and/or the editor(s). MDPI and/or the editor(s) disclaim responsibility for any injury to people or property resulting from any ideas, methods, instructions or products referred to in the content. |
© 2024 by the authors. Licensee MDPI, Basel, Switzerland. This article is an open access article distributed under the terms and conditions of the Creative Commons Attribution (CC BY) license (https://creativecommons.org/licenses/by/4.0/).