Article

Texture and Twinning Evolution of Cold-Rolled Industrial Pure Zirconium

1
School of Material and Metallurgy, Inner Mongolia University of Science and Technology, Baotou 014010, China
2
Inner Mongolia Autonomous Region Key Laboratory of Advanced Metal Materials, Baotou 014010, China
3
Collaborative Innovation Center of Integrated Exploitation of Bayan Obo Multi-Metal Resources, Inner Mongolia University of Science and Technology, Baotou 014010, China
4
Material of Science and Engineering School, University of Science and Technology Beijing, Beijing 100083, China
*
Author to whom correspondence should be addressed.
Processes 2024, 12(5), 948; https://doi.org/10.3390/pr12050948
Submission received: 2 April 2024 / Revised: 2 May 2024 / Accepted: 4 May 2024 / Published: 7 May 2024
(This article belongs to the Special Issue Digital Research and Development of Materials and Processes)

Abstract

:
Industrial pure zirconium plays an essential role as a structural material in the nuclear energy sector. Understanding the deformation mechanisms is crucial for effectively managing the plasticity and texture evolution of industrial pure zirconium. In the present study, the texture and microstructure evolution of industrial pure zirconium during the cold-rolling process have been characterized by XRD, EBSD, and TEM. The influences of various twins on texture evolution have also been simulated by the reaction stress model. The effects of slip and twinning on the deformation behavior and texture evolution have been discussed based on crystallographic and experimental considerations. Cold rolling yields a typical bimodal texture, resulting in the preferential < 2 1 - 1 - 0 >//RD orientation. The activation of the deformation mechanisms during cold rolling follows the sequential trend of slip, twinning, local slip. Experimental characterization and reaction stress simulation illustrate that T1 twins dominate in the early stage, whereas C2 twins develop at the later stage of the cold-rolling process. Twinning, especially the T1 twin, contributes to the formation of the {0001}< 10 1 - 0 > orientation.

1. Introduction

As a hexagonal metal, zirconium has been the subject of extensive research in the literature due to its applicability across various industries, including petrochemicals, military, nuclear power, aerospace, and nuclear reactions [1,2,3]. Specifically, industrial pure zirconium is widely utilized in the petrochemical industry, owing to its excellent corrosion resistance [4,5]. Furthermore, its low thermal neutron absorption cross section renders it an ideal material for the cladding of fuel elements in nuclear power plants [6]. Over the operational lifespan of a nuclear reactor, the cladding of fuel elements is subjected to cyclic loading, as a consequence of the vibrations induced by fluid movement within the reactor, which can precipitate fatigue failure [6,7]. Consequently, industrial pure zirconium must exhibit not only exceptional corrosion resistance but also superior mechanical properties to ensure the integrity and longevity of the fuel element cladding. The texture of industrial pure zirconium has a direct correlation with its tensile and compressive properties [5]. The stability of the texture determines its resistance to corrosion in aggressive environments, and it also influences the characteristics of radiation-induced swelling in nuclear applications [8]. Consequently, a thorough understanding of the texture evolution, as driven by the deformation mechanisms in zirconium, is essential for refining processing techniques and enhancing overall performance [9]. The deformation mechanisms prevalent in zirconium alloys encompass dislocation slip, dynamic recrystallization, and twinning. During rolling, each of these mechanisms exerts a distinct influence on the texture development of zirconium alloys [10,11]. Dislocation slip promotes grain deformation and orientation modification, which in turn results in distinct textures. The process of dynamic recrystallization triggers grain nucleation and growth, thereby influencing texture stability [12]. Twinning in materials occurs due to variations in shear stress and changes in the rolling direction, which initiate the progressive development of the material’s texture [13].
Zirconium exhibits several activatable slip and twinning systems, as detailed in Table 1. To date, the slip systems identified in zirconium alloys include: { 10 1 - 0 } < 1 2 - 10 > prismatic slip, { 0001 } < 11 2 - 0 > basal slip, { 10 1 - 1 } < 1 2 - 10 >   pyramidal slip along the <a> direction, and { 10 1 - 1 } < 11 2 - 3 - > and { 11 2 - 1 } < 2 - 113 > pyramidal slip along the <c+a> direction, as illustrated in Figure 1. The prismatic slip in the <a> direction is predominantly activated, being attributable to its minimal requirement for critical resolved shear stress (CRSS) for slip initiation. In contrast, plastic deformation along the <c> axis is predominantly facilitated through the activation of pyramidal <c+a> slips and twinning mechanisms. The twins observed in Zr, contingent upon the strain applied along the <c> axis, include { 10 1 - 2 } < 10 1 - 1 > (T1) and { 11 2 - 1 } < 11 2 - 6 - > (T2) tensile twins, as well as { 11 2 - 2 } < 11 2 - 3 - > (C1) and { 10 1 - 1 } < 10 1 - 2 - > (C2) compression twins. These are depicted in Figure 2. The deformation mechanisms of pure zirconium (Zr) have been extensively studied [5,14,15]. At room temperature, pure Zr deforms through a combination of slip and twinning processes. The prismatic slip system, specifically the slip on the prism plane, does not readily accommodate deformation along the c-axis of the grains. Consequently, the activation of the pyramidal slip system becomes more pronounced at this temperature. The primary twin systems observed are tensile twins and compressive twins, which work in concert with the slip systems to coordinate deformation in a characteristic sequence: slip → twin → slip. With increasing deformation, the difficulties associated with initiating basal slip and pyramidal slip are mitigated. This reduction in initiation challenges promotes a shift to a more complex, multi-slip mechanism, which subsequently makes the nucleation and propagation of twins more difficult. Nonetheless, the presence of twins remains a notable feature in specimens that have undergone significant deformation. At room temperature, the primary deformation mechanism in zirconium alloys is the { 10 1 - 1 } < 1 2 - 10 > prismatic slip. However, if the crystal orientation of the alloy is not conducive to the { 10 1 - 0 } < 1 2 - 10 > slip, the aforementioned twin patterns may still be observed [5]. As the deformation temperature increases, pyramidal and basal slips become active, leading to their dominance in the deformation process.
The complex interplay between texture and deformation mechanisms during the rolling process of zirconium alloys has garnered significant interest. Chapuis et al. [16] conducted an investigation into the deformation mechanisms of hexagonal close-packed (HCP) metals, discovering that the basal slip and the pyramidal <a> slip induce rotation of the <c> axis in the direction of compression. Conversely, the pyramidal <c+a> slip prompts the <c> axis to rotate towards the extension direction. Upon the initiation of the prismatic slip, the crystal lattice undergoes a rotational displacement about the <c> axis, while the position of the <c> axis itself remains invariant. Simultaneously, the prism rotates in the rolling direction. The evolution of texture is influenced by the interaction between different deformation mechanisms; factors such as temperature and the initial texture affect the prioritization order of the deformation mechanisms’ activation. Researchers Tome CN and Linga MK, as cited in references [17,18], conducted experiments by rolling zirconium plates across a spectrum of temperatures. The findings revealed that the texture of cold-rolled zirconium plates closely resembled that of the hot-rolled counterparts within the α-phase low-temperature domain. The base plane of most grains rotated and clustered on the ND (the normal direction of the rolling surface)-TD (transverse direction of rolling) plane perpendicular to the rolling direction, and the angle deviated from the normal direction of the rolling surface by about 30°. The texture is predominantly concentrated at the center of the polar diagram, aligned with the normal direction (ND). This concentration is attributed to the primary role of the { 10 1 - 0 } < 1 2 - 10 > slip system in deformation processes. Consequently, within the low-temperature range of the α phase, rolling at these temperatures predominantly facilitates the formation of a [0002] basal texture that is oriented normal to the rolling surface. In a study by Peng Qian [19], zirconium alloys were initially heated to the high-temperature α phase region prior to rolling. This approach was contrasted with the conventional practice of rolling within the low-temperature α phase region. It was observed that, as the temperature increased, the pyramidal slip systems { 10 1 - 1 } < 2 - 113 > and { 11 2 - 1 } < 2 - 113 > exhibited a lower yield stress and a higher Schmid factor, thereby emerging as the predominant deformation mechanisms. Consequently, a texture with a base orientation predominantly in the normal direction of the rolled surface is formed post-rolling. Peng Qian [20] continued her research on the texture of N18 new zirconium alloy sheet, demonstrating that the primary texture types remained consistent after annealing through hot rolling, cold rolling, and recrystallization near the α/(α+β) phase transition point. Zeng [21] and Luan found that a significant number of { 10 1 - 0 } //RD (rolling direction) texture components are present in the samples exhibiting the prismatic slip. This suggests a strong correlation between the { 10 1 - 0 } //RD texture and the phenomenon of prismatic slip. Following hot-rolling experiments on zirconium alloy sheets, Chen Jianwei [22] observed that when there was an initial preference for the transverse direction in texture, the resulting texture after both hot and cold rolling resulted in a < 10 1 - 0 > //RD basal texture. Luan, Xiao et al. [23] conducted rolling experiments on annealed pure zirconium sheets, which initially exhibited a double-peak texture at room temperature. They observed that the texture remained largely consistent throughout the rolling process, with a gradual concentration along the ND direction. Additionally, there was a progressive transformation of the initial < 11 2 - 0 > //RD texture to a < 10 1 - 0 > //RD orientation. The rationale for this observation lies in the synergistic effects of the prismatic slip and the pyramidal <c+a> slip, collectively contributing to the emergence of a bimodal basal texture, as previously elucidated by Ballinger [24].
Twinning serves as a pivotal deformation mechanism in HCP metals, resulting in pronounced texture evolution. McCabe [25] et al. have observed that the deformation of pure zirconium at room temperature, particularly the compression of c-axis parallel textures, is predominantly governed by the columnar slip and primary { 11 2 - 2 } compression twins. In contrast, for the compression of textures perpendicular to the primary c-axis, the dominant deformation mechanisms are prism slip and the first-generation { 10 1 - 2 } tensile twins. Tenckhoff [26] posits that, at low temperatures, the primary deformation mechanisms for zirconium alloys involve activation of { 10 1 - 2 } < 10 1 - 1 > , { 11 2 - 1 } < 11 2 - 6 > , and { 11 2 - 2 } < 11 2 - 3 > twinning systems. At room temperature, the predominant deformation mechanism in zirconium alloys is the { 10 1 - 0 } < 1 2 - 10 > prism slip. However, if the crystal orientation of the alloy is not conducive to the { 10 1 - 0 } < 1 2 - 10 > slip, the aforementioned twins may be observed. As the deformation temperature increases, both pyramidal and basal slips become active, resulting in slip-based deformation becoming the main mechanism. It is evident that the texture evolution of zirconium alloy during deformation is inevitably influenced by the synergistic activations of both slip and twinning. However, twinning, especially the interaction between slip and twinning in relation to texture evolution, has rarely been explored in zirconium-based alloys.
A thorough understanding of the deformation mechanisms of industrial pure zirconium and their influence on texture evolution is paramount. This knowledge is crucial for effectively managing the material’s plasticity and for the strategic manipulation of its textural properties. In the present study, we used hot-rolled industrial pure zirconium plates, which are frequently used as substrates in the cold-rolling process, to serve as the starting materials for our cold-rolling experiments. The texture and microstructure of the material during cold rolling have been systematically studied. Twinning phenomena have been observed and characterized by TEM and EBSD. The influences of various twins on texture evolution have also been simulated using the reaction stress model. The effects of slip and twinning on the deformation behavior and texture evolution have been discussed based on crystallographic and experimental considerations.

2. Materials and Methods

2.1. Experiment

Following the heating of the industrial pure zirconium billet to a temperature of 900 ± 20 °C, a 180 mm slab is subjected to roughing processes in a reciprocating mill. Subsequently, it undergoes hot rolling to yield a finished product with a thickness ranging between 5.0 and 5.5 mm, utilizing a furnace coil mill for this purpose. The final product is segmented using a wire cutter into several samples, each measuring 20 mm in length, 10 mm in width, and 5 mm in height. The specimens underwent cold rolling to achieve varying strains of 10%, 20%, and 30% using a double-roll mill, which operated at a rolling speed of 0.2 m/s with mill rolls measuring 170 mm in diameter. The reduction in thickness was observed to be 0.l mm with each successive pass.
Macroscopic deformation textures, deformed microstructures, grain orientations, and twin boundaries were characterized using X-ray diffraction (XRD-D8 Advanced) (Bruker, Billerica, MA, USA), electron backscatter diffraction (Oxford HKL Channel 5) (Oxford Instruments, Witney Oxon, UK), and transmission electron microscopy (TEM-JEOL 2100F) (JELO, Beijing, China). Four pole figures, namely 0002 , ( 10 1 - 0 ) , ( 10 1 - 2 ) , and ( 10 1 - 1 ) , were meticulously measured on the TD-RD surface of the sample. Following this, an orientation distribution function (ODF) was computed based on these observed pole figures. The XRD of the instrument is as follows: experimental voltage: 30 kV; experimental current: 30 mA; cobalt target; Kα radiation; pole figure measurement range of chi = 0°~70°, phi = 0°~360°; Δchi = Δphi = 5°. The EBSD collected the RD-ND cross section of each sample, utilizing a scanning size of 350 μm × 350 μm, with a step size of 1 μm. The preparation process for the EBSD samples entailed sanding using emery paper, followed by electrochemical polishing in a solution composed of 70 mL methanol, 20 mL butyl cellosolve, and 10 mL perchloric acid. Following EBSD calibration, Channel 5 software (5.12.74.00) suite was employed for data processing, thereby enabling the extraction of detailed information regarding both the microstructure and the texture of the material. For the preparation of TEM specimens, an EDM (Electrical Discharge Machining) cutter was utilized to precisely trim multiple coarse-ground samples, measuring 6 mm by 5 mm by 0.5 mm, from the central region of the deformed material. Lamellar specimens were meticulously polished to achieve a target thickness of approximately 55 µm, utilizing a sequence of metallographic sandpapers with progressively finer grits: 800#, 1000#, 1600#, 2000#, and 3000#. Subsequently, a punch was employed to excise 3 mm diameter circular, ideally from the central region of each lamella. These discs were then further refined through a final ion-thinning process.
The reaction stress (RS) model posits that grains undergo deformation due to the combined effects of external loading and intergranular reaction stresses. Initially, plastic deformation is instigated by external loading, which is then followed by the involvement of intergranular reaction stress in subsequent deformation, taking into account the statistical environment. The RS model, based on the consistency of intergranular stress and strain, analyzes the activation of the slip and the transition of crystal orientation transition during deformation. This model adeptly replicates the evolution of deformation texture in both bcc and fcc metals and alloys, as evidenced by studies [27,28,29,30,31]. Notably, the RS model perceives grains not as isolated entities but as integral components of a system. These actions and deformations result from the coordinated interactions among these grains. The RS model statistically predicts the crystallographic deformation and the sequential activation of slip systems. The process begins with a single slip system undergoing external loading, leading to the accumulation of reaction stress. When this stress surpasses a predetermined threshold, another slip system becomes activated. This cycle of stress accumulation, new slip activation, and further stress accumulation continues until the target strain is achieved. Consequently, the RS model is employed in this study to simulate the concentration of orientation following the initiation of a single twin. The progression of the orientation rolling process is simulated using MATLAB, with the aid of MTEX. MATLAB (R2023a), a commercial mathematical software developed by MathWorks (Natick, MA, USA), is commonly used for algorithm development, data analysis, and numerical computation. MTEX [32] is an all-encompassing, open-source MATLAB toolbox that is freely accessible and addresses a multitude of challenges within the field of quantitative texture analysis. This includes the modeling of orientation distribution functions (ODFs), inverting pole figures to ODFs, analyzing electron backscatter diffraction (EBSD) data, simulating grain microstructures, and investigating anisotropic physical properties. The experimental procedure is depicted in Figure 3.

2.2. Simulation Method

When utilizing the reaction stress model is used to compute the orientation alteration of a grain, it is preferable to select the slip system with the most significant orientation factor. This model takes into account both the external load (external stress) and the specific intergranular reaction stress.
The grain orientation can be articulated through the G matrix:
G = u r h v s k w t l
The external stress in the idealized state is denoted as follows:
σ i j = σ 11 σ 12 σ 13 σ 21 σ 22 σ 23 σ 31 σ 32 σ 33 = σ y 0.5 0 0 0 0 0 0 0 0.5
The reaction stress is computed utilizing the strain tensor of the slip system. For a slip system {n1, n2, n3} <b1, b2, b3>, the strain tensor ( ε ij p ) can be derived from the following type:
ε ij p = ε 11 p ε 12 p ε 13 p ε 21 p ε 22 p ε 23 p ε 31 p ε 32 p ε 33 p = δ s b 1 n 1 1 2 ( b 1 n 2 + b 2 n 1 ) 1 2 ( b 1 n 3 + b 3 n 1 ) 1 2 ( b 2 n 1 + b 1 n 2 ) b 2 n 2 1 2 ( b 2 n 3 + b 3 n 2 ) 1 2 ( b 3 n 1 + b 1 n 3 ) 1 2 ( b 3 n 2 + b 2 n 3 ) b 3 n 3
In the given context, the variable denoted as “slip tangent” is defined as δ s = Δ s l , where Δ s represents the average cumulative total slip amount across each slip zone, and l signifies the average distance between the slip bands in the n direction.
Based on this premise, the reaction stress can be deduced from the given formula:
σ i j e = σ s μ 2 d b 0 ε 12 p ε 13 p ε 21 p ε 22 p ε 23 p ε 31 p ε 32 p 0
Following the incorporation of additional reaction stress, the cumulative stress exerted on the deformed grain is delineated as follows:
σ ij = σ s 1 2 2 μ ε 12 p d b 2 μ ε 13 p d b 2 μ ε 21 p d b 2 μ ε 22 p d b 2 μ ε 23 p d b 2 μ ε 31 p d b 2 μ ε 32 p d b 1 2
µ—orientation factor that activates the slip system;
b—slip system of zirconium, b = 0.3232 nm (HCP zirconium);
d—average dislocation spacing, d = 1 ρ , where dislocation density, ρ, is the initial dislocation density.
The dislocation density of annealed metal is denoted as ρ 0 = 10 12 / m 2 , while that of a severely deformed metal, with a shape variability of 98%, is represented by ρ h = 10 18 / m 2 . The dislocation density in the metal during deformation adheres to the given formula:
ρ = ρ 0 10 6 ε 33 / 4
Upon the initiation of the slip system and the progressive accumulation of slip tangent variables, the reaction stress borne by the slip system does not exhibit an infinite increase. Instead, such an increase will reach a maximum limit. The boundary conditions under which this occurs are delineated as follows:
σ ij lim = σ 11 = σ 33 σ 22 σ 12 α 12 σ s / 2 σ 13 α 31 σ s / 2 σ 21 α 12 σ s / 2 σ 22 α 22 σ s / 2 σ 23 α 23 σ s / 2 σ 31 α 31 σ s / 2 σ 32 α 23 σ s / 2 σ 33 = σ s / 2
where α ij is the reaction shear stress coefficient, the value of which is 0–1.
According to the Frank–Read theory, σ s satisfies the equation:
σ s = τ c µ = Gb µ d = Eb 2 ( 1 + v ) µ d
E—elastic modulus;
v—Poisson’s ratio.
The initiation of the slip system and the alteration in orientation under the total stress must be determined, followed by an evaluation of the orientation change. The orientation change, denoted as G′, can be calculated using the following formula:
x 1 x 2 x 3 = 1 δ s + b 1 n 1 b 1 n 2 b 1 n 3 b 2 n 1 1 δ s + b 2 n 2 b 2 n 3 b 3 n 1 b 3 n 2 1 δ s + b 3 n 3 1 0 0 0 1 0 0 0 1 s = 1 δ s + b 1 n 1 b 1 n 2 b 1 n 3 b 2 n 1 1 δ s + b 2 n 2 b 2 n 3 b 3 n 1 b 3 n 2 1 δ s + b 3 n 3
ND = x 1 × x 2 x 1 × x 2 ; RD = x 1 x 1 ; TD = ND × RD
G = G [ RD TD ND ]

3. Results and Discussion

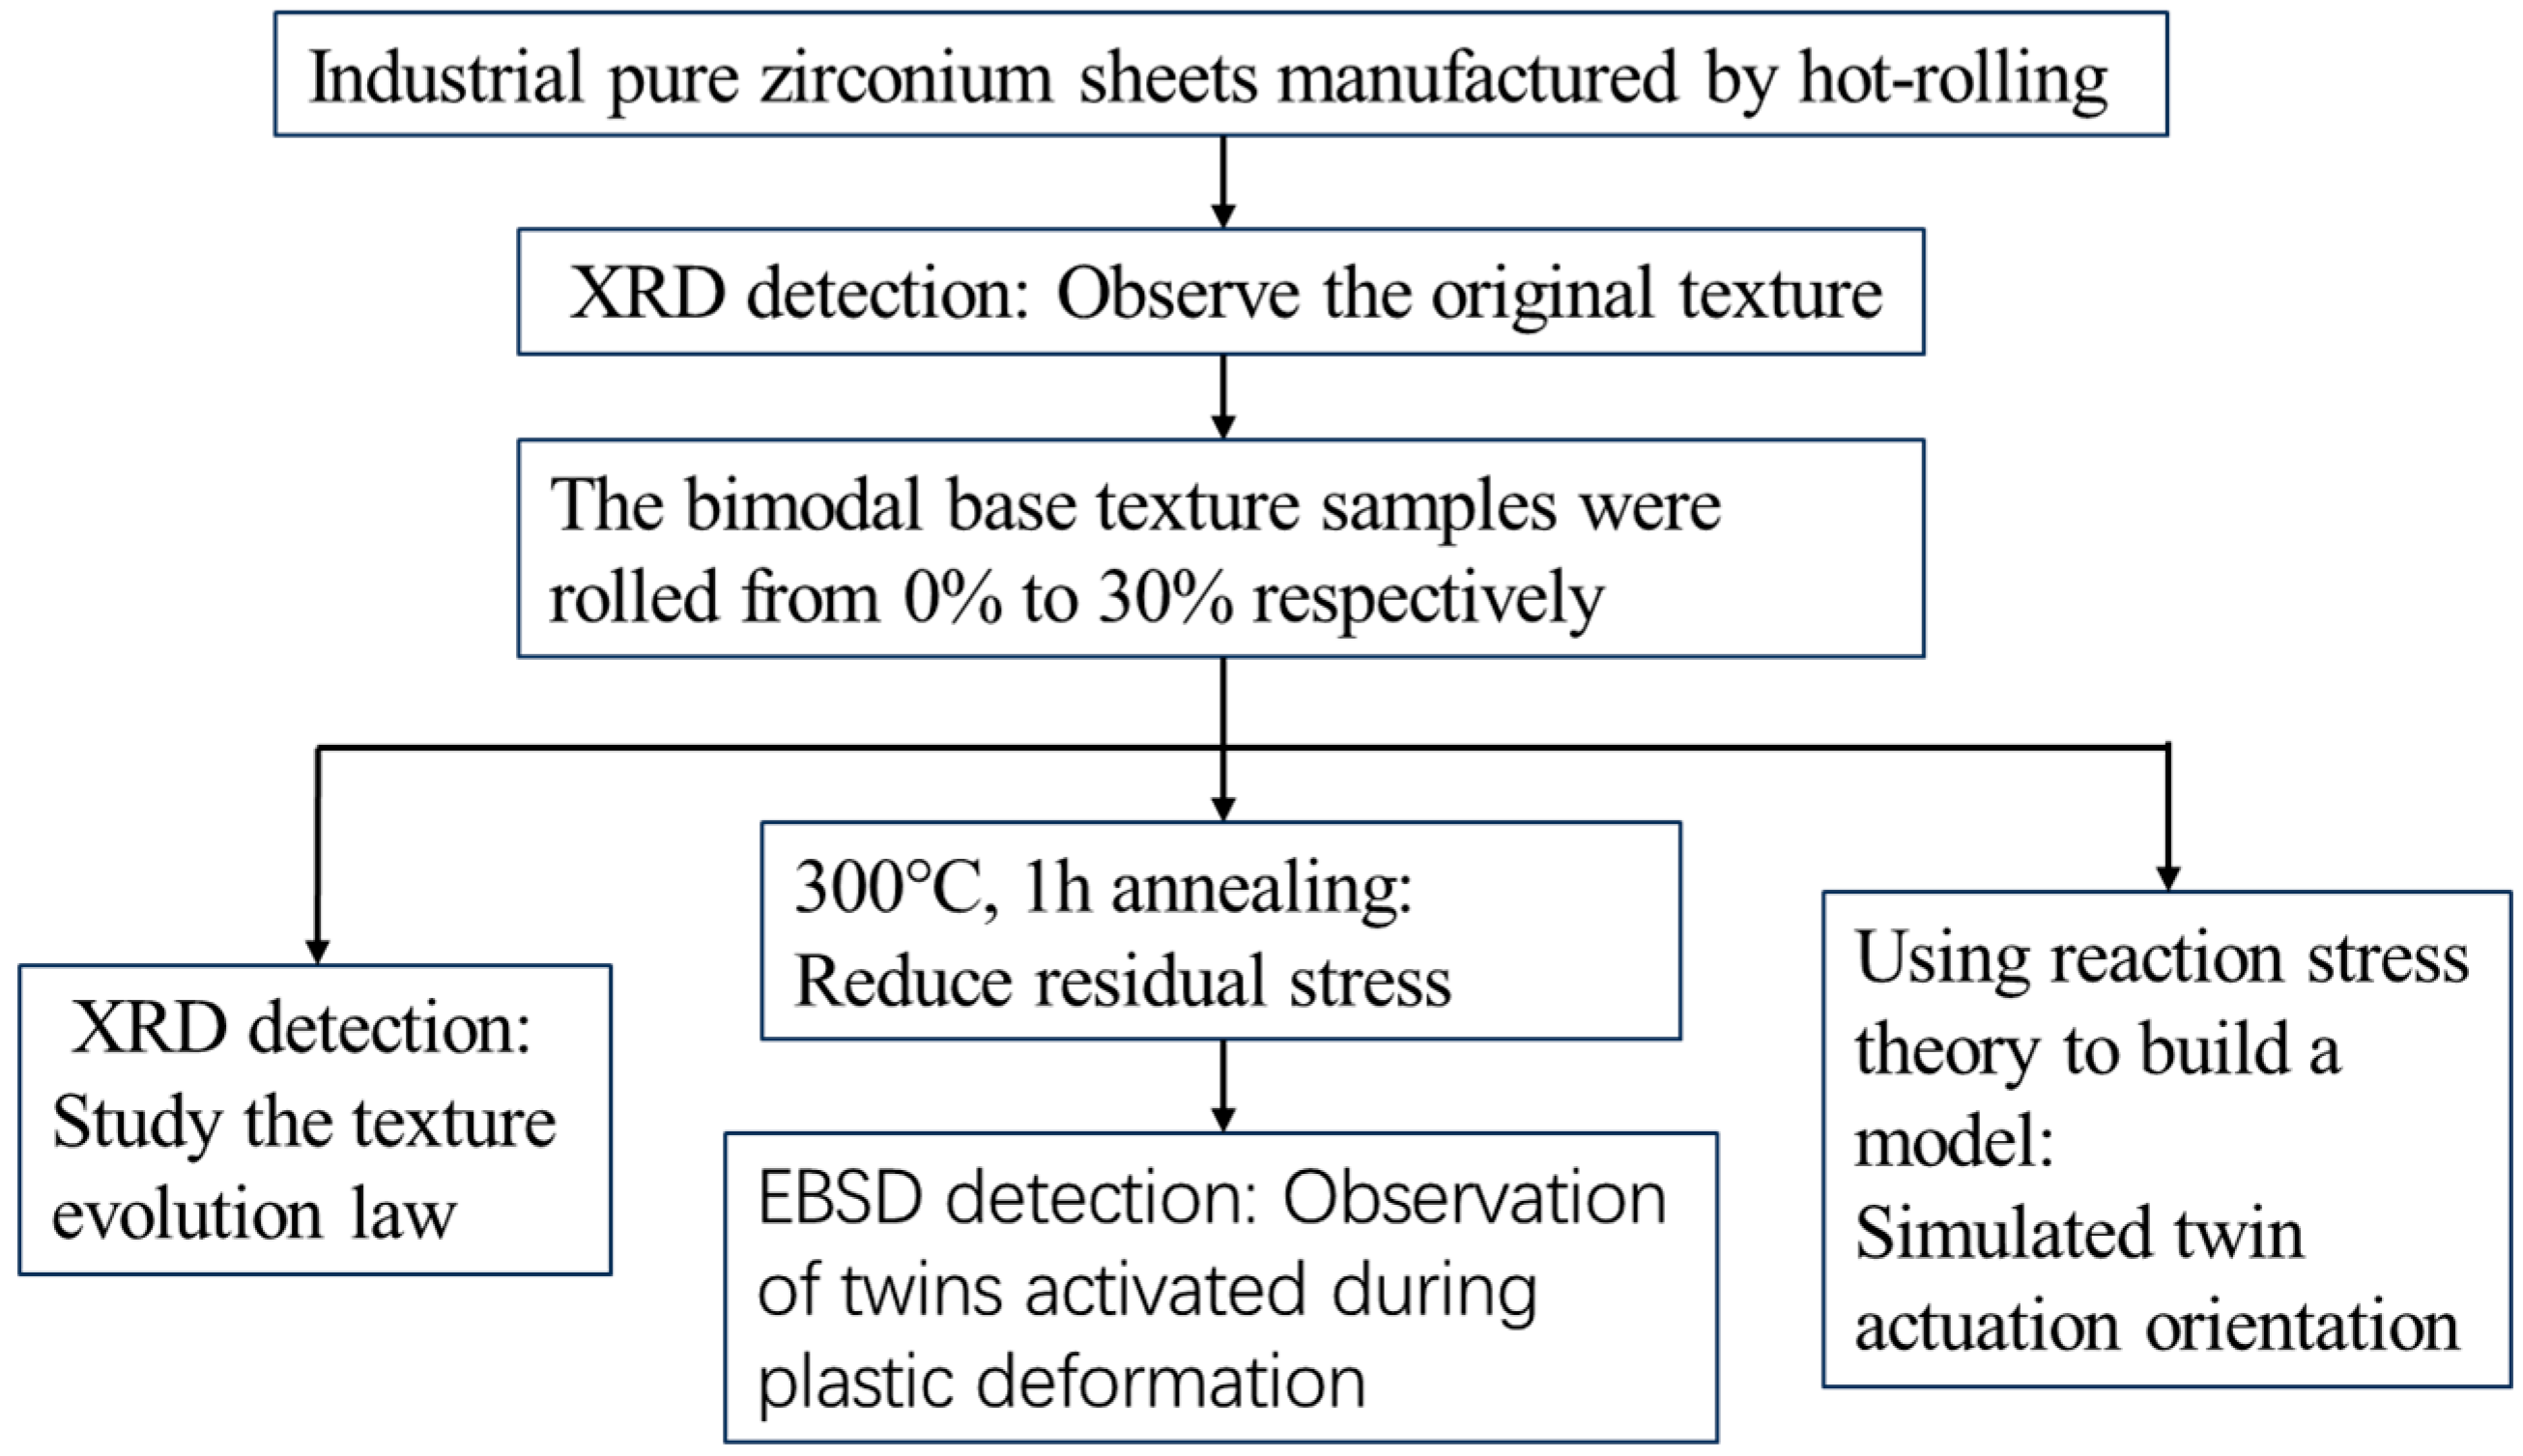
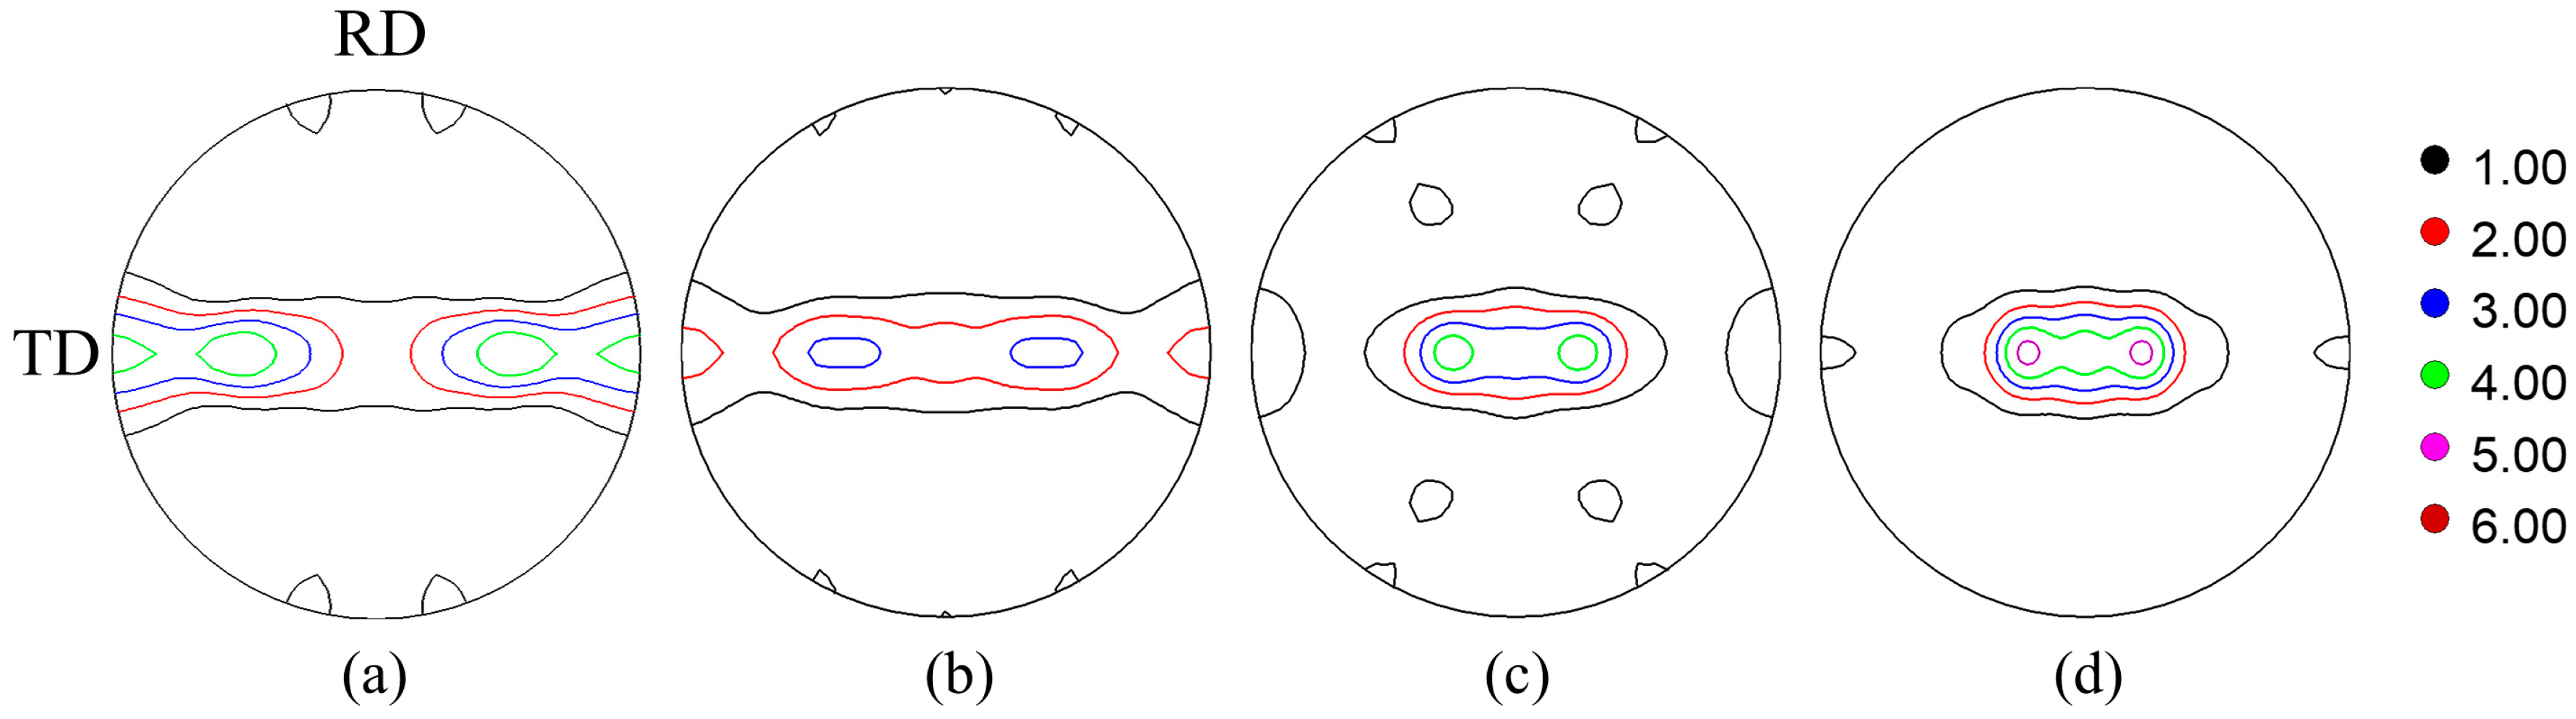
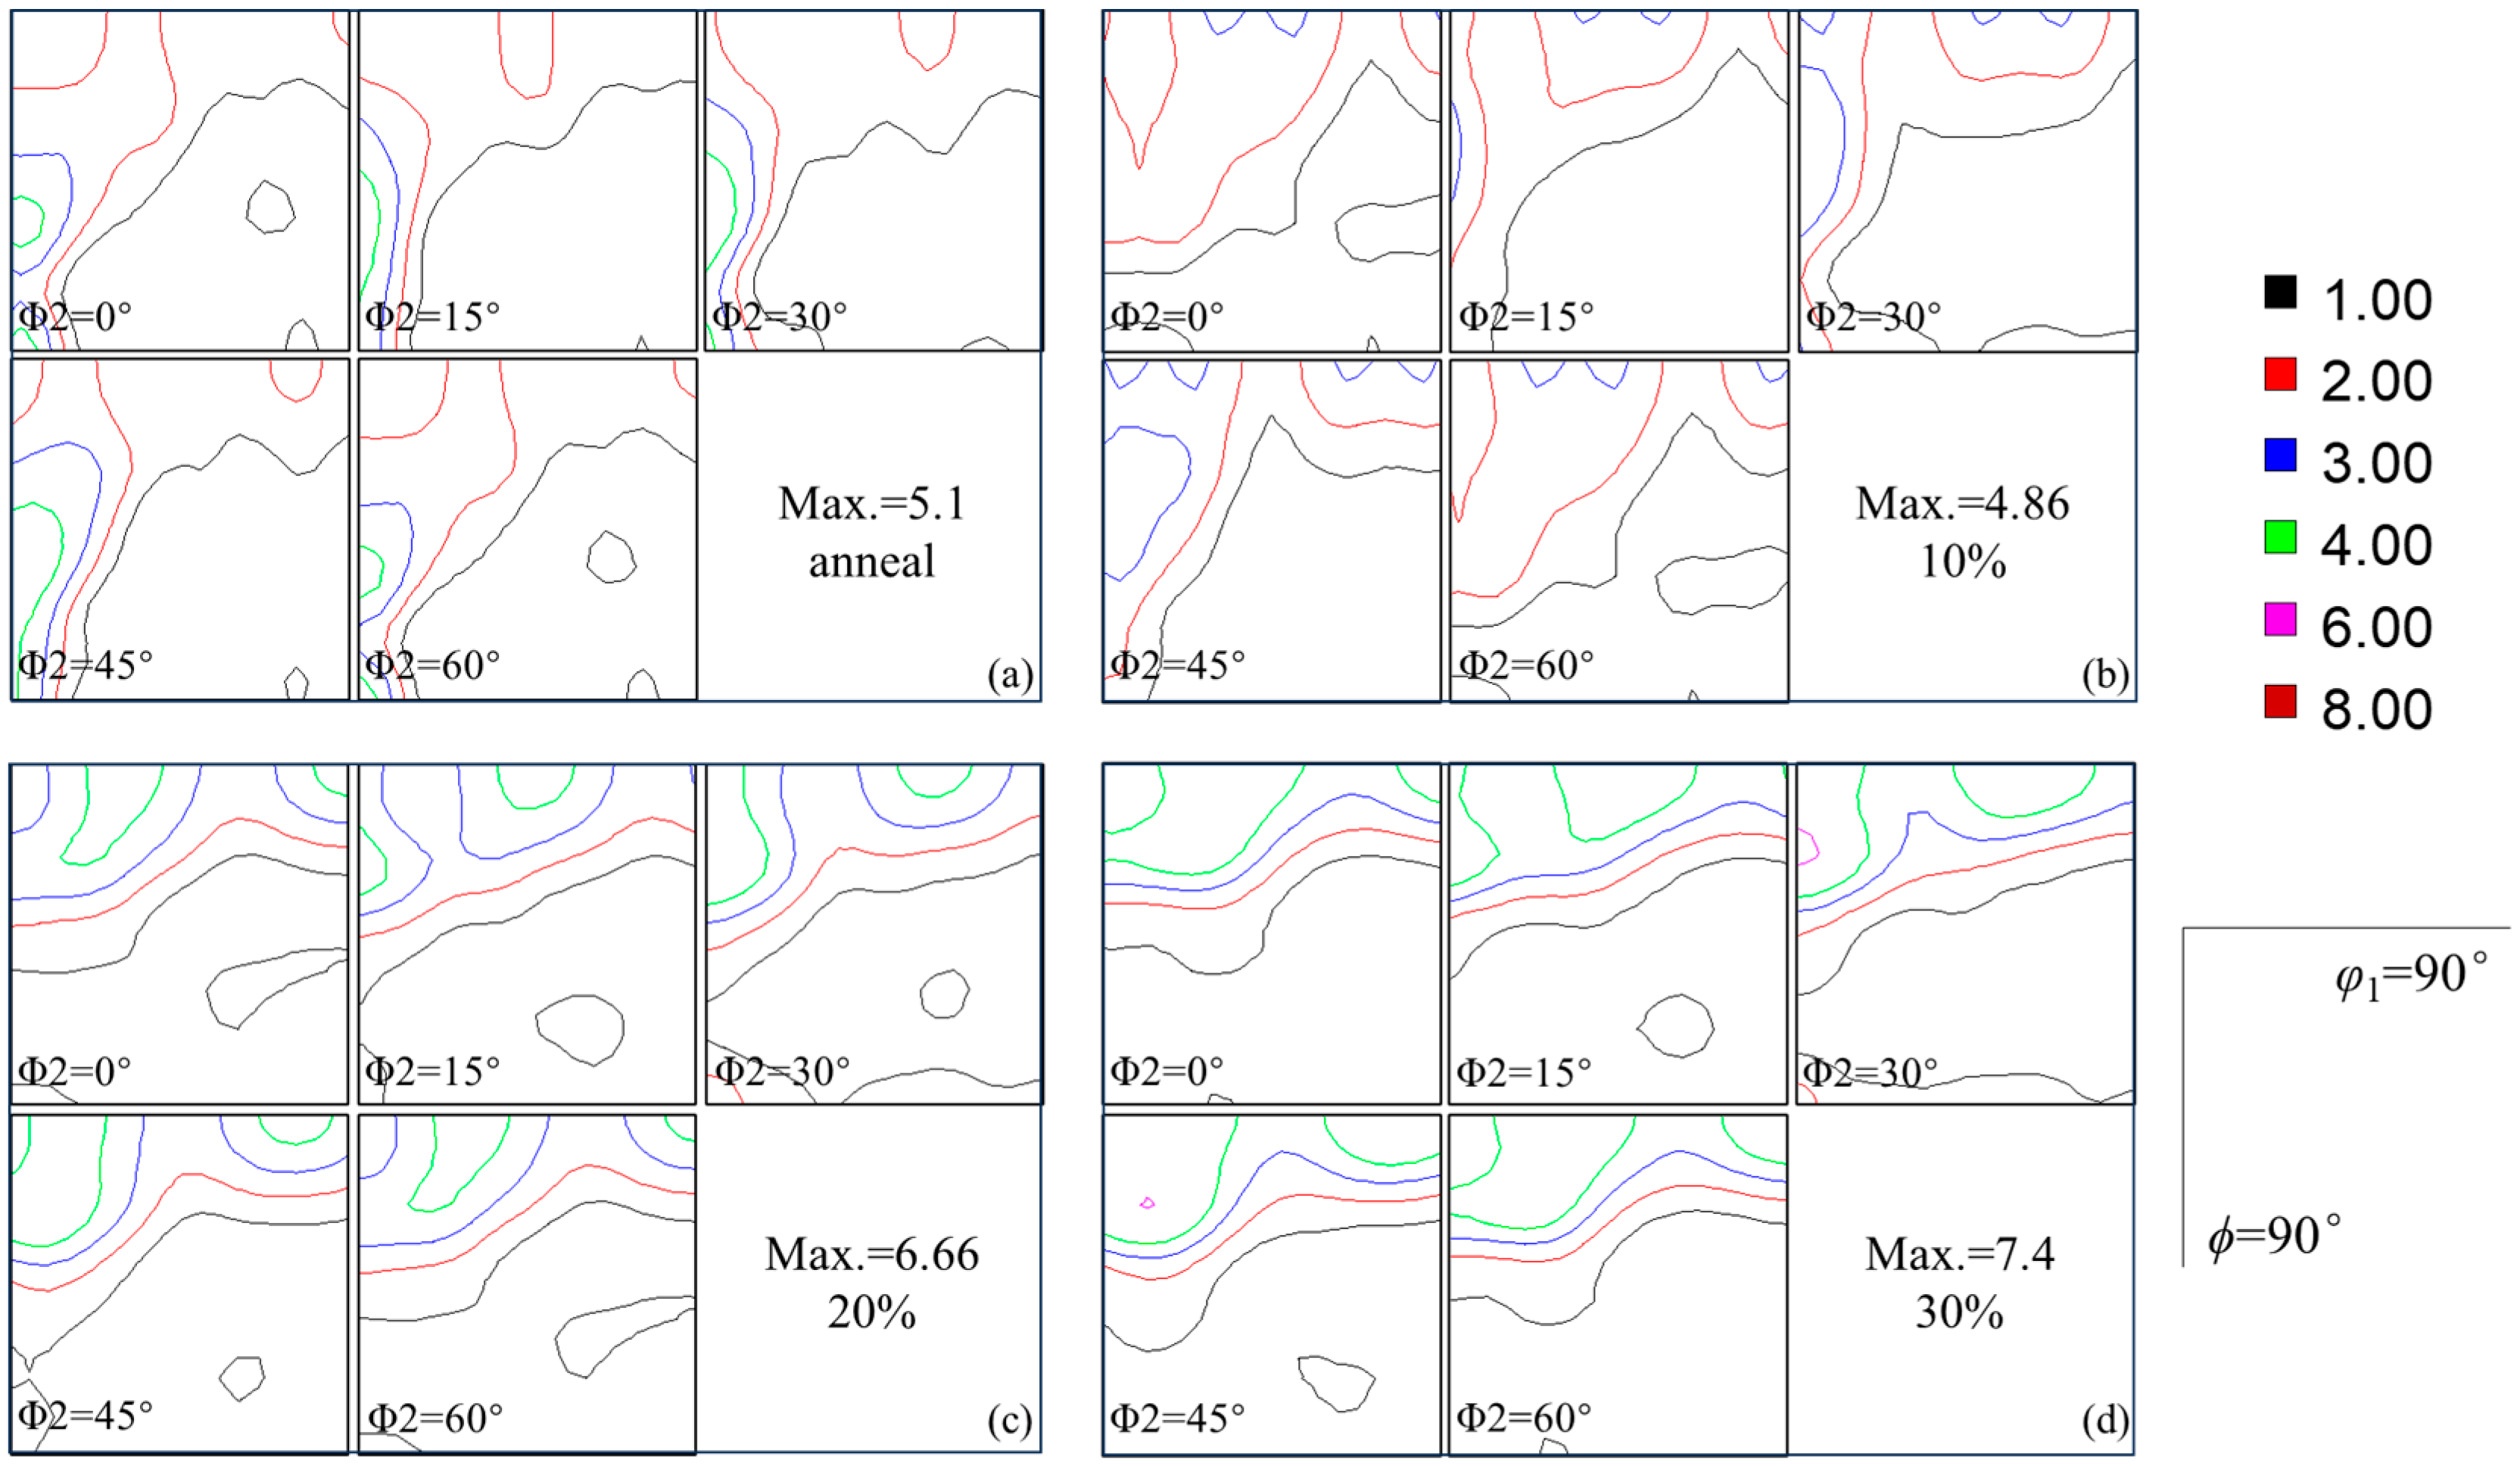
3.1. Texture Evolution during Cold Rolling

Figure 4 illustrates the pole figures of the samples after rolling reductions, specifically {0002}. The figure reveals that the initial sample exhibits a texture deviation from the basal plane texture by 20°–90° along the TD direction. The pronounced counter lines surrounding the TD suggest an orientation where the {0002} planes are perpendicular to the TD direction. With cold rolling at 10%, the density of poles, especially {0002} perpendicular to TD, is reduced by 10%. As the rolling reduction progressively intensifies, there is a noticeable shift towards a more concentrated texture on the basal plane, accompanied by an increase in density. Typically, a bimodal texture emerges, with a deviation of approximately 20° from the basal plane texture when subjected to cold rolling at 30%.
Figure 5 illustrates the Φ2 sections of ODF, revealing that the most pronounced orientation components of the initial sample are at (0°, 55°, 0°) and (0°, 90°, 0°). These correspond to { 02 2 - 3 } < 2 1 - 1 - 0 > and { 01 1 - 0 } < 2 1 - 1 - 0 > , as per Miller indices, respectively. This suggests a preferential direction for < 2 1 - 1 - 0 > //RD. As the cold rolling reduction intensified, the texture progressively transitioned to a basal plane texture with Φ = 0° in the Φ2 sections. No preferential directions were observed post-cold rolling. The highest density achieved by a 30% cold rolling of the sample was 7.4 at (0°, 20°, 30°).

3.2. Microstructure Characterization

The microstructure of the original sample was analyzed using EBSD, utilizing the calibration on the TD-RD plane, as depicted in Figure 6. Figure 6a displays the IPF (inverse pole figure) maps, which highlight equiaxed grains with an average grain size of 50 μm. The grains within the original plate exhibit a “clean” appearance, devoid of twins, and the grain size distribution is notably uniform. Furthermore, the pole figure of the original plate (in Figure 6b) reveals a characteristic bimodal texture oriented along the TD direction. The inverse pole figure (parallel to RD) of the grains marked in Figure 6c exhibits a < 11 2 - 0 > //RD orientation, which corresponds to the intense (0°, 55°, 0°) orientation in the Φ2 = 0° sections (Figure 6d). The results agree well with that of the characterization by XRD.
Figure 7 depicts the orientation maps of rolled zirconium grains, with reductions of 10%, 20%, and 30%, respectively. The coloration of the grains in these figures corresponds to that observed in the original orientation map of the industrial pure zirconium. Upon examining Figure 7a, it is evident that after a 10% reduction in rolling, some grains display inconsistent coloration, indicative of crystal slip deformation. Predominantly, the grains are red, while green and blue grains are sparse, implying that the deformed grains are oriented parallel or near the ND direction. Furthermore, under a 10% deformation, there is a significant increase in the number of twinning events within the grains.
At a deformation level of less than 20% deformation (Figure 7b), the grains exhibited elongation, yet no grain fragmentation was observed. The overall distribution of these grains closely resembles that of the original sample, preserving an approximately equiaxed shape. Furthermore, the color of the grains, corresponding to different orientations, approaches red, indicating a concentration of the texture towards < 0001 > .
Upon reaching a deformation of 30% (Figure 7c), the microstructure begins to show grain fragmentation, compared to the original sample. The deformed grains, which were significantly elongated, now exhibit more pronounced color variations and deformation bands. The rolling structure is notably irregular, with the original grain boundaries becoming nearly indistinguishable. Most grains are deformed and fractured, while some grains are elongated and crushed during rolling, with high local orientation gradients. Nevertheless, some grains remain unaltered, even at elevated deformation levels, suggesting an uneven nature of the deformed zirconium. Concurrently, the relatively uniform grain color suggests a further concentration of the deformation texture. In general, twinning structures can be observed across all deformation levels in grains.
To ensure the validity of the data, we employed EBSD to analyze different regions of the sample, and by integrating the results, we derived the subsequent data. Figure 8 illustrates the pole figures and inverse pole figures of industrial pure zirconium plates under three deformation levels: 10%, 20%, and 30%. Upon comparison with the original plate, there is no significant alteration in the bimodal texture as the rolling deformation increases. However, it is observable that the points of maximum pole density become more densely clustered, while the intensity of the basal bimodal texture distribution persistently escalates. The tendency of texture characterized by EBSD is similar to that characterized by XRD. By comparing the inverse pole figures in the figure, it can be observed that the initial < 11 2 - 0 > //RD texture is gradually replaced by the < 10 1 - 0 > //RD texture, which corresponds to the orientation (0°, 30°, 45°) from the ODF (Figure 8).

3.3. Twinning Characteristics during Cold Rolling

It is generally believed that the < 10 1 - 0 > //RD texture arises from the prismatic slip, whereas the bimodal basal texture exhibits greater complexity. Some researchers suggest that its origin lies in twinning. However, Tenckhoff [27] conducted an investigation into the texture evolution of zirconium alloys with large grain size and random textures during cold rolling. His findings revealed that the cone plane <c+a> slip primarily contributes to the formation of a stable bimodal basal texture. Ballinger [25] also posited that the combined effects of prismatic slip and cone plane <c+a> slip result in the final bimodal basal texture. In this experiment, the initial plate exhibited a bimodal basal texture. After the cold rolling process, the influence of slip did not alter the bimodal distribution of the basal texture; it merely transformed the < 11 2 - 0 > //RD texture into the < 10 1 - 0 > //RD texture. Zirconium alloy, with its a typical close-packed hexagonal structure and its texture after cold rolling deformation is not only affected by the availability of slip, but also by the twin deformation mechanism, which plays an important role [33].
To understand the twinning characteristics during cold rolling, the proportions of the four classic twinning types was analyzed using EBSD boundary distribution. As shown in Figure 9, tensile twins { 10 1 - 2 } < 10 1 - 1 - > are clearly evident in the sample cold rolled by 10% (denoted by the red line). This observation is further supported by the misorientation angle distribution, which shows a significantly high misorientation angle around 85° for the sample. Statistics reveal that C1 twinning ( { 11 2 - 2 } < 11 2 - 3 - > ) also exhibits a high prevalence, as illustrated in Figure 10. As the reduction in rolling increases, the presence of all twins decreases significantly, with only the C2 twin remaining under cold rolling by 30%. At a cold rolling temperature of 30%, a large number of low-angle boundaries can be observed, indicating that slip becomes the predominant mechanism. Twinning, on the other hand, plays a subsidiary role, mainly functioning to coordinate and accommodate the deformation.
The development of the C2 { 10 1 - 1 } < 10 1 - 2 - > extension twin can be elucidated through experimental characterization using TEM, as shown in Figure 11. A large number of fine twins can be observed distributed within the grains after cold rolling to 10%. As displayed in Figure 11a, the width of these twins measures only several nanometers. Electron diffraction revealed that both the matrix and the twin share the { 10 1 - 1 } planes corresponding to the C2 { 10 1 - 1 } < 10 1 - 2 - > extension twin. The result is further illustrated by the HRTEM image shown in Figure 10c.
Throughout the deformation process, a significant number of T1 twins were produced, along with a small quantity of C1 and T2 twins. However, as the rolling reduction escalated, there was a marked decrease in the number of T1 and C1 twins. Finally, within the heterogeneously deformed grains, C2 twins were generated to preserve the excellent ductility of zirconium during the macroscopic uniform deformation at low temperatures. This aligns well with the findings of Kaschner [34], who reported that, through ODF quantitative analysis, the number of twins increases significantly, with minor deformations only when the sample is compressed along the c-axis, reaching saturation at a 20% reduction. The distribution of low-angle grain boundaries depicted in Figure 8 also suggests that during the room-temperature rolling process, the deformed grains follow a sequence of deformation mechanisms: slip, twinning, and then maintenance of a low-angle grain boundary distribution, which increases progressively from 10% to 30%. Due to this complex deformation mechanism, multiple slip systems appear under large strains, allowing zirconium to exhibit good ductility, even under large deformations, without fracturing.
To elucidate the impact of different twinning mechanisms on the texture evolution, a reactive stress model was employed in this study to simulate the effect of 30% deformation on textures due to individual T1, T2, C1, and C2 twinning systems, as depicted in Figure 12. Figure 12a illustrates the initial texture, comprising 1716 random orientations used for the simulation. Figure 12b delineates the influence of each twinning mechanism on texture evolution. It can be observed that the T1 twinning leads to a concentration of texture at the orientation (0°, 15°, 0°). The T2 twin results in orientation concentration at (20°, 10°, 0°), as well as along Φ = 90°. The C1 twinning exerts a similar effect on texture to that of T2, while the C2 twinning induces orientation concentration at (80°, 30°, 0°). In conjunction with the experimental results, it can be observed that as the deformation reduction increases, T1 twins constitute the majority. This suggests that under conditions of low strain deformation, minimal slippage occurs, and the deformation is predominantly accommodated by T1 twins. C1 twins can be illustrated by EBSD characterization (the corresponding boundaries are marked with blue color) of the sample, cold rolled by 10%. With an increase in deformation reduction, C1 twins rapidly decrease. T2 twins can also be identified through the misorientation distribution in Figure 10. However, it decreased dramatically with increasing deformation reduction. It is noteworthy that while some literature reports suggest that C2 twins are predominantly found in regions of high temperature deformation or high stress concentration [28], they have been overlooked due to their minor presence in twin boundary statistics. However, the combination of simulation and experimental results reveals that the cold-rolling texture progressively shifts to the right with increasing deformation up to 30%. This shift indicates that C2 twins are also activated under low deformation conditions, which is consistent with the results observed in TEM. Therefore, the contribution of C2 twins at low deformation should not be overlooked. In general, T1 twins dominate in the early stage, while C2 twins develop at the later stage of the cold-rolling process.

4. Conclusions

  • The initial hot-rolled zirconium plates had a diffuse texture deviating from the basal plane texture by 20°–90° along TD direction. Cold rolling develops a typical bimodal texture with a deviation of approximately 20° from the basal plane texture. This process facilitates a transformation in the preferred crystallographic orientations, shifting from the < 2 1 - 1 - 0 > //RD to the < 10 1 - 0 > //RD preferred orientations.
  • Experimental characterization and simulation of the reaction stress model illustrate that T1 twins dominate in the early stage, contributing to the development of the {0001} < 10 1 - 0 > orientation. Fine C2 { 10 1 - 1 } < 10 1 - 2 - > extension twins can be observed evolving at the later stage of the cold-rolling process. Under severe deformation, low-angle grain boundaries propagate extensively, indicating that slip has become the predominant mechanism. The mechanism of the deformation of zirconium follows the trend of slip, twinning, local slip.

Author Contributions

Y.L. (Yuan Liu): formal analysis, investigation, data curation, writing—original draft, writing—review and editing. Y.L. (Yiming Li): conceptualization, formal analysis, investigation, methodology, supervision, writing—original draft, writing—review and editing, funding acquisition. W.M.: conceptualization, formal analysis, resources, methodology, supervision. H.B.: data curation, investigation, methodology, writing—review and editing. Q.F.: conceptualization, methodology. Y.J.: conceptualization, formal analysis, funding acquisition. H.R.: conceptualization, formal analysis, resources, supervision. All authors have read and agreed to the published version of the manuscript.

Funding

This work is supported by the Program for Innovative Research Team in Universities of Inner Mongolia Autonomous Region (NMGIRT2401).

Data Availability Statement

Data will be made available on request.

Conflicts of Interest

The authors declare no conflict of interest.

References

  1. Long, J.; Zhang, L.J.; Ning, J.; Na, S.J. Instantaneous phenomena during the pulsed fiber laser welding of pure zirconium in a hyperbaric environment. Opt. Commun. 2021, 490, 126868. [Google Scholar] [CrossRef]
  2. Chen, X.; He, W.; Chen, W.; Liu, Q. Microstructures and mechanical properties of a commercial pure zirconium during rolling and annealing at different temperatures. Adv. Eng. Mater. 2021, 23, 2001039. [Google Scholar] [CrossRef]
  3. Yuan, F.; Zhang, Y.; Han, F.; Muhammad, A.; Guo, W.; Ren, J.; Liu, C.; Li, G. Incommensurate modulated structure in zirconium under three-point bending deformation. Mater. Lett. 2021, 295, 129830. [Google Scholar] [CrossRef]
  4. Zinkle, S.J.; Was, G.S. Materials challenges in nuclear energy. Acta Mater. 2013, 61, 735–758. [Google Scholar] [CrossRef]
  5. Bhattacharyya, D.; Cerreta, E.K.; McCabe, R.; Niewczas, M.; Gray, G.T., III; Misra, A.; Tome, C.N. Origin of dislocations within tensile and compressive twins in pure textured Zr. Acta Mater. 2009, 57, 305–315. [Google Scholar] [CrossRef]
  6. Tang, L.; Ding, S.; Qian, H.; Xie, Y.; Huo, Y. Fretting fatigue tests and crack initiation analysis on zircaloy tube specimens. Int. J. Fatigue 2014, 63, 154–161. [Google Scholar] [CrossRef]
  7. Guo, X.; Lu, J.; Lai, P.; Shen, Z.; Zhuang, W.; Han, Z.; Zhang, L.; Lozano-Perez, S. Understanding the fretting corrosion mechanism of zirconium alloy exposed to high temperature high pressure water. Corros. Sci. 2022, 202, 110300. [Google Scholar] [CrossRef]
  8. Yu, W.; Xiunan, Y.; Feng, T. Effect of Rolling Technology on Texture Orientation and Corrosion Performance of Zr-4 Zirconium Alloy Strips. Rare Met. Mater. Eng. 2012, 41, 2238–2242. [Google Scholar]
  9. Reddy, G.B.; Kapoor, R.; Sarkar, A. Dynamic phase transformation driven microstructure and texture development during deformation of Zr-2.5 wt.% Nb in α+ β phase field. Acta Mater. Lia 2023, 261, 119354. [Google Scholar] [CrossRef]
  10. Alvarez, M.V.; Buioli, C.; Santisteban, J.; Vizcaino, P. Evolution of texture and intergranular stresses of αZr and minority phases in Zr-2.5 Nb pressure tube through synchrotron X-ray diffraction. Acta Materia Lia 2024, 271, 119802. [Google Scholar] [CrossRef]
  11. Liu, Y.; Hyun-Gil, K.; Jeong-Yong, P.; Yong-Hwan, J. Evaluation of Microstructure and Texture Development in Zr-1.0Nb Sheet during Cold-Rolling. Rare Met. Mater. Eng. 2013, 42, 667–672. [Google Scholar] [CrossRef]
  12. Cui, C.; Li, Y.; Wang, F.; Jiao, B.; Huang, L.; Zhang, W.; Zhou, L. Texture evolution and mechanical anisotropy of cold-rolled Zr-4 alloy tube after recrystallization annealing. Int. J. Refract. Met. Hard Mater. 2023, 110, 106048. [Google Scholar] [CrossRef]
  13. Liu, H.; Deng, S.; Chen, S.; Song, H.; Zhang, S.; Wang, B. Correlation of the anisotropic hardening behavior and texture features of cold rolled Zr-4 sheet under uniaxial tension. J. Mater. Sci. Technol. 2022, 119, 111–122. [Google Scholar] [CrossRef]
  14. Capolungo, L.; Beyerlein, I.J.; Kaschner, G.C.; Tomé, C.N. On the interaction between slip dislocations and twins in HCP Zr. Mater. Sci. Eng. A 2009, 513, 42–51. [Google Scholar] [CrossRef]
  15. Kaschner, G.C.; Tomé, C.N.; Beyerlein, I.J.; Vogel, S.C.; Brown, D.W.; McCabe, R.J. Role of twinning in the hardening response of zirconium during temperature reloads. Acta Mater. 2006, 54, 2887–2896. [Google Scholar] [CrossRef]
  16. Bibhanshu, N.; Massey, C.P.; Harp, J.; Nelson, A.T. Analysis of orientation-dependent deformation mechanisms in additively manufactured Zr using in-situ micromechanical testing: Twinning and orientation gradient. Mater. Sci. Eng. A 2023, 882, 145353. [Google Scholar] [CrossRef]
  17. Chapuis, A.; Liu, Q. Simulations of texture evolution for HCP metals: Influence of the main slip systems. Comput. Mater. Sci. 2015, 97, 121–126. [Google Scholar] [CrossRef]
  18. Tome, C.N.; Levenson, R.A.; Kocks, U.F. A model for texture development dominated by deformation twinning: Application to zirconium alloys. Acta Met. Mater. 1991, 39, 2667–2680. [Google Scholar] [CrossRef]
  19. Linga, M.K.; Sheikh, M.T. Deformation and recrystallization texture and anisotropic plastic properties of zircaloy sheet. In Proceedings of the 11th International Conference on Structural Mechanics in Reactor Technology (SMIRT-11), Tokyo, Japan, 18–23 August 1991; North Carolina State University Raleigh: Raleigh, NC, USA, 1991; pp. 172–175. [Google Scholar]
  20. Qian, P.; Wenjin, Z.; Yanzhang, L.; Changlong, S. Texture Evolution of Zircaloy-4 Plate Rolled at High a Temperature. Nucl. Power Eng. 2003, 24, 133–136. [Google Scholar]
  21. Qian, P.; Yanzhang, L.; Wenjin, Z.; Changlong, S. Effect of Hot-Rolling Temperature on the Texture of N18 Zirconium Alloy Plate. Nucl. Power Eng. 2005, 26, 65–68. [Google Scholar]
  22. Zeng, Q.; Luan, B.; Chapuis, A.; Liu, Q. Evolution of Crystallographic Texture of Zirconium Alloy During Hot Deformation. Rare Met. Mater. Eng. 2019, 48, 2393–2399. [Google Scholar]
  23. Chen, J.; Luan, B.; Chai, L.; Yu, H.; Liu, Q.; Zhou, J.; Li, Z. Heterogeneous Microstructure and Texture Revolution During Fabrication of Zr-Sn-Nb Zirconium Alloy Sheets. Acta Metall. Sin. 2012, 48, 393–400. [Google Scholar] [CrossRef]
  24. Luan, B.-F.; Xiao, D.-P.; He, F.-F. Evolution of microstructure and texture of pure zirconium during rolling process. J. Chin. Electron Microsc. Soc. 2012, 31, 476–480. [Google Scholar]
  25. Ballinger, R.G.; Lucas, G.E.; Pelloux, R.M. The effect of plastic strain on the evolution of crystallographic texture in Zircaloy—2. J. Nucl. Mater. 1984, 126, 53–69. [Google Scholar] [CrossRef]
  26. McCabe, R.J.; Cerreta, E.K.; Misra, A.; Kaschner, G.C.; Tomé, C.N. Effects of texture, temperature and strain on the deformation modes of zirconium. Philos. Mag. 2006, 86, 3595–3611. [Google Scholar] [CrossRef]
  27. ASTM-STP 966; Deformation Mechanisms, Texture, and Anisotropy in Zirconium and Zircaloy. ASTM International: Philadelphia, PA, USA, 1988.
  28. Zhang, X.; Wang, Q.; Zhang, N.; Mao, W.; Yang, P. Effect of Intergranular Reaction Stress on Orientation Evolution of Pure Titanium Grains after Low Rolling Deformation. Rare Met. Mater. Eng. 2019, 48, 3895. (In Chinese) [Google Scholar]
  29. Mao, W. The currently predominant Taylor principles should be disregarded in the study of plastic deformation of metals. Front. Mater. Sci. 2018, 12, 322–326. [Google Scholar] [CrossRef]
  30. Mao, W. Intergranular mechanical equilibrium during the rolling deformation of polycrystalline metals based on Taylor principles. Mater. Sci. Eng. A 2016, 672, 129–134. [Google Scholar] [CrossRef]
  31. Zhang, N.; Mao, W. Study on the cold rolling deformation behavior of polycrystalline tungsten. Int. J. Refract. Met. Hard Mater. 2019, 80, 210–215. [Google Scholar] [CrossRef]
  32. Mainprice, D.; Bachmann, F.; Hielscher, R.; Schaeben, H. Descriptive tools for the analysis of texture projects with large datasets using MTEX: Strength, symmetry and components. Geol. Soc. Lond. Spec. Publ. 2015, 409, 251–271. [Google Scholar] [CrossRef]
  33. Yu, S.H.; Chun, Y.B.; Cao, W.Q.; Kim, M.H.; Chae, S.W.; Kwun, S.I.; Shin, D.H.; Hwang, S.K. Comparison of equal channel angular pressing and cold rolling in the evolution of microstructure and texture in zirconium. Met. Mater. Int. 2005, 11, 101–111. [Google Scholar] [CrossRef]
  34. Kaschner, G.C.; Tome, C.N.; Mccabe, R.J.; Misra, A.; Vogel, S.C.; Brown, D.W. Exploring the dislocation/twinning interactions in zirconium. MaterSciEngA 2007, 463, 122–127. [Google Scholar]
Figure 1. Schematic diagram of slip systems in zirconium alloys: (a) columnar <a> slip, (b) basal slip and { 10 1 - 0 } pyramidal <a> slip, (c) { 10 1 - 1 } and { 11 2 - 1 } pyramidal <c+a> slip.
Processes 12 00948 g001
Figure 2. Schematic diagram of the twin systems in zirconium alloys: (a) { 10 1 - 2 } tensile twinning, (b) { 11 2 - 1 }   tensile twinning, (c) { 11 2 - 2 } compressive twinning, (d) { 10 1 - 1 } compressive twinning.
Processes 12 00948 g002
Figure 3. Experimental flow chart.
Processes 12 00948 g003
Figure 4. XRD {0002} pole figures of industrial pure zirconium sheets under different deformation reductions: (a) hot-rolled initial sample, (b) 10%, (c) 20%, (d) 30%.
Processes 12 00948 g004
Figure 5. ODF diagrams of industrial pure zirconium sheets under different deformation, as detected by XRD, with Φ2 = 0°,15°,30°,45°,60°. (a) Hot-rolled initial sample, (b) 10%, (c) 20%, (d) 30%.
Processes 12 00948 g005
Figure 6. EBSD characterization of the original microstructure of industrial pure zirconium plate: (a) grain orientation map, (b) pole figure, (c) inverse pole figure, (d) orientation distribution function map.
Processes 12 00948 g006
Figure 7. Grain orientation maps of industrial pure zirconium sheets at different deformation levels: (a) 10%, (b) 20%, (c) 30%.
Processes 12 00948 g007
Figure 8. Pole figures, inverse pole figures, and ODF diagrams of pure zirconium under different deformation levels: (a) 10%; (b) 20%; (c) 30%.
Processes 12 00948 g008
Figure 9. Twin boundaries in industrial pure zirconium sheet materials at different deformation levels: (a) 10%, (b) 20%, (c) 30%.
Processes 12 00948 g009
Figure 10. Grain boundary angles distribution of the cold-rolled industrial pure zirconium sheet: (a) 0%; (b) 10%; (c) 20%; (d) 30%.
Processes 12 00948 g010
Figure 11. TEM images of { 10 1 - 1 } compression tensile twins: (a) deformation-twin morphology, (b) selected area electron diffraction, (c) HRTEM at twin boundary.
Processes 12 00948 g011
Figure 12. ODF of Φ2 = 0° sections simulated by the reaction stress method: (a) initial data and (b) the concentration orientation diagrams of T1, T2, C1, and C2 twins under a 30% deformation condition.
Processes 12 00948 g012
Table 1. Opening conditions of various deformation systems for zirconium under different deformation conditions.
TypeDeformation PlaneDeformation DirectionCrystallographic DirectionTemperature and Stress Range
SlipPrismatica{10 1 - 0}<1 2 - 10>All temperatures and low stress
SlipBasala{0002}<1 2 - 10>High temperature; high stress
SlipPyramidala{10 1 - 1}<1 2 - 10>Moderate to high temperature; high stress
SlipPyramidalc + a{ 1 - 011}<11 2 - 3>Moderate to high temperature; high stress
SlipPyramidalc + a{11 2 - 1}< 2 - 113>High temperature; high stress
TwinningPyramidalc + a{10 1 - 2}< 1 - 011>Moderate temperature; tensile along the c-axis
TwinningPyramidalc + a{11 2 - 1}< 1 - 1 - 26>Any temperature; tensile along the c-axis
TwinningPyramidalc + a{11 2 - 2}< 1 - 1 - 23>Moderate to low temperatures; compressive along the c-axis
TwinningPyramidalc + a{10 1 - 1}< 1 - 012>Moderate to high temperatures; compressive along the c-axis
Disclaimer/Publisher’s Note: The statements, opinions and data contained in all publications are solely those of the individual author(s) and contributor(s) and not of MDPI and/or the editor(s). MDPI and/or the editor(s) disclaim responsibility for any injury to people or property resulting from any ideas, methods, instructions or products referred to in the content.

