
A Study on the Mechanism of Fracture Initiation and Propagation under Multi-Perforation Conditions in Hydraulic Fracturing

1
College of Engineering Sciences, University of Chinese Academy of Sciences, Beijing 100083, China
2
Research Institute of Seepage Fluid Mechanics, Chinese Academy of Sciences, Langfang 065007, China
3
Research Institute of Petroleum Exploration and Development, Beijing 100083, China
4
China Petroleum Technology Development Corporation, Beijing 100083, China
*
Author to whom correspondence should be addressed.
Processes 2024, 12(5), 1002; https://doi.org/10.3390/pr12051002
Submission received: 23 April 2024
/
Revised: 13 May 2024
/
Accepted: 13 May 2024
/
Published: 15 May 2024
(This article belongs to the Special Issue Advances in Gas Adsorption and Porosity for Enhanced Recovery of Shale Gas)
Abstract
:To reveal the mechanism of hydraulic fracture initiation and propagation under the conditions of multiple perforations during horizontal well fracturing, we creatively conducted dual-hole fracturing experiments on small rock samples and established a two-dimensional model of a single cluster with multiple perforations in a horizontal well based on the extended finite element method using the fluid–solid coupling equation, which was combined with the basic theory of damage mechanics. The biggest difference from previous research is that this model does not consider the hypothesis of stress shadows and only focuses on studying the initiation and propagation of multiple perforations in one cluster. We studied the effects of perforation parameters, stress state, and injection flow rate on the initiation and propagation of hydraulic fractures using this model. The experimental and simulation results indicate that under multi-perforation conditions, the number of fractures depends on the number of perforations. The simulation results show that when the spacing between perforations increases or the number of perforations reduces, the initiation time of perforation is advanced and the interference between fractures weakens, which is conducive to the initiation and propagation of hydraulic fractures. As the stress difference increases, the initiation time of perforation becomes earlier and the deflection angle of the outermost fractures becomes smaller, which is conducive to the parallel expansion of the fractures. Moreover, although this has little impact on the morphology of fractures with the rise in flow rate in simulation, it is beneficial for improving the initiation and propagation speed of fractures. The length of fractures also increases significantly at the same time point. In addition, both the experiments and simulations revealed that an increase in the flow rate could accelerate the initiation time of fractures. The proposed model can guide fracturing construction to optimize the design of perforation spacing during horizontal well fracturing, which can contribute to reducing development costs and improving the final production.
1. Introduction
With the increasing demand for energy in economic development, the development of unconventional energy, such as shale oil and gas, has attracted extensive attention [1,2,3]. Hydraulic fracturing is a powerful technology that can support the efficient development of unconventional resources, such as shale gas. The research and application of hydraulic fracturing technology has also received increasing attention [4,5,6]. For efficient exploitation of shale gas, it is necessary to increase the stimulated reservoir volume as much as possible. However, the research by Span et al. [7] showed that the fracturing efficiency of unconventional oil and gas reservoirs is still at a low level, with 40–60% of fracturing fractures contributing little to no oil and gas production. Similarly, Li Yang et al. [8] found that a small number of fractures contributed to most of the oil and gas production in segmented multi-cluster hydraulic fracturing. In contrast, many fractures did not contribute to production at all. Therefore, it is necessary to study the initiation and propagation mechanism of multi-perforation fractures.
In recent years, scholars have conducted extensive research on hydraulic fracture propagation. Although it is generally believed that, due to the existence of stress shadow, only a few fractures or even only one fracture can develop to the far end in one cluster of perforations, researchers who conducted studies at the Hydraulic Fracturing Test Site (HFTS) found that multiple fractures can be formed in one cluster zone. Thus, they proposed the concept of fracture swarms [9,10,11]. Ciezobka, Reeves, et al. [12] conducted hydraulic fracturing research experiments at the Midland Basin in West Texas and found that up to 6–8 hydraulic fractures exist in a 1–2 foot fracturing area. This is contradictory to the general understanding of underground hydraulic fracturing, but there is no existing theory to explain this phenomenon. Meng Cao et al. [13] applied a new type of three-dimensional fracturing reservoir simulator to analyze the data obtained from a hydraulic fracturing test site. They proposed a method to represent the complex fracture network generated by hydraulic fracturing effectively. Li Chuanliang et al. [14] studied the geological and construction conditions for producing segmented single-fracture and volume fracture networks. Their analysis showed that fracture network fracturing can only be attained under specific geological conditions, such as a heterogeneous formation with extremely poor physical properties. Generally, only a single straight fracture is generated in a homogeneous formation or a macro-heterogeneous formation. Raterman et al. [15] conducted a numerical simulation based on core inversion data, which showed that hydraulic fractures can expand in nearly parallel two-stage or three-stage fracturing, with spacing ranging from a few centimeters to tens of centimeters. Sesetti et al. [16] developed a numerical model based on the displacement discontinuity method to simulate the propagation of non-planar hydraulic fractures. The results showed that under certain conditions and operating parameters, fracture clusters may be closely distributed. Fractures near a wellbore can extend to more than tens of feet, and closely spaced fractures may terminate or merge early. Weijermars, R. et al. [17] applied a new fracture propagation simulation method based on a time-stepped expansion of the two-dimensional linear superposition method, and they used the well spacing and perforation spacing in the fracturing process. The simulation showed that multiple competitive hydraulic fractures did not remain planar and transverse. In contrast, they shifted due to local stress interference. Many hydraulic fracturing experiments have been conducted to study the impact of various parameters on the fracturing process [18,19,20,21]. According to a significant body of research, factors such as perforation spacing and geo-stress are important factors that affect the result of hydraulic fracturing. Zhang Chi et al. [22] optimized the cluster spacing, cluster number, and other related parameters in their numerical simulation of the Fuling shale gas field, and the final production increased significantly. Researchers have also conducted extensive research on hydraulic fracturing using various methods in numerical simulation [23,24,25,26]. Due to its convenient coupling calculations and fast computational speed, the extended finite element method is considered effective for simulating hydraulic fracturing. However, most existing studies have focused on large-scale multi-cluster hydraulic fracturing, while research on the initiation and propagation of single clusters with multiple perforations is scarce. At present, there is no clear theory to explain the initiation and propagation mechanism of fracture swarms in hydraulic fracturing. Further research is needed to determine the conditions under which a single fracture propagates or forms fracture swarms.
To elucidate the mechanism underlying the initiation and propagation of multiple fractures from a single cluster with multiple perforations, this study established an extended finite element calculation model to study the initiation and propagation laws of multiple fractures in homogeneous shale under the conditions of different perforation numbers, spacing, reservoir stress, and injection flow rate while considering the effects of reservoir rock seepage, fracture surface filtration, and stress interference. The research results can contribute to the hydraulic fracturing design of horizontal shale gas wells.
2. Mathematical Model and Experiment
2.1. Mathematical Model for Fracture Initiation and Propagation
Research on the mechanism of hydraulic fracture initiation and propagation is mostly based on the fracture mechanics theory. Crustal stress is a crucial parameter in hydraulic fracturing. Under the original geological conditions, the reservoir is mainly affected by the combined effect of the horizontal stress and the weight of the covering rock stratum. Simplifying shale reservoirs as isotropic linear elastomers for research, based on the elastic mechanics theory and previous stress derivation combined with specific assumptions and boundary conditions, the crustal stress can be obtained using Hooke’s law:
where E is the elastic modulus of the rock, is Poisson’s ratio, and G is the shear modulus. The rock stress balance equation can be obtained from the virtual work principle as follows [27]:
where Ω is the integral body, S is the surface of the integrating body, is the effective stress of the rock, is the osmotic pressure, is the unit vector matrix, is the virtual strain field, is the virtual velocity field, T is the external surface force within the unit integral region, f is the unit volume force without fluid gravity, is the porosity of the rock, and is the density of the pore fluid.
According to fracture mechanics theory, a rock can be considered an open fracture. Considering that the initiation of fractures is a relatively small deformation compared to a reservoir, the propagation of fractures follows the criterion of linear elastic fracture mechanics. Assuming that the flow of the fracturing fluid in the fracture is a Newtonian fluid, the flow in the fracture can be divided into a tangential flow and a normal flow. The tangential flow equation is as follows [28]:
where is the tangential velocity of the fluid, is the fracture width, is the viscosity of the fracturing fluid, and is the fluid pressure in the fracture. The normal-phase flow of the fracturing fluid enters the rock through the formed fracture surface, and the volume conservation equation is as follows [29]:
where and are the normal filtration velocities of the fluid on the upper and lower surfaces of the fracture, respectively; and are the filtration coefficients of the upper and lower surfaces of the fracture, respectively; and is the pore fluid pressure around the fracture. As a sedimentary rock, shale is rich in numerous micropores. The fluid momentum equation can generally be used to characterize the flow of fluids in shale:
where is the porosity of the porous medium, is the velocity vector, is time, P is the local pressure, is the interaction stress between the fluid and the medium, and is the fluid density. By solving the fluid momentum equation, detailed information such as the velocity distribution and pressure distribution of fluids inside shale can be obtained.
In the case of a single fracture, the hydraulic fracture extends in the direction perpendicular to the minimum principal stress with a length of , which can be simplified as a type fracture model, as shown in Figure 1.
The condition of fracture initiation and continuous propagation at the fracture tip is [30], where is the stress intensity factor at the fracture tip and is the rock’s fracture toughness, which is determined by the material properties, and
where is the critical pressure of fracture initiation and can be obtained as follows:
The maximum principal stress intensity is used to judge the fracture initiation. If the principal stress in a certain direction of the unit exceeds the set value, that is,
then the fracture starts and extends forward.
The minimum strain–energy density criterion is commonly used in fracture mechanics. According to this criterion, when the minimum strain energy density at the crack tip accumulates to a specific critical value, the crack starts to crack and expand along the direction of the minimum strain energy density. This criterion not only considers the stress state at the crack tip but also comprehensively considers the mechanical properties and energy state of the material. Thus, it can comprehensively describe the propagation behavior of cracks. According to the theory of elasticity mechanics, the stress corresponding to different types of cracks is superimposed to obtain the strain energy density at the crack tip:
where
In the case of plane stress, ; for the problem of plane strain, . is the shear modulus, is Poisson’s ratio, and r is the radius of a concentric circle with the center of the circle at the crack tip. If only cracks of type are considered, the equation we can obtain at the critical state is as follows:
Therefore, we can obtain the following:
This criterion can evaluate the damage evolution after crack initiation during the simulation. This theory suggests that the initial propagation direction of cracks follows the minimum value direction, which is
The extension angle can be determined by taking the partial derivative of the analytical formula given in Equation (9) and substituting it into the above equation.
The finite element method is a numerical method widely used in various engineering analyses, which can simulate the relationship between force and the displacement involved in various complex physical processes. However, when facing highly nonlinear problems such as hydraulic fracturing and coupling involving multiple physical fields, the method is often not suitable or ineffective. In contrast, the extended finite element method adds an enhancement function that can reflect the discontinuity problem in the continuity function of the traditional finite element method and adds node degrees of freedom to simulate the crack propagation of any camping, solving the displacement field of special problems (including cracks and holes) [31]. Currently, it has been widely used in the simulation of hydraulic fracturing. For two-dimensional problems with fractures, the displacement vector function is approximated as follows [32,33]:
In this equation, is the node shape function, is the node injection flow rate vector related to the continuous part of the finite element solution, is a step function, is the degree of freedom of the fracture-penetration node expansion, is the asymptotic injection flow rate function of the fracture tip, is the extension degree of freedom of the element node where the fracture tip is located, and i is the node set of all nodes in the grid. By substituting the displacement vector function (14) into the stress balance equation, the stress balance relationship can be combined with the actual deformation of the rock mass [34], thus obtaining the extended finite element method discrete form of the rock mass deformation equation:
where Ω is the two-dimensional crack area, F is the traction force on the boundary, is virtual displacement, and is the corresponding virtual strain. Similarly, the fluid pressure field inside the fracture can also be approximated as
where I is the set of all element nodes in the grid, which constitutes the basic unit for fluid pressure field analysis; is shape function of the unit node, which reflects the characteristic of fluid pressure changing with spatial position; and is the node pore pressure. Substituting the displacement vector function into the fluid momentum Equation (5), the deformation of the rock mass can be correlated with the movement of fluid inside cracks, thus obtaining the discrete form of the fluid motion control equation inside cracks:
The stress–seepage coupling equation can be obtained by coupling Equations (15) and (17):
where K is the stiffness matrix, reflecting the ability of the rock mass to resist deformation; are coefficient matrices that contain physical properties, boundary conditions, and external forces of the rock mass; is the external force vector; is the node displacement vector; and is the fluid pressure vector. By simulating and using software, the geometric shape of cracks, as well as the pressure distribution state of fluids, can be obtained.
2.2. Experiment of Multi-Perforation Fracturing
2.2.1. Multiple Perforation Fracturing Experimental Protocol
The experimental design mainly considers the influence of different stresses and injection flow rates on the initiation and propagation of multi-perforation fracturing under three-dimensional stress conditions and determines whether all perforations can crack. The experiment used a high-pressure multifunctional triaxial experimental system, as shown in Figure 2. The multifunctional triaxial experimental system mainly comprises a true triaxial pressure chamber, a loading control system, and a data measurement and acquisition system. The three-dimensional stress and injection flow rates of the experiments are shown in Table 1. The basic mechanical parameters of the samples are shown in Table 2. The samples include the outcrop shale obtained from the Longmaxi Formation in Sichuan Province, as shown in Figure 3, with a sample size of 5 cm × 10 cm. The samples were drilled to create two 5 cm deep perforations with a spacing of 3 cm at the top, as shown in Figure 2c. Although there are still some areas for improvement, conducting dual-perforation shale hydraulic fracturing experiments on small-sized rock cores is a significant innovation. This is because it is difficult to place the samples in a sealed state in large-scale fracturing experiments to prevent pressure relief after the fracturing of one perforation. The procedures for fracturing tests are as follows: (1) Clean and mark the surface of the rock sample before drilling. Insert the pipe and seal the drilling hole with high-strength adhesive. (2) Place the prepared samples into the experimental fracturing chamber and use the triaxial loading system to simulate the loading of geo-stress conditions. (3) Vacuum the pipe through an air compressor, perform water injection and pressure fracturing, and monitor the water pressure in real time through a data recorder. (4) After observing that the water pressure has remained constant for a period of time during the experiment, it is judged that the water injection pump pressure system should be shut down after the completion of fracturing. (5) After pressure relief, disassemble and remove the sample, take photos and record the direction of surface cracks on the sample, and perform CT scanning. Then, export the water pressure data for experimental result analysis.
2.2.2. The Effect of Principal Stress Differences on Fracturing
The water injection pressure curves during fracturing and the samples after fracturing are shown in Figure 4. The red arrow represents the direction of the fracture. The fracturing conditions of S4 and S15, S6 and S10, and S9 and S13 are only different regarding the axial pressure. The width and length of the fractures in S15, S10, and S13 are larger, indicating that the greater the axial pressure, the greater the degree of fracture propagation. The fractures of S10 and S13 are close to penetrating the bottom surface, while the surface length of the cracks in samples S6 and S9 is shorter. In addition, according to the characteristic curve of dual-hole pressure during the fracturing process, the trend of the changes in shale hydraulic fracturing is roughly the same under different stress conditions. Still, there are differences in the initiation pressure and time of the two holes due to stress combinations. The maximum initiation pressure of S4 exceeds 40 MPa, while the maximum initiation pressure of S15 does not exceed 35 MPa. Compared to that of S6, the initiation pressure of S10 under high-stress differences is also slightly lower. Increasing the axial pressure (the maximum principal stress) is more conducive to fracture initiation and propagation under the same injection flow rate.
2.2.3. Influence of Injection Flow Rate on Fracturing
To analyze the impact of fluid injection flow rates on the initiation and propagation of hydraulic fractures, fluids with different injection flow rates were used for fracturing. The perforation pressure curves of the fracturing process are shown in Figure 5. The initiation time, initiation pressure of each perforation, and average initiation pressure are shown in Table 3. The S2 sample has the highest pressure at the fracture initiation but the shortest time required from the initial injection for the fracture to form. The S6 sample has the lowest average pressure at the fracture initiation but the longest time required from the initial injection for the fracture to form. This is because as the injection rate increases, the fluid pressure rises faster in a limited space, and the perforation initiation time becomes significantly earlier; thus, a greater injection rate is accompanied by a higher fracture pressure.
2.2.4. Analysis of Multi-Perforation Initiation
CT scanning was performed on the samples after fracturing to further analyze the mechanism of fracture initiation. In Figure 6, the CT scanning profiles of the S10 sample at different heights from the perforation top surface are shown from left to right. As shown in the figure, both perforations have initiated fractures, forming two nearly parallel main fractures that extend toward both sides of the perforation. In addition, combined with the fluid pressure curve shown in Figure 4d, the initiation time and the pressure of the two perforations differ. Moreover, as seen in the experimental results of other samples, the initiation time and pressure of the two perforations are not the same. However, the pressure is often close to the same after rupture. This is because the fractures generated by the two holes are interconnected, as shown at the top of the sample in Figure 4c, or both fractures penetrate the surface, causing the interconnection of liquid. The initiation and expansion of one perforation cannot prevent the initiation of another perforation, which provides experimental support for generating multiple parallel fractures under multi-perforation conditions.
3. Simulation under Multi-Perforation Conditions
Hydraulic fracturing of horizontal wells greatly increases the fracture network area of horizontal wells, thereby improving the productivity of gas wells. Conducting in-depth research on the initiation and propagation mechanisms under single clusters with multi-perforation conditions can improve current fracturing technology to achieve the most optimized fracture distribution results, thereby improving the hydraulic fracturing efficiency of shale horizontal wells and achieving safe, practical, and economic development of unconventional resources.
3.1. Model Description
During the fracturing process of a horizontal well, multiple perforations are used in a cluster, and each cluster may form many fractures. Parameters such as the injection flow rate, reservoir stress, and perforation spacing can all affect the formation of multiple fractures. If the parameter settings are not optimized, it may cause some perforations to fail to open or form effective fracturing fractures, thereby reducing the efficiency of fracturing construction. As shown in Figure 7, a two-dimensional shale model for hydraulic fracturing under multi-perforation conditions based on the extended finite element theory was established, with a size of 1 × 6 m. Due to simulation limitations, some assumptions were established for the model. For example, the reservoir was considered as a homogeneous and isotropic medium, and the simulation did not consider the influence of bedding and natural fractures on hydraulic fracture propagation. However, the influence of seepage and filtration on pressure was considered. Multiple perforations were simulated by setting multiple initial fractures with a length of 1 cm. The relevant model parameters were set according to the data for shale gas wells in southwestern Sichuan Province, China, as shown in Table 4. This model was used to study the effects of perforation spacing, perforation quantity, reservoir stress, and construction injection flow rate on the initiation and propagation of multiple fractures during the hydraulic fracturing of horizontal wells. To study the influence of different parameters on the initiation and propagation, different operating conditions were designed and simulated, as shown in Table 5.
3.2. Verification of Extended Finite Element Model
To verify the reliability of the proposed model, the model results were compared to the simulation results obtained by Chen et al. [35], who also used the extended finite element method. We simulated the propagation of two fractures under two different principal stress differences, and both models had the same basic parameters and stress conditions, as shown in Table 6. The results are shown in Figure 8. The Figure shows that the fracture propagation path remains almost consistent, proving that the method and the model used in this study have high reliability. To further verify the model’s accuracy, the results of a single crack were compared with the classical model (KGD) [36]. After 40 min of fracturing, the crack length calculated using the KGD model was 43.71 m, and the XFEM model calculated a crack length of 42.82 m. This is a difference of 2%, thus verifying the proposed model’s accuracy.
3.3. Simulation Results and Analysis
To study the influence of different factors on the initiation and propagation of fractures under multi-perforation conditions, a comparative simulation analysis was conducted on each factor investigated in this study to better understand the influence of each factor during the horizontal well’s fracturing process. Firstly, based on the simulation results and combined with the experimental analysis, it was found that the perforations showed significant interference with each other during the initiation stage. However, there was a trend of parallel propagation thereafter. The experimental and simulation results confirm that all perforations can initiate fractures under the condition of a single cluster with multiple perforations. Thus, the parallel fractures distributed in the clusters found at the Hydraulic Fracturing Test Site in the United States were largely developed from each perforation in each cluster, as shown in Figure 9. Based on the simulation results, it can be inferred that under actual shale fracturing conditions, fractures propagate in a parallel manner.
3.3.1. The Influence of Perforation Spacing on Fracture Initiation and Propagation
To analyze the impact of perforation spacing on the initiation and propagation morphology of a cluster with multiple perforations, the extended finite element model established in this study was used to simulate the fracturing state under different conditions. The results are shown in Figure 10 and Figure 11 (the color of the lines in the figures represents the width of the fractures). For clearer presentation, the deformation scale factor of the fractures in all figures is set to 20. These figures show that under multi-perforation conditions, even if there is a difference in perforation spacing, the two outermost perforations are the first to fracture, followed by the two adjacent perforations, and the middle perforation is the last to fracture. Due to the presence of stress interference, both sides of these fractures show a tendency to deflect outward. After the fractures on both sides deflect, the impact on the middle fracture is reduced, and the propagation speed of the middle fracture is accelerated, with the propagation length being significantly greater than the other fractures. In Scheme 1, at 300 s, the length of the middle fracture reaches 27.1 cm, while the outermost fracture is only 14.6 cm, a decrease of 46.1% in length. When the perforation spacing is 6 cm, the interference is significantly stronger, and the two outermost fractures exhibit a larger outward deflection angle of about 13°. After the outermost fracture deflects, its influence on the second outermost fracture decreases. When expanding, the second outermost fracture deflects outward under the influence of the middle fracture until it merges with the outermost fracture and then continues to expand in a nearly parallel state. When the perforation spacing is 12 cm, the interference of the fractures on both sides is relatively small, and the outward deflection angle is only about 11°. After expanding by about 24.2 cm, it maintains parallel expansion with other fractures. The second outermost fracture quickly becomes parallel to the middle fracture, and the outermost fracture becomes parallel after the outward deflection. Afterward, the five fractures continue to expand in parallel in sequence. Given these results, it can be concluded that increasing the perforation spacing appropriately during actual fracturing can reduce the competitive expansion effect between fractures, improve the uniformity of multi-fracture development, and increase the length of simultaneous multi-fracture development.
3.3.2. The Influence of the Number of Perforations on Fracture Initiation and Propagation
Using the same method, we analyzed the impact of different numbers of perforations on the initiation and propagation of multi-perforation hydraulic fracturing in a single cluster, and the results are shown in Figure 12 and Figure 13. These figures show that with a larger perforation spacing of 12 cm, all perforations can initiate normally in sequence and continue to propagate in a stepped sequence in a parallel state. However, when the number of perforations is 5, the interference on both sides of the perforations is relatively large and tends to deflect outward. The deflection angle is approximately 10°. Due to the interference of the middle perforation generated by both sides canceling each other out, the expansion speed of the middle perforation is faster. In Scheme 6, at 1000 s, the length of the middle fracture reached 118.5 cm, while the second outermost fracture was 70.4 cm and the outermost fracture was 33.4 cm, decreasing by 40.6% and 71.8% in length separately. After the second outermost fracture was deflected toward the outer side for a certain distance, it was influenced by the outermost fracture and started developing toward the middle, thereby extending parallel to the middle fracture. After the outermost fracture was deflected for a certain distance, it maintained parallel expansion with the three inner fractures. In the case of three perforations, the two outer cracks were still the first to crack. Due to relatively small interference, although they had a slight deviation toward the outside, they quickly maintained a parallel expansion state with the middle fracture. At 1000 s, the length of the middle crack reached 133.5 cm, which is 11.2% longer than that of five perforations. This phenomenon indicates that a decrease in the number of perforations helps to reduce mutual interference during the fracture propagation, making the process more stable. In practical engineering, in order to maximize fracturing efficiency, it is possible to consider reducing the number of perforations appropriately to reduce interference during crack propagation and achieve a more stable and efficient fracturing effect.
3.3.3. The Influence of Different In Situ Stress Conditions on the Initiation and Propagation of Fractures
The effects of different in situ stress conditions with the same spacing and number of perforations on the initiation and propagation of fractures were simulated, and the results are shown in Figure 14 and Figure 15. Through a comparison of the results, it was found that under a principal stress difference of 10 MPa, the influence of stress on the direction of the fractures is smaller, and the fractures become more uniform during propagation, which is more conducive to the formation of parallel propagation fractures. At the same time point, the extension length is larger, which is more conducive to the development of fractures toward the far end. For example, at 300 s, the perforation length in the middle of Scheme 2 reached 108.9 cm, while it was only 67.2 cm in Scheme 4. When the principal stress difference was 5 MPa, the speed of fracture propagation was slower, and the fractures on both sides were more prone to deflection. In the case of Scheme 4, where the principal stress difference was small and the spacing was also small, the deflection angle of the outermost fracture was close to 45°, and it even developed in a direction perpendicular to the initial direction, which is not conducive to the extension to the far end. Moreover, taking the middle fracture as an example, the fracture lengths of Scheme 10 and Scheme 12 were 141.5 cm and 116.9 cm at 1000 s. It can be seen that under higher stress difference conditions, the fracture length at the same time point is longer. In addition, it was found through comparison that under larger principal stress differences, the initiation time of perforation is earlier, which is consistent with the experimental results. It can be seen in Figure 14 and Figure 15 that a large principal stress difference during the fracturing process is not only conducive to the initiation of fractures but also has a positive effect on the continuous propagation of fractures toward the far end. Overall, it can be concluded that the greater the stress difference, the weaker the stress interference effect on fracture propagation, and the more uniform the fracture propagation; thus, the phenomenon of competitive propagation between fractures gradually weakens.
3.3.4. The Influence of Different Injection Flow Rates on the Initiation and Propagation of Fractures
By keeping the other conditions unchanged, simulations were conducted under different states to examine the effect of different injection flow rates on fracture initiation and propagation. As shown in Figure 16, the flow rate does not have a significant impact on the morphology of fractures; however, the greater the injection flow rate, the longer the fracture propagation distance at the same time point. Taking the middle crack, for example, at 600 s, the crack lengths for Schemes 1, 2, and 3 were 97.1 cm, 131.8 cm, and 217.6 cm, respectively. Further, when extracting the pressure curve at the same location points as Schemes 1, 2, and 3, as shown in Figure 17a,b, as the injection flow rate increased, the perforation initiation time was earlier. Similar results were also observed in the experiments described in Section 2.2.3. Based on the experimental results in the previous section, we obtained a pressure chart for perforation initiation at different flow rates. The same result was also obtained, as shown in Figure 18. This is because the greater the injection flow rate at the same time point, the larger the volume required to accommodate the fluid, resulting in a greater relative fracture propagation length. During the stage of continuous fracture propagation, the required fluid pressure tends to be the same, and there is no clear correlation with the flow rate. Therefore, in actual fracturing operations, the injection flow rate should be adjusted reasonably based on the geological conditions in order to achieve the best fracturing effect.
4. Discussion
This study conducted fracture initiation and propagation experiments on multi-perforation fracturing. It simulated the initiation and propagation of hydraulic fracturing under multi-perforation conditions while considering the influence of shale fluid seepage and filtration loss using the extended finite element method. The following conclusions can be drawn:
- (1)
- All perforations can initiate fractures under the condition of multiple perforations in one cluster when using experimental and simulation methods. The parallel fracture swarms discovered at the Hydraulic Fracturing Test Site (HFTS) are highly likely to be caused by the initiation and continuous propagation of each perforation. Due to the stress interference between perforations, the order of perforation initiation varies, but there is a trend of parallel propagation.
- (2)
- When the perforation spacing is 12 cm, the interference between fractures is significantly reduced compared to 6 cm. Thus, increasing the perforation spacing is beneficial for the parallel expansion of fractures toward the distal end.
- (3)
- With five perforations, the stress interference of initiation and propagation between the fractures is stronger. When the number of perforations is three, the initiation time of the perforations is earlier, and the mutual interference between fractures is weaker, which is more conducive to the parallel propagation of fractures. Reducing the number of perforations has a positive effect on the initiation and expansion of hydraulic fracturing.
- (4)
- When the principal stress difference is 10 MPa, fractures start earlier than when it is 5 MPa, and the initiation time of perforation is advanced by 2–3 s. The deflection angle of the outermost crack is almost 90° when the stress difference is 5 MPa. The greater the principal stress difference, the smaller the degree of stress interference in fracture propagation, and the fractures become more uniform during propagation, which is conducive to the formation of parallel propagation fractures. Moreover, the extension length is larger at the same time point, which supports the development of fractures toward the far end. In addition, the comparison showed that when the principal stress difference is larger, the initiation time of perforation is earlier, which is consistent with the experimental results.
- (5)
- Both the experimental and simulation results indicate that a higher flow rate is conducive to fracture initiation and propagation. An increase in the flow rate has a reduced impact on the shape of fractures, but it increases the propagation speed of fractures, and the crack length increases by about 80% at 600 s.
Author Contributions
Conceptualization, W.X. and D.D.; experimental and simulation research, D.D. and W.G.; investigation, D.D. and H.Y.; resources, D.D. and K.W.; writing—original draft preparation, D.D.; writing—review and editing, W.G. and D.D.; project administration, W.X. All authors have read and agreed to the published version of the manuscript.
Funding
This research was funded by the Basic and Forward-Looking Technology Special Project of the China National Petroleum Corporation (Grant No. 2023ZZ08).
Data Availability Statement
Data will be made available upon request.
Conflicts of Interest
Authors Haiqing Yu and Keyuan Wang were employed by the company China Petroleum Technology Development Corporation. The remaining authors declare that the research was conducted in the absence of any commercial or financial relationships that could be construed as a potential conflict of interest. The China Petroleum Technology Development Corporation had no role in the design of the study; in the collection, analyses, or interpretation of data; in the writing of the manuscript, or in the decision to publish the results.
References
- Dong, D.; Wang, Y.; Li, X.; Zou, C.; Guan, Q.; Zhang, C.; Huang, J.; Wang, S.; Wang, H.; Liu, H.; et al. New breakthroughs and development prospects of shale gas exploration and development in China. Nat. Gas Ind. 2016, 18, 1–5. [Google Scholar]
- Zhang, J. Practice and Enlightenment of first principles in shale gas revolution. Drill. Eng. 2022, 49, 1–8. [Google Scholar]
- Zou, C.; Zhao, Q.; Cong, L. Progress, potential and Prospect of shale gas development in China. Nat. Gas Ind. 2021, 41, 1–14. [Google Scholar]
- Lei, L.; Zhang, L.; Xiong, W.; Xia, W. Staged fracturing technology for atmospheric shale gas horizontal wells in Wulong block. Pet. Drill. Tech. 2019, 47, 76–82. [Google Scholar]
- Wang, S. Analysis on staged fracturing technology for shale gas horizontal wells. Process Technol. 2021, 1, 184–186. [Google Scholar]
- Pei, Y.; Ma, S.; Li, L.; Xu, J. Research review of shale gas well fracturing technology. Petrochem. Technol. 2019, 26, 266–267. [Google Scholar]
- Spain, D.R.; Gil, I.; Sebastian, H.; Smith, P.S.; Wampler, J.; Cadwallader, S.; Graff, M. Geo-Engineered Completion Optimization: An Integrated, Multi-Disciplinary Approach to Improve Stimulation Efficiency in Unconventional Shale Reservoirs. In Proceedings of the SPE Middle East Unconventional Resources Conference and Exhibition, Muscat, Oman, 26–28 January 2015. [Google Scholar]
- Li, Y.; Deng, J.; Liu, W.; Yan, W.; Cao, W.; Wang, P. Numerical simulation of segmented multi cluster flow limiting fracturing in horizontal wells. Fault-Block Oil Gas Field 2017, 24, 69–73. [Google Scholar]
- Ciezobka, J.; Courtier, J.; Wicker, J.; Laredo Petroleum, Inc. Hydraulic Fracturing Test Site (HFTS)–Project Overview and Summary of Results. In Proceedings of the Unconventional Resources Technology Conference, Houston, TX, USA, 23–25 July 2018. [Google Scholar]
- Male, F.; Rysak, B.; Dommisse, R. Statistical Analysis of Fractures from the Hydraulic Fracture Test Site 1. In Proceedings of the Unconventional Resources Technology Conference, Houston, TX, USA, 26–28 July 2021. [Google Scholar]
- Bessa, F.; Jerath, K.; Ginn, C.; Johnston, P.; Zhao, Y.; Brown, T.; Lopez, R.; Kessler, J.; Nicklen, B.; Sahni, V. Subsurface Characterization of Hydraulic Fracture Test Site-2 (HFTS-2), Delaware Basin. In Proceedings of the Unconventional Resources Technology Conference, Houston, TX, USA, 26–28 July 2021. [Google Scholar]
- Ciezobka, J.; Reeves, S.; Gas Technology Institute (GTI). Overview of Hydraulic Fracturing Test Sites (HFTS) in the Permian Basin and Summary of Selected Results (HFTS-I in Midland and HFTS-II in Delaware). In Proceedings of the Latin America Unconventional Resources Technology Conference, Online, 16–18 November 2020. [Google Scholar]
- Cao, M.; Zheng, S.; Elliott, B.; Sharma, M. Impact of Complex Fracture Networks on Well Productivity: A Case Study of the Hydraulic Fracturing Test Site #2. In Proceedings of the SPE Hydraulic Fracturing Technology Conference and Exhibition, The Woodlands, TX, USA, 1–3 February 2022. [Google Scholar]
- Li, C.; Pang, Y.; Zhou, Y.; Zhan, J.; Zhu, S. Analysis on the conditions of producing volume pressure fracture network in formation. Fault-Block Oil Gas Field 2022, 29, 101–106. [Google Scholar]
- Raterman, K.T.; Farrell, H.E.; Mora, O.S.; Janssen, A.L.; Gomez, G.A.; Busetti, S.; McEwen, J.; Friehauf, K.; Rutherford, J.; Reid, R.; et al. Sampling a stimulated rock volume: An Eagle Ford Example. In Proceedings of the SPE Hydraulic Fracturing Technology Conference, The Woodlands, TX, USA, 24–26 January 2017. [Google Scholar]
- Sesetty, V.; Ghassemi, A. Simulation and Analysis of Fracture Swarms Observed in the Eagle Ford Field Experiment. In Proceedings of the SPE Hydraulic Fracturing Technology Conference and Exhibition, The Woodlands, TX, USA, 5–7 February 2019. [Google Scholar]
- Weijermars, R.; Pham, T.; Stegent, N.; Dusterhoft, R. Hydraulic Fracture Propagation Paths Modeled using Time-Stepped Linear Superposition Method (TLSM): Application to Fracture Treatment Stages with Interacting Hydraulic and Natural Fractures at the Wolfcamp Field Test Site (HFTS). In Proceedings of the 54th US Rock Mechanics/Geomechanics Symposium, Golden, CO, USA, 28 June–1 July 2020. [Google Scholar]
- Tan, P.; Pang, H.; Zhang, R.; Jin, Y.; Zhou, Y.; Kao, J.; Fan, M. Experimental investigation into hydraulic fracture geometry and proppant migration characteristics for southeastern Sichuan deep shale reservoirs. J. Pet. Sci. Eng. 2018, 184, 106517. [Google Scholar] [CrossRef]
- Zhang, Q.; Zhang, X.-P.; Sun, W. A review of laboratory studies and theoretical analysis for the interaction mode between induced hydraulic fractures and pre-existing fractures. J. Nat. Gas Sci. Eng. 2021, 86, 103719. [Google Scholar] [CrossRef]
- Guo, T.; Tang, S.; Liu, S.; Liu, X.; Xu, J.; Qi, N.; Rui, Z. Physical Simulation of Hydraulic Fracturing of Large-Sized Tight Sandstone Outcrops. SPE J. 2021, 26, 372–393. [Google Scholar] [CrossRef]
- Wei, C.; Zhang, B.; Li, S.; Fan, Z.; Li, C. Interaction between hydraulic fracture and pre-existing fracture under pulse hydraulic fracturing. SPE Prod. Oper. 2021, 36, 553–571. [Google Scholar] [CrossRef]
- Chi, Z.; Tong, Z.; Xiao, J.; Wei, Q.; Ma, W. Practice and understanding of infill well fracturing technology in Fuling shale gas field. Fault-Block Oil Gas Field 2022, 29, 775–779. [Google Scholar]
- Chen, J.; Xu, H. Numerical simulation of hydraulic fracturing based on ABAQUS. Inn. Mong. Petrochem. Ind. 2020, 2, 46–48. [Google Scholar]
- Duan, K.; Kwok, C.Y.; Zhang, Q.; Shang, J. On the initiation, propagation and reorientation of simultaneously-induced multiple hydraulic fractures. Comput. Geotech. 2020, 117, 103226. [Google Scholar] [CrossRef]
- Li, X.; Hofmann, H.; Yoshioka, K.; Luo, Y.; Liang, Y. Phase-Field Modelling of Interactions Between Hydraulic Fractures and Natural Fractures. Rock Mech. Rock Eng. 2022, 55, 6227–6247. [Google Scholar] [CrossRef]
- Dou, F.; Wang, J.G. A numerical investigation for the impacts of shale matrix heterogeneity on hydraulic fracturing with a two-dimensional particle assemblage simulation model. J. Nat. Gas Sci. Eng. 2022, 104, 104678. [Google Scholar] [CrossRef]
- Han, W.; Cui, Z.; Zhang, J. Fracture path interaction of two adjacent perforations subjected to different injection rate increments. Comput. Geotech. 2020, 122, 103500. [Google Scholar] [CrossRef]
- Zhang, J.G.; Li, X.P.; Wang, C.R.; Lu, A.; Sun, Z.X. Numerical simulation of rock formation stress-fluid pressure coupling and development of artificial fractures during hydraulic fracturing of shale gas reservoirs. J. China Univ. Pet. (Ed. Nat. Sci.) 2018, 42, 96–105. [Google Scholar]
- Salimzadeh, S.; Khalili, N. A three-phase XFEM model for hydraulic fracturing with cohesive fracture propagation. Comput. Geotech. 2015, 69, 82–92. [Google Scholar] [CrossRef]
- Irwin, G.R. Analysis of Stress and Strains Near the End of a fracture Traversing a Plate. J. Appl. Mech. 1957, 24, 361–364. [Google Scholar] [CrossRef]
- Guo, L.; Chen, Z.; Luo, J.; Chen, G. Overview of Extended Finite Element Methods and its applications. Chin. Q. Mech. 2011, 32, 612–625. [Google Scholar]
- Li, Q.; Wang, F.; Wang, Y.; Forson, K.; Cao, L.; Zhang, C.; Zhou, C.; Zhao, B.; Chen, J. Experimental investigation on the high-pressure sand suspension and adsorption capacity of guar gum fracturing fluid in low-permeability shale reservoirs: Factor analysis and mechanism disclosure. Environ. Sci. Pollut. Res. 2022, 29, 53050–53062. [Google Scholar] [CrossRef] [PubMed]
- Li, Q.; Han, Y.; Liu, X.; Ansari, U.; Cheng, Y.; Yan, C. Hydrate as a by-product in CO2 leakage during the long-term sub-seabed sequestration and its role in preventing further leakage. Environ. Sci. Pollut. Res. 2022, 29, 77737–77754. [Google Scholar] [CrossRef] [PubMed]
- Li, Y. The Optimization of Hydraulic Fracturing Construction Parameter Based on XFEM. Master’s Thesis, China University of Petroleum, Beijing, China, 2018. [Google Scholar]
- Chen, J.; Wei, B.; Xie, Q.; Wang, H.; Li, T. Multi fracture simulation of shale horizontal well based on extended finite element method. Appl. Math. Mech. 2016, 37, 73–83. [Google Scholar]
- Geersma, J.; Klerk, F.D. A rapid method of predicting width and extent of hydraulically induced fractures. J. Pet. Technol. 1969, 21, 1571–1581. [Google Scholar] [CrossRef]
Figure 1.
Schematic diagram of the hydraulic fracture tip.
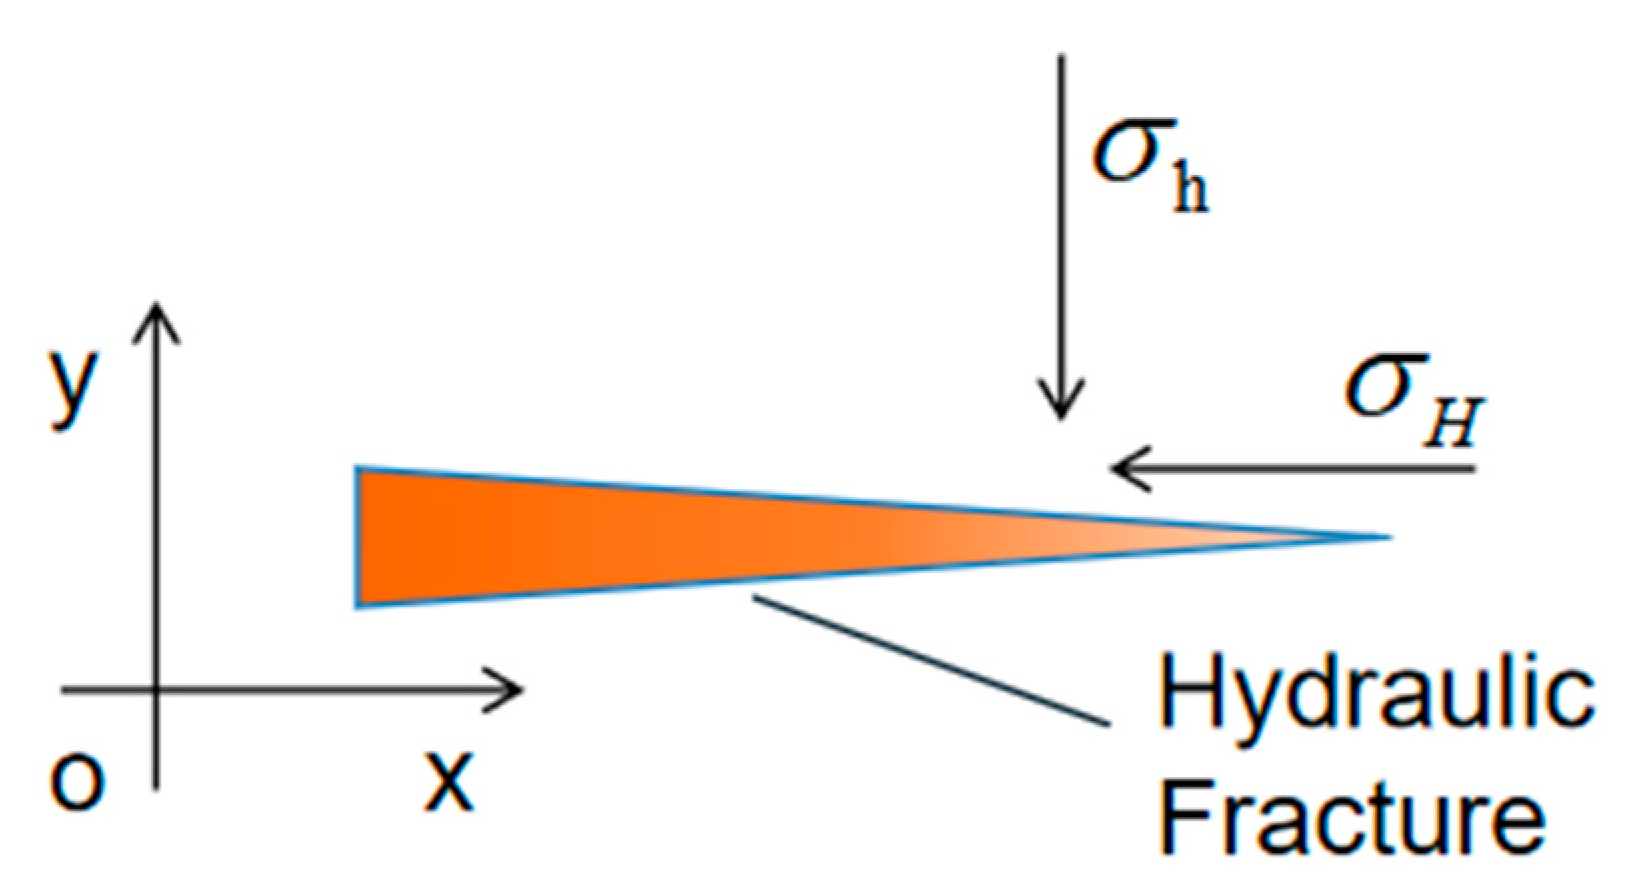
Figure 2.
(a) Photos of the high-pressure multifunctional triaxial experimental system; (b) device diagram; (c) schematic diagram of dual-perforation hydraulic fracturing.
Figure 2.
(a) Photos of the high-pressure multifunctional triaxial experimental system; (b) device diagram; (c) schematic diagram of dual-perforation hydraulic fracturing.
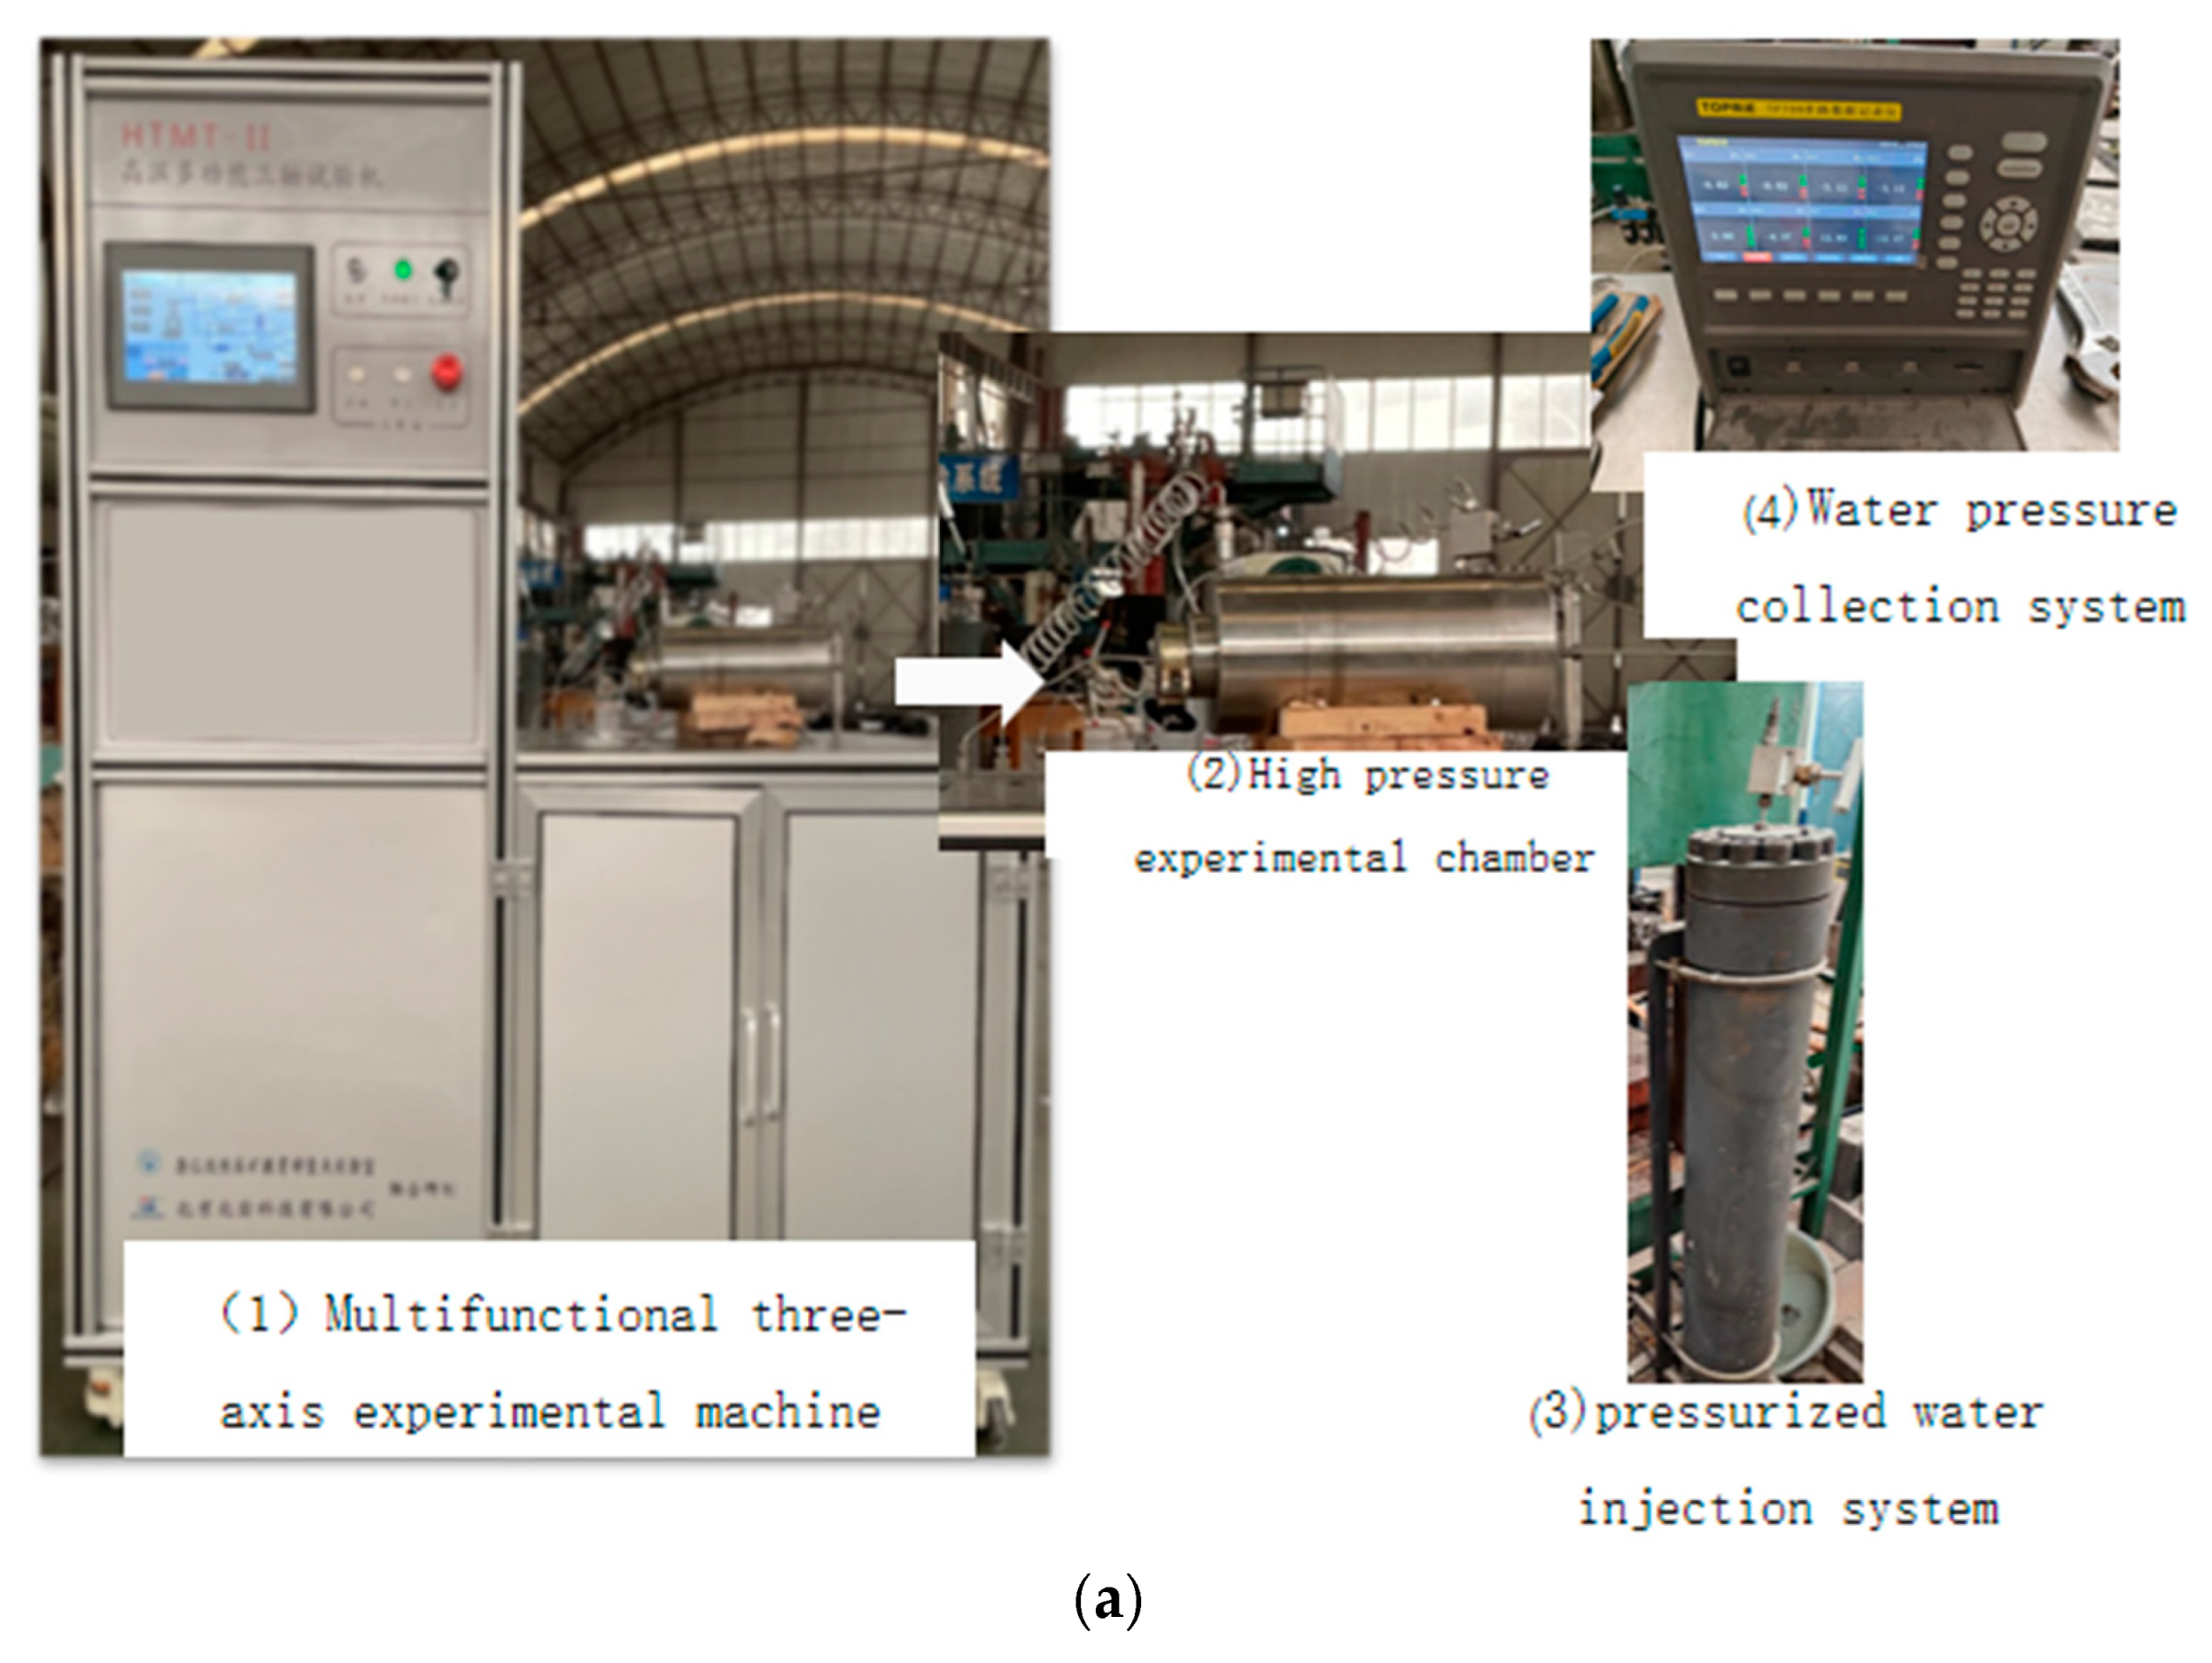

Figure 3.
Shale drilling and pre-fracturing samples.
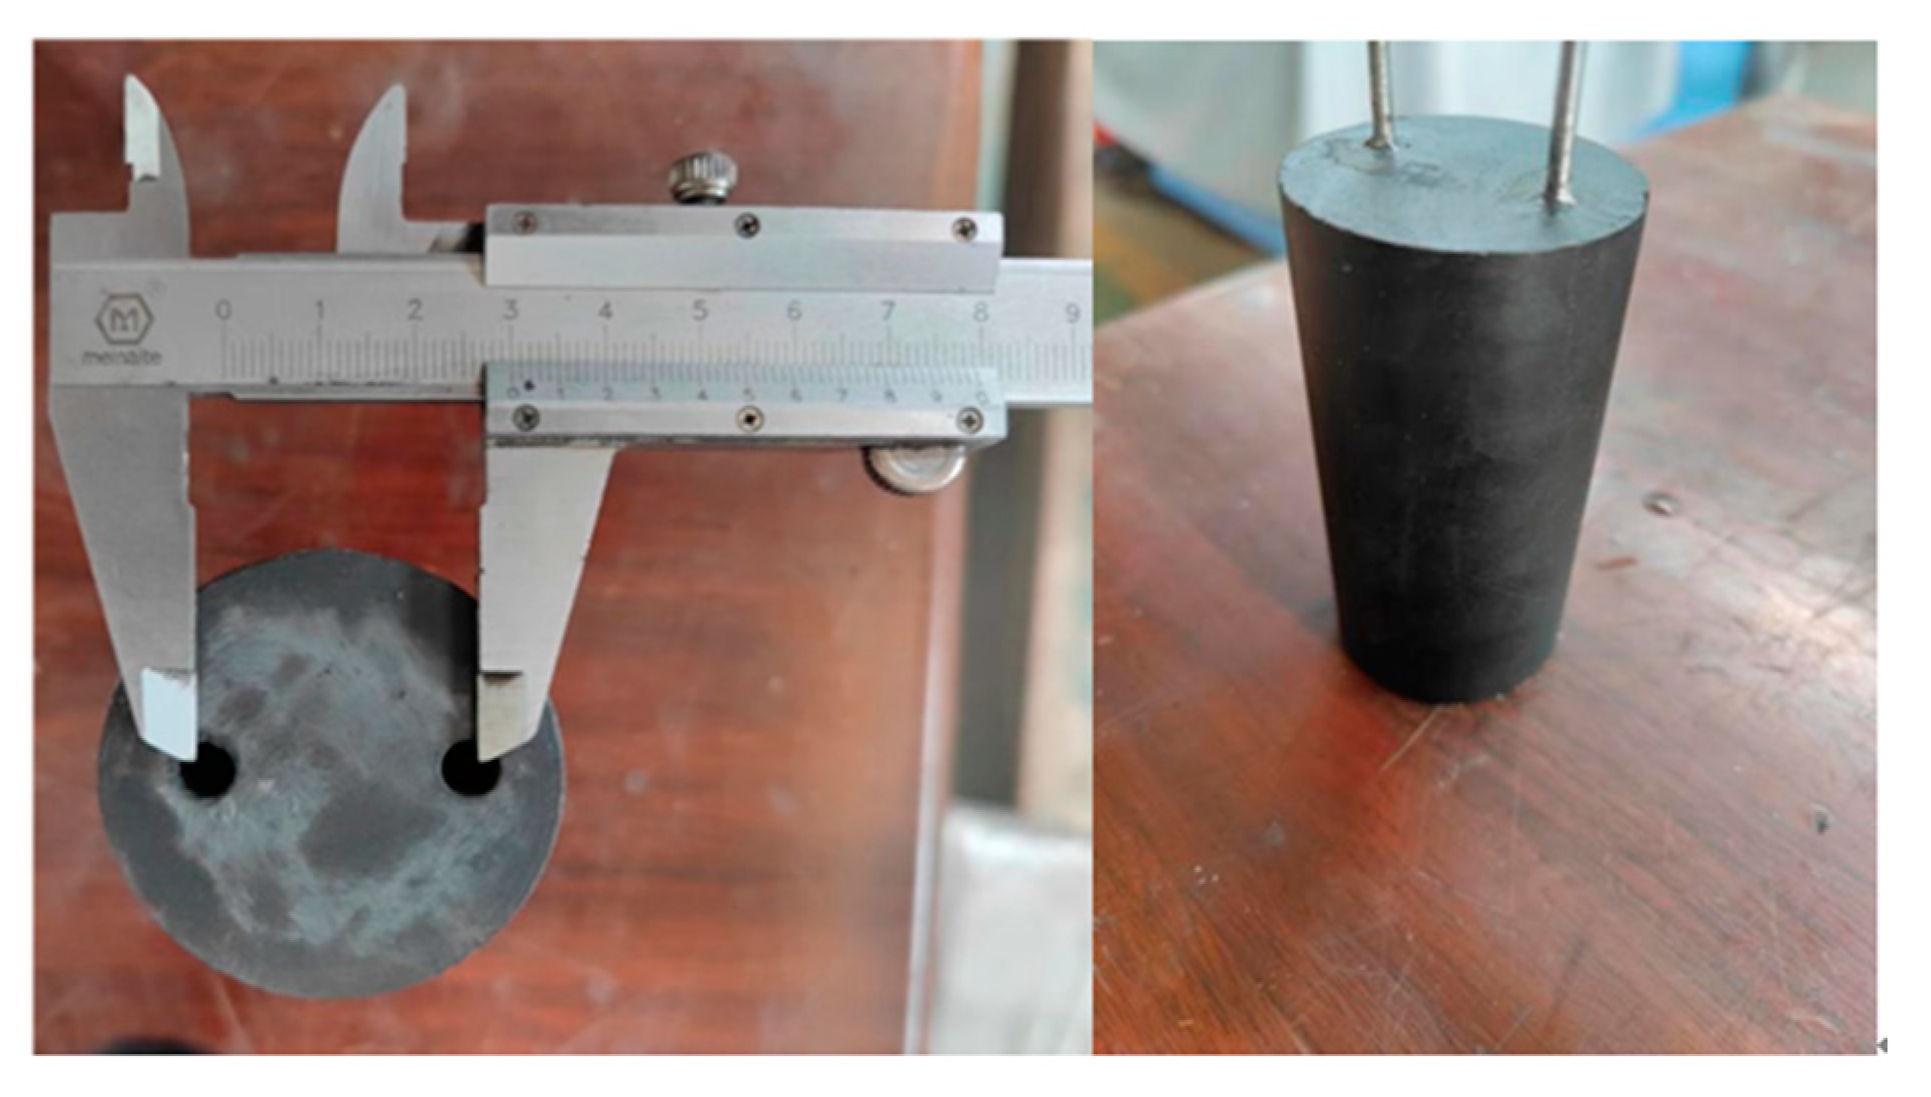
Figure 4.
Effect of fluid injection pressure on sample fracturing: (a) S4; (b) S15; (c) S6; (d) S10; (e) S9; and (f) S13.
Figure 4.
Effect of fluid injection pressure on sample fracturing: (a) S4; (b) S15; (c) S6; (d) S10; (e) S9; and (f) S13.


Figure 5.
Fluid pressure curves of samples: (a) S2, (b) S4, and (c) S6.
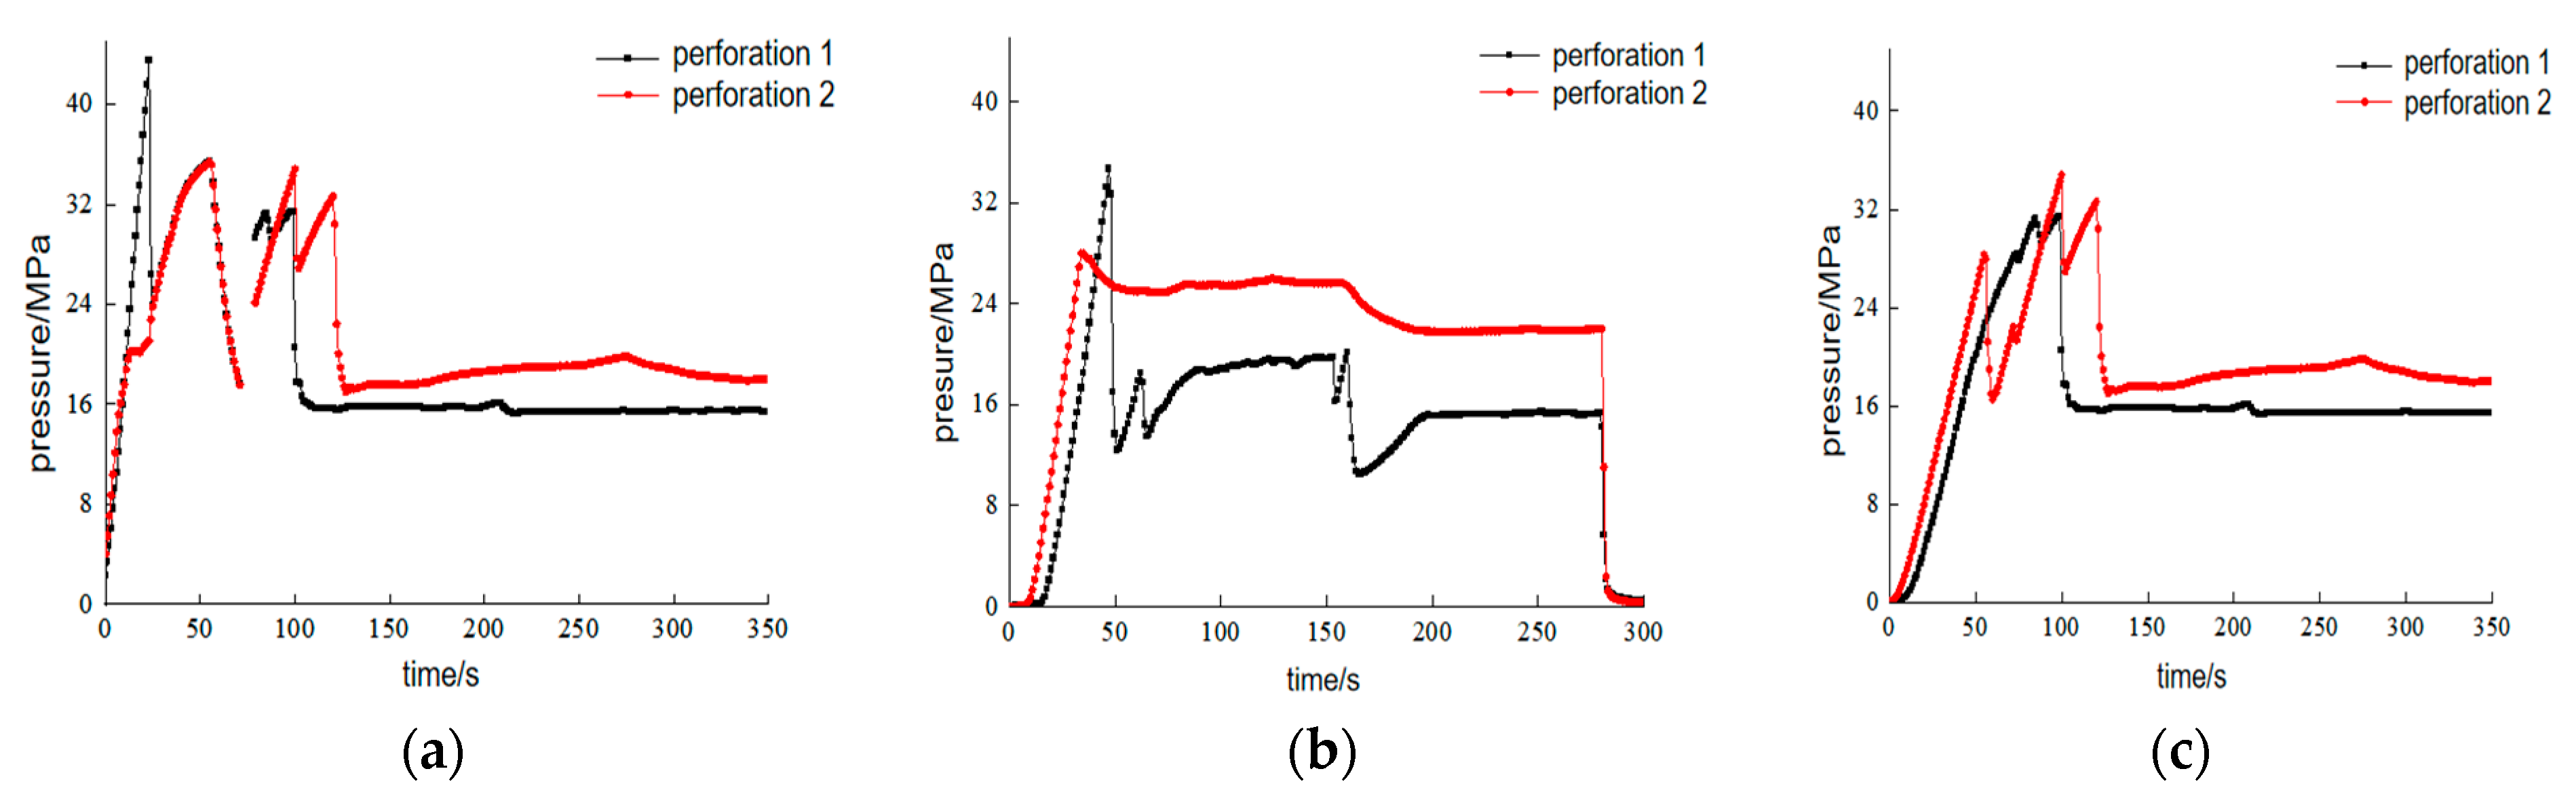
Figure 6.
CT scan results of S10: (a) original scanned image; (b) fracture identification map.

Figure 7.
Schematic diagram of the model used (Scheme 1).

Figure 8.
Comparison of the fracture propagation path obtained in this study (left) and Chen et al.’s results [35] (right).
Figure 8.
Comparison of the fracture propagation path obtained in this study (left) and Chen et al.’s results [35] (right).
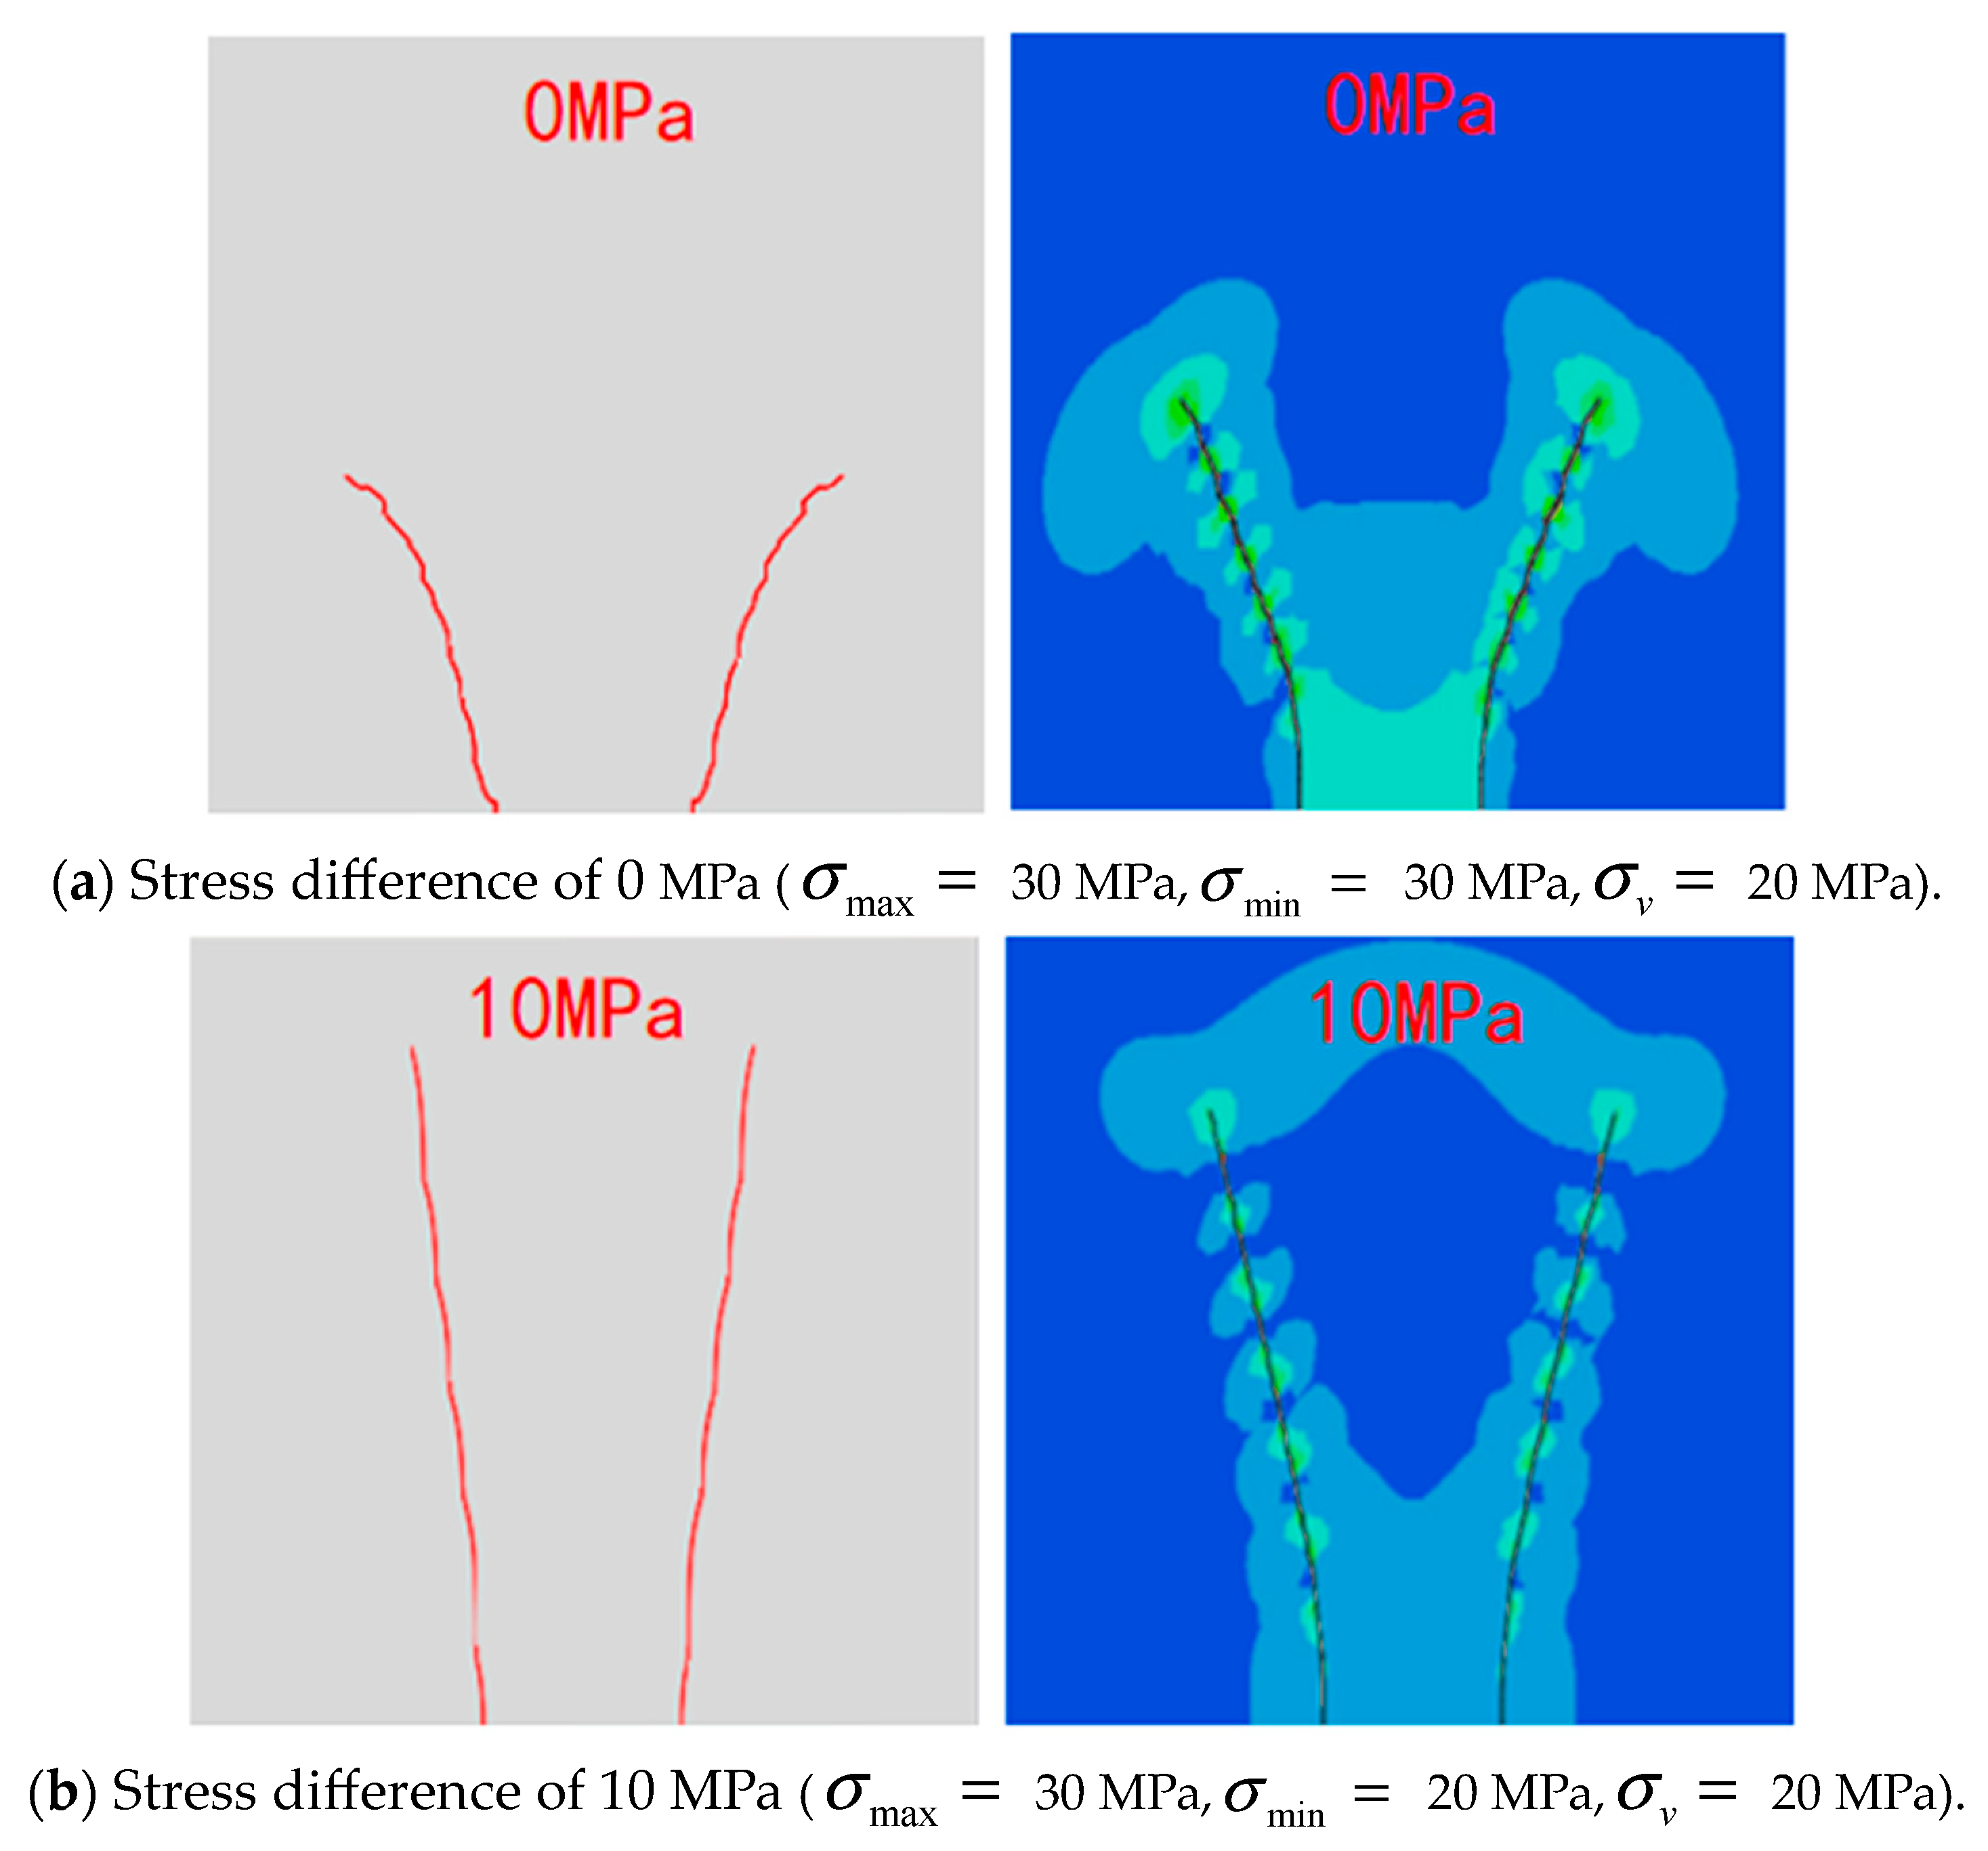
Figure 9.
Coring (a,b) and CT observation (c) results obtained from the Hydraulic Fracturing Test Site in the United States, adopted from Ciezobka et al. [9].
Figure 9.
Coring (a,b) and CT observation (c) results obtained from the Hydraulic Fracturing Test Site in the United States, adopted from Ciezobka et al. [9].

Figure 10.
Fracture initiation and propagation diagram at different time points of Scheme 1.
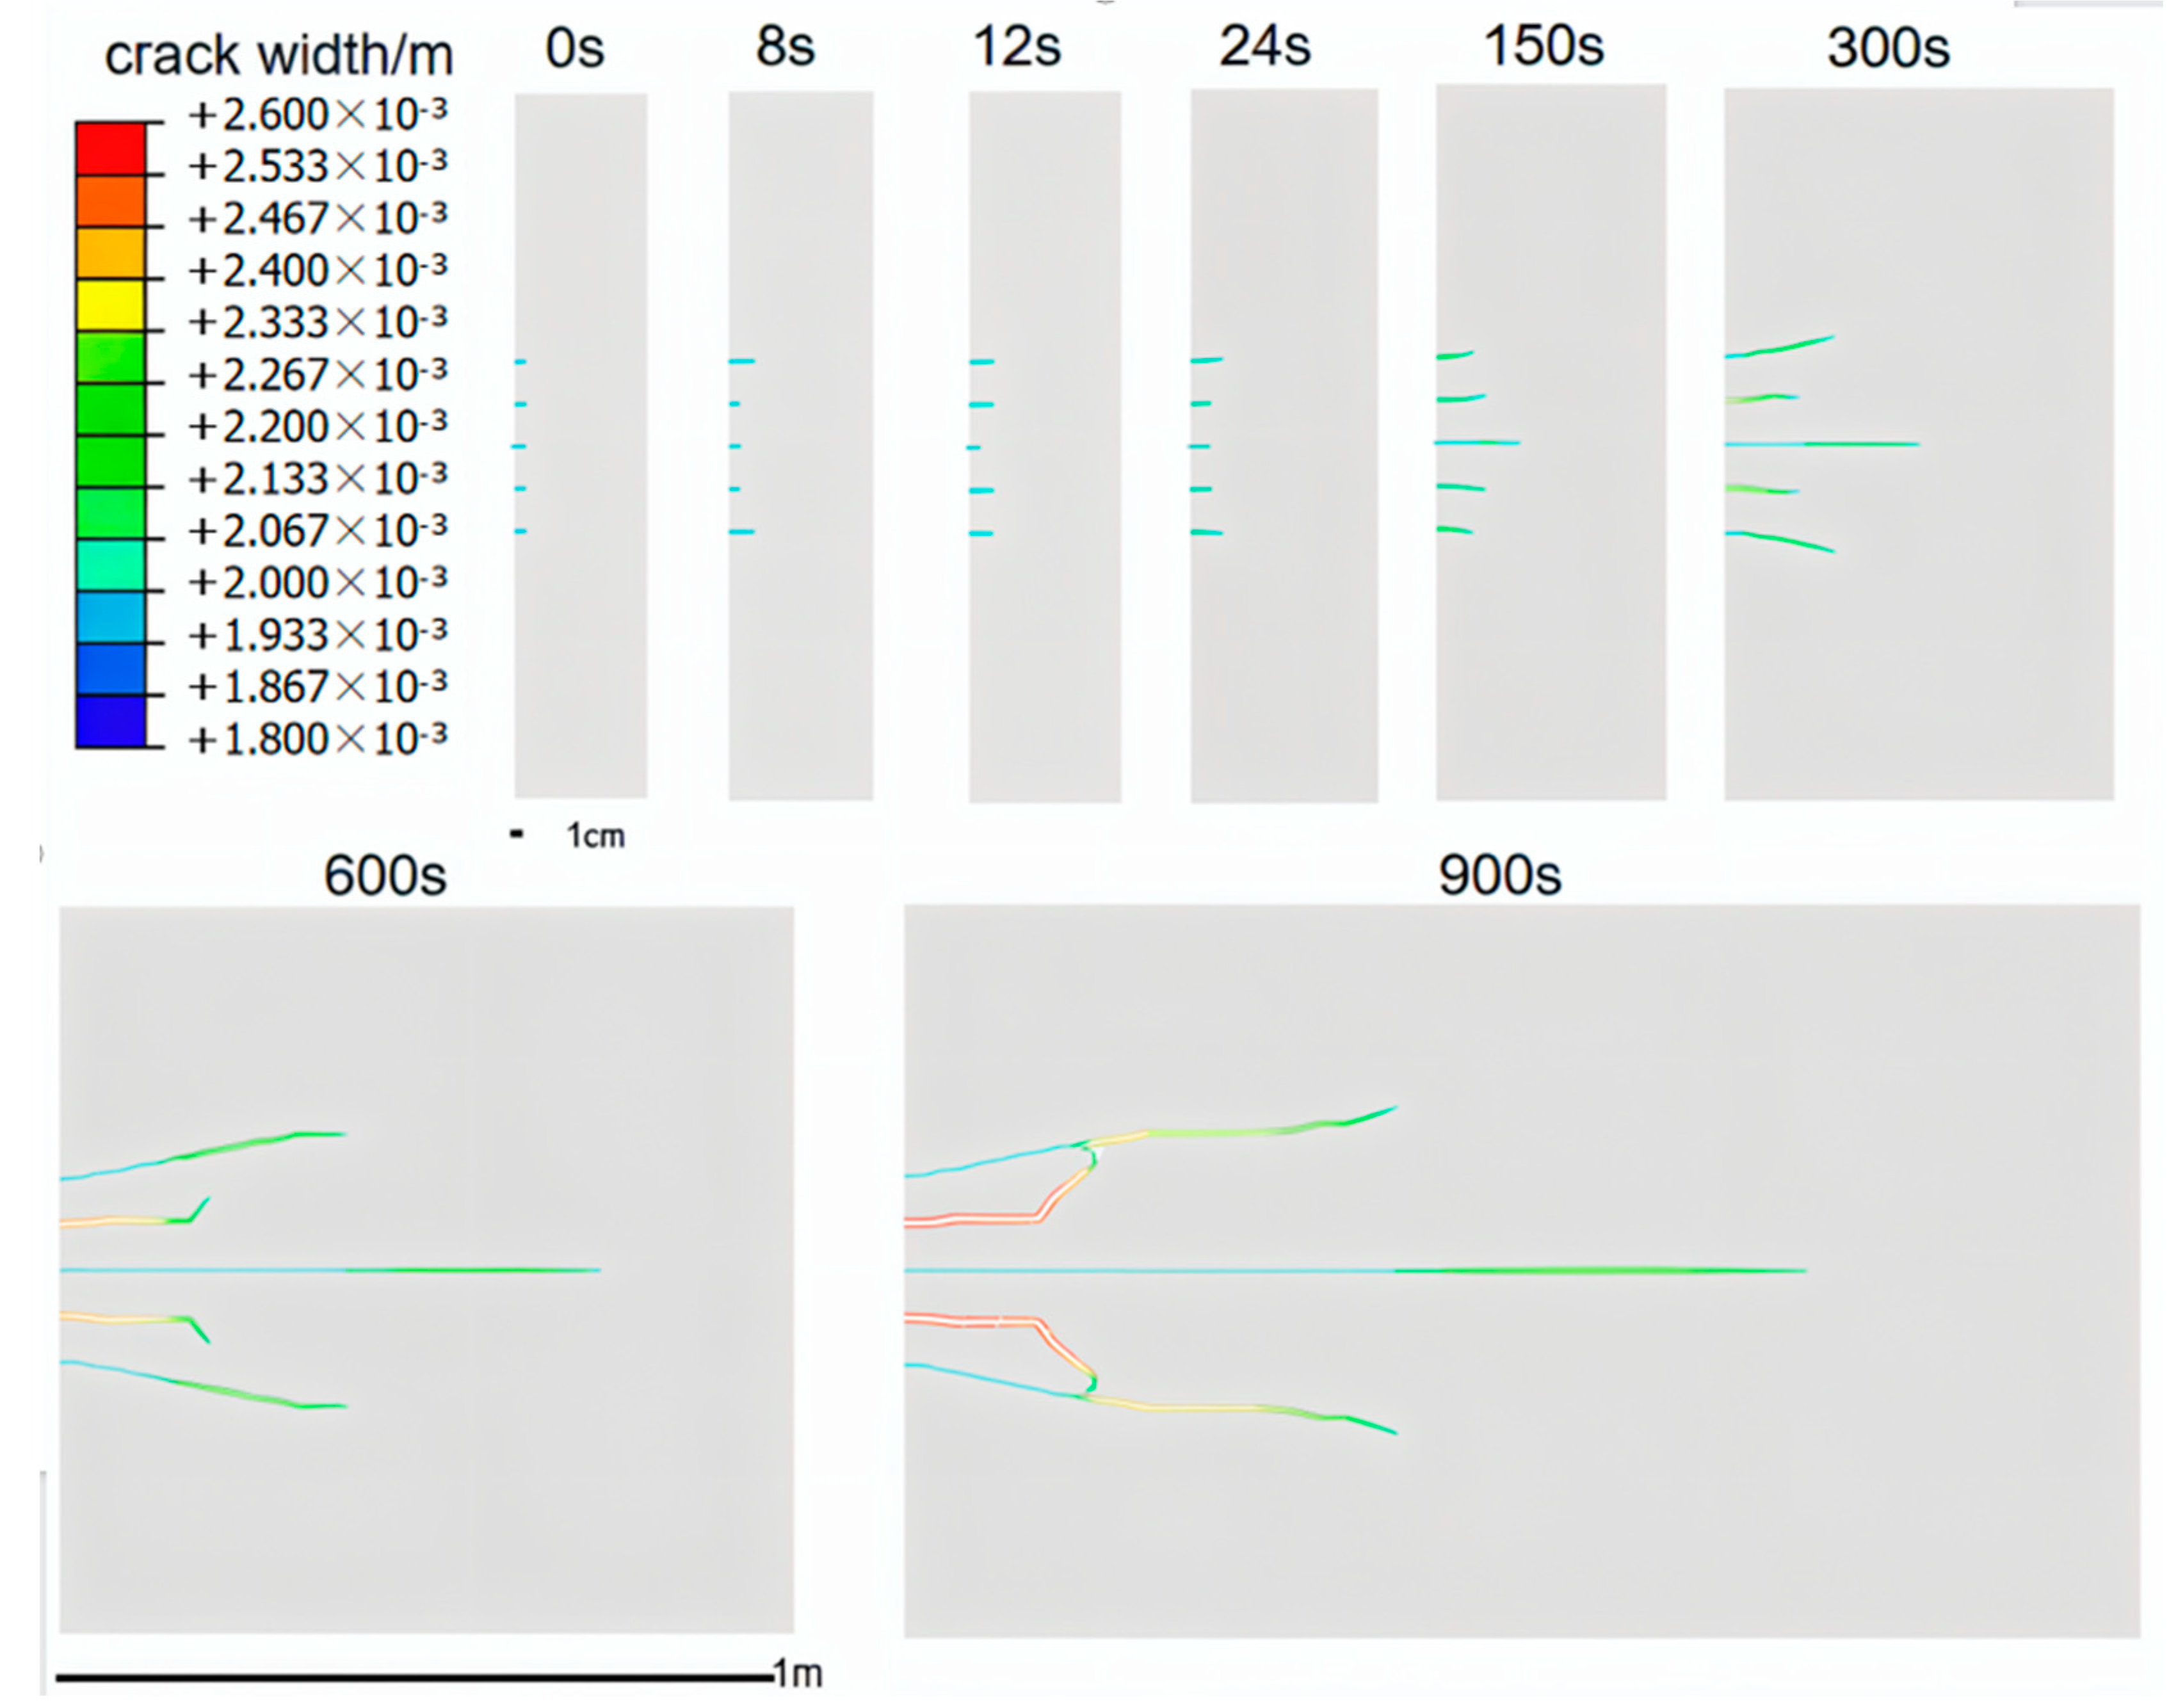
Figure 11.
Fracture initiation and propagation diagram at different time points of Scheme 5.
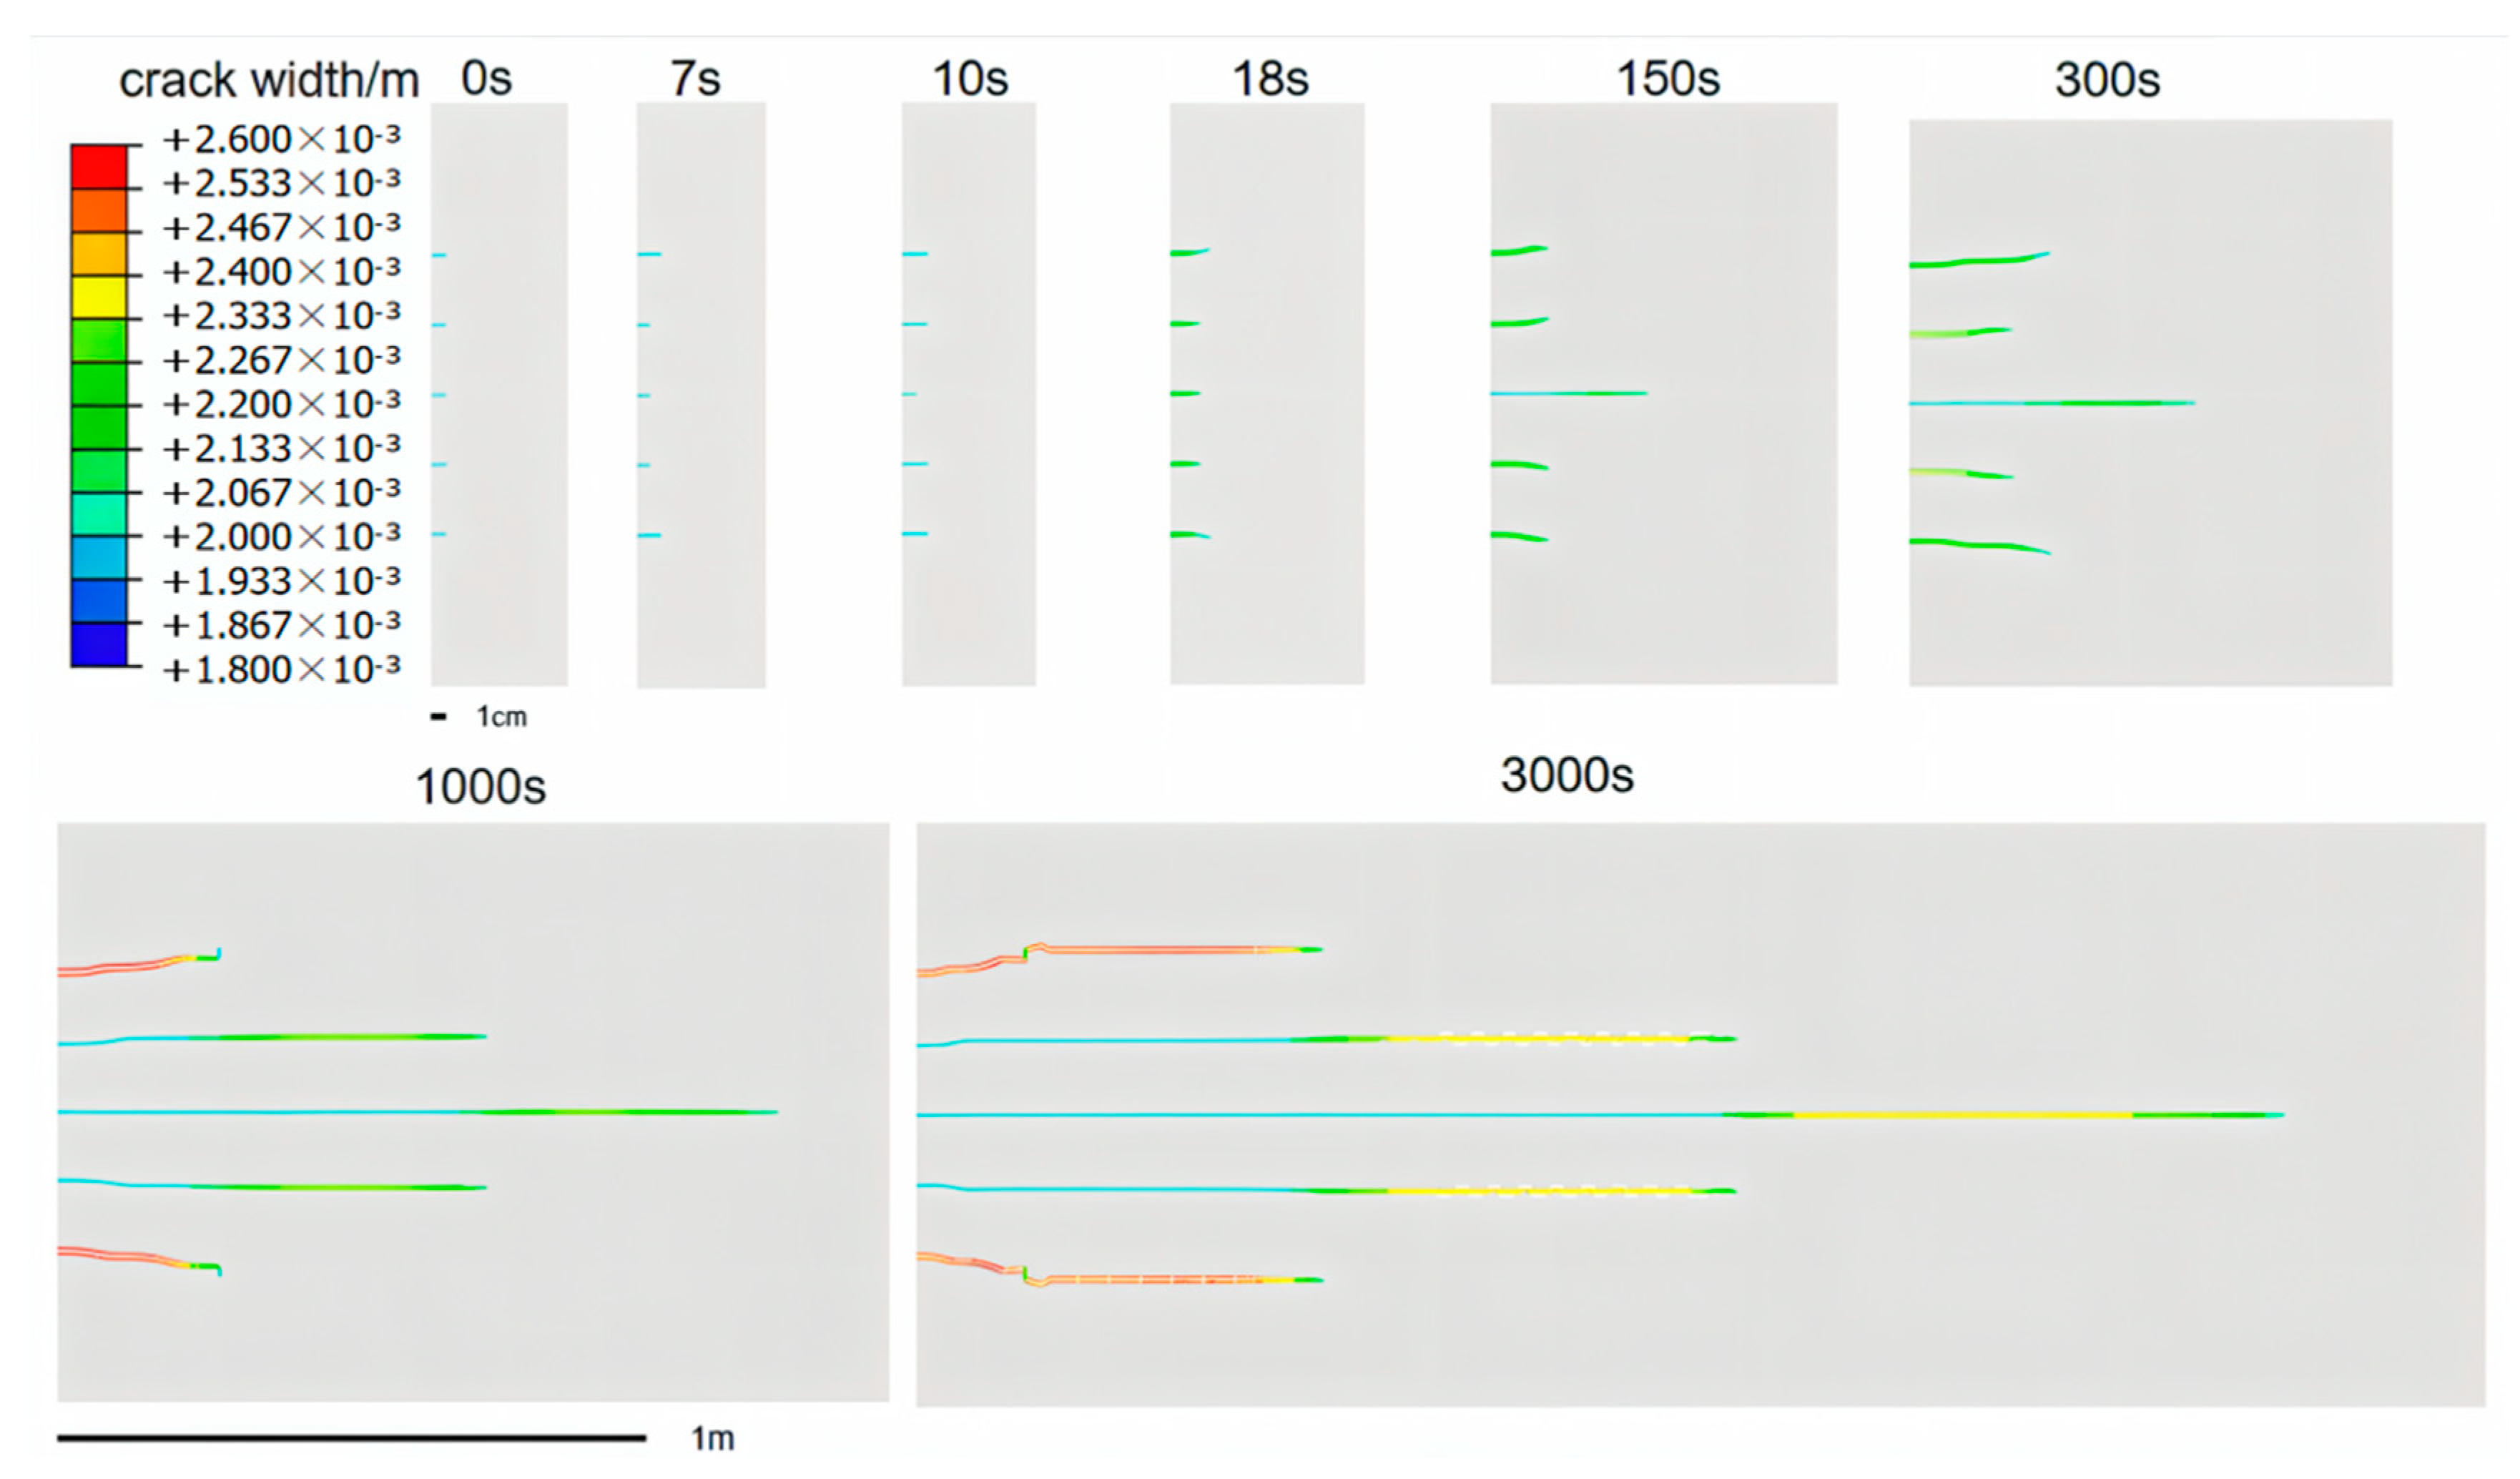
Figure 12.
Fracture initiation and propagation diagram at different time points of Scheme 6.

Figure 13.
Fracture initiation and propagation diagram at different time points of Scheme 10.
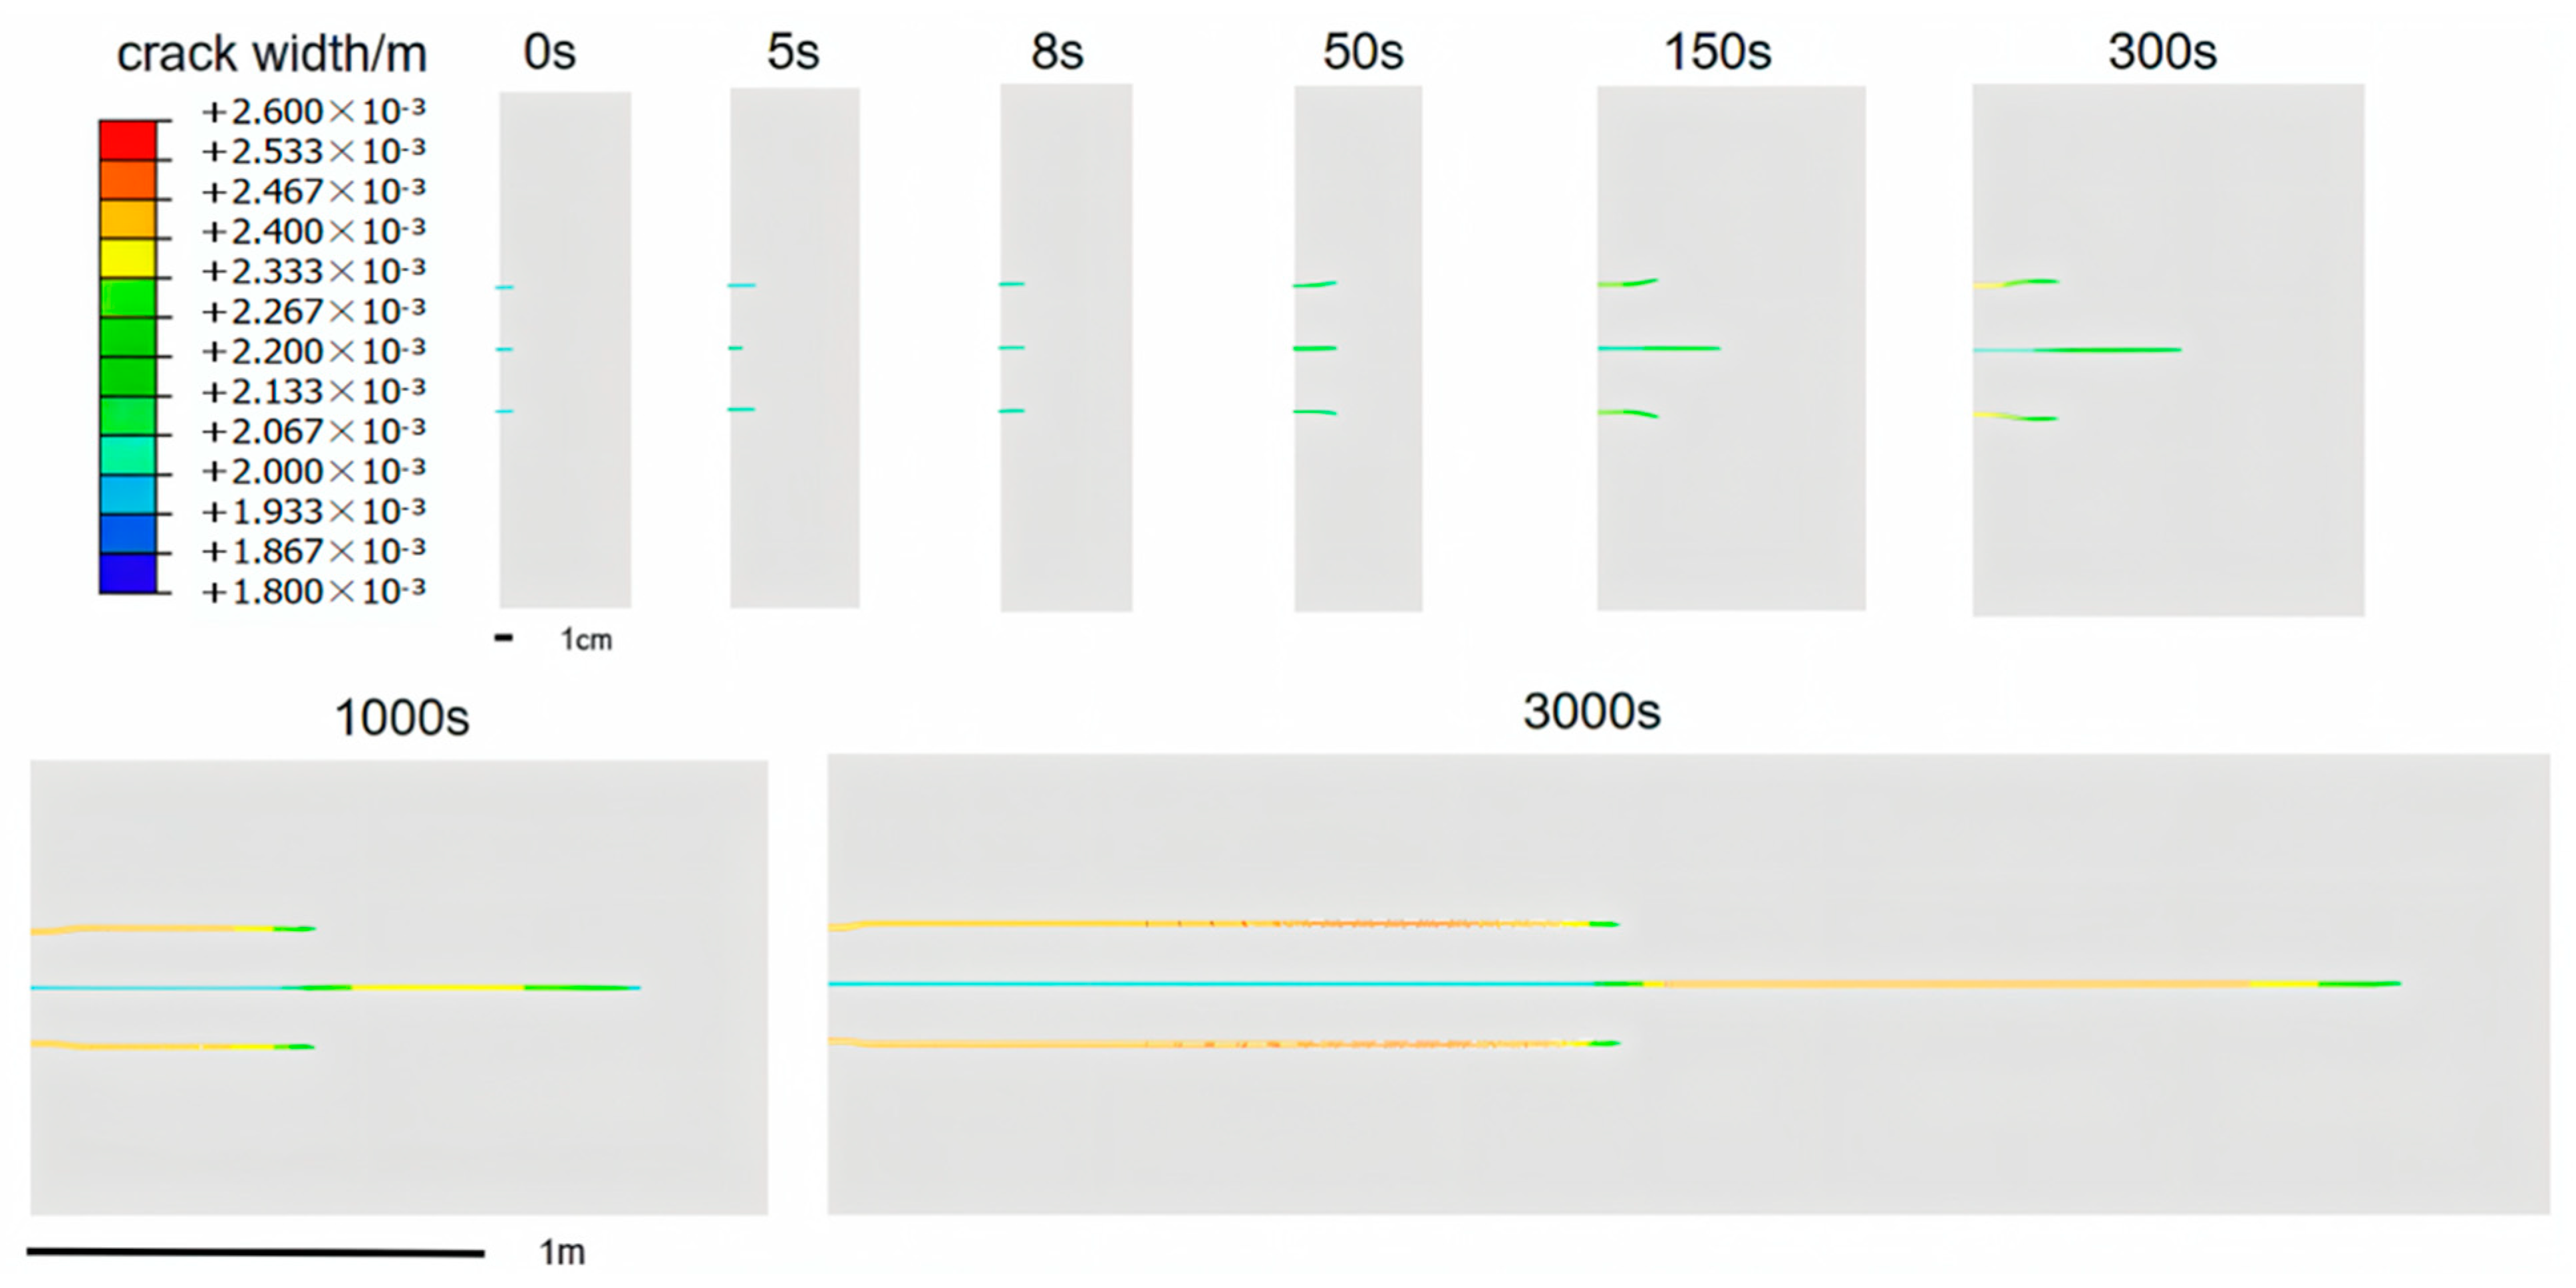
Figure 14.
Fracture initiation and propagation diagram of 5 perforations under different principal stress differences of 10 MPa (Scheme 2) and 5 MPa (Scheme 4).
Figure 14.
Fracture initiation and propagation diagram of 5 perforations under different principal stress differences of 10 MPa (Scheme 2) and 5 MPa (Scheme 4).
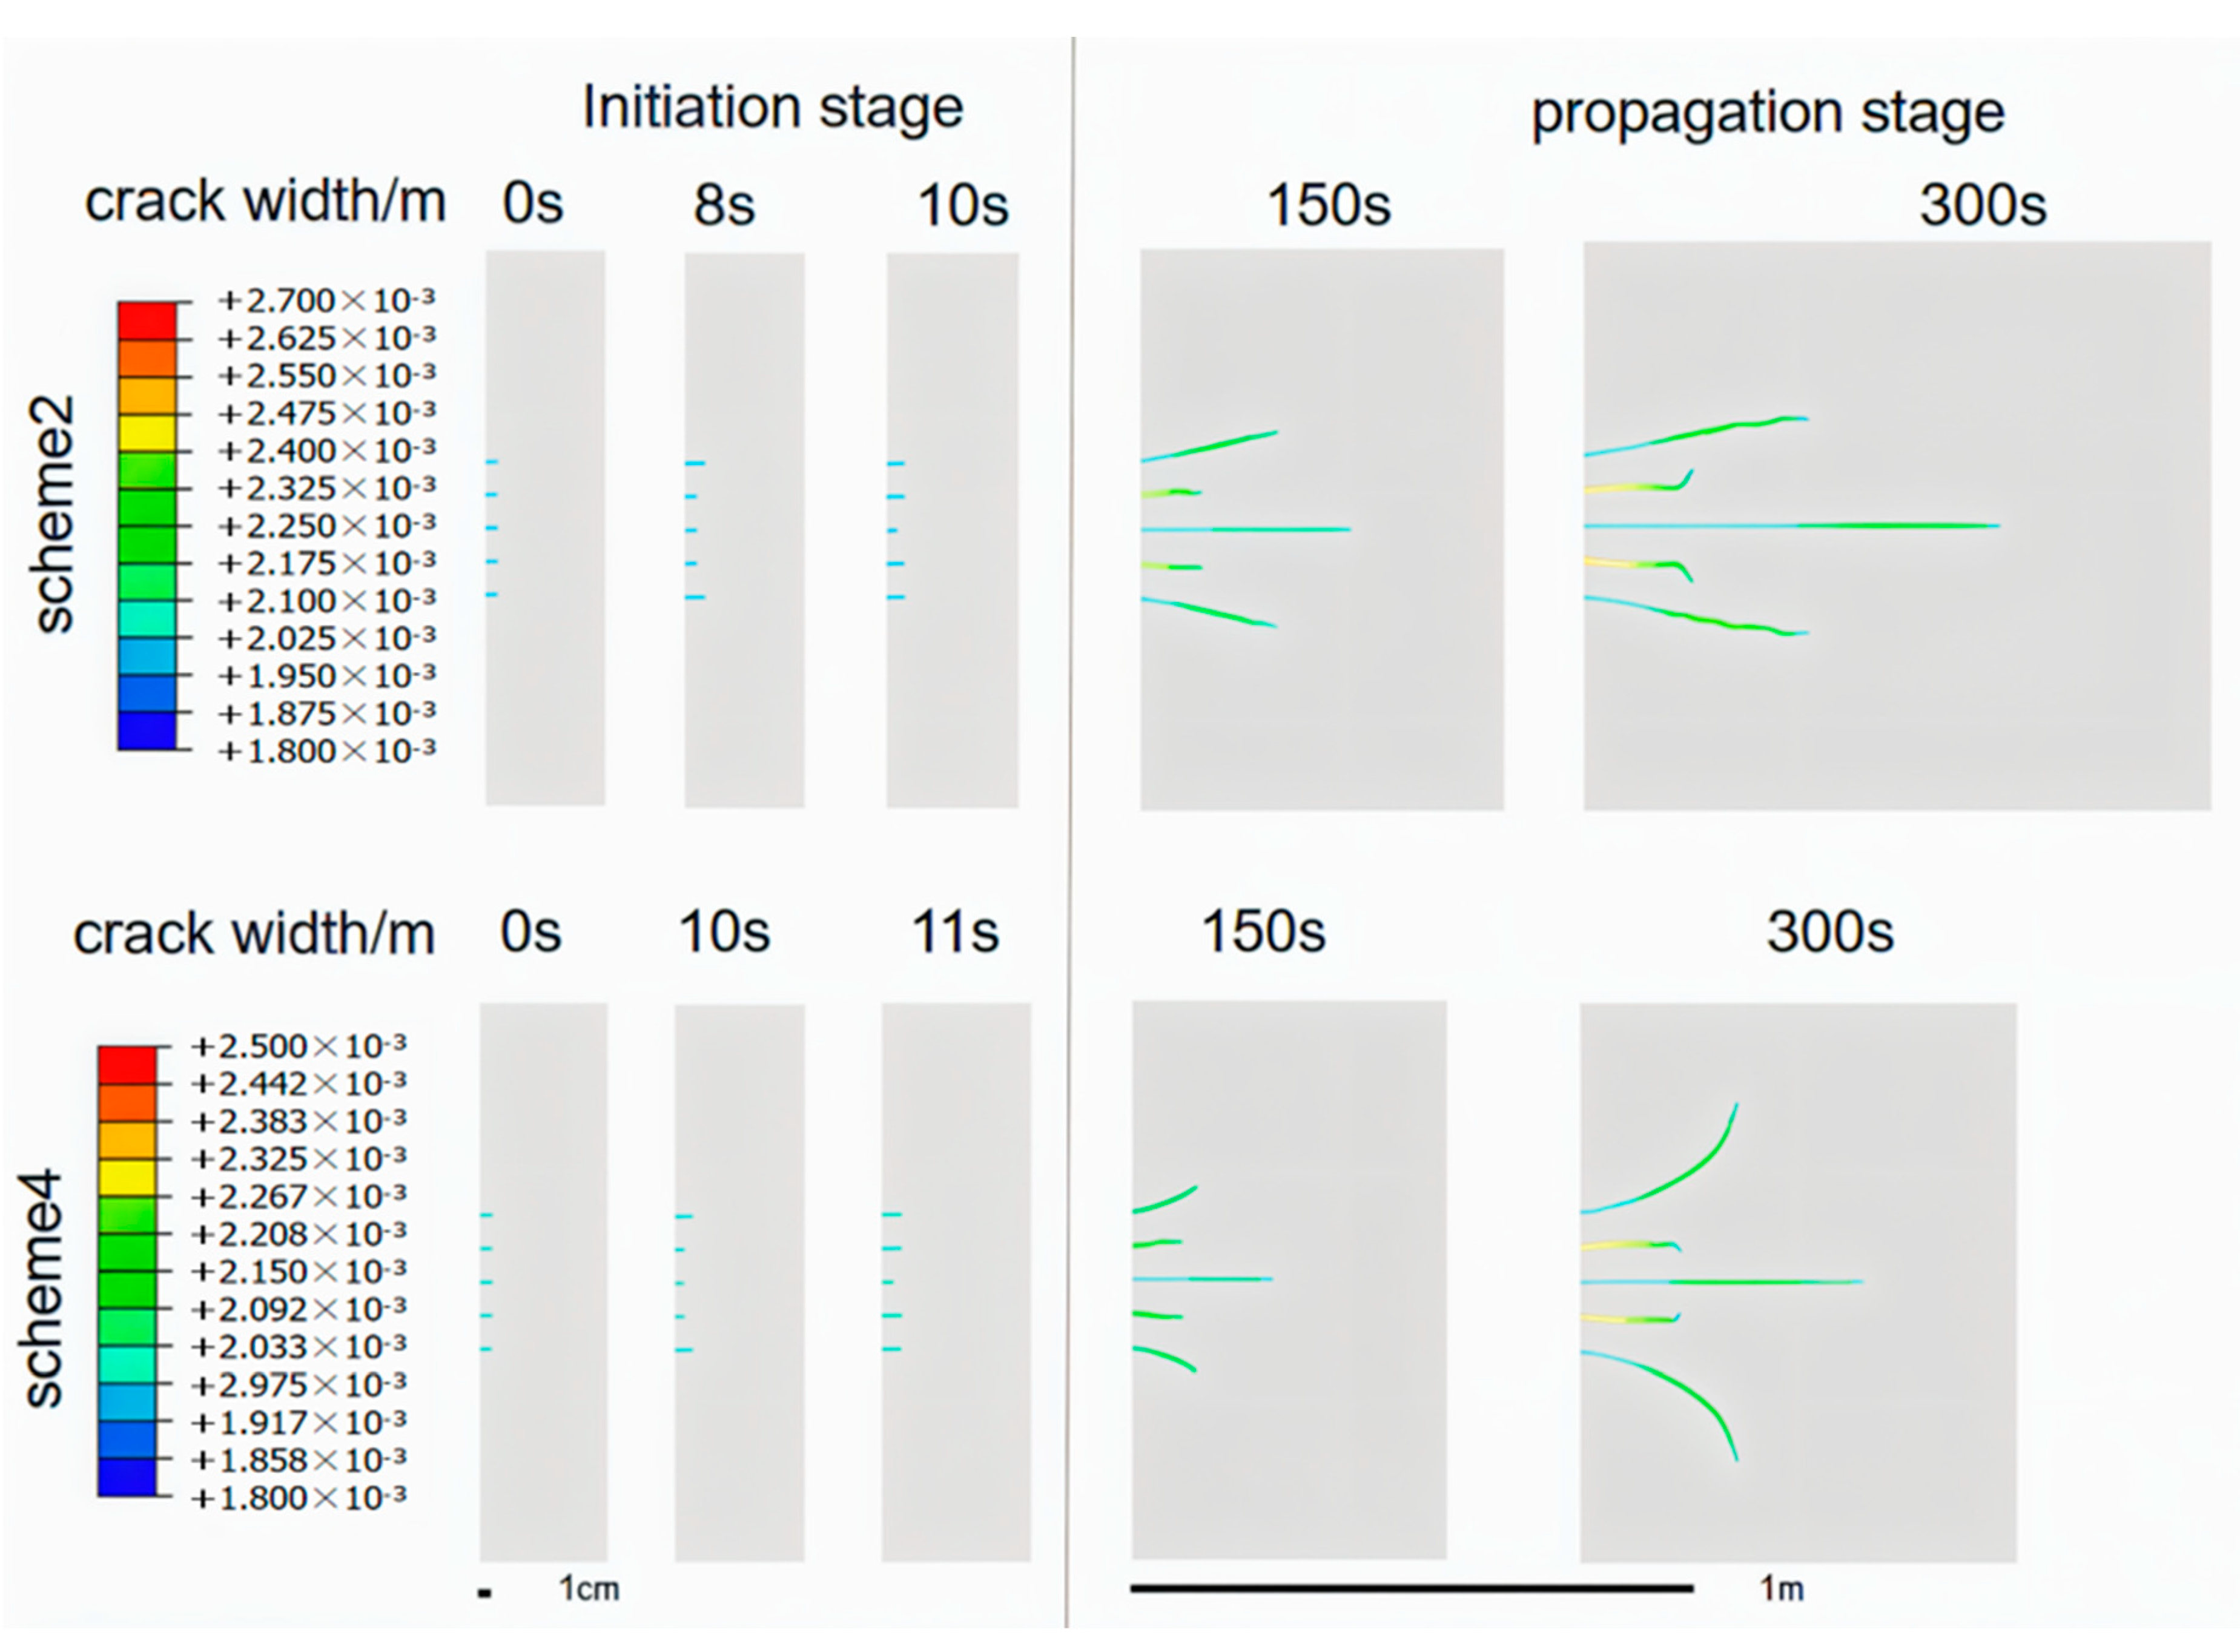
Figure 15.
Fracture initiation and propagation diagram of 3 perforations under different principal stress differences of 10 MPa (Scheme 10) and 5 MPa (Scheme 12).
Figure 15.
Fracture initiation and propagation diagram of 3 perforations under different principal stress differences of 10 MPa (Scheme 10) and 5 MPa (Scheme 12).

Figure 16.
Fracture propagation at the same time point under different injection flow rates.
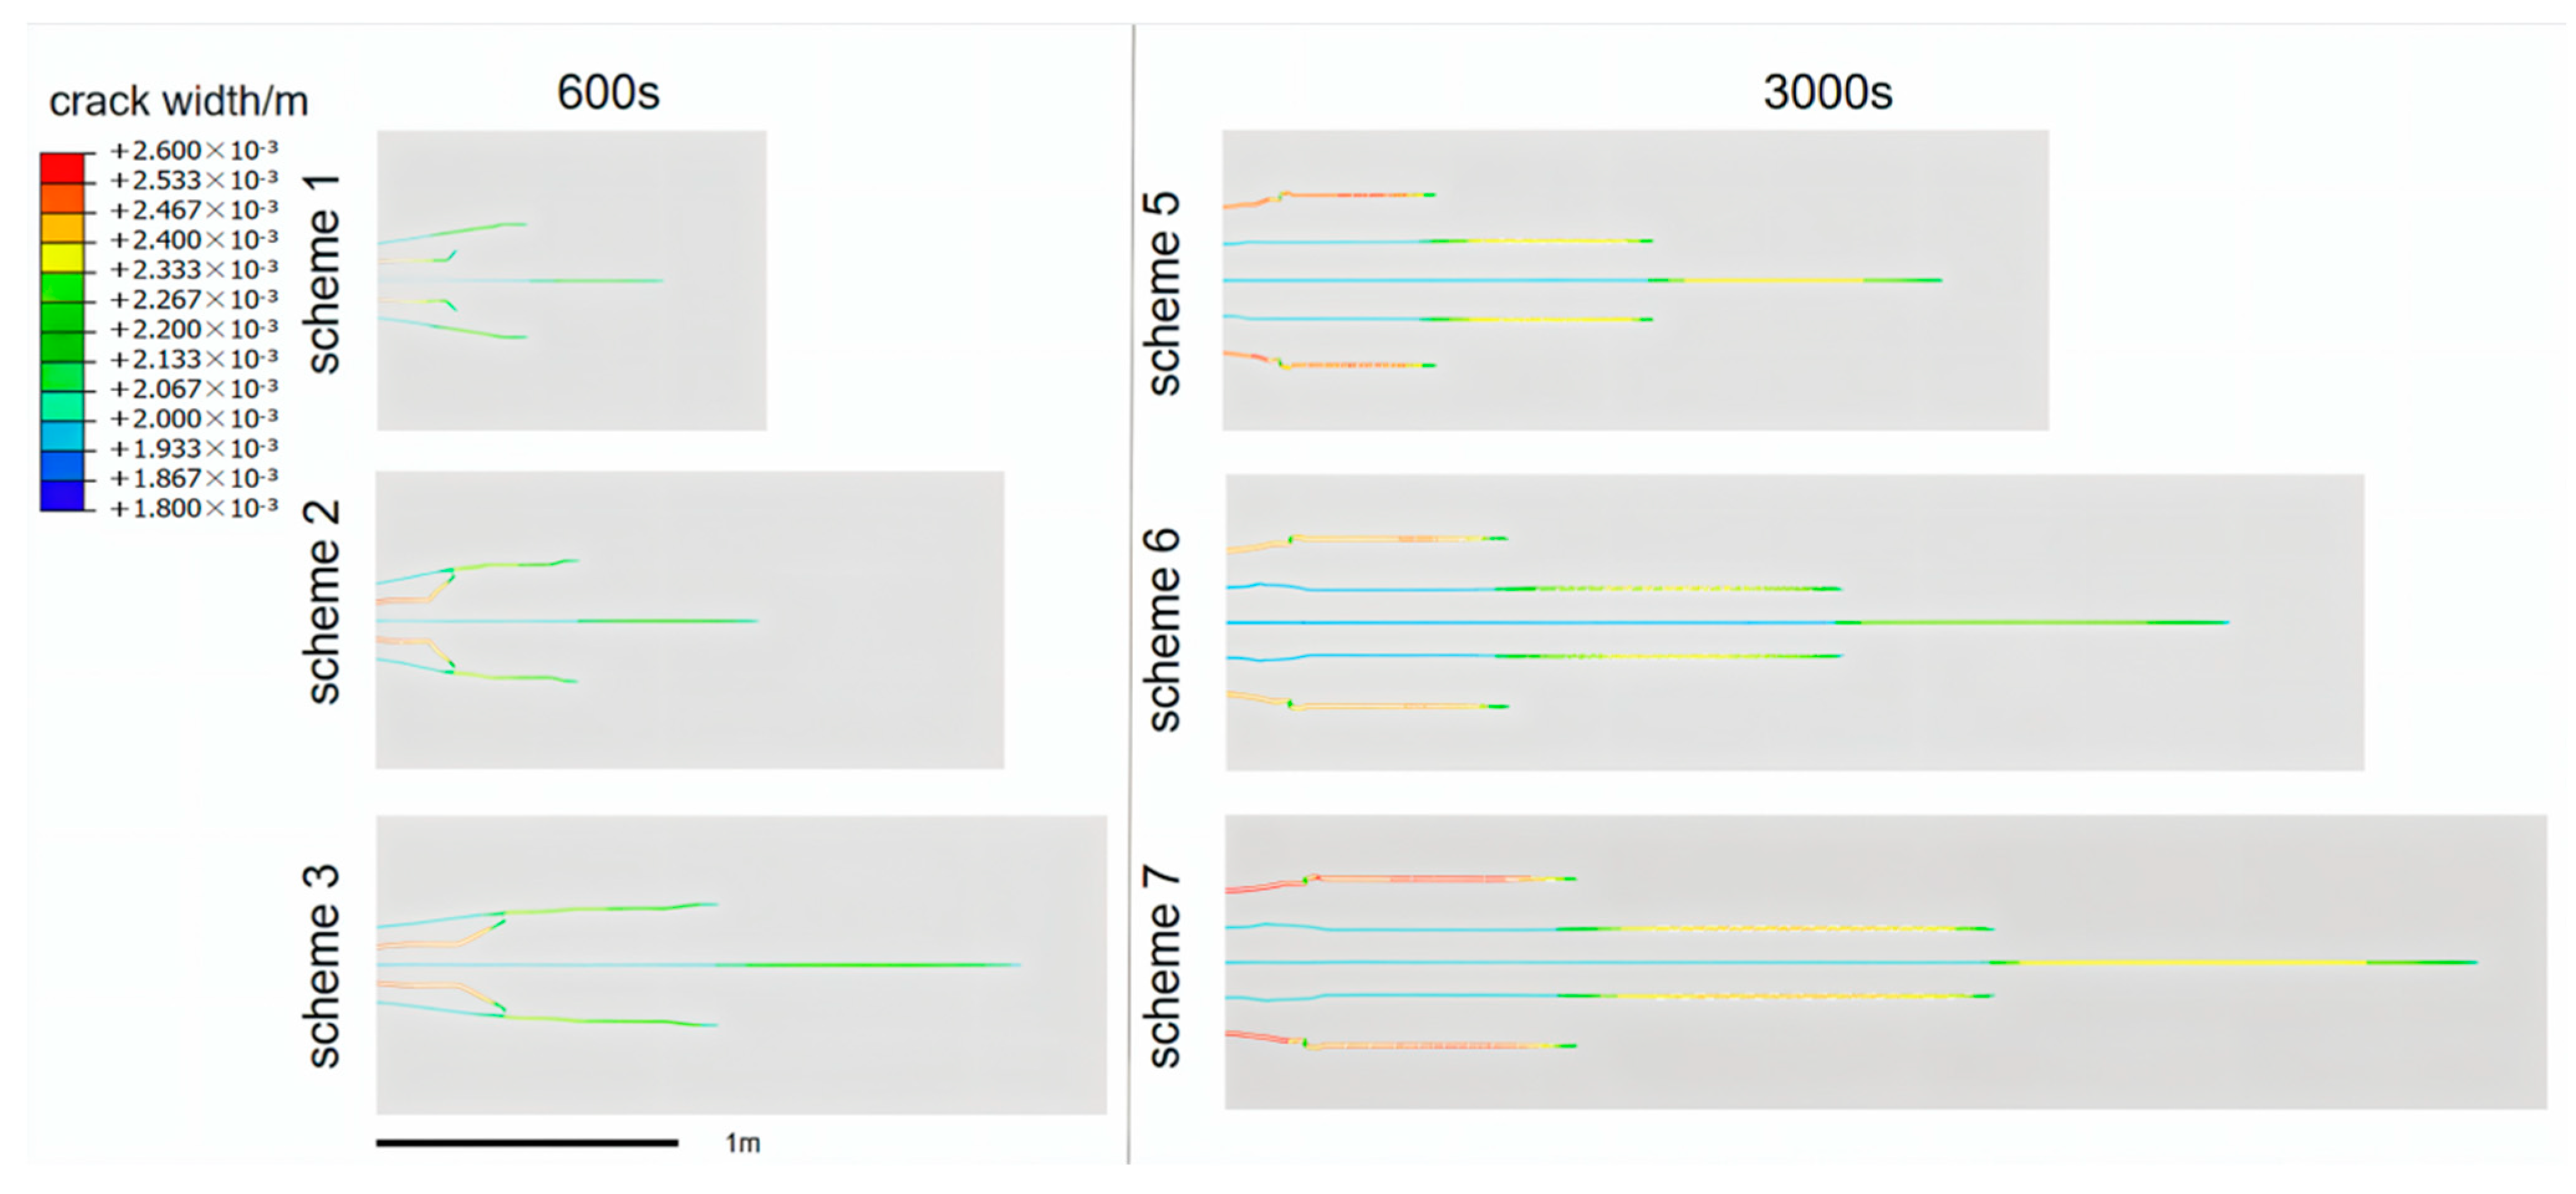
Figure 17.
Fluid pressure of the same position under different injection flow rates in Schemes 1, 2, and 3: (a) middle perforation; (b) bottom perforation.
Figure 17.
Fluid pressure of the same position under different injection flow rates in Schemes 1, 2, and 3: (a) middle perforation; (b) bottom perforation.

Figure 18.
Experimental results of crack initiation time and pressure under different flow rates.


Table 1.
Shale multi-perforation fracturing test scheme 1.
| Sample Number | Axial Pressure /MPa | Confining Pressure /MPa | Injection Flow Rate (mL/min) |
|---|---|---|---|
| S2 | 20 | 15 | 15 |
| S4 | 20 | 15 | 10 |
| S6 | 20 | 15 | 5 |
| S9 | 20 | 20 | 5 |
| S10 | 25 | 15 | 5 |
| S13 | 25 | 20 | 5 |
| S15 | 25 | 15 | 10 |
1 Samples S2~S6 were designed to study the impact of the injection flow rate. S4 was compared with S15, S6 with S10, and S9 with S13 separately. S10, S13, and S15 have a larger axial pressure in order to study the influence of principal stress on fracturing.
Table 2.
Basic mechanical parameters of samples.
| Bedding and Horizontal Angle | Elastic Modulus | Poisson’s Ratio | Tensile Strength | Porosity | Permeability |
|---|---|---|---|---|---|
| 0° | 13.3 GPa | 0.147 | 15.40 MPa | 2.12% | 6.92 × 10⁻⁴ mD |
Table 3.
The initiation time, initiation pressure of each perforation, and average initiation pressure of samples.
Table 3.
The initiation time, initiation pressure of each perforation, and average initiation pressure of samples.
| Sample | Initiation Time of Perforation 1/s | Initiation Pressure of Perforation 1/MPa | Initiation Time of Perforation 2/s | Initiation Pressure of Perforation 2/MPa | Average Initiation Pressure/MPa |
|---|---|---|---|---|---|
| S2 | 24 | 44.7 | 55 | 35.3 | 40.0 |
| S4 | 47 | 35.6 | 33 | 28.0 | 31.8 |
| S6 | 81 | 31.3 | 52 | 28.2 | 29.75 |
Table 4.
Basic parameters of the simulated reservoir.
| Parameter | Numerical Value | Parameter | Numerical Value |
|---|---|---|---|
| Density | 2600 | Porosity | 0.01 |
| Elastic modulus | 30 GPa | Fluid viscosity | 10 mPa·s |
| Poisson’s ratio | 0.22 | Leakoff coefficient | 1 × 10⁻¹² |
| Tensile strength | 2 MPa | Initial crack length | 0.01 m |
| Permeability coefficient | 1 × 10⁻⁷ m/s | Pore pressure | 20 MPa |
Table 5.
Numerical simulation design schemes.
| Scheme | Number of Perforations | Spacing/cm | Three-Dimensional Stress/MPa | Injection Flow Rate/L/min | ||
|---|---|---|---|---|---|---|
| 1 | 5 | 6 | 25 | 15 | 20 | 1 |
| 2 | 5 | 6 | 25 | 15 | 20 | 5 |
| 3 | 5 | 6 | 25 | 15 | 20 | 10 |
| 4 | 5 | 6 | 20 | 15 | 20 | 5 |
| 5 | 5 | 12 | 25 | 15 | 20 | 1 |
| 6 | 5 | 12 | 25 | 15 | 20 | 5 |
| 7 | 5 | 12 | 25 | 15 | 20 | 10 |
| 8 | 5 | 12 | 20 | 15 | 20 | 5 |
| 9 | 3 | 12 | 25 | 15 | 20 | 1 |
| 10 | 3 | 12 | 25 | 15 | 20 | 5 |
| 11 | 3 | 12 | 25 | 15 | 20 | 10 |
| 12 | 3 | 12 | 20 | 15 | 20 | 5 |
Table 6.
Basic parameters of verification models (after Chen et al. [35]).
Table 6.
Basic parameters of verification models (after Chen et al. [35]).
| Parameter | Numerical Value | Parameter | Numerical Value |
|---|---|---|---|
| Pore pressure | 30 MPa | Porosity | 0.05 |
| Elastic modulus | 23 GPa | Fluid viscosity | 0.01 mPa∙s |
| Poisson’s ratio | 0.25 | Injection rate | 1.25 |
Disclaimer/Publisher’s Note: The statements, opinions and data contained in all publications are solely those of the individual author(s) and contributor(s) and not of MDPI and/or the editor(s). MDPI and/or the editor(s) disclaim responsibility for any injury to people or property resulting from any ideas, methods, instructions or products referred to in the content. |
© 2024 by the authors. Licensee MDPI, Basel, Switzerland. This article is an open access article distributed under the terms and conditions of the Creative Commons Attribution (CC BY) license (https://creativecommons.org/licenses/by/4.0/).
Share and Cite
MDPI and ACS Style
Ding, D.; Xiong, W.; Guo, W.; Yu, H.; Wang, K. A Study on the Mechanism of Fracture Initiation and Propagation under Multi-Perforation Conditions in Hydraulic Fracturing. Processes 2024, 12, 1002. https://doi.org/10.3390/pr12051002
AMA Style
Ding D, Xiong W, Guo W, Yu H, Wang K. A Study on the Mechanism of Fracture Initiation and Propagation under Multi-Perforation Conditions in Hydraulic Fracturing. Processes. 2024; 12(5):1002. https://doi.org/10.3390/pr12051002
Chicago/Turabian StyleDing, Dongwei, Wei Xiong, Wei Guo, Haiqing Yu, and Keyuan Wang. 2024. "A Study on the Mechanism of Fracture Initiation and Propagation under Multi-Perforation Conditions in Hydraulic Fracturing" Processes 12, no. 5: 1002. https://doi.org/10.3390/pr12051002
Note that from the first issue of 2016, this journal uses article numbers instead of page numbers. See further details here.