Article

Rolling Mechanism of Launch Vehicle during the Prelaunch Phase in Sea Launch

by
Deng Wang
1,
Wenhao Xiao
1,
Jianshuai Shao
2,
Mingjun Li
1,
Yuanyang Zhao
1 and
Yi Jiang
1,*
1
School of Aerospace Engineering, Beijing Institute of Technology, Beijing 100081, China
2
China Academy of Launch Vehicle Technology, Beijing 100076, China
*
Author to whom correspondence should be addressed.
Aerospace 2024, 11(5), 399; https://doi.org/10.3390/aerospace11050399
Submission received: 18 March 2024 / Revised: 10 May 2024 / Accepted: 13 May 2024 / Published: 16 May 2024

Abstract

:
During the sea launch of a launch vehicle in low sea state, a rolling phenomenon of the launch vehicle has been observed. In rough sea conditions, launch may failure. This study utilizes dimensionality reduction-driven spatial system projection methods and virtual prototype modeling technology to reveal that the launch vehicle’s rolling is caused by differences in the motion paths of the center of mass. Additionally, during the prelaunch stage, the variation in the trajectory of the launch vehicle’s center of mass caused by the rolling and pitching motions of the transportation vessel has a significant impact on the roll motion of the launch vehicle. The motion in other degrees of freedom has minimal influence on the launch vehicle’s rolling. The minimum rocket rolling occurs when the dynamic coefficient of friction of the launchpad–launch vehicle contact is 0.05, and the dynamic coefficient of friction of the adapters and guideways is 0.4. The conclusions provide a theoretical foundation for optimizing the sea launch system and enhancing the reliability of sea launch in rough sea conditions.

1. Introduction

Sea launch represents a highly efficient and economically viable launch mode, providing substantial flexibility in the selection of launch sites and splashdown regions [1,2]. It ensures the effective mitigation of safety hazards within the flight corridors and debris fields associated with launch vehicles [3]. And it can free up valuable land launch pads for medium to heavy launches [4]. By performing a sea launch, issues related to site acquisition, space separation, population safety, and environmental dissent are reduced [5]. Consequently, extensive research and practical implementation of sea launches have been widely pursued.
Sea launch originated in the 1960s, when the United States and Italy jointly built the world’s first sea launch site—the San Marco Launch Site, completing launch missions such as space exploration satellites and scientific experiment satellites [6]. The Sea Launch Company was established in 1995, using the Zenith 3 SL launch vehicle to launch commercial satellites. Due to the debt and technical issues of the Sea Launch company, its launch work was suspended [7].
During the design phase of a sea launch and the launch process in calm sea states, rolling of the launch vehicle has been observed. Many studies [8,9,10,11] related to sea launches have observed a similar phenomenon, despite the use of different launching platforms and objectives within these research endeavors. During the prelaunch phase, which lasts for at least 5 min with the launch vehicle in an upright position, continuous minor rolling can lead to misalignment with the launchpad’s signal interfaces, resulting in the failure of launch signal transmission. In rough sea conditions, continuous rolling can cause the launch vehicle’s adapters to disengage from the arcuate segment guideway on the launch stand, causing the launch vehicle to lose its restraint, fall from the launch frame, and fail. The rolling of the launch vehicle undermines the reliability of sea launches in rough sea conditions, limiting the optimization and performance improvement of the sea launch system. Currently, launch vehicles can only be launched smoothly under calm sea conditions, and cannot fully leverage the advantages of sea launch. It is urgent to conduct in-depth research on the impact of coupled motion between transportation vessels and launch devices under wave excitation on the dynamic response of launch vehicle launch at sea [2].
Many studies [12,13,14,15,16,17,18] have indicated that the theory of multibody dynamics can be effectively applied to offshore structures, yielding precise computational results due to its mature theoretical foundation. Many scholars have conducted theoretical research on the sea launch process. Lei et al. [19] established a flexible dynamic model of a solid launch vehicle thermal launch system at sea to investigate the impact of launch time under wave excitation on the process of solid launch vehicle thermal launch. On the basis of considering six-degree-of-freedom wave excitation, the launch vehicle launch overload and launch accuracy under different ship states were compared. CAI et al. [20] modeled the wave spectrum and ship motion spectrum during the working process of a missile system, and then used Abaqus and other analysis platforms to conduct the finite element modeling of the shipborne missile system. Finally, a dynamics simulation of the missile system was carried out to obtain the kinematic characteristics of the missile during launch. Wang et al. [21] considered the strain rate of polyurethane foam in the adapter model in a sea launch, establishing, respectively, the dynamic models of the sea launch system with and without adapter strain rate effect for comparative analysis. Pang et al. [22] presented a test method for evaluating the impact response of a seaborne transportation vessel, provided reference data for the structural anti-impact design of seaborne launch systems. Dong et al. [8] established the dynamic models of the warship and its vertical launching system by finite element method, and then studied the influence of ship motion on the attitude parameters of the missiles exiting the silo under a high wave level, ascertaining that the best launch time should be when the ship is in the equilibrium position. Su et al. [23] studied the cooling effect of seawater spraying on the offshore launching platform used by the launch vehicle at different takeoff heights. The study indicated that during the launch of a sea-based launch vehicle, the transportation vessel’s cooling can be achieved through the pumping and spraying of seawater, with the rate of water spray being optimally adjusted based on the launch vehicle’s takeoff altitude to ensure maximum cooling efficiency. Mu et al. [24] proposes a high-precision initial alignment method suitable for maritime launches, based on the optimal combination of anti-sway coarse alignment, retrograde navigation, and reverse Kalman filtering tailored to the characteristics of the marine environment. Xu et al. [25] analyzed the motion performance of satellite launching platform with four different shapes of pontoons. Kong et al. [26] developed a methodology for quantitative risk assessment on hydrogen leak hazards from offshore rocket launching platforms during their filling process. Pua et al. [27] simulated the impact of hydrogen combustion following a hydrogen leak accident on offshore launch platforms and the preventive effect of protective walls, demonstrating that wall design can effectively protect rockets from combustion impacts. Xiong et al. [28] studied the influence of initial crack length and initial tilt angle on fatigue crack propagation on the lower surface of rocket deflector channels of offshore rocket launch platforms using the Extended Finite Element Method (XFEM). Yu et al. [29] indicated that launch vehicle lateral eccentricity during launch can induce significant rolling motion in the platform. In practical offshore launch applications, substantial rolling motion of the launch platform can affect the rocket’s motion attitude during the launch process. Liu et al. [30] pointed out that during offshore launches, the most crucial aspect is controlling the motion of the launch platform to reduce environmental loads acting on the rocket. However, the above studies did not provide a detailed analysis of the launch vehicle rolling mechanism, which poses a threat to the safety of launch vehicle launch under rough sea state and greatly limits the improvement of a launch vehicle’s sea launch capabilities.
The actual sea launch system for launch vehicles is highly complex. The transportation vessel constantly rocks, and factors such as the contact between the adapters and the guideway, whether the bottom of the launch vehicle contacts the launch pad, and the magnitude and direction of the contact load are constantly changing. The combined effect of these factors is nonlinear and coupled, making it difficult to analyze the underlying mechanics of the motion response. Although three-dimensional simulation analysis can provide intuitive insight into the system’s response characteristics and analyze influencing factors, it may not provide a clear understanding of the mechanism behind the rolling formation. Therefore, employing a spatial system projection method driven by dimensionality reduction to study the rolling mechanism.
In this article, we mainly study the mechanism of the launch vehicle rolling phenomenon in the prelaunch stage at sea launch. The main contributions of the current work are summarized as follows.
  • Using a dimensionality reduction-driven spatial system projection method, we analyze the rolling mechanism of the prelaunch stage launch vehicle driven by two degrees of freedom in sea launch;
  • To establish a multibody dynamics model of the prelaunch stage launch vehicle’s rolling, we utilize a simulation driven by the two degrees of freedom of the transportation vessel’s rolling and pitching. This will be employed to validate the rolling mechanism of the launch vehicle;
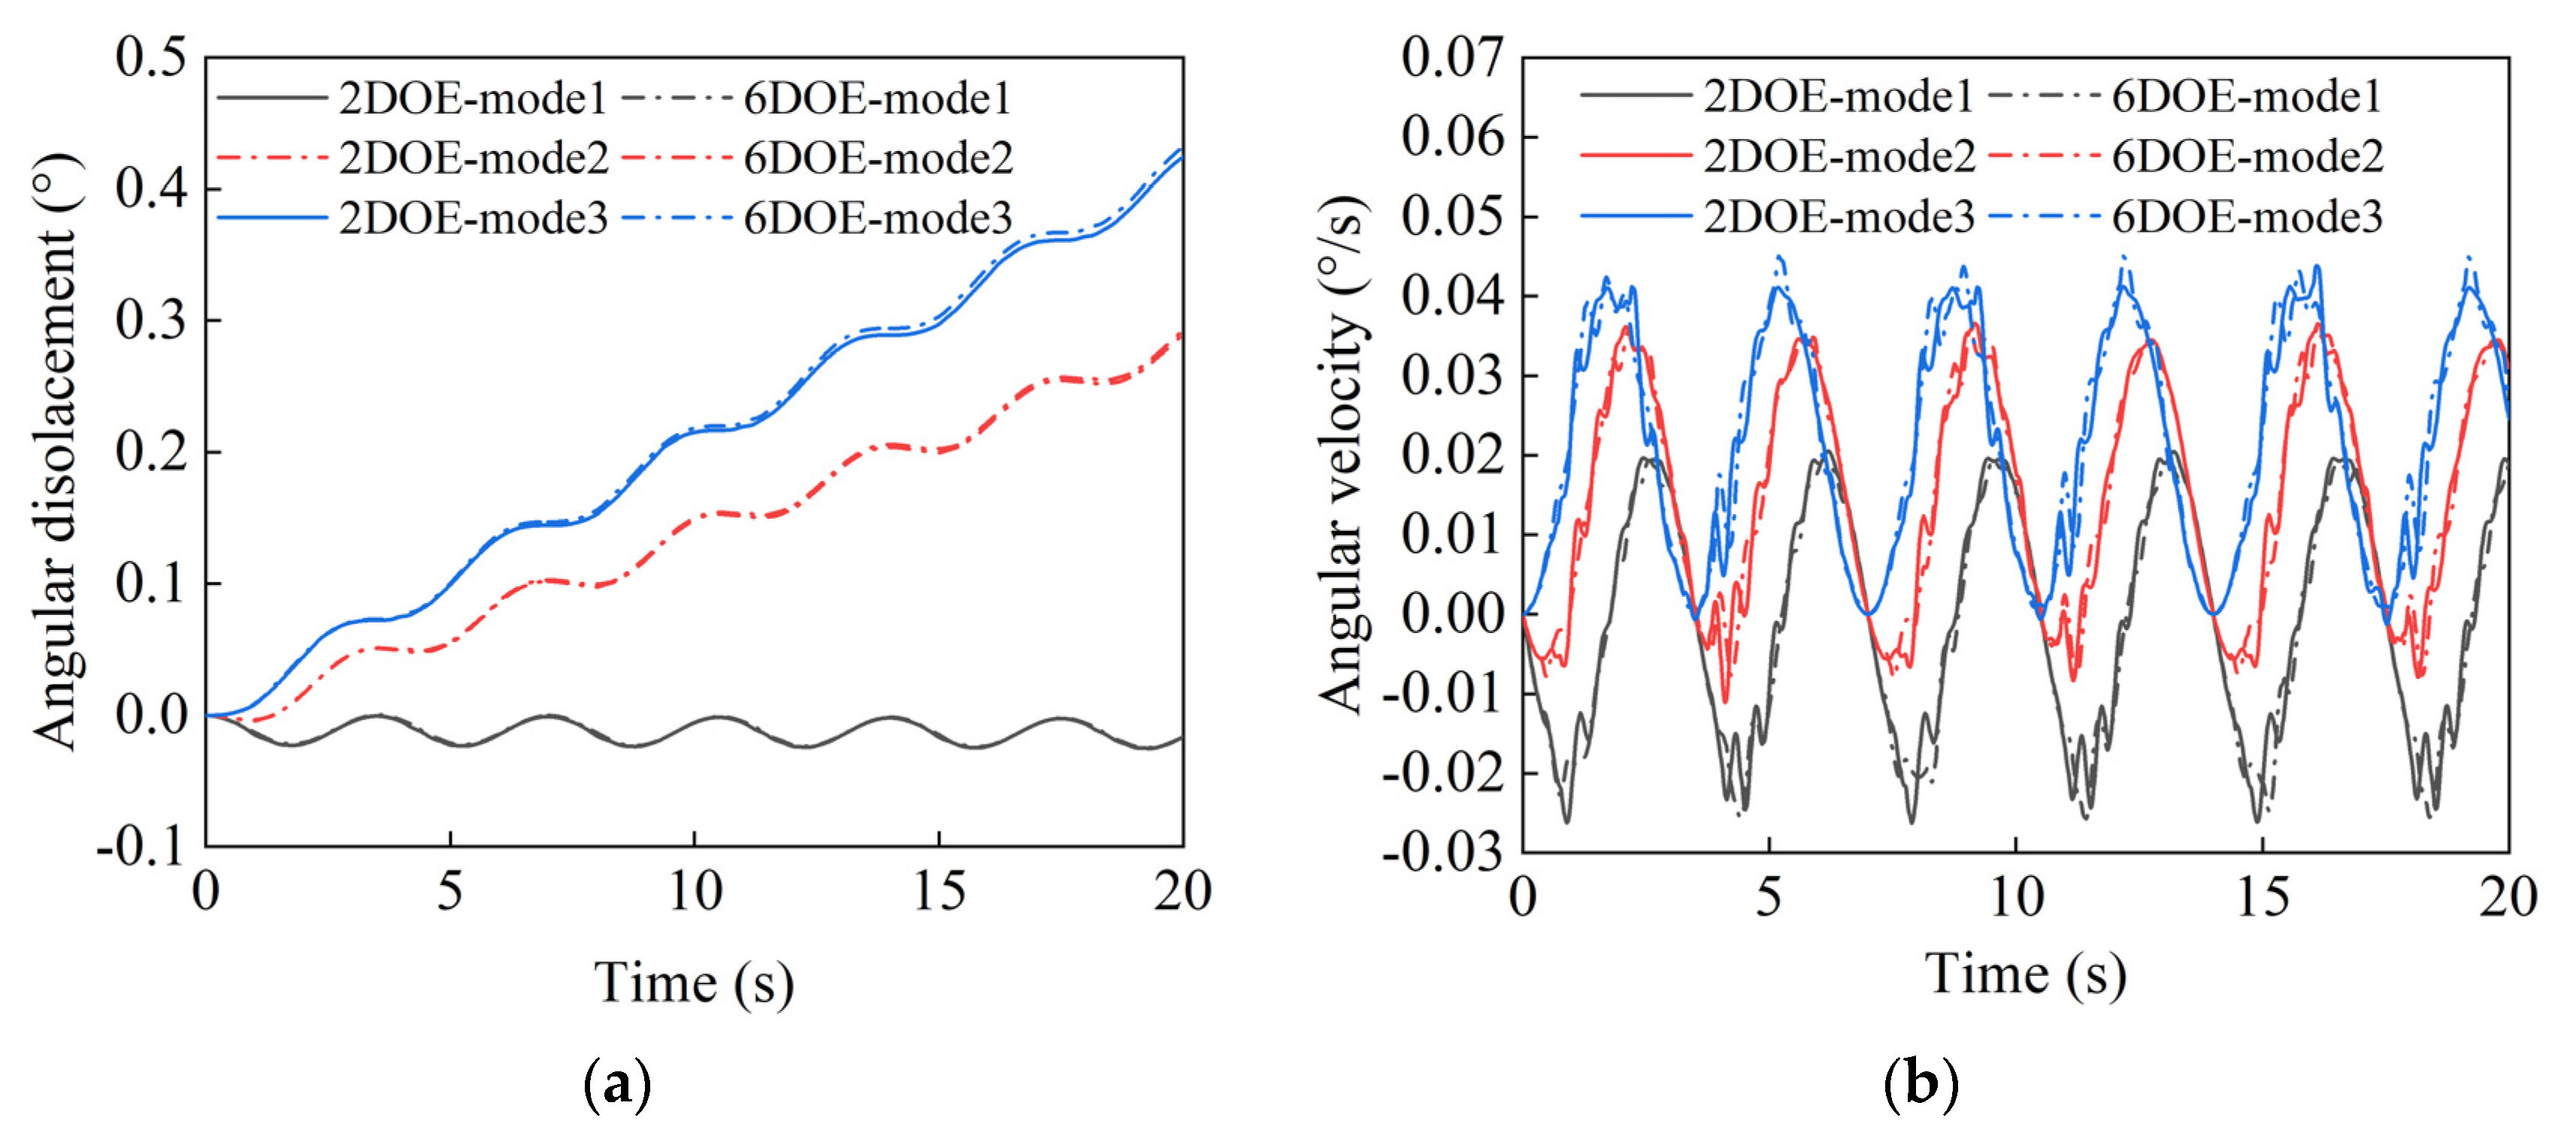
  • By comparing the simulation driven by six-degree-of-freedom motion and two-degree-of-freedom motion of the transportation vessel, we analyze the impact of transportation vessel’s motion on launch vehicle’s rolling;
  • Through a response surface analysis, we examine the influence of the friction coefficients between the launchpad and launch vehicle and between the adapters and guideways on the launch vehicle’s rolling.

2. Framed Sea Launch System

The framed sea launch system consists of a launch vehicle, a frame launcher, a launchpad, a support platform, lifting cylinders, adapters, and a transportation vessel, as shown in Figure 1a. The frame launcher includes front connecting plates, rear connecting plates, adapter guideways, and a lifting bracket, as shown in Figure 1b. There are many adapters arranged at equal intervals on the launch vehicle. The launch vehicle is equipped with three groups of adapters aligned along its axial direction, from top to bottom, with each group comprising four adapters arranged circumferentially. The layout of the adapters are shown in Figure 1c.
Upon completion of the erection action by the lifting cylinders, the framed sea launch system enters the vertical prelaunch phase. Subsequently, the lifting cylinder remains in a securely locked state. The support platform and launchpad are fixed to transportation. The launch vehicle stands on the launchpad, with eight rivets on the launchpad’s surface inserted into eight corresponding grooves on the bottom of the launch vehicle, constraining the launch vehicle’s horizontal plane motion relative to the launchpad. Adapters distributed on the surface of the launch vehicle press against the guideways, restraining the launch vehicle through friction and normal force.
Figure 2a shows the displacement testing sensor installed on the top of the frame launcher. Figure 2b shows the rolling angles of the launch vehicle in the launch simulation and practical launch mission. In the preliminary simulation phase of launch vehicle development, engineers observed periodic rolling tendencies during the prelaunch stage when employing a framed sea launch system. During the launch phase, the launch vehicle would initially roll and then rotate back. In order to ensure proper docking of the launch signal interface during the prelaunch phase and to ensure the normal launch of the launch vehicle, rivet constraints were implemented at the launchpad–launch vehicle interface. Thus, in practical low-sea state launch missions, the launch vehicle did not roll during the prelaunch phase. Significantly, it should be noted that during the launch phase, the launch vehicle exhibited the phenomenon of rolling and then rotating back. This is consistent with the results predicted by the research and development simulation, confirming the reality of the rolling phenomenon during the prelaunch phase of the launch vehicle at sea.
During the prelaunch phase in calm sea states, the rivets can effectively restrict the relative horizontal motion of the launch vehicle. However, in rough sea conditions, the limiting effect of the rivets becomes unreliable. Moreover, high-intensity rigid loads can damage the rivets and the bottom structure of the launch vehicle. Hence, understanding the rolling mechanism of the launch vehicle during the vertical prelaunch phase is particularly crucial, laying the foundation for subsequent research on methods to suppress launch vehicle’s rolling.

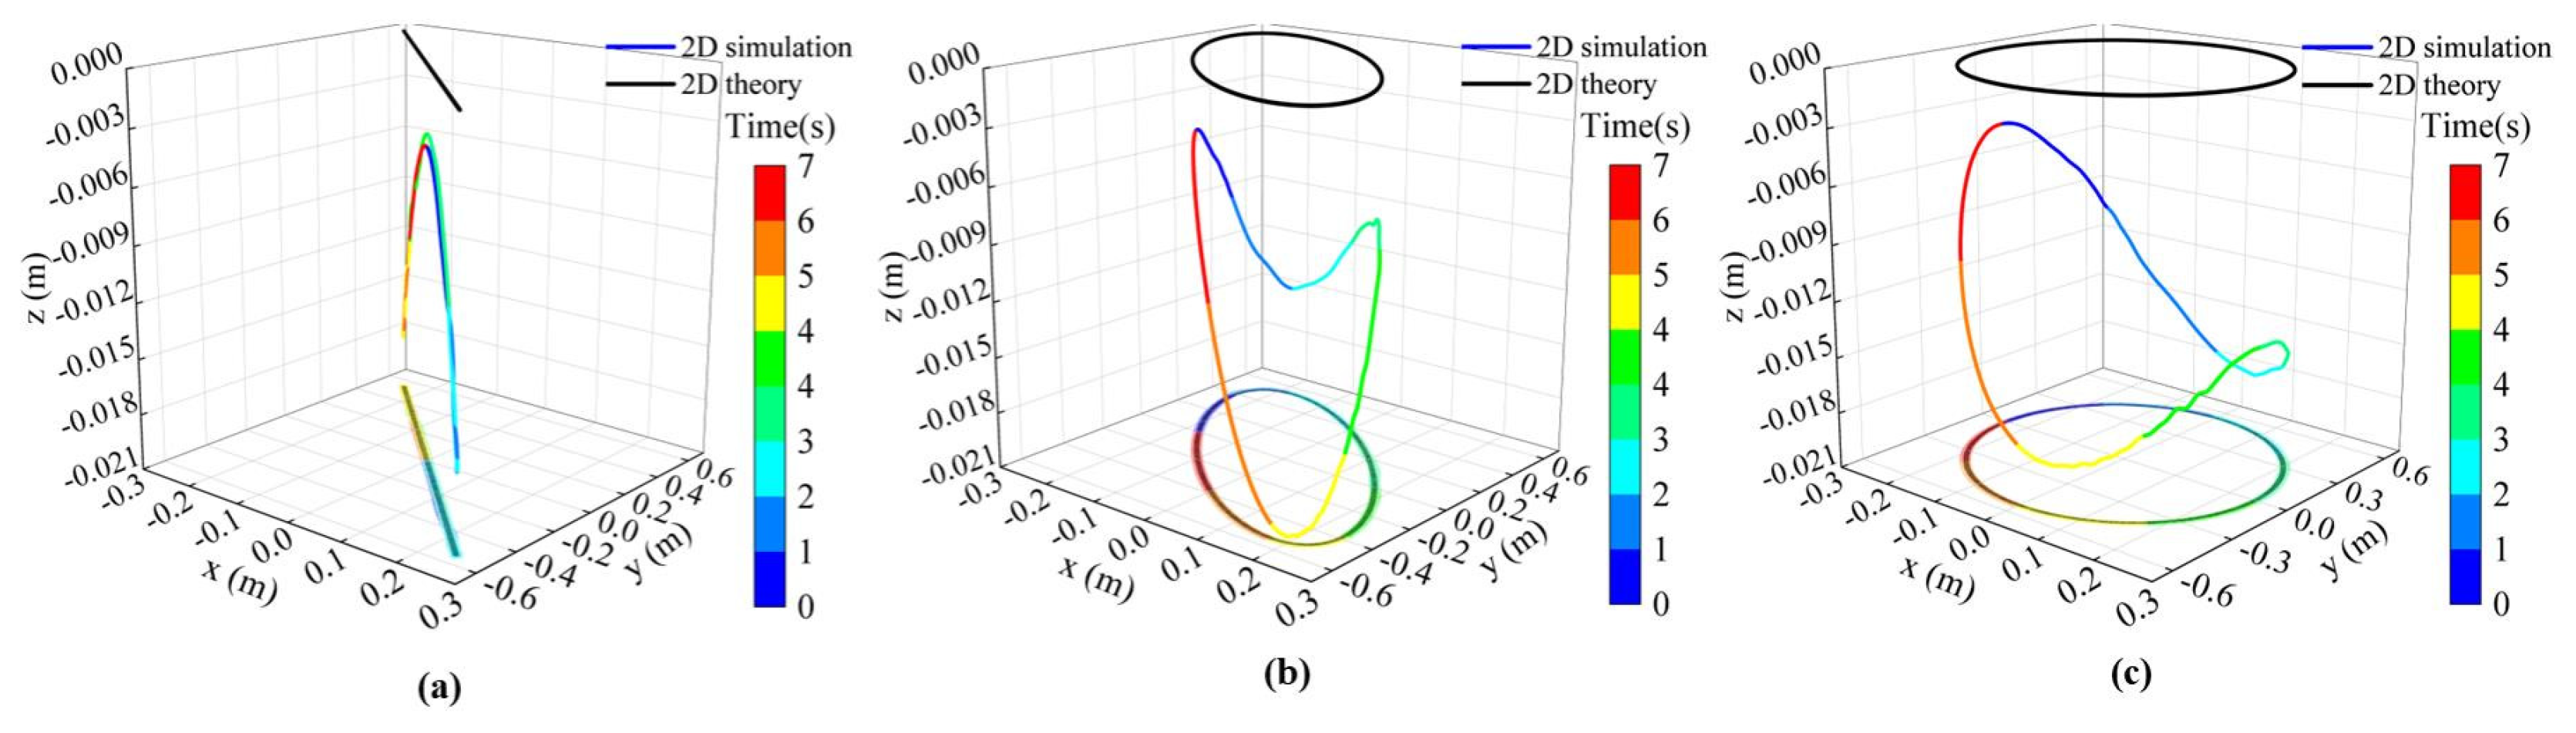
3. Rolling Analysis of 2-D-Driven Sea-Based Launch Vehicle

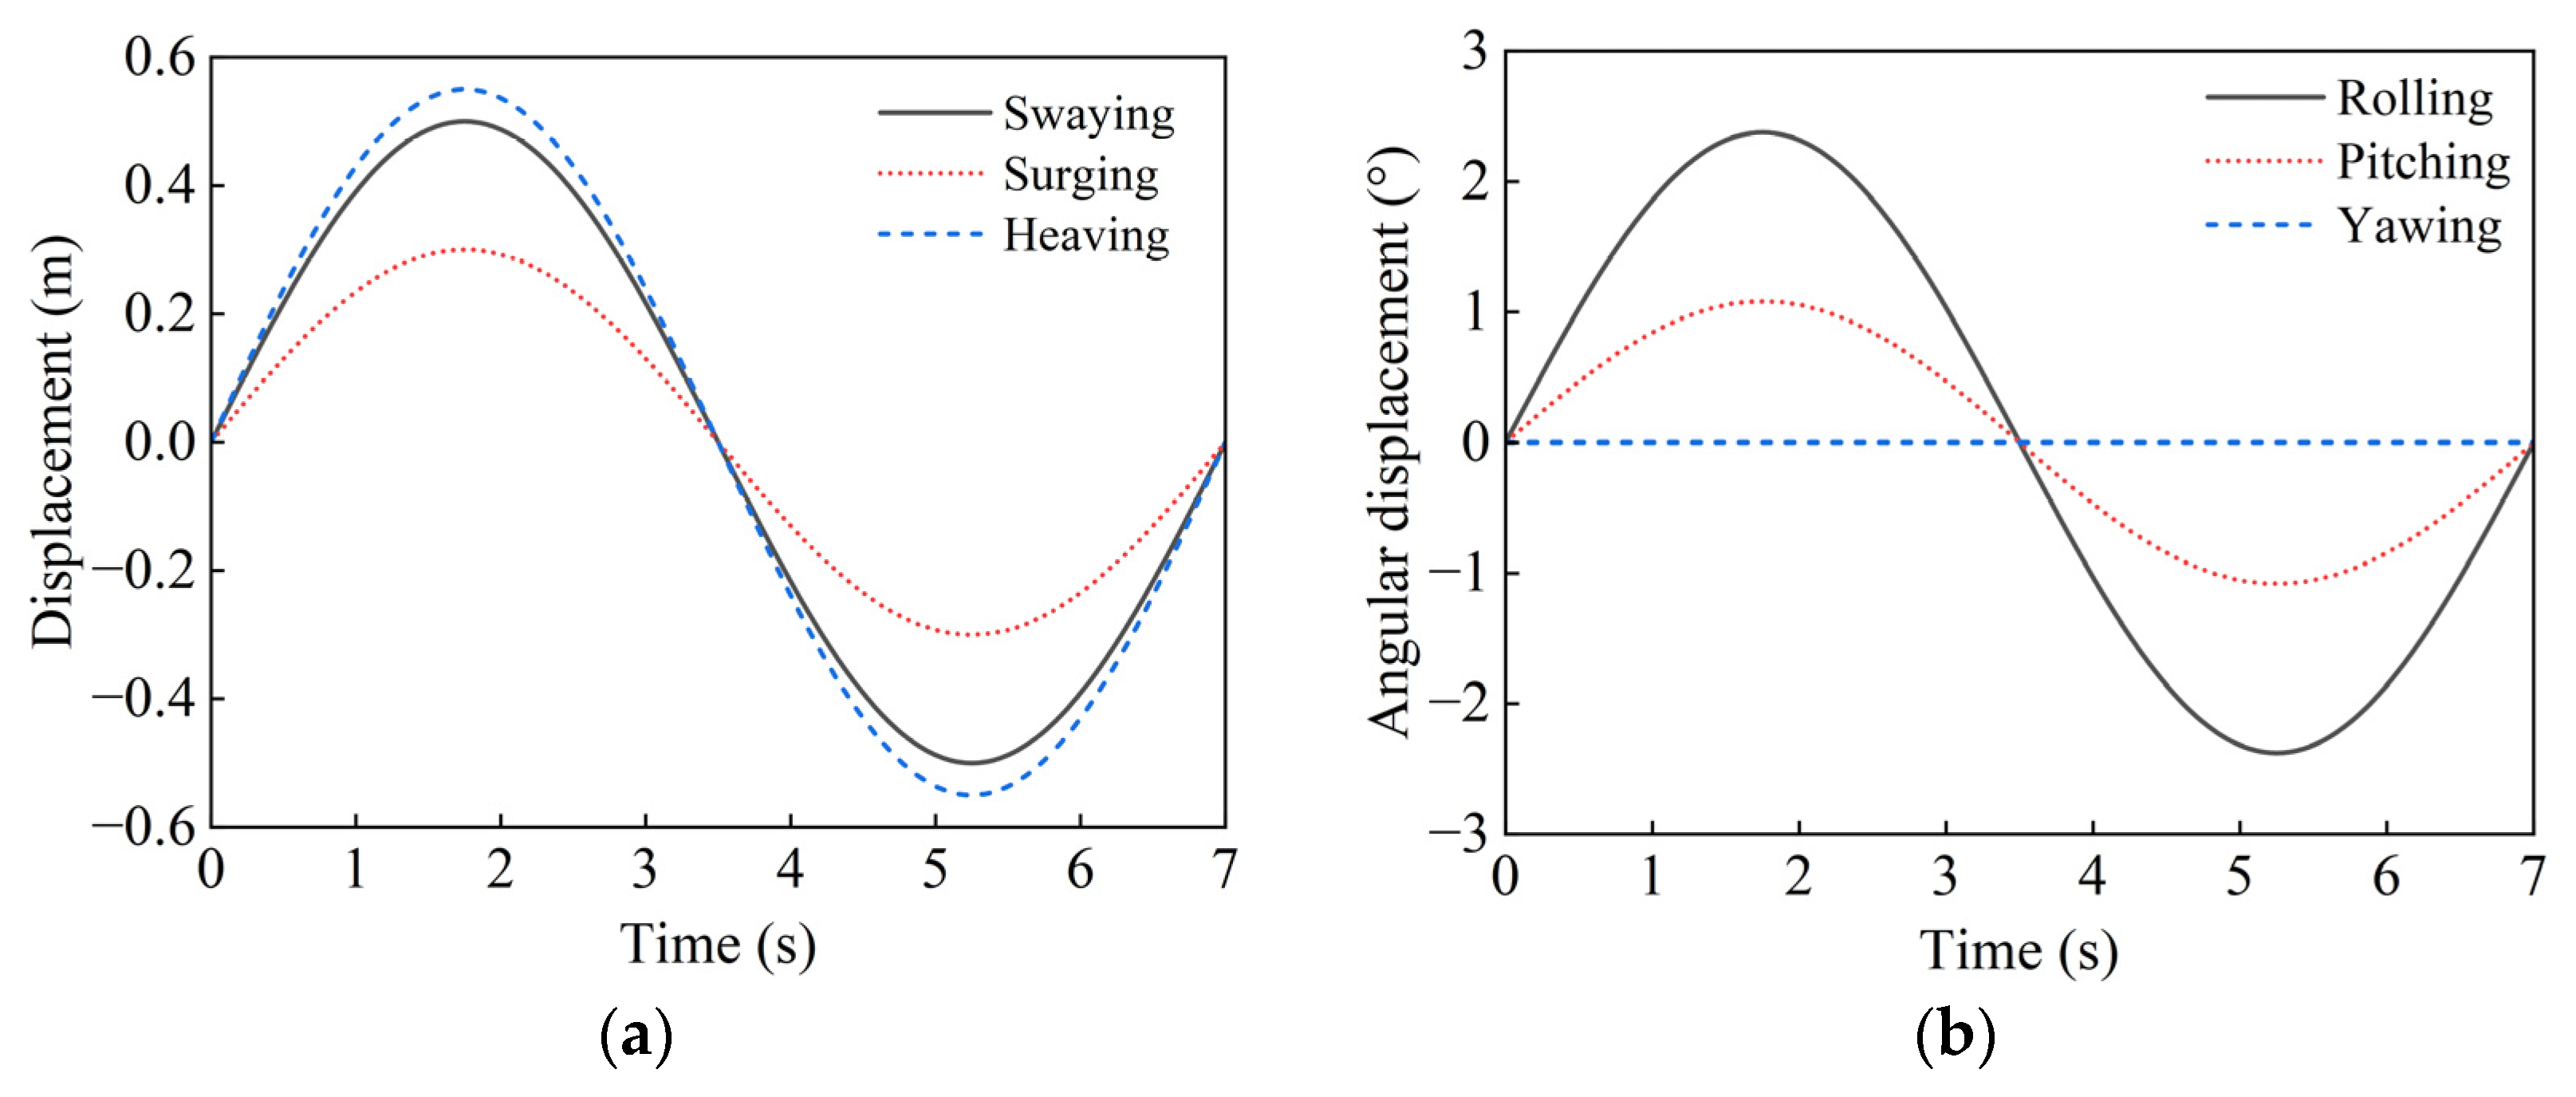
3.1. Transportation Vessel Motion

The transportation vessel’s motion are caused by the combination of ocean waves, wind, and prelaunch activities on the framed sea launch system. In case of loading problems, sea waves can be regarded as harmonic waves. The motion of the transportation vessel is driven by sea waves, and these movements constitute a complex spatial process that can be characterized using six degrees of freedom [10]: roll, pitch, yaw, sway, heave, surge, as shown in Figure 3. We use the transportation vessel’s equilibrium coordinate system, with the origin located at the center of gravity of the transportation vessel. Rolling, pitching, and yawing refer to reciprocating rotations around the X, Y, and Z axes, respectively. Meanwhile, surging, swaying, and heaving are linear reciprocating movements along the X, Y, and Z axes of the platform, respectively.
In practical situations, under the joint action of waves and mooring devices, the motion of the transportation vessel exhibits coupling across its six degrees of freedom, with correlated movements between each degree. Based on research on the motion of transportation vessels at sea, empirical rules have been derived that among the six movements, the main ones that have a significant impact on transportation vessels are rolling, pitching, and heaving. Among them, rolling has the greatest impact on transportation vessels, while the other three movements have smaller numerical values and also have a smaller impact on transportation vessels. In order to derive the motion characteristics of transportation vessels with research value, this article adopts the following assumptions.
  • The framed sea launch system is a rigid system;
  • Only the three types of motion that have a significant impact on the transportation vessel are considered: rolling, pitching, and heaving;
  • The rivet constraints between the bottom of the launch vehicle and the launch pad are ignored, and a reliable contact between them without separation is assumed.
The above assumptions are often used in ship seakeeping analysis and reliable results can be obtained. According to torque balance, the torques acting on the transportation vessel have the following relationship
M + M R + M S + M b = 0
where M = I x θ ¨ is the inertia torque of the transportation vessel, and I x is the total mass moment of inertia of the platform on the X-axis, including the attached water mass moment of inertia; M R = n θ ˙ is the damping moment of the water body on the transportation vessel, and n is the damping torque coefficient; MS is the stability moment; and Mb is the disturbance moment caused by wave action. MS can be approximated by the equation M S = g G M θ , when performing slight rolling, where GM is the initial stability height of the transportation vessel.
So, under approximately linear rolling on the transportation vessel, its rolling motion differential equation can be written as
I x θ ¨ + n θ ˙ + Δ g G M θ = M b
Assuming the initial rolling angle is θ = θ 0 , the initial angular velocity is θ ˙ = 0 . It can be solved that the damped linear rolling motion of the transportation vessel in a regular wave is
θ = θ 0 e μ t cos ω r t + α 0 1 T θ τ b 2 cos ω b t + ε θ
In Equation (3), θ 0 represents the lateral swaying amplitude of the platform in waves; ω b is the wave frequency; τ b is the wave period; ω x = g G M / I x represents the natural circular frequency of the transportation vessel’s rolling motion; T θ = 2 π / ω x is the natural rolling period of the transportation vessel; ε θ is the initial phase; μ = n / 2 I x is the damping and rolling attenuation coefficient, where n is treated as a constant; ω r = ω x 2 μ 2 and is the frequency and period of the damped rolling circle; and α 0 is the maximum wavefront angle.
The solution of Equation (2) is a combination of a rolling solution in still water and a special solution which is the forced motion in regular wave.
Due to the presence of damping, the result includes the attenuation factor e μ t , and the motion curve is a decaying cosine curve. As the movement time increases, the rolling amplitude gradually decreases.
The research methods and basic assumptions for pitching and heaving motion are basically the same as the process of studying rolling motion mentioned above. Similarly, the differential equations for undamped linear pitching and heaving motion of a launching platform in waves can be derived:
I y φ ¨ + n y φ ˙ + Δ g G M L φ = M b   m z z ¨ + n z z ˙ + ρ g A w z = F z
In Equation (4), I y is the total mass moment of inertia of the transportation vessel on the y-axis, including the attached water mass moment of inertia; G M L represents the high longitudinal stability of the transportation vessel; mz is the total mass of the transportation vessel in the vertical oscillation direction; A w is the waterline area of the transportation vessel; F z   is the vertical main disturbance force; and n y and n z are the pitching and heaving damping constant respectively.
The motion equations for damping linear pitching and heaving of the transmitting platform under regular wave excitation are solved as follows.
φ = φ 0 e β t cos 2 π T φ t + α 0 1 T φ τ b 2 cos ω b t + ε φ z = z 0 e σ t cos 2 π T z t + z h cos ω b t + ε z
where φ 0 is the initial longitudinal inclination angle of the transportation vessel; ε φ ,     ε z represents the initial phase of pitching and heaving, respectively; z 0 is the vertical distance at which the center of gravity of the transportation vessel deviates from the equilibrium position at the initial stage; z h is the forced displacement of the heaving; β and σ are damping pitching and heaving attenuation coefficient, respectively; and T φ and T z are natural period of pitching and heaving respectively.

3.2. Transportation Vessel Motion Boundary

Based on the theoretical analysis and measured data previously discussed, the rolling, pitching, and heaving motions of the transportation vessel induced by wave excitation can be accurately described using harmonic functions. In practical applications, it is essential to consider the rough sea state. The level 4 sea state represents the most common condition in the ocean. Figure 4 illustrates the maximum rolling and pitching motion functions of the transportation vessel under a level 4 sea state. The amplitude and frequency have been calculated based on the transportation vessel’s parameters. These results closely align with the measured peak values for rolling and pitching.
Based on the earlier assumption that each motion component is independent within the linear range, we propose three typical modes to utilize rolling and pitching motions, shown in Table 1. α and β represent the displacements of rolling and pitching angles, respectively, while α’ and β’ denote the angular velocities of rolling and pitching. The phase difference between rolling and pitching in these three motion modes increases monotonically from 0 to π/2. This approach simplifies the analysis in the subsequent steps and aids in identifying the cause of launch vehicle rolling more effectively.

3.3. Dynamics Analysis of 2-D-Driven Sea-Based Launch Vehicle

When the transportation vessel only has a heaving motion, the launch vehicle will not roll. The heaving of the transportation vessel coupled with the motion in other degrees of freedom may affect the rolling of the launch vehicle through asymmetric friction. In this section of the analysis, in order to obtain intuitive patterns, the heaving motion of the transportation vessel is not considered. Due to the launch device being arranged at the center of the transportation vessel, the axis of the launch cylinder passes through the center of mass of the launch device. Abstracting the launch device as geometry, the inclination of the launch cylinder axis is used to represent the movement of the launch system. The parameter l in Figure 5 represents the distance from the instantaneous center of the transportation vessel to the center of mass of the launch vehicle. The proportion of vertical displacement generated by rolling and pitching is very small, only proship = 1 − cos(αmax)cos(βmax), αmax represents the maximum rolling angle, and βmax represents the maximum pitching angle. proship = 1 − cos [2.6°] cos [1.1°] ≈ 0.1%, which can be considered as only moving in the horizontal plane.
The distance from the vertex of a line segment to the plane is
a tan α = b tan β θ = cot b a = cot tan β tan α c = a cos θ l 2 = c 2 + a tan α 2
From Equation (6), parameter c can be derived.
c = l × 1 + cos θ tan α 2 1 2
where parameter c is the projection of l in the xy-plane, parameter a is the projection of c on the y-axis, parameter b is the projection of c on the x-axis, parameter θ is the angle between the projection a and the projection c, parameter α is the angle between the projection of l in the yz-plane and the z-axis, and parameter β is the angle between the projection of l in the xz-plane and the z-axis.
The trajectory swept by the vertex of line segment c is the projection of the point trajectory on the axis of the launch cylinder at a distance from the center of mass l of the launch platform on the horizontal plane.
Analyzing the motion of the launch platform using mode 1, with the parameter l = 18 m. The maximum height change in the launch vehicle’s center of mass during motion is H = l ( 1 p r o s h i p ) = 0.0185   m . The value is very small, indicating that the launch vehicle’s vertical motion caused by the oscillation motion of the launch platform is weak. In the following analysis, it is assumed that launch vehicle cross-section centroid moving in a horizontal plane.
Figure 6 displays the orthogonal decomposition of the acceleration at the centroid of the launch vehicle’s cross-section. The trajectory of the launch vehicle’s centroid is denoted as S. S(0) indicates the initial position of the center of mass of the launch vehicle along its trajectory. As the launch vehicle and launch platform are in periodic motion, their starting and ending points coincide, and their motion is represented by natural coordinates. The position at time t can be determined by S ( t ) . The velocity of the launch vehicle’s center of mass is V :
V = S ˙ e t
where S ˙ is the derivative of S with respect to t , e t is the unit tangent vector of the trajectory of the point where the launch vehicle’s center of mass is located at time t . In Figure 6, we can establish the following equations.
a = d v d t = d v e t d t = v ˙ e t + v 2 ρ e n a t = v ˙ e t a n = v 2 ρ e n
where a is the acceleration of the launch vehicle center of mass, a n is the normal acceleration, a t is tangential acceleration, e n is the unit vector in the normal direction of the trajectory of the point where the center of mass of the launch vehicle is located, e t is the tangential direction unit vector of the trajectory of the point where the launch vehicle center of mass is located, and ρ is the curvature radius of the trajectory of the point where the center of mass of the launch vehicle is located.
The launch vehicle and launcher are in contact through adapters, and the stiffness of the adapters is significantly different from that of the launch vehicle and launcher. The launch vehicle and launcher can be regarded as rigid bodies, and the adapter needs to consider deformation. Figure 7 shows the forces acting on launch vehicle. Using the launch vehicle and guideways as the reference coordinate system, according to the d‘Alembert’s principle, it can be obtained that
F I t + F I n + F   = 0
where F I t and F I n are the tangential acceleration and normal acceleration inertial forces corresponding to the acceleration of the launch cylinder, and F is the force generated by the joint action of the deformed adapters and launchpad. The adapters generate force through deformation, indicating that during motion, the launch vehicle axis does not coincide with the frame launcher axis. In the presence of acceleration, there is a distance between the axes of launch vehicle and the frame launcher. This means that the launch vehicle has motion around the axis of the frame launcher, and due to the periodicity of system motion, this trajectory is closed.
Therefore, it can be known that the launch vehicle has a velocity in the guideway reference frame, and there is relative motion between the launch vehicle and the guideway. The guideway inside of the frame launcher will create a frictional resistance f1 on the adapters. The launch vehicle will generate an angular acceleration α z due to the action of f.
I y × α z = r 1 × f ω 1 = α z d t = r 1 × f 1 / I y d t ω 2 = r 2 × f 2 / I y d t ω = ω 1 + ω 2
where Iy is the rotational inertia of the launch vehicle about its own axis; r1 is the point where the center of the guideway points towards the point of frictional resistance, and as the launch vehicle deviates from the center of the guideway by a small distance, an approximation is made here; ω1 is the angular acceleration; r2 is the launchpad radius; ω is the angular velocity of the launch vehicle; and f2 is the fraction force generated by relative motion with the launch vehicle and launchpad.
By solving above equations simultaneously, we obtain
θ = cot b a = cot tan 1.1 ° sin 2 π t T tan 2.6 ° sin 2 π t T
The variation in the angle theta during motion within half a cycle is depicted in Figure 8. The motion trajectory of the line segment’s endpoint appears to be approximately a straight line. However, the changes in the theta angle indicate that the back-and-forth travel of this point does not follow a straight line, nor does it coincide. For ease of understanding, the trajectory of its motion is enlarged in Figure 8.
In Figure 9, it can be observed that there is a path difference in the trajectory when moving in mode 1. The projection point moves in a circular motion from the origin, following the sequence from 1 to 4. The motion trajectories of mode 2 and mode 3 within one cycle can be directly obtained through a sine relationship.
Considering other motion modes corresponding to the initial phase difference, Figure 10a shows the trajectories corresponding to each motion mode with a difference of π/8, and Figure 10b shows the trajectories corresponding to each motion mode with a difference of π/32. It is obvious that there is an envelope line in the motion trajectory, which is the rectangle of [−lsin2.6°, lsin2.6°] [−lsin1.1°, lsin1.1°]. When the phase difference is 0, that is, in motion mode 1, it approximates a straight line. When the phase difference is π, it approximates a symmetrical straight line about the coordinate axis. As the phase difference gradually increases, the envelope area of the trajectory line gradually increases, and the axis of the trajectory line rotates accordingly. As the phase difference increases, the trajectory tends from a flat ellipse to a positive ellipse. When the phase difference is π/2, it is a symmetric positive ellipse about the coordinate axis. As the phase difference continues to increase, the axis of the trajectory line turns towards another direction, and the envelope area of the trajectory line begins to decrease. This phenomenon is mainly due to the symmetry and periodicity of the sine function about the x-axis. As the phase difference increases, the axis of the trajectory continuously rotates.
When the angular velocity-induced rolling of the launch vehicle cannot synchronize with its movement around the guideway’s axis, the adapter intervenes by accelerating the launch vehicle’s roll through deformation and friction. Conversely, if the launch vehicle’s roll speed exceeds its movement around the frame launcher’s axis, the adapters act to decelerate the launch vehicle’s roll, again leveraging deformation and friction.
Viewing this from an energy perspective, the deformation and friction experienced by the adapter serve dual roles: they can either contribute kinetic energy to the launch vehicle’s roll or absorb it, leading to variations in the launch vehicle’s angular velocity around zero. Should the time-integrated angular velocity over a cycle not equal zero, the launch vehicle accrues angular displacement, which may ultimately result in its detachment from the guideway, rendering it incapable of launch.

4. Dynamics Simulation Analysis of Sea-Based Launch Vehicle during Prelaunch

4.1. Multibody Dynamics Calculation Methods

Based on the dynamic equation of the first type of Lagrange, the dynamic equation of the multi rigid body system is derived as follows.
d d t T q ˙ T T q ˙ + Φ q T λ + Ψ q ˙ T μ Q = 0
In Equation (13), the generalized coordinates q = q 1   q 2     q i are used to describe the rigid body in the system, and the position and attitude of the i -th individual are qi . Φ q T q , t = 0 is the complete constraint equation, Ψ q ˙ T q , q ˙ , t = 0 is the incomplete constraint equation, and Q is the generalized force column vector; λ is the column vector of the Laplace multiplier corresponding to the complete constraint; and μ is the column vectors of Laplace multipliers corresponding to nonholonomic constraints.
The normal contact force is composed of elastic force and damping force. The former is generated by the mutual embedding of components, while the latter is caused by the relative cutting speed. The expressions of the normal contact force and tangential contact force are as follows.
F n = k g s + c dg dt F t = μ F n
where k is the generalized contact stiffness; g indicates the normal embedding depth between two components; e is the force index; and c represents the damping coefficient. The coefficient of friction μ is related to the relative slip velocity, which can be expressed as follows.
μ = 0 V = 0 μ s sign ( V ) | V | = V s μ d sign ( V ) | V | V d step ( V , V s , μ s , V s , μ s ) V s < | V | < V s step ( | V | , V d , μ d , V s , μ s ) sign ( V ) V s < | V | < V d
where V is the relative slip velocity; V s is the maximum tangential velocity at which static friction occurs; V d is the minimum tangential velocity for dynamic friction; and μ s and μ d are the static friction coefficient and the dynamic friction coefficient, respectively. The step function is used to introduce a sudden change in a signal or parameter during simulation. For the given function μ = step(V, −Vs, μs, Vs, −μs), it is used to introduce a sudden change in a signal or parameter during simulation, where the function value transitions from μs to −μs when the independent variable V exceeds Vs.
μ = μ s ,   V V s μ i , V s < V < V s μ s , V V s
where V is the independent variable, usually representing time or a time-related variable; −Vs is the starting value of the independent variable; μs is the initial value of the step function; Vs. is the ending value of the independent variable; and −μs is the ending value of the step function.

4.2. Framed Sea Launch System during Prelaunch Dynamics Model

According to the structural characteristics of the framed sea launch system and the load transfer relationship of moving parts during prelaunch phase, the following assumptions are put forward without affecting the rationality of the model.
  • Ignoring the flexible structural deformation of the framed sea launch system, the primary consideration is the system’s motion response under loading conditions.
  • The motion of the transportation vessel is considered a simple harmonic motion without considering the mutual coupling effect between the transportation vessel and the waves.
  • The lifting cylinder is locked after the lift-off operation. The lifting cylinder is simplified as a single rigid body cylinder, with its upper end connected to the frame launcher via a ball joint, and its lower end connected to the support platform via a ball joint.
  • The launchpad and support platform’s legs are fixed on the transportation vessel.
  • Without considering adapter deformation, the load transmission of the adapter is represented through penalty functions and contact embedment depth.
  • Without considering the separation process of the adapters, adapters are fixed to the launch vehicle.
  • The support platform is connected to the launchpad via a rotational joint.
Based on the simplifications mentioned above, the model of the framed sea launch system in the prelaunch state is established, and the connection topology is shown in Figure 11.
The main dynamics parameters of the framed sea launch system during prelaunch are as follows.
  • The main mass characteristics of the launch vehicle are shown in Table 2.
2.
The contact coefficients between each contact are shown in Table 3.
3.
Boundary conditions
The boundary of the transportation vessel’s six-degree-of-freedom motion is driven under a level 4 wind and wave environment using harmonic functions. The motion period of the transportation vessel is 7 s, and the oscillation pattern of the transportation vessel in each direction is as shown in Figure 12.
4.
Wind load
During the oscillation of the transportation vessel, the frontal area of the launch vehicle changes minimally, and the wind load almost remains constant in amplitude. The wind load is applied in the form of concentrated forces at the center of mass of the launch vehicle. Wind load is 5948 N (Wind speed is 10 m/s), the direction is along the positive y-axis.
5.
Gravity
The gravity acceleration is set to 9.8 m/s2, and applied globally as a gravitational field.
Here, the dynamics simulation model has been established.

4.3. Dynamics Simulation Results and Analysis

To validate the reliability of the 2-D drive theory analysis mentioned above, simulations are conducted for both two-degree-of-freedom (DOF)-driven dynamics and six-degree-of-freedom (DOF)-driven dynamics. The effects of the remaining four degrees of freedom of a vessel on the launch vehicle’s rolling are analyzed through comparison. Following that, based on the six-degree-of-freedom-driven dynamics simulation model, large-scale simulations were conducted using a uniform sampling method to analyze the factors influencing the rolling of the launch vehicle.

4.3.1. Two-Degree-of-Freedom-Driven Dynamics Simulation

In the 2-DOF-driven simulation, inputs are limited to roll and pitch motions, and wind load effects are not considered. The 2-DOF simulation employs three motion modes as outlined in Table 1.
The original simulation results pertain to the unstable oscillation caused by the rocking motion of the transportation vessel. To facilitate a comparison with the Section 3.3 dynamics analysis of a 2-D-driven sea-based launch vehicle, the unstable oscillation segment is removed. Only the subsequent stable motion segment is analyzed. Additionally, the center of the launch vehicle’s motion trajectory obtained from the simulation is translated to the origin of the projection plane. The same processing is applied to all subsequent simulation results. The rolling movement of the three modes is shown in Figure 13.
From Figure 13a, it can be observed that under mode 1 driving, the launch vehicle’s rolling angle cyclically oscillates around −0.012°, while under mode 2 and mode 3 driving, the launch vehicle’s roll angle increases periodically with a certain increment, showing an overall trend of gradually increasing the roll angle. Figure 13b shows that under mode 1 driving, the launch vehicle’s rolling angle velocity cyclically varies around −0.00289°/s, and the integration of rolling angle velocity with respect to time slightly decreases. Under mode 2 and mode 3 driving, the launch vehicle’s rolling angle velocity also varies periodically, and the rolling angle velocity cyclically varies around 0.02126°/s under mode 3 driving, which is greater than that 0.01275°/s under mode 2 driving. Therefore, after integrating the rolling angle velocity over time, the rolling under mode 3 driving is faster than that under mode 2 driving. However, the occurrence of rolling motion is determined by the difference in the path size of the launch vehicle’s center of mass motion, which is also reflected in the simulation results, as shown in Figure 14.
The motion paths in Figure 14 are driven by the two-dimensional driving corresponding to the three modes listed in Table 1. The black curves (2-D theory) represent the two-dimensional planar motion path of the launch vehicle’s center of mass obtained through theoretical derivation in Section 3. The colored curves (2-D simulation) represent the motion paths of the launch vehicle’s center of mass obtained through simulation based on the established three-dimensional sea-based launch vehicle prelaunch dynamics model, along with their xy-plane projections. The color gradient from blue to red represents the time from 0 s to 7 s, facilitating the identification of the spatial trajectory motion process of the launch vehicle’s center of mass obtained from the 3-D dynamics model simulation. The curves of both the 2-D simulation and 2-D theory are projected onto the plane z = −0.021 m and found to completely overlap. This demonstrates the correctness of the conclusion that the difference in the trajectory of the launch vehicle’s center of mass motion during the dimensional reduction theory analysis leads to the rolling of the launch vehicle.

4.3.2. Six-Degree-of-Freedom-Driven Dynamics Simulation

During the six-degree-of-freedom-driven simulation, wind loads were taken into account to study the rolling of the launch vehicle prelaunch at sea under three modes. The launch vehicle’s rolling motion during the prelaunch stage, driven by six degrees of freedom, is illustrated in Figure 15. For analytical convenience, the launch vehicle’s rolling motion during the prelaunch stage driven by two degrees of freedom are juxtaposed in Figure 15 for comparative purposes.
According to Figure 15, it can be observed that during the prelaunch stage, the angular displacement and angular velocity patterns of the launch vehicle’s rolling motion under both two-degree-of-freedom- and six-degree-of-freedom-driven modes exhibit remarkable similarity. This indicates that, under the assumption of rigid body motion, during the prelaunch stage, the variation in the trajectory of the launch vehicle’s center of mass caused by the roll and pitch motions of the transport vessel has a significant impact on the roll motion of the launch vehicle. The yaw, sway, surge and heave motions of the transport vessel, as well as the level 4 wind loads, have negligible effects on the roll motion of the launch vehicle at this stage.

4.3.3. Analysis of the Parameters Influencing Launch Vehicle’s Rolling Loads

From the analysis in Section 3.3, it is evident that during the prelaunch stage, the primary loads influencing the roll motion of the launch vehicle are guideway–adapter contact forces and launchpad–launch vehicle contact forces. These contact forces can both be decomposed into normal contact forces, tangential contact forces, and frictional forces. The normal and tangential contact forces are determined by the relative motion between the structures in contact, while the frictional forces are determined by the normal contact forces and the coefficient of friction. In the scenario where the transportation vessel is already determined and there are no considerations for changing the sea conditions or the structure of the launch system, the relative motion between the contacting objects remains unchanged. In this case, the primary factors influencing the rolling of the launch vehicle is the coefficient of friction at the contact surfaces.
In this section, the dynamic coefficients of friction, denoted as μ1 between the launchpad and the launch vehicle, and μ2 between the adapters and the guideways, are considered as variables. The investigation focuses on the rolling angle displacement of the launch vehicle during the prelaunch stage. The static coefficient of friction between the launchpad and the launch vehicle is denoted as (μ1 + 0.02), while the static coefficient of friction between the adapters and the guideways is denoted as (μ2 + 0.02). The range of values for μ1 is [0.05, 0.7], and the range of values for μ2 is [0.05, 0.4]. Sampling is performed at uniform intervals of 0.01, the total number of sample points is 2376. The response surface of the rolling angle of the launch vehicle during the pre-launch stage with respect to μ1 and μ2 is depicted in Figure 16.
From Figure 16, it can be inferred that the rolling angle of the launch vehicle exhibits strong nonlinear coupled responses characterized by μ1 and μ2. It is evident from the figure that the rolling motion of the launch vehicle is minimal when μ1 is within the range of [0.05, 0.1] and μ2 is within the range of [0.14, 0.4]. Conversely, the rolling motion of the launch vehicle is significant when μ1 falls within [0.13, 0.33] and μ2 falls within [0.05, 0.1]. When μ1 is 0.05 and μ2 is 0.4, the rolling angle of the launch vehicle is at its minimum value of 0.08°. Conversely, when μ1 is 0.2 and μ2 is 0.14, the rolling angle of the launch vehicle reaches its maximum value of 0.14°.

5. Conclusions

In this study, we primarily investigated the rolling mechanism of a launch vehicle during the prelaunch stage at sea launch, using dimensionality reduction-driven spatial system projection methods and multibody dynamics simulation methods. The conclusions drawn are as follows:
Both the dimensionality reduction-driven spatial system projection method and the multibody dynamics simulation driven by the two-degree-of-freedom motion of the transportation vessel indicate that the launch vehicle’s rolling is caused by differences in the motion paths of the launch vehicle’s center of mass. A comparative analysis of multibody dynamics simulations driven by two-degree-of-freedom and six-degree-of-freedom motion of the transportation vessel reveals that the variation in the trajectory of the launch vehicle’s center of mass caused by the rolling and pitching motions of the transportation vessel has a significant impact on the roll motion of the launch vehicle, while the motion in other degrees of freedom has little effect on rocket rolling. Through the construction of response surfaces for the launch vehicle’s rolling, it is found that the minimum rolling angle of the launch vehicle during the prelaunch stage occurs when the dynamic coefficient of friction of the launchpad–launch vehicle contact is 0.05, and the dynamic coefficient of friction of the adapter–guideway contact is 0.4.
This study reveals the rolling mechanism of a launch vehicle during the prelaunch stage of sea launch, laying the foundation for subsequent studies aimed at suppressing the launch vehicle’s rolling by reducing the motion path difference in the launch vehicle’s center of mass. This provides theoretical guidance for enhancing sea launch capabilities in rough sea conditions.

Author Contributions

Conceptualization, D.W.; methodology, D.W.; software, W.X.; validation, J.S. and M.L.; formal analysis, D.W.; investigation, M.L.; resources, W.X.; data curation, J.S.; writing—original draft preparation, D.W. and W.X.; writing—review and editing, J.S. and M.L.; visualization, Y.Z.; supervision, Y.J.; project administration, Y.J.; funding acquisition, Y.J. All authors have read and agreed to the published version of the manuscript.

Funding

This research received no external funding.

Data Availability Statement

The original contributions presented in the study are included in the article, further inquiries can be directed to the corresponding author.

Acknowledgments

Thanks for the experimental technology support provided by the China Academy of Launch Vehicle Technology.

Conflicts of Interest

The authors declare no conflicts of interest.

References

  1. Ilcev, S.D. Spacecraft Launching Technique and Systems. In Proceedings of the 2016 International Conference on Electrical, Electronics, and Optimization Techniques (ICEEOT), Chennai, India, 3–5 March 2016; pp. 4514–4517. [Google Scholar]
  2. Song, Z.; Xie, Z.; Qiu, L.; Xiang, D.; Li, J. Prospects of Sea Launches for Chinese Cryogenic Liquid-Fueled Medium-Lift Launch Vehicles. Chin. J. Aeronaut. 2021, 34, 424–437. [Google Scholar] [CrossRef]
  3. Xiao, N.; Xiao, L.; Zhang, F.; Zhou, J.; Li, M.; Liu, Y.; Hou, K.; Li, Y. An Architecture of Cross-Domain Support System for Multiple Space Command and Control Platforms. In Proceedings of the 2021 IEEE Aerospace Conference (50100), Big Sky, MT, USA, 6–13 March 2021; pp. 1–10. [Google Scholar]
  4. Chang, M.R. Sea-Launched TacSats for Responsive Space (STaRS)*. In Proceedings of the 7th Responsive Space Conference, Los Angeles, CA, USA, 27–30 April 2009; Volume 8. [Google Scholar]
  5. Tuturea, D.; Rajabi, F. Ocean Launch Facility Concept Design. In Proceedings of the Advanced Marine Vehicles Conference; American Institute of Aeronautics and Astronautics: Arlington, VA, USA, 1989. [Google Scholar]
  6. Jiandong, Y.; Yingliang, M.; Tao, Z.; Dong, J. Design of Maritime Satellite Launch Platform. In Proceedings of the 2020 2nd International Conference on Artificial Intelligence and Advanced Manufacture (AIAM), Manchester, UK, 15–17 October 2020; pp. 416–419. [Google Scholar]
  7. Lang, D.E.; Choate, D.L.; Nance, M.L. Sea Launch: Commercial Launch Competitiveness. In Engineering, Construction, and Operations in Space V; American Society of Civil Engineers: Albuquerque, NM, USA, 1996; pp. 419–425. [Google Scholar]
  8. Dong, Y.; Qu, M.; Su, C.; Qi, B.; Yu, C.; Qi, C.; Peng, X. Dynamic Simulation of Shipborne Vertical Launching System Under High Wave Level. In Proceedings of the 2019 International Conference on Advanced Manufacturing, Computation and Optimization, Budapest, Hungary, 20–22 November 2019. [Google Scholar]
  9. Zeng, W.; Jiang, Y. Launching Dynamics Simulation of Ship-Board Rocket Gun. Adv. Mater. Res. 2012, 625, 140–145. [Google Scholar] [CrossRef]
  10. Konyukhov, S.N. Applied Mechanics Problems Accompanying Spacecraft Launches from a Floating Platform and Their Resolution by the Sea Launch Project. Int. Appl. Mech. 2004, 40, 115–139. [Google Scholar] [CrossRef]
  11. Titterton, D.H. The Alignment of Ship Launched Missile IN Systems. In IEE Colloquium on Inertial Navigation Sensor Development; IET: Stevenage, UK, 1990. [Google Scholar]
  12. Zhao, S.; Meng, X.; Li, H.; Li, D.; Fu, Q. Continuous Multi-Body Dynamic Analysis of Float-over Deck Installation with Rapid Load Transfer Technique in Open Waters. Ocean Eng. 2021, 224, 108729. [Google Scholar] [CrossRef]
  13. Apeng, D.; Shu, L.; Wenguo, Z. Multi-Body Coupling Dynamic Research of Carrier-Based Aircraft Catapult Launch Based on Natural Coordinate Method. Proc. Inst. Mech. Eng. Part K J. Multi-Body Dyn. 2019, 233, 195–207. [Google Scholar] [CrossRef]
  14. Mousaviraad, M.; Conger, M.; Bhushan, S.; Stern, F.; Peterson, A.; Ahmadian, M. Coupled Computational Fluid and Multi-Body Dynamics Suspension Boat Modeling. J. Vib. Control 2018, 24, 4260–4281. [Google Scholar] [CrossRef]
  15. Sun, L.; Eatock Taylor, R.; Choo, Y.S. Multi-Body Dynamic Analysis of Float-over Installations. Ocean Eng. 2012, 51, 1–15. [Google Scholar] [CrossRef]
  16. Chang, Z.; Tang, Y.; Li, H.; Yang, J.; Wang, L. Analysis for the Deployment of Single-Point Mooring Buoy System Based on Multi-Body Dynamics Method. China Ocean Eng. 2012, 26, 495–506. [Google Scholar] [CrossRef]
  17. Cha, J.-H.; Ham, S.-H.; Lee, K.-Y.; Roh, M.-I. Application of a Topological Modelling Approach of Multi-Body System Dynamics to Simulation of Multi-Floating Cranes in Shipyards. Proc. Inst. Mech. Eng. Part K J. Multi-Body Dyn. 2010, 224, 365–373. [Google Scholar] [CrossRef]
  18. He, J.; Jin, X.; Xie, S.Y.; Cao, L.; Lin, Y.; Wang, N. Multi-Body Dynamics Modeling and TMD Optimization Based on the Improved AFSA for Floating Wind Turbines. Renew. Energy 2019, 141, 305–321. [Google Scholar] [CrossRef]
  19. Lei, J.; Jiang, Y.; Zhao, R. Research on the Influence of Launch Time on the Thermal Launch of Solid Rockets at Sea. J. Proj. Rockets Missiles Guid. 2023, 43, 91–97. [Google Scholar]
  20. Hongyu, C.; Zhiwei, K.; Huifeng, Z.; Mengmeng, Y. Study on Launch Dynamics of Shipborne Missile System. SHIP Sci. Technol. 2021, 43, 10–12. [Google Scholar]
  21. Wang, D.; Shao, J.; Chen, M.; Zhao, Y.; Jiang, Y. Sea Launch Adapter Response in Rough Sea Conditions Considering Strain Rate Effects. J. Phys. Conf. Ser. 2023, 2508, 012027. [Google Scholar]
  22. Pang, F.; Qin, Y.; Tang, Y.; Gao, C.; Li, H. Experimental Study on Impact Response of Seaborne Rocket Launch Platform. Ocean Eng. 2023, 280, 114623. [Google Scholar] [CrossRef]
  23. Su, Y.; Lu, X.; Le, G.; Li, G.; Fu, B. Numerical Simulations of Seawater Spraying on Launch Platform during CZ-8X Offshore Launching. Adv. Space Res. 2023, 72, 3631–3644. [Google Scholar] [CrossRef]
  24. Mu, R.; Zhang, T.; Li, S. A Rapid Self-Alignment Strategy for a Launch Vehicle on an Offshore Launching Platform. Sensors 2022, 23, 339. [Google Scholar] [CrossRef] [PubMed]
  25. Xu, W.; Xu, G.; Niu, G.; Mei, T. The Study of the Motion of the Satellite Launching Platform with Different Shape of Pontoons. In 2023 International Conference on Marine Equipment & Technology and Sustainable Development; Yang, D., Ed.; Springer: Singapore, 2023; Volume 375, pp. 303–315. [Google Scholar]
  26. Kong, X.; Dong, Y.; Kang, J.; Paik, J.K. Quantitative Risk Assessment and Management of Hydrogen Leaks from Offshore Rocket Launching Platforms. In Proceedings of the 2023 9th International Symposium on System Security, Safety, and Reliability (ISSSR), Hangzhou, China, 10–11 June 2023; pp. 149–155. [Google Scholar]
  27. Pua, C.; Hu, P.; Ji, C.; Zhu, Z.; Zheng, B.; Zhai, S. Simulation Analysis of Protective Wall against Hydrogen Combustion from Liquified Hydrogen Storage Tank on the Offshore Launching Platform. Int. J. Hydrogen Energy 2023, 48, 12501–12518. [Google Scholar] [CrossRef]
  28. Xiong, Z.; Zhu, C.; Yang, Y.; Lin, T.; Li, R. XFEM-Based Study of Fatigue Crack Propagation in Rocket Deflector Troughs under Coupled High-Temperature and Impact Conditions. J. Mar. Sci. Eng. 2024, 12, 207. [Google Scholar] [CrossRef]
  29. Yu, J.; Cheng, X.; Fan, C.; Lu, Z.; Ni, X. Investigation on Hydrodynamic Response of Sea Launch Platform to Impact Load | Compendex. Ship Build. China 2021, 62, 139–148. [Google Scholar]
  30. Liu, X.; Wang, Y.; Liu, X.; Xu, G. Review of Marine Satellite Launch Platform and Related Study at JUST. In 2023 International Conference on Marine Equipment & Technology and Sustainable Development; Yang, D., Ed.; Springer: Singapore, 2023; Volume 375, pp. 579–590. [Google Scholar]
Figure 1. The framed sea launch system: (a) system components; (b) frame launcher; (c) launch vehicle and adapters.
Aerospace 11 00399 g001
Figure 2. Rolling angle in low sea state test: (a) the displacement testing sensor installed on the top of the frame launcher in red circle; (b) rolling angle.
Aerospace 11 00399 g002
Figure 3. The motion of the transportation vessel.
Aerospace 11 00399 g003
Figure 4. Rolling and pitching driving functions.
Aerospace 11 00399 g004
Figure 5. Simplified geometric motion model.
Aerospace 11 00399 g005
Figure 6. Decomposition of the acceleration at the centroid of the launch vehicle’s cross-section.
Aerospace 11 00399 g006
Figure 7. Forces acting on launch vehicle: (a) decomposition of forces acting on launch vehicle; (b) friction torque generation.
Aerospace 11 00399 g007
Figure 8. θ and trajectory: (a) θ in half period; (b) horizontal trajectory.
Aerospace 11 00399 g008
Figure 9. Mode 1 path order.
Aerospace 11 00399 g009
Figure 10. Horizontal trajectories with different phase differences:(a) π/8; (b) π/32.
Aerospace 11 00399 g010
Figure 11. Connection topology of framed sea launch system.
Aerospace 11 00399 g011
Figure 12. The motion of the transportation vessel: (a) translation motion; (b) rotation motion.
Aerospace 11 00399 g012
Figure 13. Dynamics simulation under 2-D driving obtained the rolling angle motion laws corresponding to 3 modes: (a) rolling angular displacement; (b) rolling angular velocity.
Aerospace 11 00399 g013
Figure 14. The difference in the path of the launch vehicle’s center of mass motion under 2-D driving: (a) the difference in the path of the rocket’s center of mass motion under mode 1 driving; (b) the difference in the path of the rocket’s center of mass motion under mode 2 driving; (c) the difference in the path of the rocket’s center of mass motion under mode 3 driving.
Aerospace 11 00399 g014
Figure 15. Dynamics simulation under 2-D and 6-D driving obtained the rolling angle motion laws corresponding to 3 modes: (a) rolling angular displacement; (b) rolling angular velocity.
Aerospace 11 00399 g015
Figure 16. The response surface of the rolling angle of launch vehicle during prelaunch stage.
Aerospace 11 00399 g016
Table 1. Two-dimensional driving functions of transportation vessel.
MotionMode 1Mode 2Mode 3
Rolling velocity α = 2.6 ° T 2 π sin 2 π t T + π 2 α = 2.6 ° T 2 π sin 2 π t T + π 4 α = 2.6 ° T 2 π sin 2 π t T
Pitching velocity β = 1.1 ° T 2 π sin 2 π t T + π 2 β = 1.1 ° T 2 π sin 2 π t T + π 2 β = 1.1 ° T 2 π sin 2 π t T + π 2
Table 2. Main mass characteristics of the launch vehicle.
ParameterValueMoment of InertiaValue
Mass (kg)120,000Ixx (kg·m2)5,010,550
Length (m)30.888Iyy (kg·m2)5,010,550
Distance from barycenter to the tip of rectifier (m)21.043Izz (kg·m2)101,123
Table 3. Contact parameters.
ParameterAdapters and LauncherLaunch Vehicle and Launchpad
Contact stiffness2855 N/mm100,000 N/m
Damping coefficient0.57 N·s/mm50 N·s/mm
Power contribution index1.11.5
Maximum penetration depth0.1 mm0.1 mm
Static friction coefficient0.150.1
Dynamic friction coefficient0.10.1
Static friction transition speed0.3 mm/s0.3 mm/s
Dynamic friction transition speed0.25 mm/s0.25 mm/s
Disclaimer/Publisher’s Note: The statements, opinions and data contained in all publications are solely those of the individual author(s) and contributor(s) and not of MDPI and/or the editor(s). MDPI and/or the editor(s) disclaim responsibility for any injury to people or property resulting from any ideas, methods, instructions or products referred to in the content.

