Abstract
Root biomass and distribution are influenced by abiotic factors, such as topography and soil physicochemical properties, determining belowground productivity. Hence, we investigated the variation in root biomass and vertical root distribution based on the topography, soil physicochemical properties, and tree influence index, and their relationships, across soil depths (0–10 cm, 10–20 cm, and 20–30 cm) and topographical gradients in a warm-temperate forest in Mt. Duryun, Republic of Korea. Two contrasting research sites were established: a lower slope oriented at ≤3° and an upper slope with a slope of 30°. Each site comprised eleven 400 m2 sampling plots from which root samples from various diameter classes (<2 mm, 2–5 mm, 5–10 mm, and >10 mm) were collected. While the bulk density increased with soil depth in the lower slope, the organic matter, available phosphorus, Ca2+, and Mg2+ showed a reversed pattern. Linear mixed-effects models generally revealed significant negative correlations between root biomass and soil pH, total nitrogen, and cation exchange capacity, particularly in small roots (βstd = −1.03 to −1.51) and coarse roots (βstd = −6.30). Root biomass exhibited a 10–15% increase in the upper slope compared to the lower slope, particularly in fine (median = 52.0 g m2–65.64 g m2) and medium roots (median = 56.04 g m2–69.52 g m2) at a 0–20 cm soil depth. While no significant correlation between root biomass and the tree influence index was found on the lower slope, a different pattern was found on the upper slope. Our results indicate that the variation in root biomass and distribution can also be explained by the differences in the soil environment and topographical positions.
1. Introduction
Roots regulate plant and ecosystem functions, provide resources to the soil microbial community, and influence water, carbon, and nutrient cycling [1,2]. Roots constitute a significant portion of the total biomass in forest ecosystems [3]. Specifically, fine roots assume an essential role in terrestrial carbon dynamics, supporting 38.1 Pg of the global carbon (C) in their biomass and supplying up to 60% of C to the mineral soil [4,5]. Root growth and distribution, either horizontal or vertical (e.g., along a gradient of soil depth), is controlled by the different abiotic factors (e.g., soil texture and compaction, presence of stones, slope angle, etc.) [6,7,8]. These complexities add to the challenge of accurately estimating root characteristics. Thus, there is a need for a reliable biomass assessment of tree roots to help us estimate ecosystem productivity, scale up primary production measurements, predict ecosystem functioning and tree root adaptability mechanisms, and inform management strategies in changing environments. However, the estimation of root biomass remains a challenge due to the complexities of root architecture, distribution, and turnover rates within ecosystems, especially in areas where root excavation is difficult, such as on upper slopes. Further, root biomass variation along environmental gradients is less well understood than aboveground parts, which have received substantial research [9].
Topography plays an important role in shaping root growth and distribution by controlling the spatial variation of soil’s physical properties and nutrients, sediment transport, drainage patterns, mass movement, and erosion rates [10,11]. Plants experience mechanical stress as a result of the combined influences of inclination, stem, and soil slope positions, to which all plants respond by altering root growth and distribution to avoid uprooting [12,13]. On steep terrain, plant roots tend to elongate uphill, and as the angle increases, so does root growth because of gravitational force [14]. Mechanical forces active on steep slopes influence root system development by developing a specific root asymmetrical architecture as a result of preferential lateral root emergence and elongation in the upslope and downslope orientations [12]. Moreover, lower slopes generally have a more fertile soil environment than upper slopes [15,16,17,18] because nutrients are transported downhill from the upper slope, resulting in an eventual accumulation downslope [19,20]. Other geohydrologic processes may also transport nutrient-deficient soil mass from the upper to lower slopes, reducing the availability of topsoil nutrients [21]. Thus, studies on the potential relationships among topography, soil physicochemical properties, and plant root response will enhance our understanding of root dynamics along topographical and soil resource gradients.
The variation in fine root biomass can also be explained by the immediate soil environment, highlighting the complex interaction between soil physicochemical properties and root development. When facing low-nutrient conditions, plants invest more in increasing fine root production to improve nutrient foraging efficiency [22,23]. Generally, fine root biomass decreases as soil fertility increases, and the relationship may vary by species and site conditions [24,25]. Moreover, soils contain abundant rock fragments of various sizes, which significantly impact soil properties and root growth [26]. The spatial distribution, size, and quantity of the rock fragments in the soil can regulate water retention, infiltration, and gas exchange processes, and also influence nutrient dynamics and erosion susceptibility [27,28], all of which are influenced by topography [29,30,31]. Fine root biomass may be limited on stony slopes as a consequence of restricted rooting space [32,33] and a reduced proportion of fine-earth particles that retain both soil moisture [29,34,35] and nutrients [26,36]. Because different ecosystems with varying species compositions and structures may respond differently to environmental gradients, investigating the relationship between soil rock fragments, soil physicochemical properties, and root biomass can help us describe root dynamics and functioning in a changing landscape.
Root growth and distribution are also influenced by the size and proximity of nearby trees primarily through competition for resources, as coexisting plants rely on a limited supply of essential resources, such as water, nutrients, and space [37]. Hence, any major changes in the basal area [38,39], stand density [40,41,42], and other structural traits [40,43,44] of nearby trees further modify root dynamics. The proximity of trees favors competitive downward displacement of roots due to soil moisture and nutrient gradients and canopy shading [45]. Roots accumulate at select horizontal distances, depending on their size and topographic position. Moreover, existing plants can also interact with each other in positive ways (e.g., facilitation) in a particular environment. Consequently, an understanding of the effects of the size and proximity of nearby trees offers insights into competitive and facilitative interactions in belowground systems [46].
Consequently, the present study (a) analyzed the variations in soil physicochemical properties and rock volume between two contrasting forest stands; and (b) investigated how the variation in root biomass and vertical root distribution are influenced by the topography, soil properties, tree influence index, and their relationships at the upper and lower slopes of warm-temperate forests in Mt. Duryun, Republic of Korea. In this study, we expect to observe variations in physicochemical properties and root biomass distribution between the two slope formations due to differences in soil profiles, microenvironments, and resource gradients. Exploring the distribution of root biomass across different topographic formations and analyzing its relationship with soil chemical properties, rock content, and stand structure improves our understanding of the complexities of belowground dynamics.
2. Results
2.1. Comparative Analysis of Soil Physicochemical Properties between Lower and Upper Slope Positions
The soil texture in both research sites is predominantly silty loam (Table 1). The bulk density (BD) increased with soil depth in the lower slope, while a similar pattern was observed in the sand proportion at the upper slope. The organic matter (OM), available phosphorus (AP), Ca2+, and Mg2+ at the lower slope showed a reversed pattern. Both lower and upper slopes showed decreasing total nitrogen (TN), cation exchange capacity (CEC), and K+ with soil depth.

Table 1.
Soil physicochemical properties at the upper and lower slopes of warm-temperate forests in Mt. Duryun in Haenam Province, Republic of Korea.
2.2. Relationship between Soil Chemical Properties and Root Biomass
Linear mixed-effects models generally revealed significant positive relationships between root biomass and soil physical properties across diameter classes, except for BD, which exhibited a strong negative correlation (βstd = −0.47) with biomass of coarse roots (>10 mm) (Table 2).
Table 2.
Linear mixed-effects models (LME) summarizing the influence of soil physicochemical properties on fine (0–2 mm), small (2–5 mm), medium (5–10 mm), and coarse roots (>10 mm) in the lower and upper slopes of warm-temperate forests of Mt. Duryun in Haenam Province, Republic of Korea.
Soil pH, TN, and CEC exhibited negative correlations with root biomass, with particularly strong associations observed for fine roots (0–2 mm) (βstd = −1.03), medium roots (5–10 mm) (βstd = −6.30), and small roots (βstd = −1.51), respectively. Contrarily, K+ was strongly and positively correlated with medium-to-coarse root biomass. AP exhibited significant positive and negative correlation with fine and small root biomass, respectively.
2.3. Root Biomass Distribution
The vertical root distribution varied significantly across soil depths (Figure 1; Table 3). Root biomass was 10–15% higher in the upper slope compared to the lower slope, particularly evident in fine (median = 52.0 g m2–65.64 g m2) and medium roots (median = 56.04 g m2–69.52 g m2) at soil depths of 0–20 cm. On the upper slope, the distribution of fine and small roots tended to decrease with soil depth, whereas on the lower slope, the distribution of medium roots tended to increase with depth. The vertical distribution of coarse roots generally remains consistent across soil depths, irrespective of the topographical position.
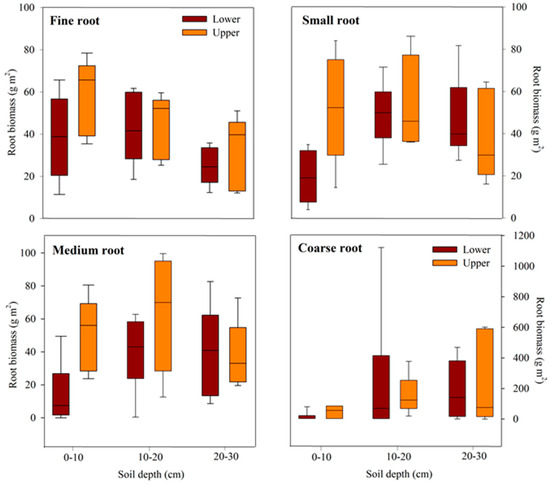
Figure 1.
Vertical biomass distribution of fine (0–2 mm), small (2–5 mm), medium (5–10 mm), and coarse roots (>10 mm) on the lower and upper slopes of warm-temperate forests of Mt. Duryun in Haenam Province, Republic of Korea. The box represents the interquartile range, whiskers show the maximum and minimum values, and the midline represents the median.
Table 3.
Depthwise distribution of root biomass (g m2) across diameter classes on the upper and lower slopes of Mt. Duryun in Haenam Province, Republic of Korea.
2.4. Rock Volume and Its Relationship with Root Biomass
Rock fragments occupied 16–40% of the total ground volume on the lower slope and 15–44% on the upper slope (Table S1) with a significantly higher rock volume on the lower slope up to a depth of 10 cm (p = 0.04). In the lower slope, at a soil depth of 0–10 cm, there was a decrease in both medium and coarse root biomass with an increase in rock volume but this relationship is not statistically significant (Table 4). A different trend was observed in the upper slope, where fine root biomass exhibited a strong negative correlation (rho = −0.70 to −0.90) with rock distribution across soil depths. Notably, a similarly strong negative correlation (−0.84) was observed between small and medium root biomass and rock distribution, particularly those found at depths of 10–20 cm. While there may be apparent trends in the data, these strong relationships between variables observed in the upper slopes were also not statistically significant.
Table 4.
Partial Spearman rank correlation coefficients describing the strength of fine (0–2 mm), small (2–5 mm), medium (5–10 mm), and coarse root (>10 mm) biomass relationships with rock distribution in warm-temperate forests in the lower and upper slopes of Mt. Duryun in Haenam Province, Republic of Korea.
2.5. Relationship between Tree Influence Index and Root Biomass
The results of the Spearman rank correlation analysis demonstrated that there was no significant relationship between root biomass and the tree influence index at various proximities and root diameter classes in the lower slope (Table 5). In contrast, the upper slope revealed a statistically significant relationship between these two factors. The majority of the distances on the upper slope had strong and significant relationships with fine root biomass, and the proximity of 4–5 m demonstrated the strongest negative correlation (rho = −0.78).
Table 5.
Partial Spearman rank correlation coefficients describing the strength of fine (0–2 mm), small (2–5 mm), medium (5–10 mm), and coarse root (>10 mm) biomass correlation with tree influence index at different proximity from the excavation midpoint in warm-temperate forests in the lower and upper slopes of Mt. Duryun in Haenam Province, Republic of Korea.
3. Discussion
3.1. Topography-Driven Changes in Soil Physicochemical Properties Largely Explain Root Biomass Distribution
Roots are sensitive to changes in soil physicochemical properties that may differ depending on topography [47]. In this study, the significant variation in root biomass between the upper and lower slopes, with greater root biomass in the upper slope, can be attributed to topography-driven changes in soil physicochemical properties. Specifically, we found a lower AP in the upslope than in the downslope, which could affect especially the distribution of fine root biomass. Plants produce more fine roots and generate more lateral roots in response to low P conditions to improve P absorption [48]. This also holds true for other essential resources, such as water and nitrogen [49,50]. Hence, a greater accumulation of fine roots may indicate limited essential resources in the upper slope, leading plants to direct root growth at depths of 10–20 cm for better resource exploration and uptake [51]. Greater root biomass concentration on the upper slope was also observed for pine plantations and cool-temperate forests in Japan [17,52], semi-arid forests and karst ecosystems in China [15,23], and a dry tropical forest in Thailand [53].
A decreasing distribution pattern of fine and small roots with soil depth on the upper slope may be caused by an increase in the sand proportion with soil depth. A high sand content may have resulted in a much drier and more nutrient-deficient soil as depth increased and water drained more quickly, which is not conducive to fine and small-sized roots [54,55]. This supports our study’s findings of decreasing TN, CEC, and K+ with soil depth in the upper slope. The spatial nutrient heterogeneity across slopes can be attributed to the transport-accumulation mechanism occurring at the research site. Nutrients are transported downward and deposited on the lower slope over time by erosion, overland flow, and other geohydrological processes, thus decreasing nutrient and water availability on the upper slope [19,20]. Contrary to our findings, soil layers deeper than 30 cm accounted for a larger fraction of fine-root standing biomass than shallower depths [56]. A previous study also revealed a drought-induced increase in fine root biomass across experimental periods [57]. This contrasting pattern observed in earlier studies could be attributed to the absence of slope effects, which can have a substantial impact on root biomass distribution patterns and responses to environmental conditions.
The negative correlation between root biomass and rock volume, although not statistically significant, also suggests the potential influence of a high sand proportion on reducing fine and small root distribution at the deeper soil layer in the upper slope. Such a correlation may have potentially influenced root distribution more prominently as depth increases through modification in soil structure and water and nutrient retention [58]. Although the upper slope had a substantially lower rock volume than the lower slope, the presence of rocks, even in small quantities, can impede root penetration and consequently root distribution. This supports the strong negative correlation between bulk density and coarse roots, suggesting that the higher rock fragments in the lower slope may have reduced bulk density, influencing root growth. Small rock fragments can be carried by run-off, accumulating on lower slopes and leading to high rock fragment deposits on the soil surface [59,60]. Our findings are comparable with those of Zhongjie et al. [29], who reported lower rock fragments on the upper slopes than on the middle and lower slopes in the Liupan Mountains of China. Moreover, rock fragments can be favorable for plant growth within a limited range, the effects of which can be reversed beyond a site-specific threshold [34,61,62,63]. The over-deposition of rocks could weaken soil water capacity and hydraulic conductivity, which reduces available moisture for plant consumption [35]. Under these conditions, some species can promote vertical elongation, allowing them to extract a greater amount of water in an attempt to overcome resource limitations [34,62]. This leads to root biomass depletion in areas with higher rock volumes, as exemplified by the small and medium roots in our study.
3.2. Competitive and Facilitative Effects Can Elucidate the Relationship between Root Biomass and Tree Influence Index
Roots interact with both abiotic and biotic factors, such as the roots of other plants. This interaction is influenced by resource gradients and by mechanisms that inhibit access of other roots to resources [64]. This can elucidate the observed statistically significant negative relationship between the tree influence index and root biomass on the upper slopes, particularly for fine roots at a 4–5 m tree distance. Such a negative relationship suggests competitive interactions between trees and fine roots for resources in the upper slope. Thus, the data also show that the tree influence at a 4–5 m tree distance decreased on the upper slope, resulting in a much greater fine root biomass. Generally, fine roots extend over certain distances away from the parent tree [44] to efficiently forage resources. Our results partially coincide with Yanai et al. [46] and Jiang et al. [25], who reported positive fine root biomass responses to trees located at a 2–5 m radius. Similarly, Jochheim et al. [65] reported fine root density to peak at a 2.5 m distance, followed by a decrease towards the tree stem and canopy gap. In stands as dense as in the upper slope, the root growth can be limited by intense belowground competition and overlapping systems, unlike in low-density stands where roots can spread longer and more uniformly [42,66].
Moreover, it is plausible that resource competition may have been greater uphill than downhill, explaining the lack of a significant relationship between the tree influence index and root biomass in the lower slope, which is typically more resource-rich. The observed increased proportion of sand with soil depth in the upper slope may also explain the negative relationship between the tree influence index and root biomass, intensifying resource competition due to reduced water retention and nutrient availability. In a previous study, fine root mass and length density were more than three times greater on nutrient-poor sandy soils than on nutrient-rich clay soils [67]. Several studies also reported an increase in fine root production by 21–35% under water-limited conditions [68,69].
The morphological differences in root diameters may also contribute to the observed result. Here, we found a significant positive relationship between the tree influence index and biomass evident only for small roots in the upper slopes. This implies that small root biomass can increase in response to an increased influence from surrounding trees, possibly due to a facilitation mechanism by the tree presence [70,71]. The presence of nearby trees within a 3–4 m distance from the pit may have ameliorated abiotic stresses caused by the limited supply of soil nutrients and moisture and harsh microclimatic conditions in the upper slope [71]. In this study, we identified Camellia japonica L. and Cinnamomum japonicum Siebold as two of the dominant tree species within a 3–4 m radius of the pit on the upper slope (Table S2). Future research can investigate whether these two species have a facilitating influence on the root growth of nearby tree species.
4. Materials and Methods
4.1. Site Description
This study was conducted in a warm-temperate forest located at Mt. Duryun in Haenam Province, Republic of Korea (34°28′50″ N, 126°36′52″ E) (Figure 2). Mt. Duryun, a 700 m high montane ecosystem on the south-western side of the Republic of Korea, forms diverse and well-defined communities of deciduous and evergreen forest trees. However, very limited research has been conducted in Mt. Duryun, particularly about the belowground system.
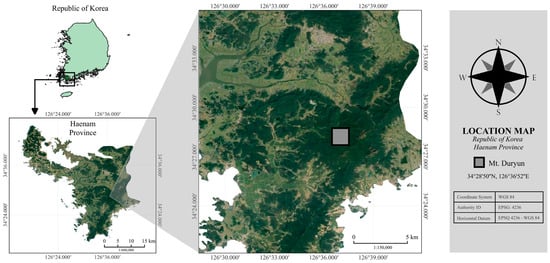
Figure 2.
Geographical location of Mt. Duryun in the Haenam Province, Republic of Korea, where the experiment was conducted. All geospatial features are illustrated via EPSQ: 4236—WGS 84 horizontal datum.
With the unique assemblage of plant species distributed across different slope formations, Mt. Duryun is an ideal experimental site for investigating the extent and mechanisms underlying root biomass and distribution based on topography. The area is positioned at an altitude of 195 m and comprises a secondary successional forest that is home to a range of deciduous and evergreen broadleaf tree species [72]. The dominant climate type is humid subtropical (Cfa), with a long-term (1990–2022) normal temperature of 13.5 °C and total annual precipitation of 1273.5 mm.
Two contrasting stands were designated as research sites based on topographic position, tree density, basal area (BA), tree diameter at breast height (DBH), and species diversity (Table 6). The first stand (hereafter, lower slope) is a relatively flat area oriented at ≤3°. The lower slope is distinguished by a distinct canopy stratum dominated by Camellia japonica L., Cornus controversa Hemsl., and Ulmus davidiana Planch. C. japonica occupies 44% of the total basal area (BA) at 11.9 m2 ha−1, followed by C. controversa and U. davidiana at 8.4 m2 ha−1 (24% of the total BA) and 6.7 m2 ha−1 (22% of the total BA), respectively. The second stand (hereafter, upper slope) is located 100 m north of the first stand and has a slope equivalent to 30°. The upper slope presents a clear vertical forest structure with a pronounced understory layer and a canopy layer populated by Platycarya strobilacea Siebold & Zucc., Carpinus tschonoskii Maxim., and Camellia japonica L. Unlike the lower slope, the upper slope has a relatively less variable BA distribution shared by P. strobilacea at 28% (14.6 m2 ha−1), C. tschonoskii at 16% (7.4 m2 ha−1), and C. japonica at 14% (7.2 m2 ha−1).
Table 6.
Stand structure of warm-temperate forests in the lower and upper slopes of Mt. Duryun in Haenam Province, Republic of Korea.
4.2. Excavation of Soil Pits
Eleven 400 m2 sampling plots, five on the lower slope and six on the upper slope, about 20 m apart, were established at the research site. The distance between the research sites was maintained at 25 to 35 m to ensure that any observed results were independent of each other. A grid-like, wooden reference plate was randomly installed per plot, with no recent disturbances after the initial clearing of the organic layer. In each sampling plot, a 50 cm × 50 cm pit was excavated to a depth of 30 cm, with soil samples retrieved and separated into intervals of 0–10 cm, 10–20 cm, and 20–30 cm. Rocks were segregated from roots at each depth interval using a sieve with a 6 mm opening. The soil passing through the sieve was collected for further root processing. The cumulative volume of rock fragments (>6 mm) was measured directly via the water displacement method.
4.3. Root Sorting and Biomass Measurement
The collected root samples were stored below freezing temperatures until further processing in the laboratory. Each sample was rinsed with tap water over a double-layered plastic net to minimize the loss of roots during washing. Thereafter, samples were air-dried and then subjected to visual inspection to eliminate dead roots. Dead fine roots were distinguished from their living counterparts by their brittle and dark exteriors [46]. The remaining root samples were stratified into four distinct sizes: 0–2 mm (fine), 2–5 mm (small), 5–10 mm (medium), and >10 mm (coarse) [53,73]. Root dry weight was measured for each diameter class using a standard laboratory balance after oven-drying at 65 °C for one week.
4.4. Effect of Size and Proximity of Nearby Trees
The effect of proximity of nearby trees (stems with >2 cm diameter at breast height—DBH) on root biomass at each sampling site was determined using a tree influence index (Indextree) at various proximities and root diameter classes [46]. The tree influence index is denoted by the following equation:
where t is the number of trees within a specified distance from the pit, DBHi is the diameter of tree i, and di is the distance of tree i from the excavation midpoint.
Trees within the first five-meter range of each pit were inventoried by recording their DBH and proximity to the excavation midpoint. Four proximities of 2 m, 3 m, 4 m, and 5 m were identified (Figure S1). Indextree was determined for each range category by obtaining the sum of squares of all DBH estimates at a given range divided by the sum of their proximity to the excavation midpoint. The relationship between root biomass and Indextree was analyzed for each sampling point.
4.5. Soil Physicochemical Analysis
The soil samples (N = 11) were collected from each research site for a soil physicochemical property analysis in the laboratory. The soil bulk density (BD) was determined for each sample using a core sampling method after drying the samples for three days at 105 °C. The total porosity was calculated using the equation 1-BD/particle density ×100 [74]. Soil texture (sand, silt, and clay) and organic matter (OM) were determined by the hydrometer method at 30 °C and the Tyurin method, respectively. Soil pH was estimated in a 1:5 (w/v) soil-distilled water suspension using a soil pH meter. Total nitrogen (TN) was extracted by digesting 1 g of soil into a concentrated H2SO4 solution using the micro-Kjeldahl method. Available phosphorus (P2O5; AP) was measured through the Lancaster method, and exchangeable cations (K+, Ca2+, and Mg2+) were analyzed using an atomic absorption spectrometer (AAS Varian, AA280FS, Santa Clara, CA, USA) after dissolving samples in a 1N NH4OAc extract. Cation exchange capacity (CEC) was analyzed in 1N NH4OAc and 1N CH3COOH solutions using the Brown method. Soil OM and nutrient content were calculated by multiplying nutrient concentration with bulk density and soil depth per research site.
4.6. Statistical Analyses
The datasets were tested for normality and heterogeneity of variance using the Shapiro–Wilk test and Levene’s test, respectively. Soil physicochemical traits, fine root biomass, and rock distribution values were compared between different topographic positions and across depths using Quade’s non-parametric rank analysis of covariance, with species composition and stand structure treated as nuisance covariates. Independent pairwise comparisons were conducted for all significantly different means with more than two levels (i.e., depth) using Dunn’s Test. The resulting alpha values were adjusted using the Bonferroni correction to account for the number of performed pairwise comparisons and to reduce the likelihood of a Type 1 error. The same set of analyses was performed to identify differences in fine root biomass distribution by diameter class at each topographic position.
Linear-mixed effect models (LMMs) were generated to explore the relationships between fine root biomass and soil physicochemical traits for each diameter class. In this analysis, fine root biomass was considered as the response variable, soil physicochemical traits as fixed effect terms, and topography and species composition as random effect terms. The most parsimonious models were extracted using the dredge function of the MuMin package, and the standardized beta coefficient, standard error, and p-value of each fixed term were identified for each model.
A partial Spearman’s rank correlation was conducted to determine the strength of the relationship between fine root biomass and rock volume while adjusting for observation-level differences in species composition and stand structure. Rank correlation coefficients, along with their respective p-values, were determined for each diameter level and depth interval on the lower and upper slopes. The same approach was used to investigate the relationship between fine root biomass distribution and the surrounding trees at different levels of proximity. In this analysis, rank correlation coefficients were calculated at cumulative distances of 2, 3, 4, and 5 m, as well as within ranges of 2–3, 3–4, and 4–5 m. All analyses were performed in RStudio (version 4.2.3) at an α = 0.05 significance level.
5. Conclusions
The present study revealed interesting patterns in root biomass distribution influenced by topography, soil physicochemical properties, and tree influence. Here, topography-driven changes in soil physicochemical properties largely explain root biomass distribution along a gradient of soil depth. Moreover, both competitive and facilitative interactions also help elucidate the relationship between root biomass and the tree influence index across diameter classes and soil depths in Mt. Duryun in Republic of Korea. Therefore, our results have proven that the differences in the soil environment and topographical positions play crucial roles in shaping root biomass distribution across soil profile gradients. The findings of the present study will enhance our understanding of the different abiotic factors that determine belowground productivity. Future research can explore soil deeper layers (>30 cm) for a more comprehensive understanding of root–soil interactions and ecosystem functioning.
Supplementary Materials
The following supporting information can be downloaded at: https://www.mdpi.com/article/10.3390/plants13101340/s1, Table S1. Volumetric rock fragment content (%) on the lower and upper slopes of Mt. Duryun in Haenam Province, Republic of Korea; Table S2. Mean Diameter at Breast Height (DBH) of dominant tree species in relation to various distances from the excavated pit in the lower and upper slopes in Mt. Duryun, Haenam Province, Republic of Korea; Figure S1. Distances from midpoints (pit) excavated in the research site in Mt. Duryun, Haenam Province, Republic of Korea.
Author Contributions
Conceptualization, J.I.C. and B.B.P.; methodology, J.I.C. and B.B.P.; formal analysis, J.I.C. and B.B.P.; investigation, J.I.C., B.B.P., M.B.C., L.T.N.T., J.Y.A. and W.B.Y.; writing—original draft preparation, J.I.C.; writing—review and editing, M.B.C., J.O.H., L.T.N.T., J.Y.A. and B.B.P.; visualization, J.I.C.; supervision, B.B.P. and J.Y.A.; project administration, B.B.P. All authors have read and agreed to the published version of the manuscript.
Funding
This study was carried out with the support of the ‘R&D Program for Forest Science Technology (Project No. 2022461B10-2424-0201)’ provided by the Korea Forest Service (Korea Forestry Promotion Institute). This study was also supported by a National Research Foundation of Korea (NRF) grant funded by the Korean government (MSIT) (No. 2021R1A2C201017812).
Data Availability Statement
The data presented in this study are available within the article.
Acknowledgments
We would like to express our deepest appreciation to the members of the Silviculture Laboratory at the Department of Forest Resources, Chungnam National University, for their inestimable contribution to this research.
Conflicts of Interest
The authors declare no conflicts of interest.
References
- Warren, J.M.; Hanson, P.J.; Iversen, C.M.; Kumar, J.; Walker, A.P.; Wullschleger, S.D. Root structural and functional dynamics in terrestrial biosphere models—Evaluation and recommendations. New Phytol. 2015, 205, 59–78. [Google Scholar] [CrossRef]
- Ribeiro, J.A.H.; Almeida, L.H.D.D.; Souza, T.G.D.; Lima, P.L.S.; Cardoso, S.D.S.; Souza, P.H.P.D.; Lacerda, F.D.C.B. Ecosystem importance of roots: A literature review. Res. Soc. Dev. 2024, 13, e0313345177. [Google Scholar] [CrossRef]
- Vogt, K.A.; Vogt, D.J.; Palmiotto, P.A.; Boon, P.; O’Hara, J.; Asbjornsen, H. Review of root dynamics in forest ecosystems grouped by climate, climatic forest type and species. Plant Soil 1995, 187, 159–219. [Google Scholar] [CrossRef]
- Jackson, R.B.; Mooney, H.A.; Schulze, E.D. A global budget for fine root biomass, surface area, and nutrient contents. Proc. Nat. Acad. Sci. USA 1997, 94, 7362–7366. [Google Scholar] [CrossRef] [PubMed]
- Zhao, R.; Zhu, Y.; Mao, Z.; Gu, W.; Zhang, H.; Long, F.; Sun, T. Predicting fine root decomposition from functional traits in 10 temperate tree species. Forests 2023, 14, 372. [Google Scholar] [CrossRef]
- Mao, Z.; Saint-André, L.; Bourrier, F.; Stokes, A.; Cordonnier, T. Modelling and predicting the spatial distribution of tree root density in heterogeneous forest ecosystems. Ann. Bot. 2015, 116, 261–277. [Google Scholar] [CrossRef] [PubMed]
- Chiatante, D.; Scippa, G.S. Root architecture: Influence of metameric organization and emission. Plant Biosyst. 2006, 140, 307–320. [Google Scholar] [CrossRef]
- Hertel, D.; Schöling, D. Below-ground response of Norway spruce to climate conditions at Mt. Brocken (Germany)—A re-assessment of Central Europe’s northernmost treeline. Flora 2011, 206, 127–135. [Google Scholar] [CrossRef]
- Díaz, S.; Kattge, J.; Cornelissen, J.H.C.; Wright, I.J.; Lavorel, S.; Dray, S.; Reu, B.; Kleyer, M.; Wirth, C.; Prentice, C.; et al. The global spectrum of plant form and function. Nature 2016, 529, 167–171. [Google Scholar] [CrossRef]
- Cheng, N.N.; He, H.M.; Yang, S.Y.; Lu, Y.J.; Jing, Z.W. Impacts of topography on sediment discharge in Loess Plateau, China. Quat. Int. 2017, 440, 119–129. [Google Scholar] [CrossRef]
- Zhou, W.; Li, C.; Zhao, W.; Stringer, L.C.; Fu, B. Spatial distributions of soil nutrients affected by land use, topography and their interactions, in the Loess Plateau of China. Int. Soil Water Conserv. Res. 2024, 12, 227–239. [Google Scholar] [CrossRef]
- Chiatante, D.; Scippa, S.G.; Di Iorio, A.; Sarnataro, M. The influence of steep slopes on root system development. J. Plant Growth Regul. 2002, 21, 247–260. [Google Scholar] [CrossRef]
- Rahman, M.M.; Adzkia, U.; Rachmadiyanto, A.N.; Dwiyanti, F.G.; Nandika, D.; Nugroho, N.; Siregar, I.Z.; Karlinasari, L. Coarse root distribution of Vatica pauciflora (Korth.) Blume in different soil slopes as revealed by root detector. IOP Conf. Ser. Earth Environ. Sci. 2021, 918, 012046. [Google Scholar] [CrossRef]
- Shrestha, M.B.; Horiuchi, M.; Yamadera, Y.; Miyazaki, T. A study on the adaptability mechanism of tree roots on steep slopes. In The Supporting Roots of Trees and Woody Plants: Form, Function and Physiology. Developments in Plant and Soil Sciences, 1st ed.; Strokes, A., Ed.; Kluwer Academic Publishers: Dordrecht, The Netherlands, 2000; Volume 87, pp. 51–57. [Google Scholar]
- Tateno, R.; Taniguchi, T.; Zhang, J.; Shi, W.Y.; Zhang, J.G.; Du, S.; Yamanaka, N. Net primary production, nitrogen cycling, biomass allocation, and resource use efficiency along a topographical soil water and nitrogen gradient in a semi-arid forest near an arid boundary. Plant Soil 2017, 420, 209–222. [Google Scholar] [CrossRef]
- Espeleta, J.; Clark, D.A. Multi-scale variation in fine-root biomass in a tropical rain forest: A seven-year study. Ecol. Monogr. 2007, 77, 377–404. [Google Scholar] [CrossRef]
- Tateno, R.; Hishi, T.; Takeda, H. Above-and belowground biomass and net primary production in a cool-temperate deciduous forest in relation to topographical changes in soil nitrogen. For. Ecol. Manag. 2004, 193, 297–306. [Google Scholar] [CrossRef]
- Wang, T.; Kang, F.; Cheng, X.; Han, H.; Bai, Y.; Ma, J. Spatial variability of organic carbon and total nitrogen in the soils of a subalpine forested catchment at Mt. Taiyue, China. Catena 2017, 155, 41–52. [Google Scholar] [CrossRef]
- Tsui, C.C.; Chen, Z.S.; Hsieh, C.F. Relationships between soil properties and slope position in a lowland rain forest of southern Taiwan. Geoderma 2004, 123, 131–142. [Google Scholar] [CrossRef]
- Miheretu, B.A.; Yimer, A.A. Spatial variability of selected soil properties in relation to land use and slope position in Gelana sub-watershed, Northern highlands of Ethiopia. Phys. Geogr. 2018, 39, 230–245. [Google Scholar] [CrossRef]
- Zhang, S.; Jiang, L.; Liu, X.; Zhang, X.; Fu, S.; Dai, L. Soil nutrient variance by slope position in a Mollisol farmland area of Northeast China. Chin. Geogr. Sci. 2016, 26, 508–517. [Google Scholar] [CrossRef]
- Poorter, H.; Niklas, K.J.; Reich, P.B.; Oleksyn, J.; Poot, P.; Mommer, L. Biomass allocation to leaves, stems and roots: Meta-analyses of interspecific variation and environmental control. New Phytol. 2012, 193, 30–50. [Google Scholar] [CrossRef]
- Pan, F.; Qian, Q.; Liang, Y.; Wang, K.; Zhang, W. Spatial variations in fine root turnover, biomass, and necromass of two begetation types in a Karst Ecosystem, southwestern China. Forests 2022, 13, 611. [Google Scholar] [CrossRef]
- Yuan, Z.Y.; Chen, H.Y.H. Fine root biomass, production, turnover rates, and nutrient contents in boreal forest ecosystems in relation to species, climate, fertility, and stand age: Literature review and meta-analyses. Crit. Rev. Plant Sci. 2010, 29, 204–221. [Google Scholar] [CrossRef]
- Jiang, P.; Wang, H.; Fu, X.; Dai, X.; Kou, L.; Wang, J. Elaborate differences between trees and understory plants in the deployment of fine roots. Plant Soil 2018, 431, 433–447. [Google Scholar] [CrossRef]
- Zheng, Y.; Chen, N.; Zhang, C.; Dong, X.; Zhao, C. Effects of rock fragments on the soil physicochemical properties and vegetation on the northeastern tibetan plateau. Front. Environ. Sci. 2021, 9, 693769. [Google Scholar] [CrossRef]
- Rabot, E.; Wiesmeier, M.; Schlüter, S.; Vogel, H.J. Soil structure as an indicator of soil functions: A review. Geoderma 2018, 314, 122–137. [Google Scholar] [CrossRef]
- Ceacero, C.J.; Díaz-Hernández, J.L.; Campo, A.D.D.; Navarro-Cerrillo, R.M. Soil rock fragment is stronger driver of spatio-temporal soil water dynamics and efficiency of water use than cultural management in holm oak plantations. Soil Tillage Res. 2020, 197, 104495. [Google Scholar] [CrossRef]
- Zhongjie, S.; Yanhui, W.; Pengtao, Y.; Lihong, X.; Wei, X.; Hao, G. Effect of rock fragments on the percolation and evaporation of forest soil in Liupan Mountains, China. Acta Ecol. Sin. 2008, 28, 6090–6098. [Google Scholar] [CrossRef]
- Zhu, Y.; Shao, M. Spatial distribution of surface rock fragment on hill-slopes in a small catchment in wind-water erosion crisscross region of the Loess Plateau. Sci. China Ser. D Earth Sci. 2008, 51, 862–870. [Google Scholar] [CrossRef]
- Chen, H.; Liu, J.; Wang, K.; Zhang, W. Spatial distribution of rock fragments on steep hillslopes in karst region of northwest Guangxi, China. Catena 2011, 84, 21–28. [Google Scholar] [CrossRef]
- Babalola, O.; Lal, R. Subsoil gravel horizon and maize root growth: I. Gravel concentration and bulk density effects. Plant Soil 1977, 46, 337–346. [Google Scholar] [CrossRef]
- Lison, C.A.; Cross, A.T.; Stevens, J.C.; Valliere, J.M.; Dixon, K.; Veneklaas, E. High rock content enhances plant resistance to drought in saline topsoils. J. Arid Environ. 2021, 193, 104589. [Google Scholar] [CrossRef]
- Poesen, J.; Lavee, H. Rock fragments in top soils: Significance and processes. Catena 1994, 23, 1–28. [Google Scholar] [CrossRef]
- Novák, V.; Kňava, K. The influence of stoniness and canopy properties on soil water content distribution: Simulation of water movement in forest stony soil. Eur. J. For. Res. 2012, 131, 1727–1735. [Google Scholar] [CrossRef]
- Du, Z.; Cai, Y.; Yan, Y.; Wang, X. Embedded rock fragments affect alpine steppe plant growth, soil carbon and nitrogen in the northern Tibetan Plateau. Plant Soil 2017, 420, 79–92. [Google Scholar] [CrossRef]
- Faget, M.; Nagel, K.A.; Walter, A.; Herrera, J.M.; Jahnke, S.; Schurr, U.; Temperton, V.M. Root–root interactions: Extending our perspective to be more inclusive of the range of theories in ecology and agriculture using in-vivo analyses. Ann. Bot. 2013, 112, 253–266. [Google Scholar] [CrossRef]
- Bolte, A.; Rahmann, T.; Kuhr, M.; Pogoda, P.; Murach, D.; Gadow, K. Relationships between tree dimension and coarse root biomass in mixed stands of European beech (Fagus sylvatica L.) and Norway spruce (Picea abies [L.] Karst.). Plant Soil 2004, 264, 1–11. [Google Scholar] [CrossRef]
- Lavigne, M.; Krasowski, M. Estimating coarse root biomass of balsam fir. Can. J. For. Res. 2007, 37, 991–998. [Google Scholar] [CrossRef]
- Douglas, G.B.; McIvor, I.R.; Potter, J.F.; Foote, L.G. Root distribution of poplar at varying densities on pastoral hill country. Plant Soil 2010, 333, 147–161. [Google Scholar] [CrossRef]
- Bo, H.; Wen, C.; Song, L.; Yue, Y.; Nie, L. Fine-root responses of Populus tomentosa forests to stand density. Forests 2018, 9, 562. [Google Scholar] [CrossRef]
- Farooq, T.H.; Wu, W.; Tigabu, M.; Ma, X.; He, Z.; Rashid, M.H.U.; Gilani, M.M.; Wu, P. Growth, biomass production and root development of Chinese fir in relation to initial planting density. Forests 2019, 10, 236. [Google Scholar] [CrossRef]
- Puri, S.; Singh, V.; Bhushan, B.; Singh, S. Biomass production and distribution of roots in three stands of Populus deltoides. For. Ecol. Manag. 1994, 65, 135–147. [Google Scholar] [CrossRef]
- Moreno, G.; Obrador, J.J.; Cubera, E.; Dupraz, C. Fine root distribution in dehesas of central-western Spain. Plant Soil 2005, 277, 153–162. [Google Scholar] [CrossRef]
- Kumar, B.M.; Jose, S. Phenotypic plasticity of roots in mixed tree species agroforestry systems: Review with examples from peninsular India. Agrofor. Syst. 2018, 92, 59–69. [Google Scholar] [CrossRef]
- Yanai, R.D.; Park, B.B.; Hamburg, S.P. The vertical and horizontal distribution of roots in northern hardwood stands of varying age. Can. J. For. Res. 2006, 36, 450–459. [Google Scholar] [CrossRef]
- Liu, R.; Pan, Y.; Bao, H.; Liang, S.; Jiang, Y.; Tu, H.; Nong, J.; Huang, W. Variations in soil physico-chemical properties along slope position gradient in secondary vegetation of the hilly region, Guilin, Southwest China. Sustainability 2020, 12, 1303. [Google Scholar] [CrossRef]
- Zhang, C.; Simpson, R.J.; Kim, C.M.; Warthmann, N.; Delhaize, E.; Dolan, L.; Byrne, M.E.; Wu, Y.; Ryan, P.R. Do longer root hairs improve phosphorus uptake? Testing the hypothesis with transgenic Brachypodium distachyon lines overexpressing endogenous RSL genes. New Phytol. 2018, 217, 1654–1666. [Google Scholar] [CrossRef]
- Yan, X.L.; Jia, L.; Dai, T. Fine root morphology and growth in response to nitrogen addition through drip fertigation in a Populus × euramericana “Guariento” plantation over multiple years. Ann. For. Sci. 2019, 76, 13. [Google Scholar] [CrossRef]
- Yang, X.; Lu, M.; Wang, Y.; Wang, Y.; Liu, Z.; Chen, S. Response Mechanism of Plants to Drought Stress. Horticulturae 2021, 7, 50. [Google Scholar] [CrossRef]
- Voothuluru, P.; Wu, Y.; Sharp, R.E. Not so hidden anymore: Advances and challenges in understanding root growth under water deficits. Plant Cell 2024, 36, 1377–1409. [Google Scholar] [CrossRef]
- Enoki, T.; Kawaguchi, H.; Iwatsubo, G. Topographic variations of soil properties and stand structure in a Pinus thunbergii plantation. Ecol. Res. 1996, 11, 299–309. [Google Scholar] [CrossRef]
- Takahashi, M.; Hirai, K.; Marod, D.; Anusontpornperm, S.; Limtong, P.; Leaungvutivirog, C.; Panuthai, S. Atypical pattern of soil carbon stocks along the slope position in a seasonally dry tropical forest in Thailand. Forests 2019, 10, 106. [Google Scholar] [CrossRef]
- Valdés, M.; Asbjornsen, H.; Gómez-Cárdenas, M.; Juárez, M.; Vogt, K.A. Drought effects on fine-root and ectomycorrhizal-root biomass in managed Pinus oaxacana Mirov stands in Oaxaca, Mexico. Mycorrhiza 2006, 16, 117–124. [Google Scholar] [CrossRef]
- Ji, L.; Wang, J.; Liu, Y.; Lu, Z.; Purahong, W.; Yang, Y. Drought- and soil substrate-induced variations in root nonstructural carbohydrates result from fine root morphological and anatomical traits of Juglans mandshurica seedlings. BMC Plant Biol. 2023, 23, 83. [Google Scholar] [CrossRef]
- Cordeiro, A.L.; Norby, R.J.; Andersen, K.M.; Valverde-Barrantes, O.; Fuchslueger, L.; Oblitas, E.; Hartley, I.P.; Iversen, C.M.; Gonçalves, N.B.; Takeshi, B.; et al. Fine-root dynamics vary with soil depth and precipitation in a low-nutrient tropical forest in the Central Amazonia. Plant Environ. Interact. 2020, 1, 3–16. [Google Scholar] [CrossRef]
- Zhou, G.; Zhou, X.; Liu, R.; Du, Z.; Zhou, L.; Li, S.; Liu, H.; Shao, J.; Wang, J.; Nie, Y.; et al. Soil fungi and fine root biomass mediate drought-induced reductions in soil respiration. Funct. Ecol. 2020, 34, 2634–2643. [Google Scholar] [CrossRef]
- Estrada-Medina, H.; Graham, R.C.; Allen, M.F.; Jiménez-Osornio, J.J.; Robles-Casolco, S. The importance of limestone bedrock and dissolution karst features on tree root distribution in northern Yucatán, México. Plant Soil 2013, 362, 37–50. [Google Scholar] [CrossRef]
- Poesen, J.W.; Van Wesemael, B.; Bunte, K.; Benet, A.S. Variation of rock fragment cover and size along semiarid hillslopes: A case-study from southeast Spain. Geomorphology 1998, 23, 323–335. [Google Scholar] [CrossRef]
- Li, X.Y.; Contreras, S.; Solé-Benet, A. Spatial distribution of rock fragments in dolines: A case study in a semiarid Mediterranean mountain-range (Sierra de Gádor, SE Spain). Catena 2007, 70, 366–374. [Google Scholar] [CrossRef]
- Mi, M.; Shao, M.A.; Liu, B. Effect of rock fragments content on water consumption, biomass and water-use efficiency of plants under different water conditions. Ecol. Eng. 2016, 94, 574–582. [Google Scholar] [CrossRef]
- Hu, H.; Li, F.L.; McCormack, M.L.; Huang, L.; Bao, W.K. Functionally divergent growth, biomass allocation and root distribution of two xerophytic species in response to varying soil rock fragment content. Plant Soil 2021, 463, 265–277. [Google Scholar] [CrossRef]
- Jiang, P.; Yan, J.; Liu, R.; Zhang, X.; Fan, S. Patterns of deep fine root and water utilization amongst trees, shrubs and herbs in subtropical pine plantations with seasonal droughts. Front. Plant Sci. 2023, 14, 1275464. [Google Scholar] [CrossRef] [PubMed]
- Schenk, H.J. Root competition: Beyond resource depletion. J. Ecol. 2006, 94, 725–739. [Google Scholar] [CrossRef]
- Jochheim, H.; Lüttschwager, D.; Riek, W. Stem distance as an explanatory variable for the spatial distribution and chemical conditions of stand precipitation and soil solution under beech (Fagus sylvatica L.) trees. J. Hydrol. 2022, 608, 127629. [Google Scholar] [CrossRef]
- Cui, Q.; Feng, Z.; Yang, X. Distributions of fine and coarse tree roots in a semi-arid mountain region and their relationships with soil properties. Trees 2017, 31, 607–616. [Google Scholar] [CrossRef]
- Weemstra, M.; Sterck, F.J.; Visser, E.J.W.; Kuyper, T.W.; Goudzwaard, L.; Mommer, L. Fine-root trait plasticity of beech (Fagus sylvatica) and spruce (Picea abies) forests on two contrasting soils. Plant Soil 2017, 415, 175–188. [Google Scholar] [CrossRef]
- Wang, C.; Sun, Y.; Zou, X.; Chen, H.Y.H.; Delgado-Baquerizo, M.; Yang, J.; Wang, G.; Liu, Y.; Ruan, H. Increased fine root production coupled with reduced aboveground production of plantations under a three-year experimental drought. Sci. Total Environ. 2024, 908, 168370. [Google Scholar] [CrossRef] [PubMed]
- Hernandez, J.O.; An, J.Y.; Combalicer, M.S.; Chun, J.P.; Oh, S.K.; Park, B.B. Morpho-anatomical traits and soluble sugar concentration largely explain the responses of three deciduous tree species to progressive water stress. Front. Plant Sci. 2021, 12, 738301. [Google Scholar] [CrossRef] [PubMed]
- Moustakas, A.; Kunin, W.E.; Cameron, T.C.; Sankaran, M. Facilitation or competition? Tree effects on grass biomass across a brecipitation gradient. PLoS ONE 2013, 8, e57025. [Google Scholar] [CrossRef]
- Trogisch, S.; Liu, X.; Rutten, G.; Xue, K.; Bauhus, J.; Brose, U.; Bu, W.; Cesarz, S.; Chesters, D.; Connolly, J.; et al. The significance of tree-tree interactions for forest ecosystem functioning. Basic Appl. Ecol. 2021, 55, 33–52. [Google Scholar] [CrossRef]
- Oh, K.K.; Choi, S.H. Vegetational structure and successional sere of warm temperate evergreen forest region, Korea. Korean J. Ecol. 1993, 16, 459–476. [Google Scholar]
- Tran, L.T.N.; An, J.Y.; Carayugan, M.B.; Hernandez, J.O.; Rahman, S.A.; Youn, W.B.; Carvalho, J.I.; Jo, M.S.; Han, S.H.; Nguyen, H.H.; et al. B Fine-root distribution and soil physicochemical property variations in four contrasting urban land-use types in South Korea. Plants 2024, 13, 164. [Google Scholar] [CrossRef] [PubMed]
- Allen, D.E.; Dalal, R.C.; Rennenberg, H.; Meyer, R.L.; Reeves, S.; Schmidt, S. Spatial and temporal variation of nitrous oxide and methane flux between subtropical mangrove sediments and the atmosphere. Soil Biol. Biochem. 2007, 39, 622–631. [Google Scholar] [CrossRef]
Disclaimer/Publisher’s Note: The statements, opinions and data contained in all publications are solely those of the individual author(s) and contributor(s) and not of MDPI and/or the editor(s). MDPI and/or the editor(s) disclaim responsibility for any injury to people or property resulting from any ideas, methods, instructions or products referred to in the content. |
© 2024 by the authors. Licensee MDPI, Basel, Switzerland. This article is an open access article distributed under the terms and conditions of the Creative Commons Attribution (CC BY) license (https://creativecommons.org/licenses/by/4.0/).