Article

Comparison of Silicon-Evoked Responses on Arsenic Stress between Different Dular Rice Genotypes

Fujian Provincial Key Laboratory of Agroecological Processing and Safety Monitoring, College of Life Sciences, Fujian Agriculture and Forestry University, Fuzhou 350002, China
*
Authors to whom correspondence should be addressed.
Plants 2021, 10(10), 2210; https://doi.org/10.3390/plants10102210
Submission received: 4 August 2021 / Revised: 13 October 2021 / Accepted: 14 October 2021 / Published: 18 October 2021
(This article belongs to the Special Issue Molecular and Physiological Basis of Abiotic Stress Tolerance)

Abstract

:
Arsenic is one of the most hazardous metalloids in nature, and due to its high water solubility, it is one of the most important causes of pollution. However, silicon reduces the uptake and transport of arsenic in rice. This study investigates the interaction of different arsenic and silicon levels on dry weight, protein content, and concentrations of arsenic and silicon in two different rice shoots and roots of Dular wild-type (DU-WT) and Dular Lsi1-overexpressed (DU-OE) rice. It should be noted that all seedlings were subjected to four different treatments. For RNA-seq and qPCR, the DU-WT genotype was selected as the control and DU-OE as the treatment. With the addition of silicone treatment, dry weight and protein content in the shoots and roots of both rice lines were increased, while the concentration of arsenic in these two organs was decreased. When seedlings were exposed to arsenic treatments, protein content, silicon concentration, and dry weight were decreased in both roots and shoots, while arsenic concentration was increased in both rice genotypes. The RNA-seq in DU-OE showed 5823 differentially expressed genes (DEGs), of which 2604 were up-regulated and 3219 down-regulated. Treatment of rice by arsenic and silicon has changed the expression of genes encoding cytokinin-responsive GATA transcription factor 1, protein IN2-1 homolog B, calcium-binding EGF domain-containing protein, Os01g0369700 protein, probable glutathione S-transferase GSTU1, glutathione S-transferase protein, Os09g0367700 protein, isocitrate dehydrogenase (NADP), and Os08g0522400 protein in the root of DU-OE. The present study’s findings showed that in the presence of silicon, the transgenic genotype is much more resistant to arsenic than the wild genotype of Dular rice.

1. Introduction

Heavy metals and metalloids are one of nature’s most persistent pollutants, and this property is one of the significant hazards facing the world. These metals do not decompose easily biologically and chemically; increasing the concentration of them in foods and the environment enhance their risk to the human body, including carcinogenesis, genetic mutations, bone damage, and metabolic and physiological effects such as kidney damage, lung problems, skin hazards, and others [1]. However, heavy metals in environmental pollution and their harmful effects on human health are not yet fully understood. Heavy metals enter the human body in various ways, and the most important pathway is eating foods, especially grains [2,3,4].
Arsenic (As) is a very toxic metalloid, which causes pollution in different countries around the world, like China, India, and the USA [5]. High levels of As in southeast Asian soils are due to the oxidation of sulfur-containing minerals in the Himalayas. These minerals form iron oxides when exposed to oxygen. Combining As with these iron oxides makes it more permeable to groundwater and soil [6]. As presented in several inorganic and organic kinds, the most important inorganic As kinds are dimethylarsinate (DMA) and methylarsonate (MMA), and the most important of organic kinds are arsenate (As(V)) and arsenite (As(III)) [6,7]. Groundwater is widely used in some areas for drinking, cooking, and irrigation of fields, and arsenic-contaminated water usage increases the concentration of arsenic in the soil and finally increases the uptake of arsenic in various plants [8].
When silicon (Si) combines with other elements, it constantly forms oxides or silicates and is absorbed as silicic acid in plants; it also participates in plant activities in the form of amorphous silica. Although Si is abundant in the earth’s crust, much of it is inaccessible to plants [9,10]. Si reduces heavy metals’ toxicity in plants by complicating and preventing the transfer of heavy metals from roots to shoots, breaking down heavy metal ions in plants, and stimulating antioxidant systems in plants [11].
According to the FAO, rice provides about 30% of energy and 20% of the protein needed by humans worldwide. Therefore, this crop is one of the most consumed grains in the food basket of 2.4 billion people worldwide, and the per capita consumption of this critical food production is about 58.8 kg per year [12,13].
Rice grows mainly in flooded conditions, and an anaerobic environment mainly increases the mobility and bioavailability of arsenic (As) [14]. There are two ways to uptake As in rice: (1) arsenite is one of the analogs of silicic acid and can be absorbed by plant roots via the silicic acid transport system; (2) arsenate is a chemical phosphate analog that plant roots can absorb through the phosphate transport protein systems [15]. Si consumption has been reported to decrease the concentration of arsenic in rice grains, stems, leaves, and husks and is also suitable for increasing rice plant growth, especially under biotic and abiotic stresses [16].
Research has shown that Lsi1 and Lsi2 are two carriers of Si in rice that also help transfer arsenic from the soil to rice [17]; therefore, As is transferred from the culture medium to rice through them [18]. Studies had shown that when Si was added to the culture medium, transgenic Lsi1 or Lsi1-overexpression inhibitor rice types were more resistant to cadmium (Cd) toxicity. It also seems that increasing the resistance of rice to Cd stress depends not only on the amount of silicon in the culture medium, but also on the expression of Lsi1 in rice [19]. The study has shown that suppressing the Lsi1 gene reduces As concentrations in rice shoots and roots [20].
In the present study, we tried to identify the physiological and molecular mechanisms involved in the absorption of silicon and arsenic in Dular rice lines, and it was hypothesized that some genes are involved in regulating As stress resistance in rice plants. This experiment compared the expression changes of different genes by adding Si to the culture medium in As stress in two different lines of Dular rice (including Dular wild-type and Dular Lsi1-overexpressed rice).

2. Materials and Methods

2.1. Rice Cultivation

The best seeds were selected from Dular wild-type (DU-WT) and Dular Lsi1-overexpressed (DU-OE) rice genotypes, and then the grains were sterilized with 1% H2O2 for 15 min and immersed in deionized water for 48 h. Rice seeds were placed in a petri dish for four days in a culture room at 28 °C, and after germination, the best seedlings were selected and transferred for planting under hydroponic conditions. The pots (2.5 L) were filled with a solution prepared by Cock, Yoshida [21] method with some modification; by adding HCl or NaOH, the pH of the culture medium was adjusted to 5.8. The culture medium was renewed once a week, and when the seedlings had three leaves, different treatments were added to the culture medium.
The seedlings were exposed to four different treatments, which included the following: control (CK) (I), 30 μM As (II), 0.70 mM Si (III), and 30 μM As + 0.70 mM Si (IV). The amount of sodium added to the culture medium by Na2SiO4·9H2O was compensated by adding NaCl to the culture medium.
One and two weeks after adding different treatments to the culture medium, samples were collected. Then, the shoot samples were cleaned with distilled water, but the root samples were washed with 0.5 mM CaCl2 solution and then cleaned with distilled water. Finally, all samples were quickly transferred to a freezer at −10 °C until their physiological characteristics were specified.
For transcriptomic analysis and quantitative RT-PCR, when seedlings had three leaves, they were treated with 30 μM As + 0.70 mM Si for three days. After collecting the seedlings, the root and shoot sections were separated and quickly transferred to a liquid nitrogen chamber at −196 °C. In this part of the experiment, DU-WT was considered as the control and DU-OE as the treatment.
The standard reference material used in this experiment was Guobiao standards (GB/T).

2.2. As Concentration Measurement

As concentration in different rice tissues were determined with Meharg and Jardineh methods [22]. Initially, 0.2 g of the samples were transferred to Kjeldahl tubes and combined with 1 mL of concentrated nitric acid. After the mixture was kept at room temperature for 24 h, 1 mL of H2O2 was added to the sample. Then for one hour, samples were exposed to a sand bath at 70 and 100 °C: The samples were cooled and filtered, and by adding distilled water, their volume was increased to 50 mL. Next, 1 mL of the filtered solution was mixed with 10% HCl, 5% potassium iodide, and 5% ascorbic acid, and with the addition of more distilled water, the volume increased to 10 mL. Finally, the concentration of As was measured with a hydride production apparatus using an atomic absorption spectrometry (Shimadzu 6200, Shimadzu Co., Kyoto, Japan) (FIG 100).

2.3. Dry Weight and Si Concentration Measurement

To dry the samples, they were exposed to 70 °C for two days. Then, for 20 min, the samples were pulverized and digested by 50% (w/w) NaOH at 121 °C [23]. The concentration of silicon in digested solution was specified through the colorimetric molybdenum blue method [24].

2.4. Soluble Protein Contents Measurement

The Bradford [25] method was used to measure the soluble protein content. Samples of plant material were powdered with liquid nitrogen using precooled mortars and pestles. Each sample supernatant and working standard solution were transferred to assay tubes. A blank containing 20 µL extraction buffer must also be prepared. Then, 1 mL of Bradford solution was combined with 20 μL of supernatant, and the adsorption of the mixture was measured at 595 nm after 5 min. The amount of soluble protein was determined by putting the number in the standard curve.

2.5. Transcriptomic Analyses

RNA was extracted from the roots of rice seedlings by the TRIZOL method [26], and the extracted RNA was then stored at −80 °C for use during the transcriptional sequencing. The extracted RNA was treated with RNase-free Dnase I; the mRNA was isolated from the total RNA using oligo (dT) to enrich it. Next, 1 µg of the separated mRNA was taken for the synthesis into double-stranded cDNA, which was synthesized using an oligo dT primer and SuperScript II, and following the manufacturer’s instructions was used for reverse transcription. According to the Ilumina pair sample preparation protocol, the double-stranded cDNA was shredded by nebulization and built the cDNA library. Analysis of differentially expressed genes (DEGs) was performed by using the DESeq R (1.10.1) package. Benjamini and Hochberg’s methods were used to obtain the p-value. Genes with significant errors were observed in values less than 0.05 [27]. For the gene ontology enrichment analysis (GO), a single enrichment analysis tool (SEA) was performed on the Viral Proteomic Tree Server (ViPTree), where y set the default parameters, and FDR set the threshold to p < 0.05.

2.6. Quantitative RT-PCR

One microgram of the total RNA was subjected to reverse transcription using All-in-One First-Strand cDNA Synthesis SuperMix for qPCR (TransGen Biotech Co., Ltd. Beijing, China). Transcription levels of silicon-related genes and genes related to increasing rice resistance under arsenic stress were determined by quantitative RT-PCR. The sequence of primers used in this experiment is given in Table 1, and Actin-1(Os03g0718100) was used as the reference gene. Primers were designed for qRT-PCR analysis by online tools on the https://biodb.swu.edu.cn/qprimerdb/ (Accessed on 20 January 2020). The qRT-PCR reaction system was prepared by TransStart Tip Green qPCR SuperMix and an Eppendorf realplex4 instrument. The reaction process was as follows: initial denaturation at 94 °C for 30 s, denaturation at 94 °C for 5 s, annealing at 53 °C for 15 s, and extension at 72 °C for 10 s. When amplification was completed, product characteristics were determined based on the melting curve. Each candidate gene was performed with four independent reactions. The relative expression of the gene was calculated by the 2−∆∆Ct method and by the threshold cycle values (Ct) of each candidate gene in both CK and experimental samples [28].

2.7. Statistical Analyses

The present experiment was performed in a completely randomized design with three replications. All findings were statistically analyzed by ANOVA test and SPSS 26.0 software following the LSD test (p ≤ 0.05).
It should be noted that two weeks after the As treatments to the culture medium, all DU-OE seedlings dried out.

3. Results

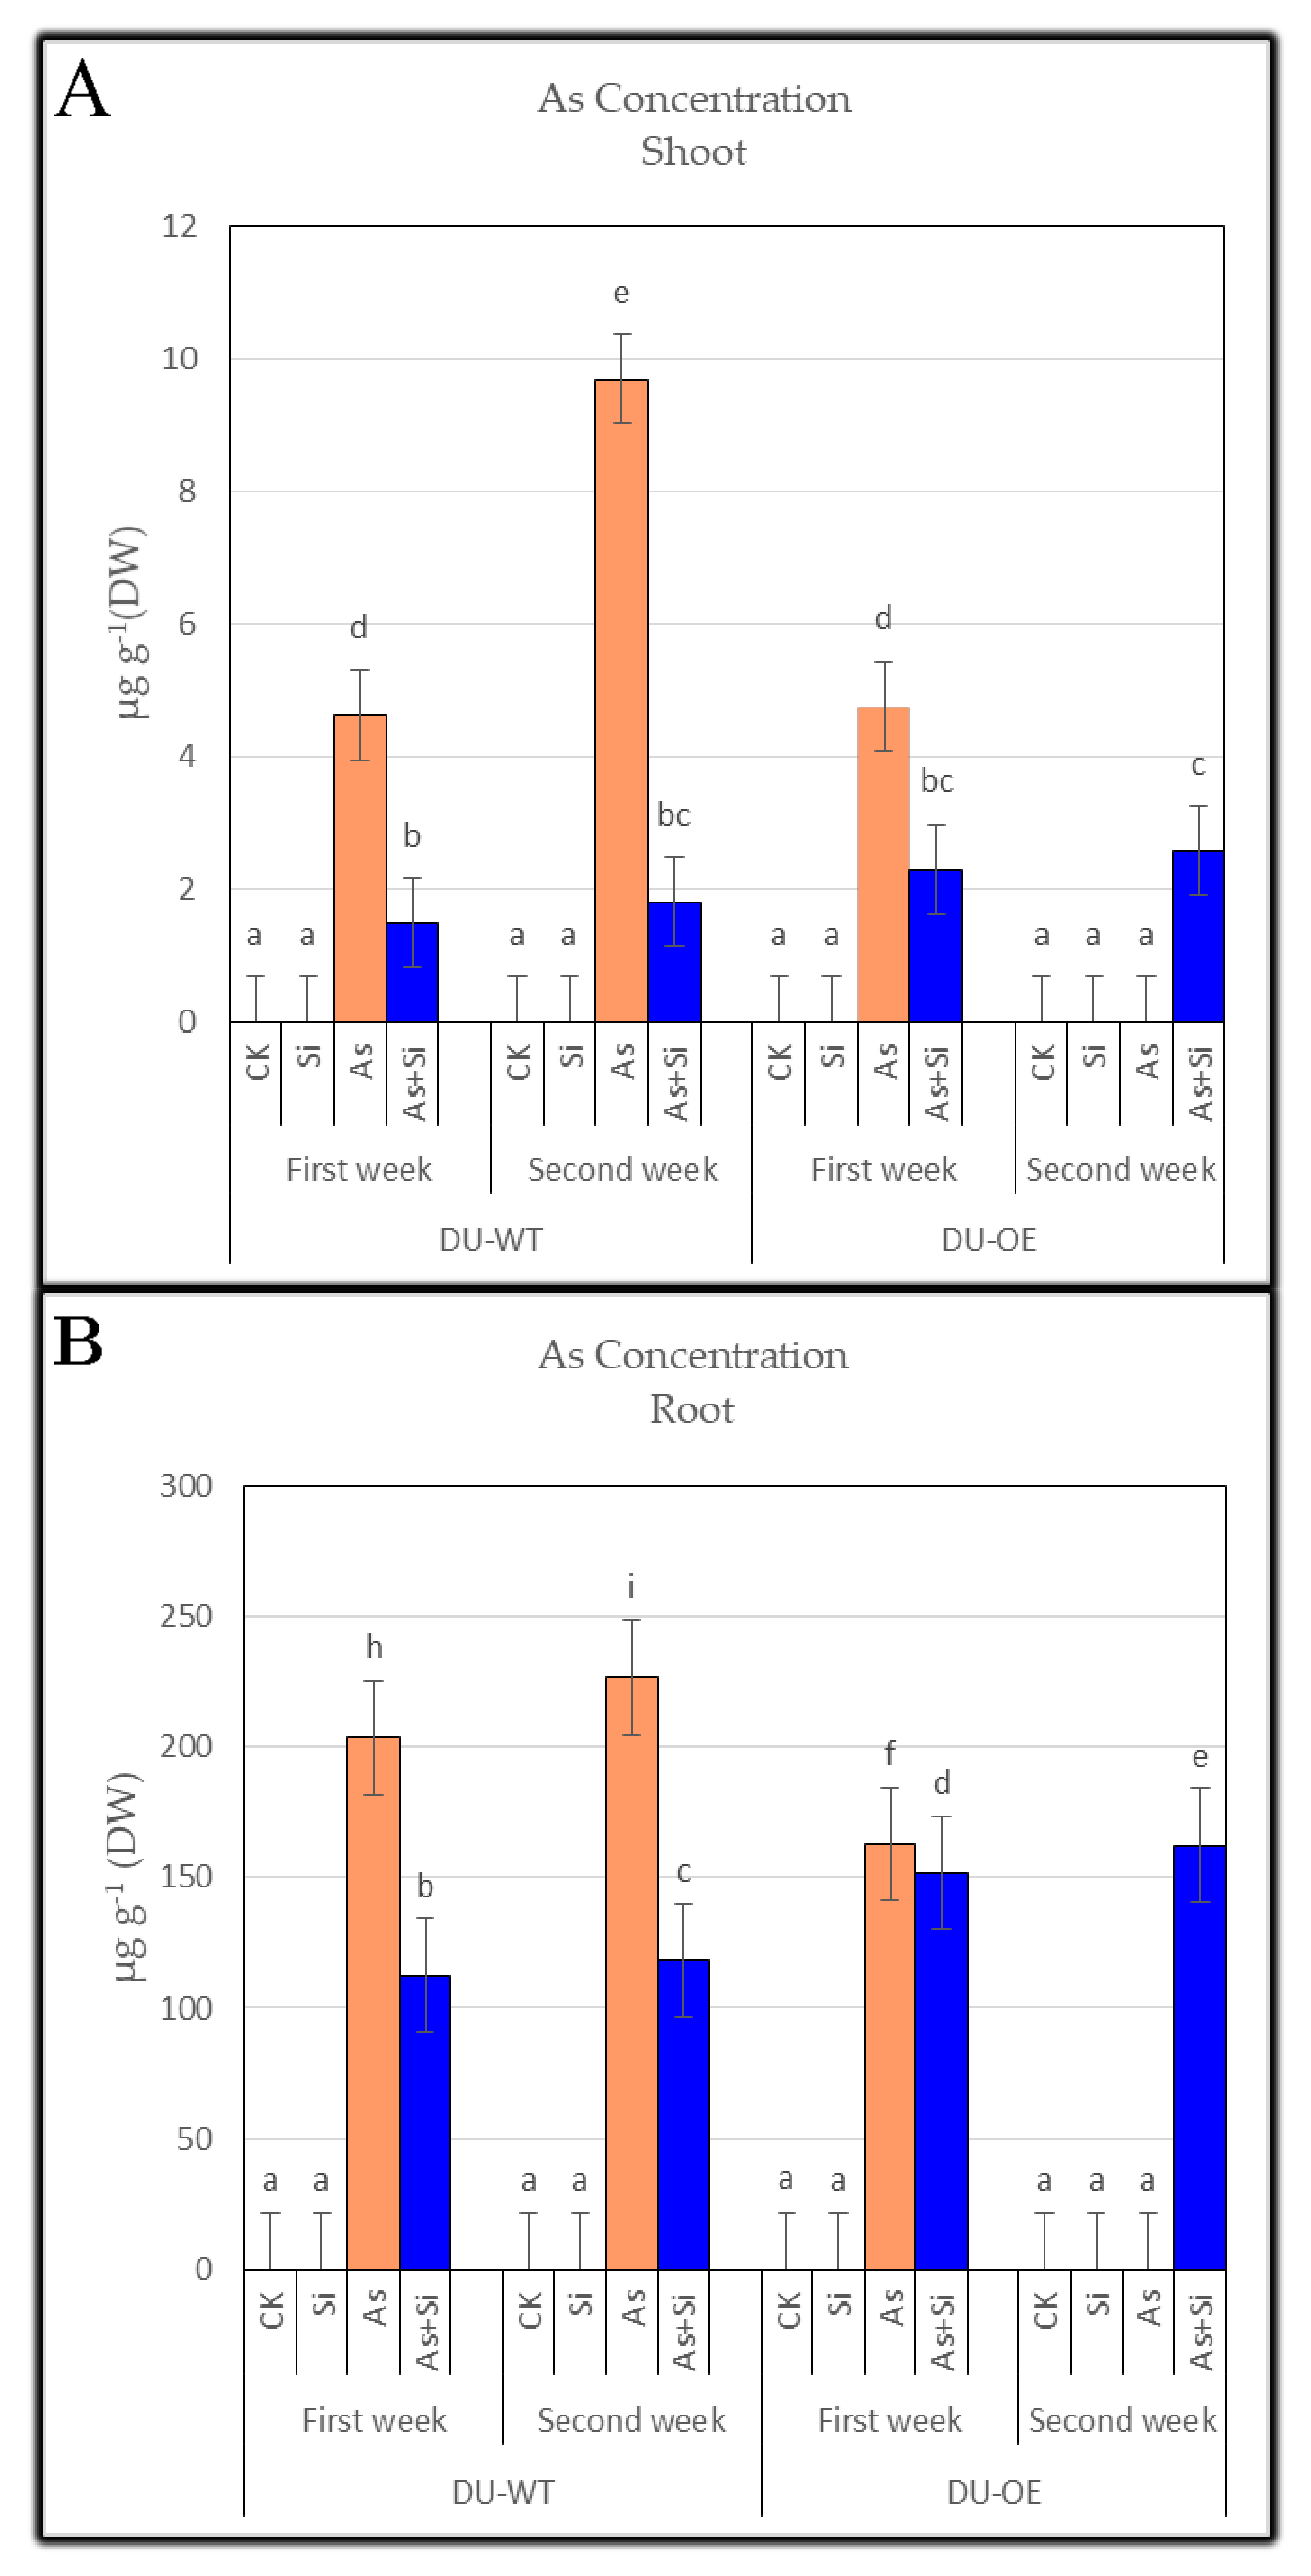
3.1. Arsenic Concentration of Shoots and Roots

When 30 μM As was added to the culture solution, arsenic accumulation in seedlings increased (Figure 1A,B). The results showed that shoot As concentrations in different rice genotypes increased compared to the control (p ≤ 0.05) when seedlings were exposed to As. The highest increase was seen in DU-WT shoots in the first and second weeks (Figure 1A), in which the highest concentrations of As were 4.62 µg g−1 DW and 9.68 µg g−1 DW in the first and second weeks, respectively. Additionally, the results of adding silicon (0.70 mM Si) to the medium were similar to the CK and equal to 0 µg g−1 DW of As. When 30 μM As + 0.70 mM Si were added to the culture medium, the concentration of As in shoots decreased comparing the addition of As treatment alone (30 μM As), and the highest significant decrease in the concentration of arsenic was seen in DU-WT shoots in both weeks. The lowest concentrations of arsenic were 1.49 µg g−1 DW and 1.8 µg g−1 DW in the first and second weeks, respectively.
The addition of arsenic treatment (30 μM As) increased the concentration of As in the roots of seedlings compared to the control (p ≤ 0.05). The highest increase was seen in the roots of DU-WT in both sampling periods, which were equal to 203.41 µg g−1 DW and 226.6 µg g−1 DW, respectively (Figure 1B). The present study showed that, when seedlings were treated only with 0.70 mM Si, the concentration of arsenic in the roots of both genotypes was 0 µg g−1 DW. However, adding 30 μM As + 0.70 mM Si to the culture solution significantly reduced the concentration of arsenic in the roots of both rice compared to the arsenic treatment alone (30 μM As), and the lowest As concentration belonged to the roots of DU-WT in both weeks at the values of 112.5 and 118.2 µg g−1 DW, respectively.

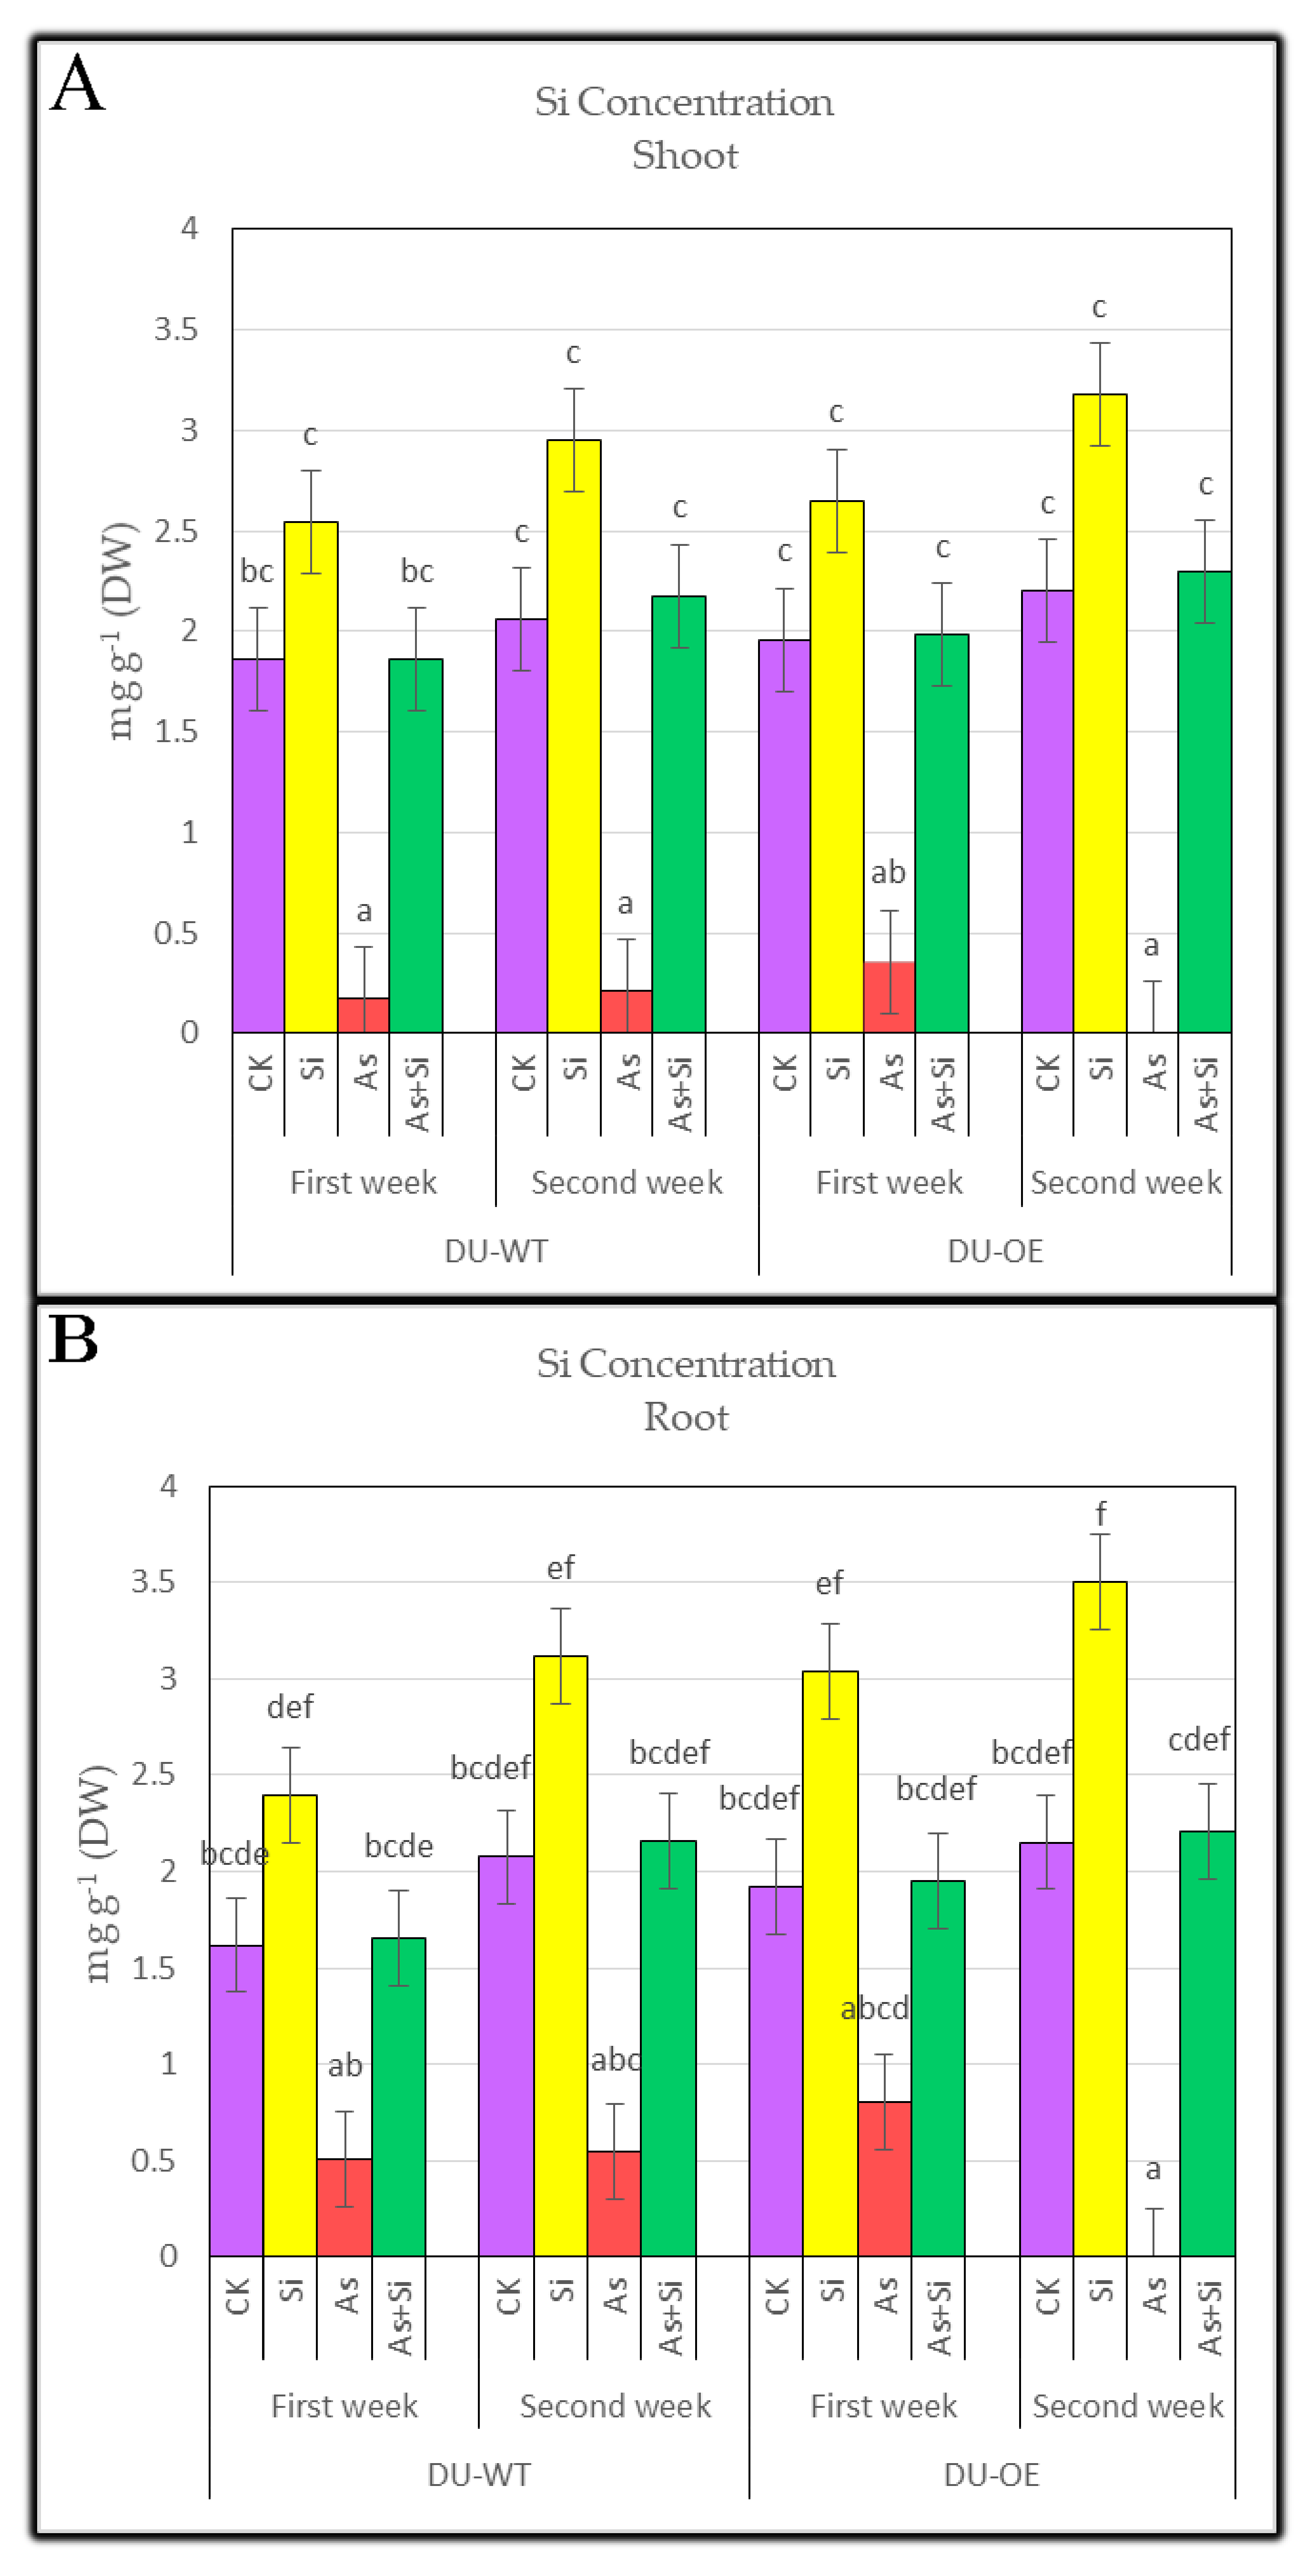
3.2. Silicon Concentration of Shoots and Roots

This study specified silicon concentration in the roots and shoots of both rice genotypes (DU-WT and DU-OE) under different treatments. (Figure 2A,B). The addition of 0.70 mM Si to the solution increased silicon concentration in the seedlings, but the Si concentration depended on the genotype. For example, the Si concentration in the shoots of DU-WT in both weeks after the addition of Si treatment was about 2.40 and 3.12 mg g−1 (DW), respectively, but in the DU-OE shoots, it was 2.65 and 3.18 mg g−1 (DW), respectively. Treatment of seedlings with arsenic significantly reduced the Si concentration in shoots of both genotypes; however, in the presence of As + Si treatment, the Si concentration of shoots increased compared to the application of arsenic treatment alone (30 μM As). When a30 μM As + 0.70 mM Si treatment was added to the culture medium, the highest increase in the Si concentration compared to the control (p ≤ 0.05) was seen in the shoots of DU-OE, and this increase compared to CK in both sampling periods was equal to 1.43% and 4.31%, respectively.
By adding 30 μM As to the culture solution, the silicon concentration in the rice roots decreased compared to the control (p ≤ 0.05). The most significant reduction in the Si concentration was seen in DU-WT roots in both weeks (Figure 2B), and it was equal to 68.60% and 73.80% in the first and second weeks, respectively. When seedlings were treated with 0.70 mM Si, the concentration of silicon in the roots of both genotypes increased significantly compared to the control, and Si concentration in DU-OE roots showed the highest increase compared to CK (p ≤ 0.05) in the first and second weeks (3.04 and 3.50 mg g−1 (DW), respectively). However, adding 30 μM As + 0.70 mM to the culture solution caused the highest increase in the Si concentration in DU-OE roots; that increase was equal to 1.51% and 2.41% compared to CK (p ≤ 0.05) in both sampling periods, respectively.

3.3. Dry Weight of Shoots and Roots

Further studies on 30 μM As treatment showed that adding this treatment to the medium significantly reduced the dry weight in the shoots and roots of both rice genotypes in both weeks, and DU-OE roots and shoots showed the higher dry weight loss compared to DU-WT (Figure 3A,B; Table 2). However, the dry weight of DU-OE roots and stems showed a higher increase in the presence of Si treatment. By adding 0.70 mM Si to the culture medium, the dry weight of DU-OE shoots and roots in both sampling periods increased by 97.05% and 94.11% and 33.93% and 38.12% compared to CK, respectively, but this increase in DU-WT shoots and roots was equal to 90.69% and 72.12% and 37.21% and 35.26%, respectively. (Figure 3A,B; Table 2).
The dry weight of seedlings treated with 30 μM As + 0.70 mM Si in both rice genotypes decreased compared to CK, especially in the case of the DU-OE genotype, where it was shown that the addition of Si increases the biological tolerance threshold and controls the uptake and transfer of As in roots and shoots, which indicates the antagonism between arsenic and silicon by the existing Lsi1 in rice (Figure 3A,B; Table 2).

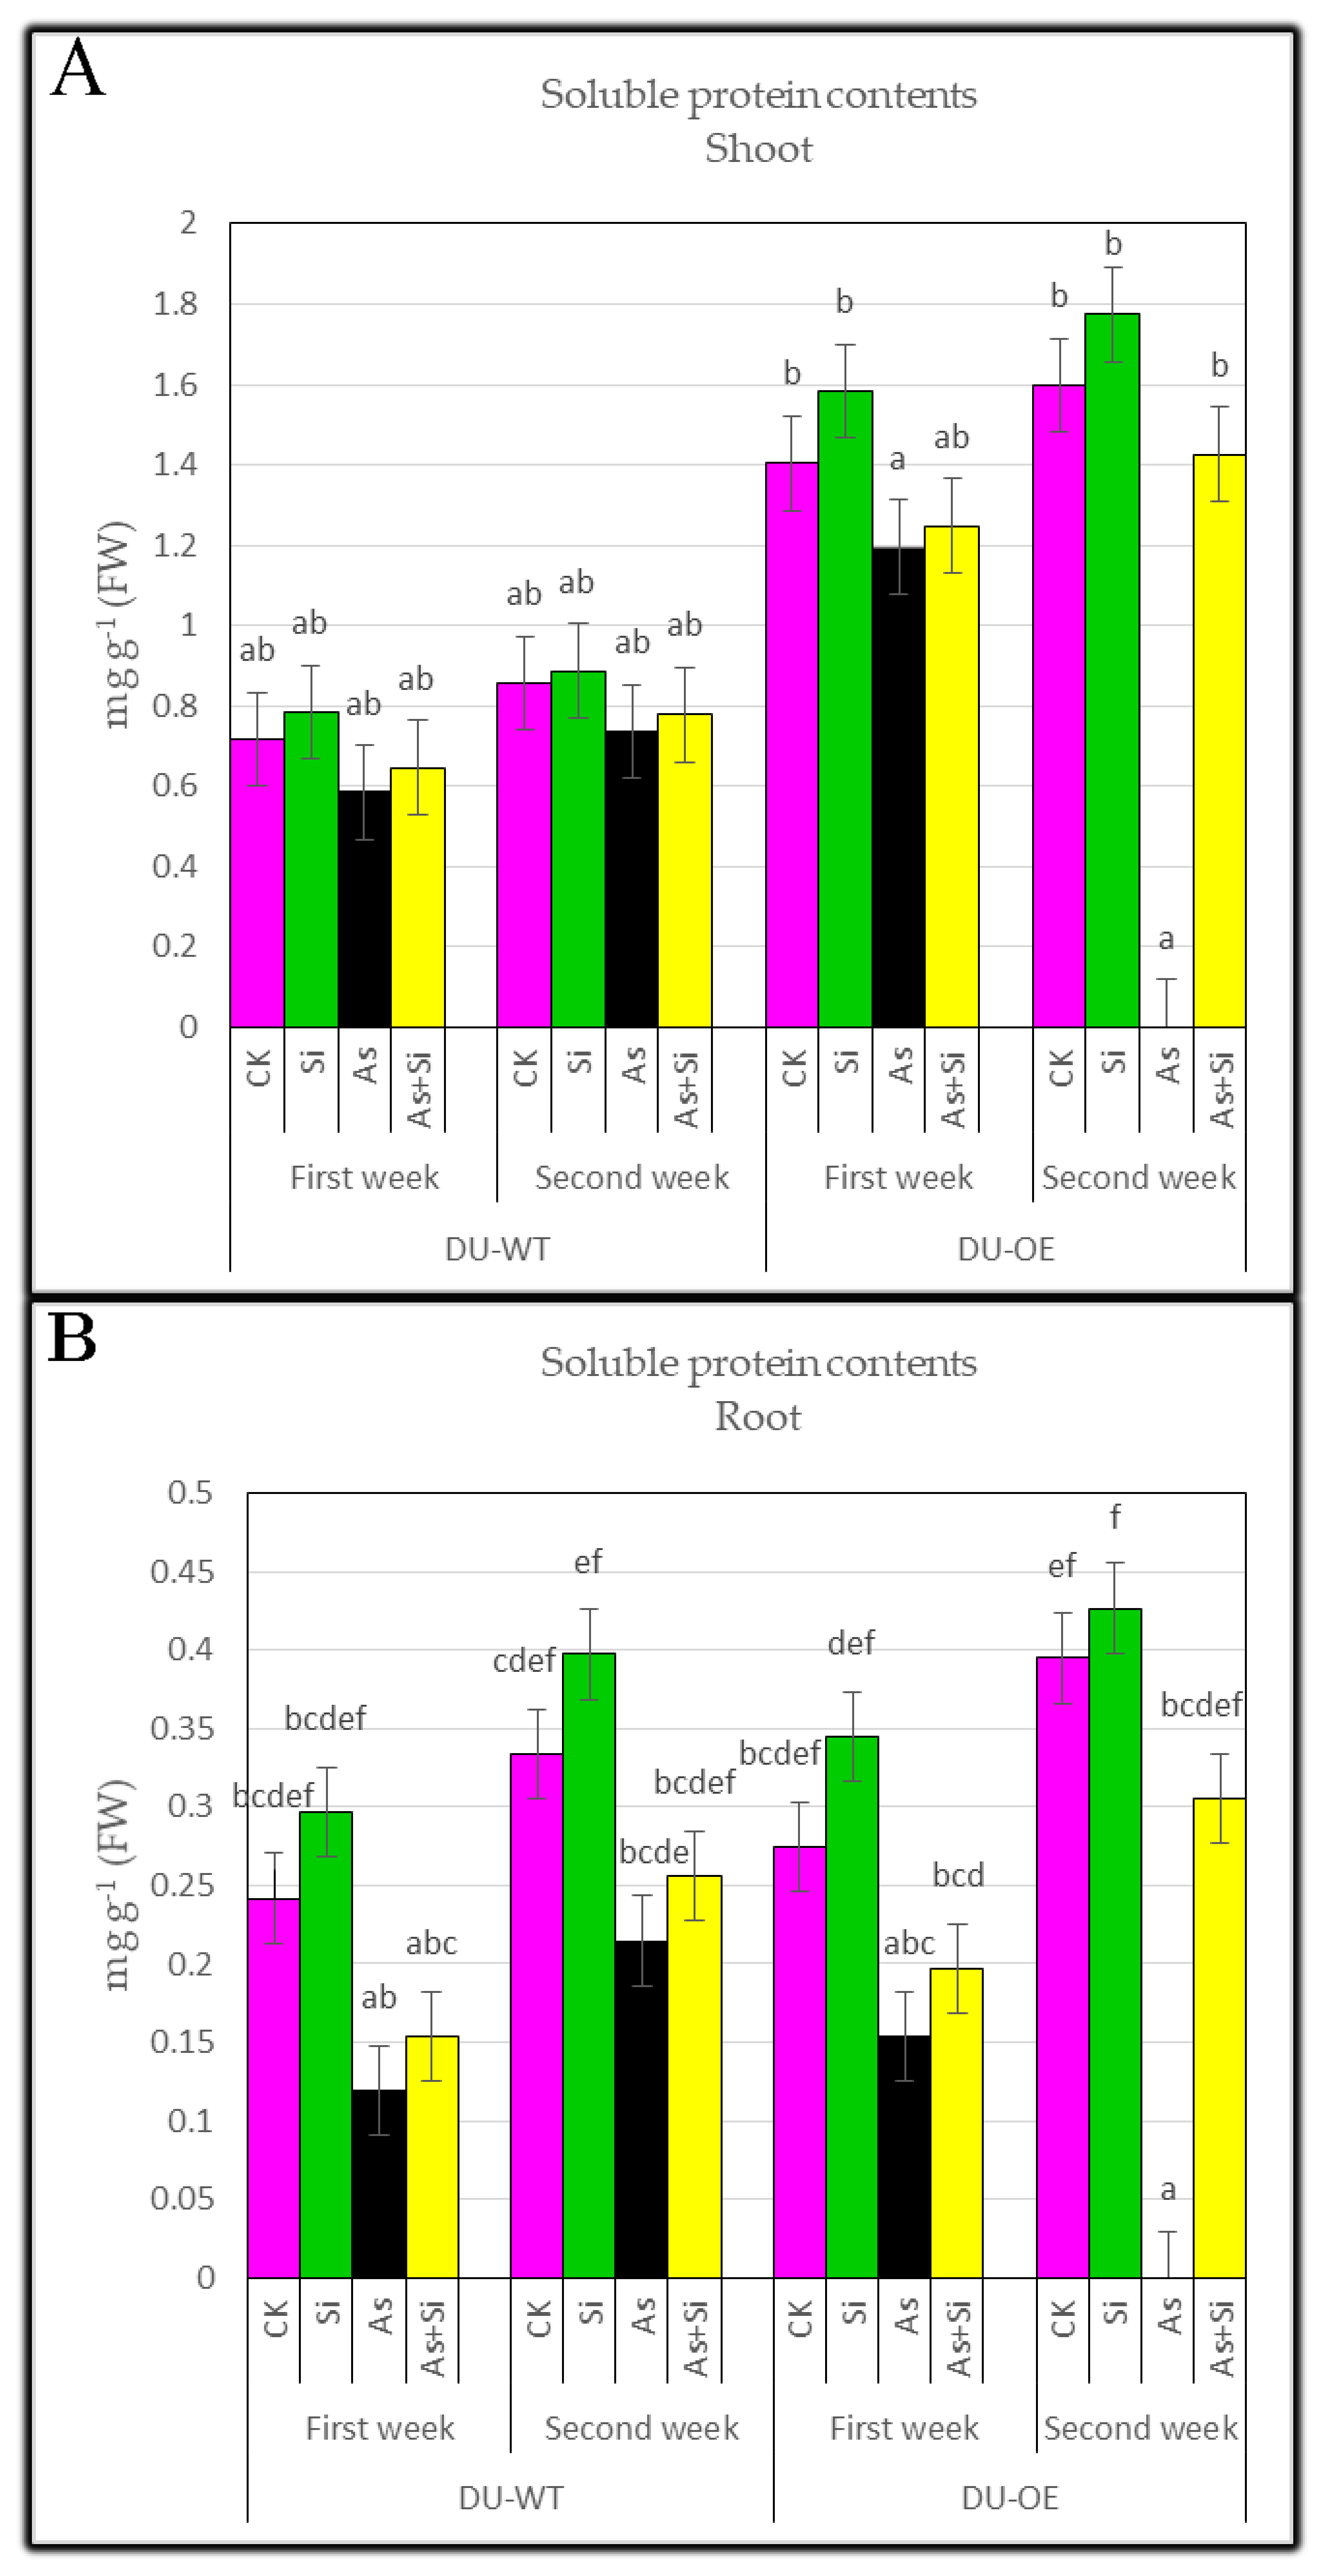
3.4. Soluble Protein Contents of Shoots and Roots

Data analysis showed that adding 0.70 mM Si to the culture solution increased the soluble protein content in rice lines’ shoots in both sampling periods (Figure 4A). The highest increase in soluble protein content was seen in the shoots of DU-OE compared to CK (p ≤ 0.05), which was equal to 1.58 and 1.77 mg g−1 FW in both weeks, respectively. The arsenic-containing treatment (30 μM As) reduced the soluble protein content of shoots compared to the control (p ≤ 0.05), and the highest significant decrease was seen in DU-WT shoots in both weeks, which was equal to 0.58 and 0.73 mg g−1 FW, respectively. When adding 30 μM As + 0.70 mM Si treatments, the soluble protein content in both rice genotypes reduced compared to the control (p ≤ 0.05), and the highest reduction was related to DU-WT shoots, which showed a decrease of 9.78% and 9.25% in the first and second weeks compared to the CK, respectively.
Treating seedlings with silicon (0.70 mM Si) significantly increased soluble protein content in roots compared to CK. The highest increase in soluble protein content in DU-OE roots was observed, equal to a 25.58% and 8.08% increase in both weeks, respectively (Figure 4B). By adding arsenic treatment (30 μM As) to the culture medium, the soluble protein content of both rice roots was reduced compared to CK (p ≤ 0.05), and the highest significant decrease compared to CK was seen in DU-WT roots in the first and second weeks, which were equal to 0.12 and 0.21 mg g−1 FW, respectively. When seedlings were exposed to 30 μM As + 0.70 mM Si, the greatest reduction in soluble protein content was observed in DU-WT roots compared to CK (p ≤ 0.05), and it showed a decrease of 36.28% and 23.27% in both sampling periods, respectively.

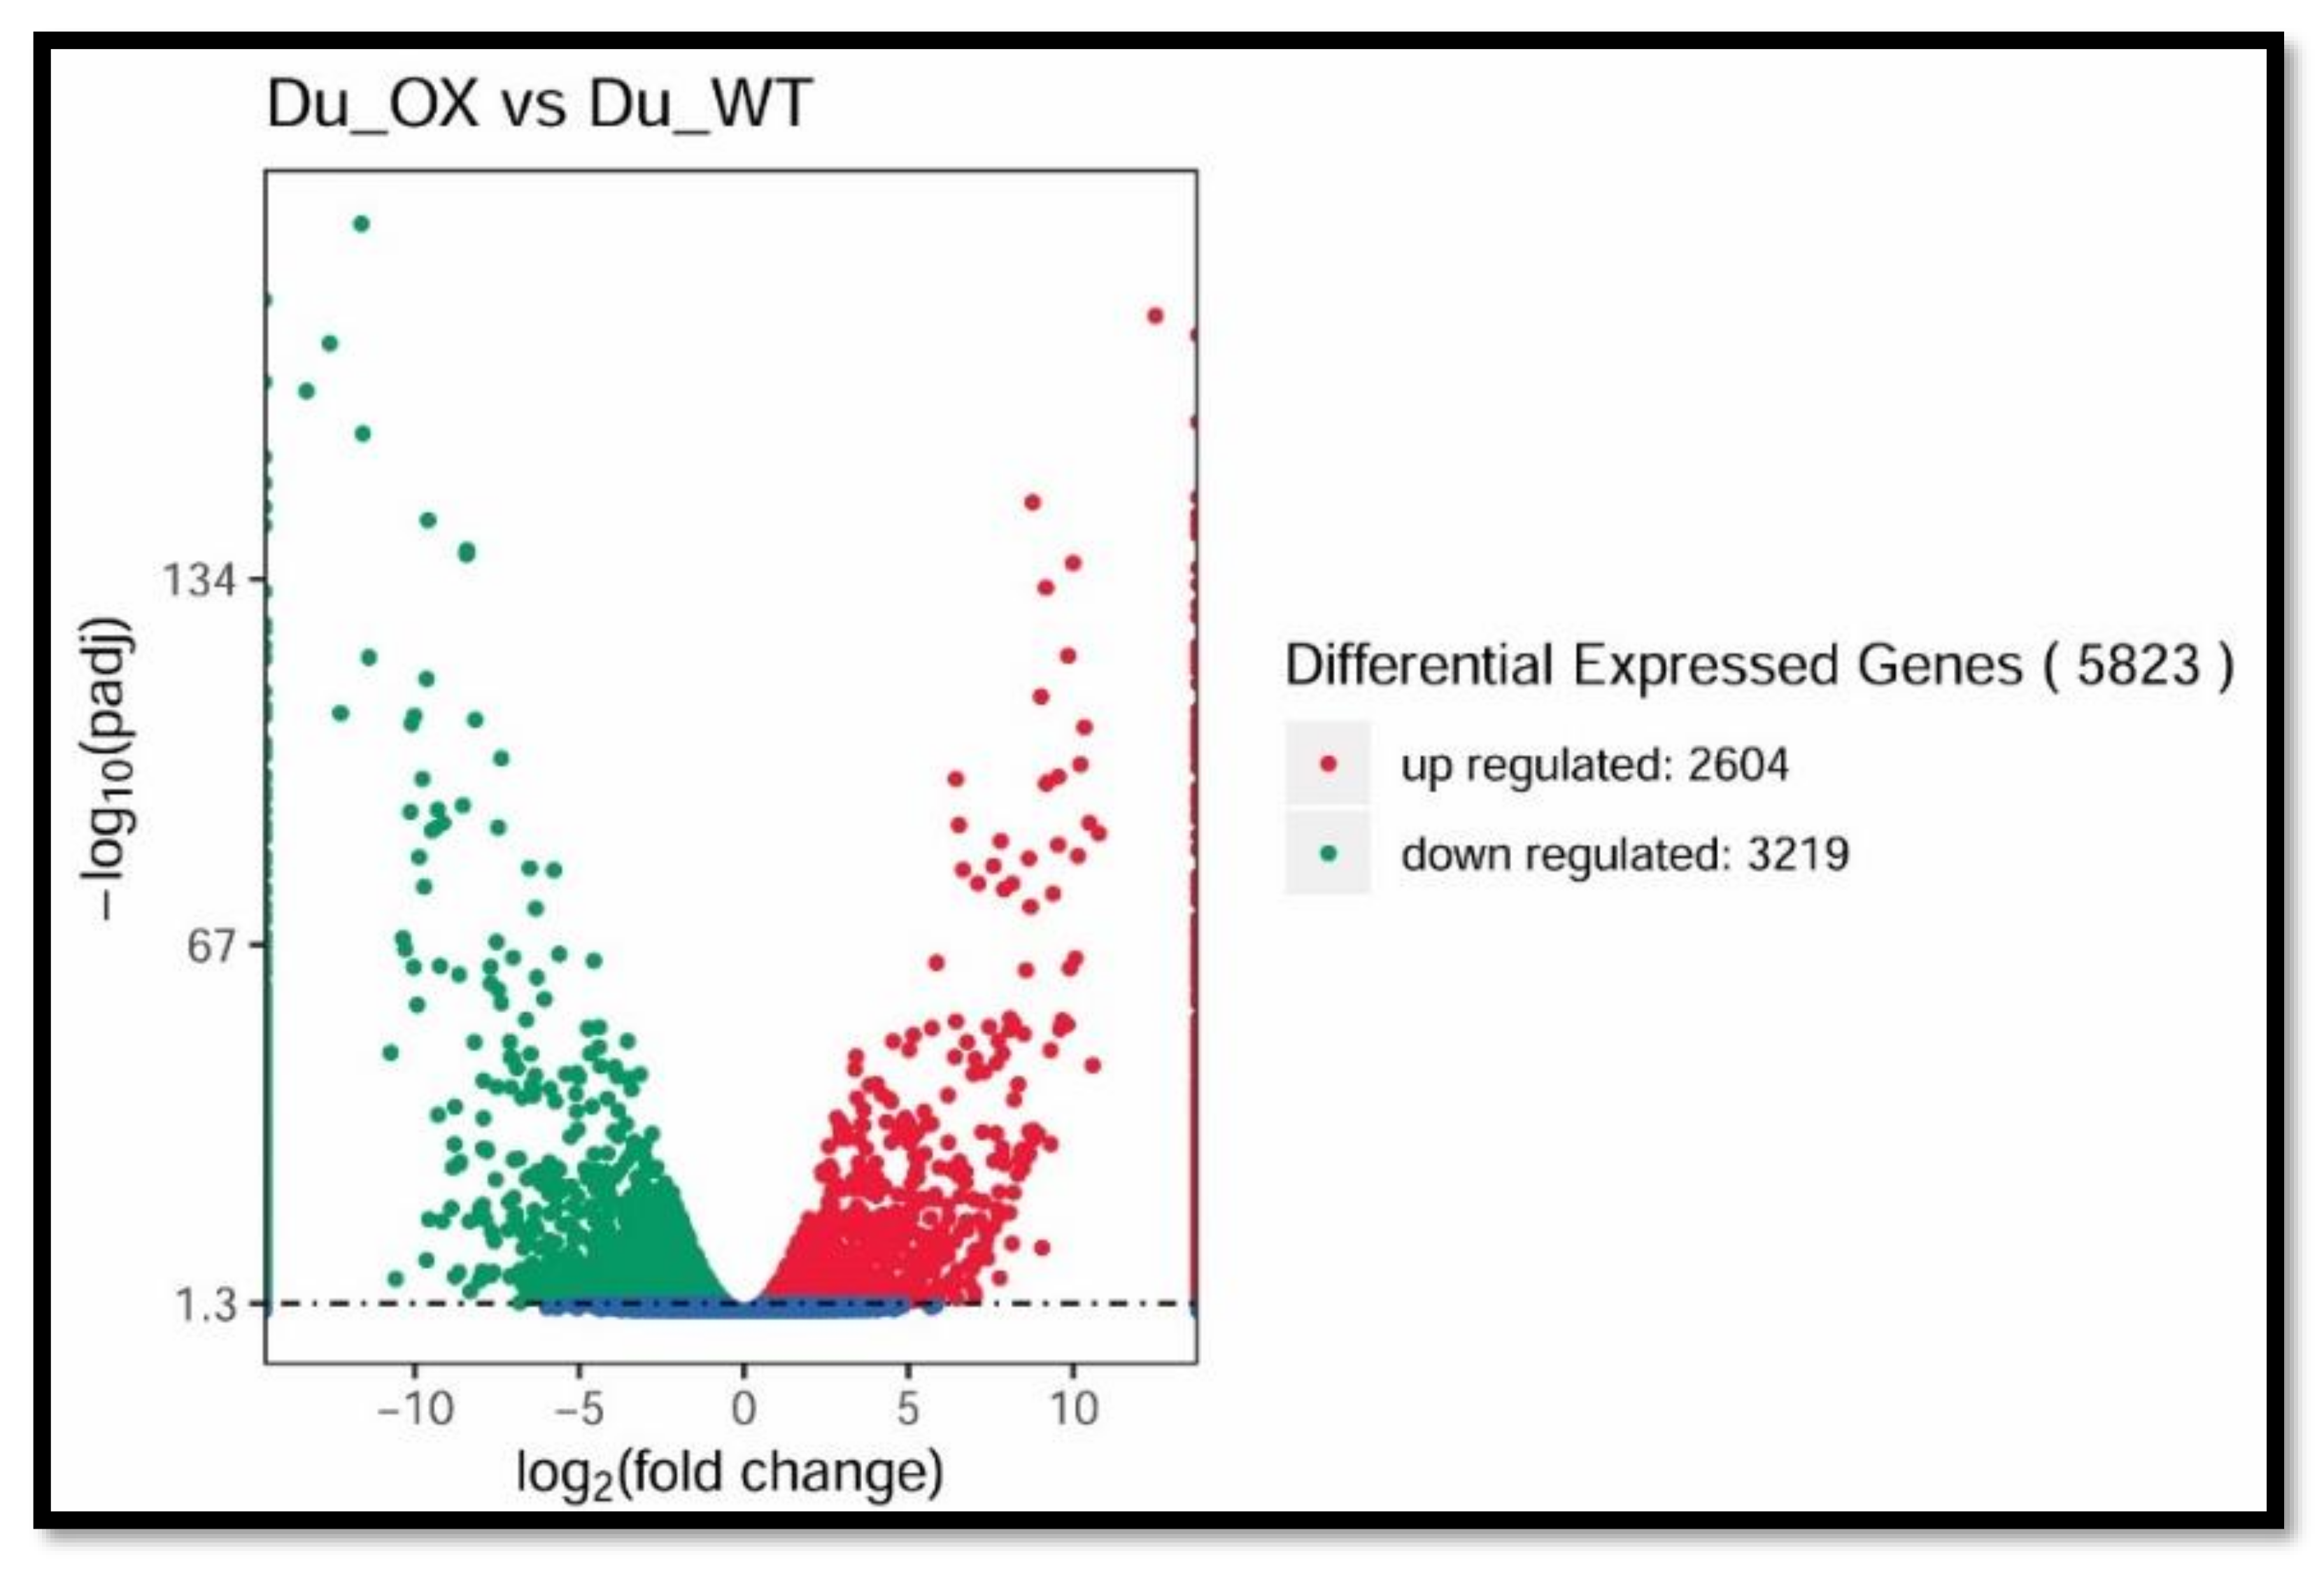
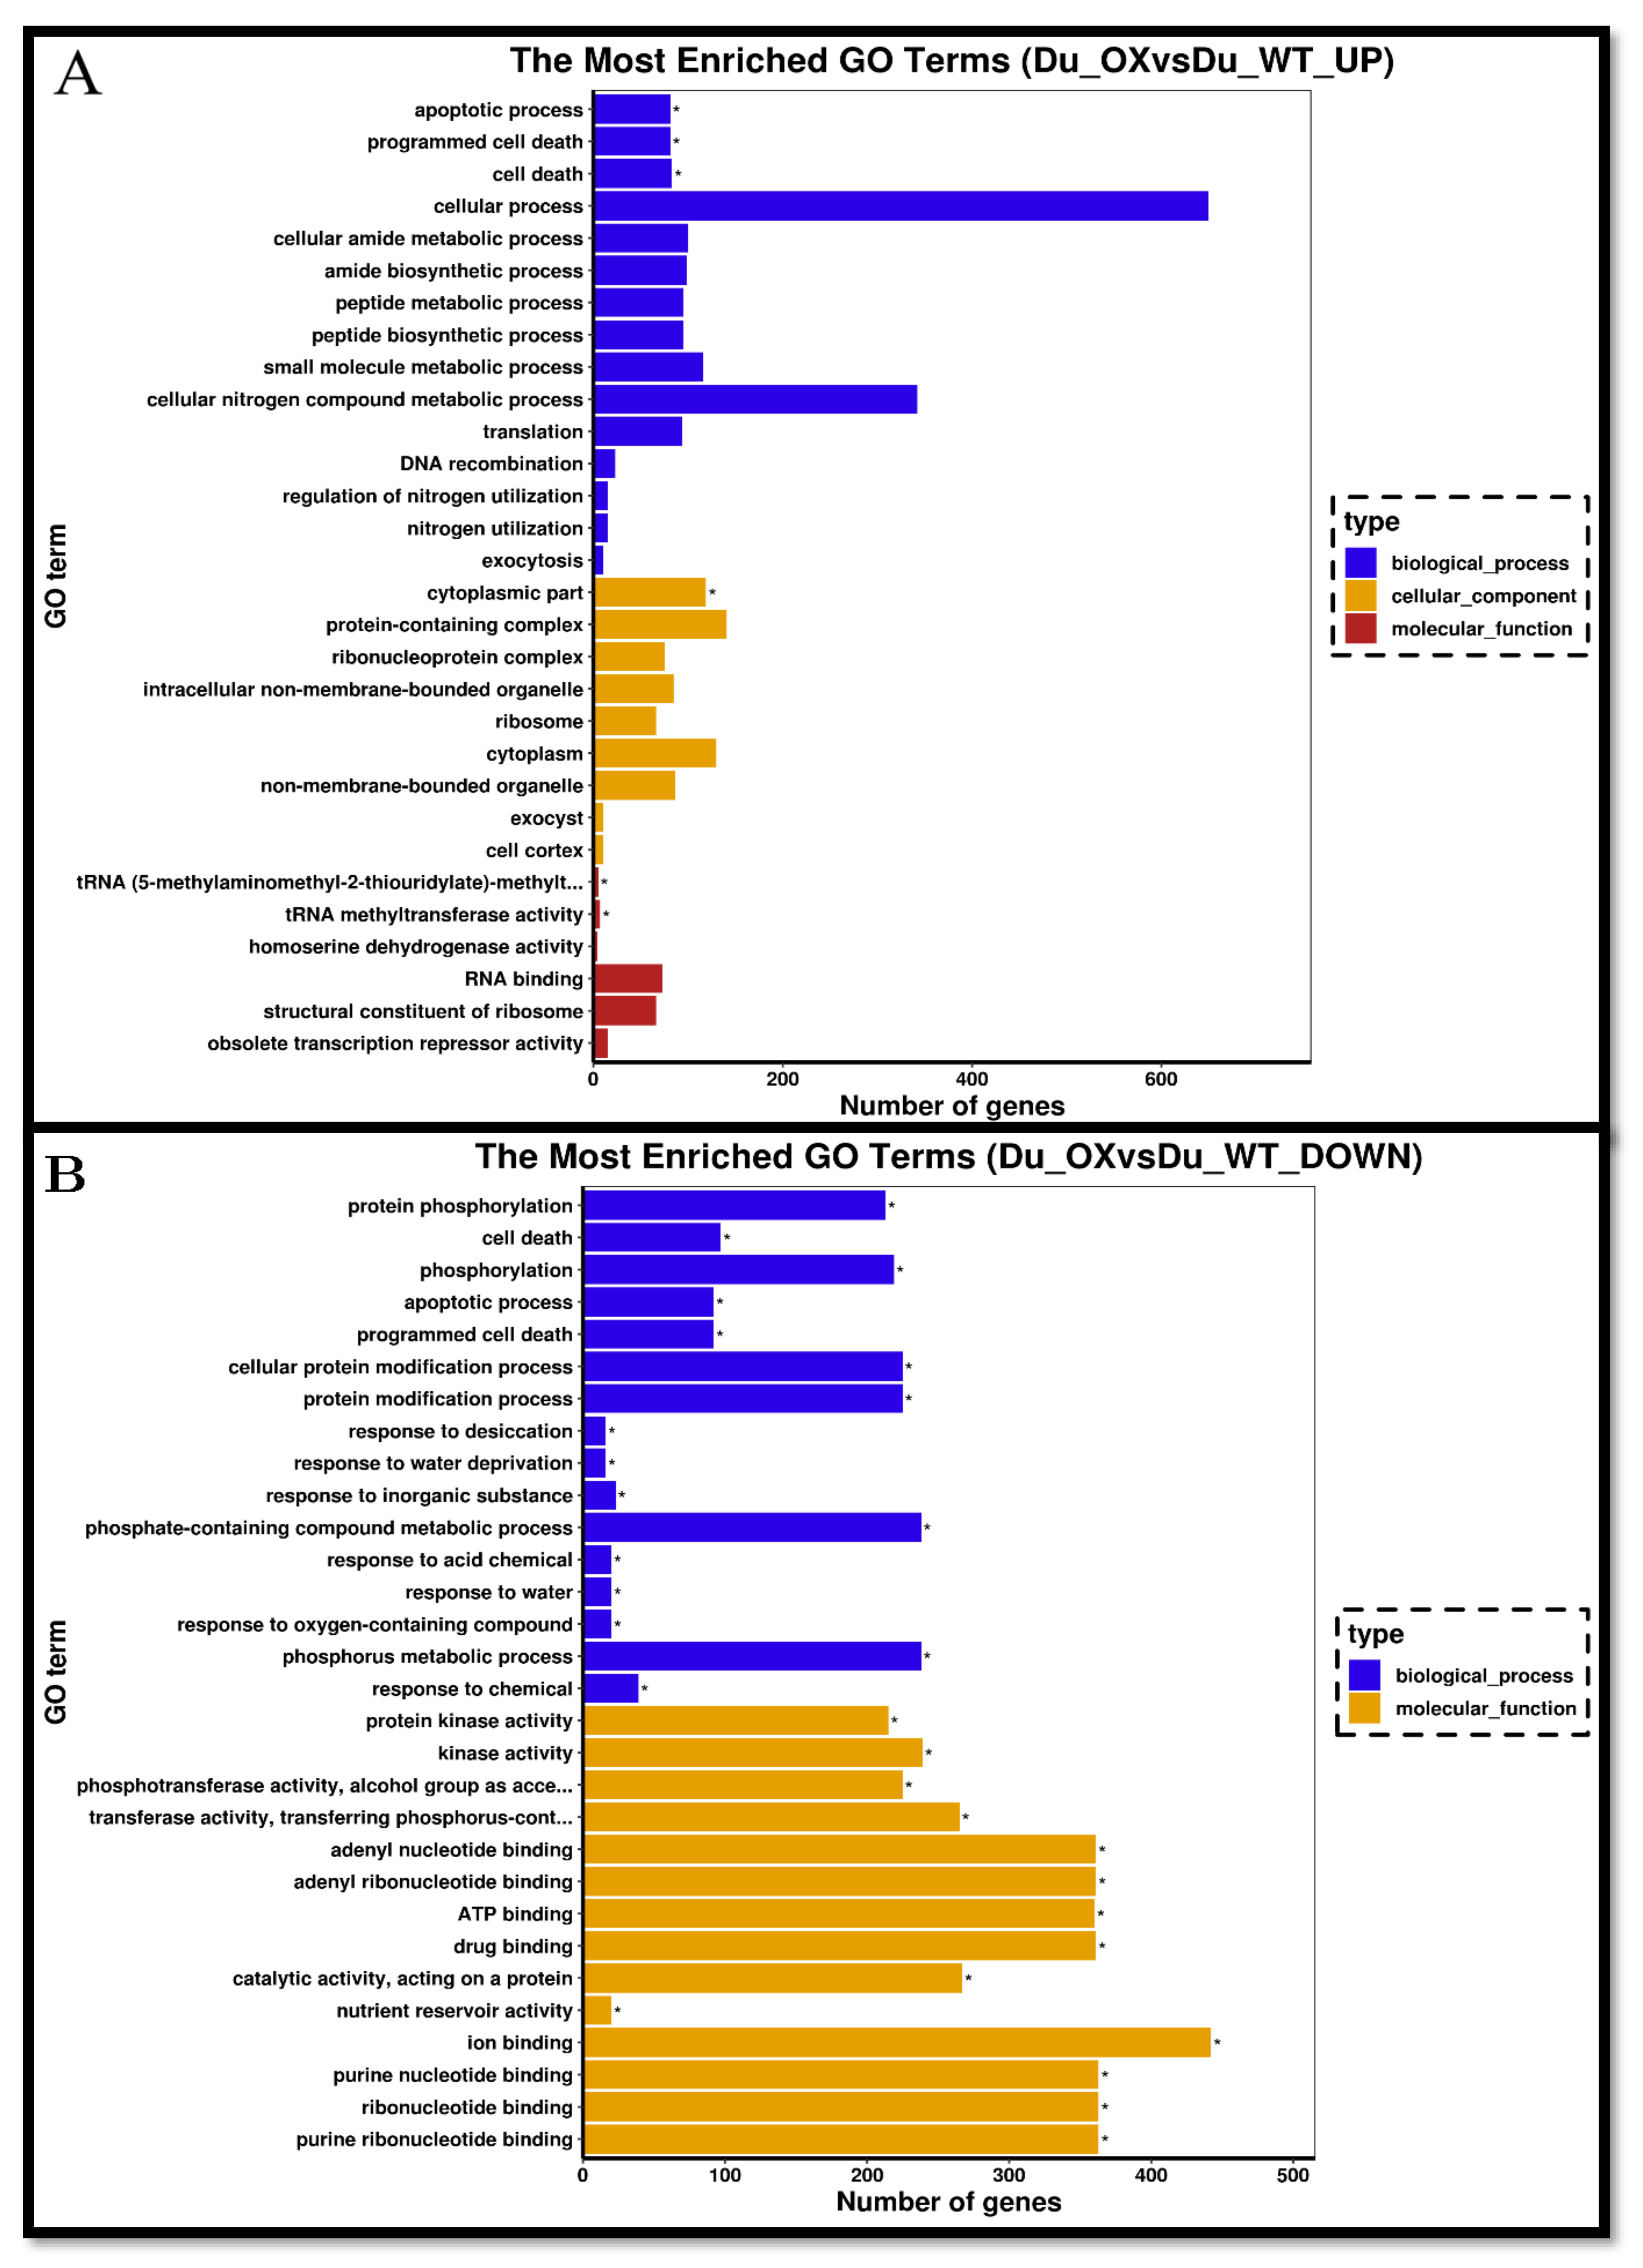
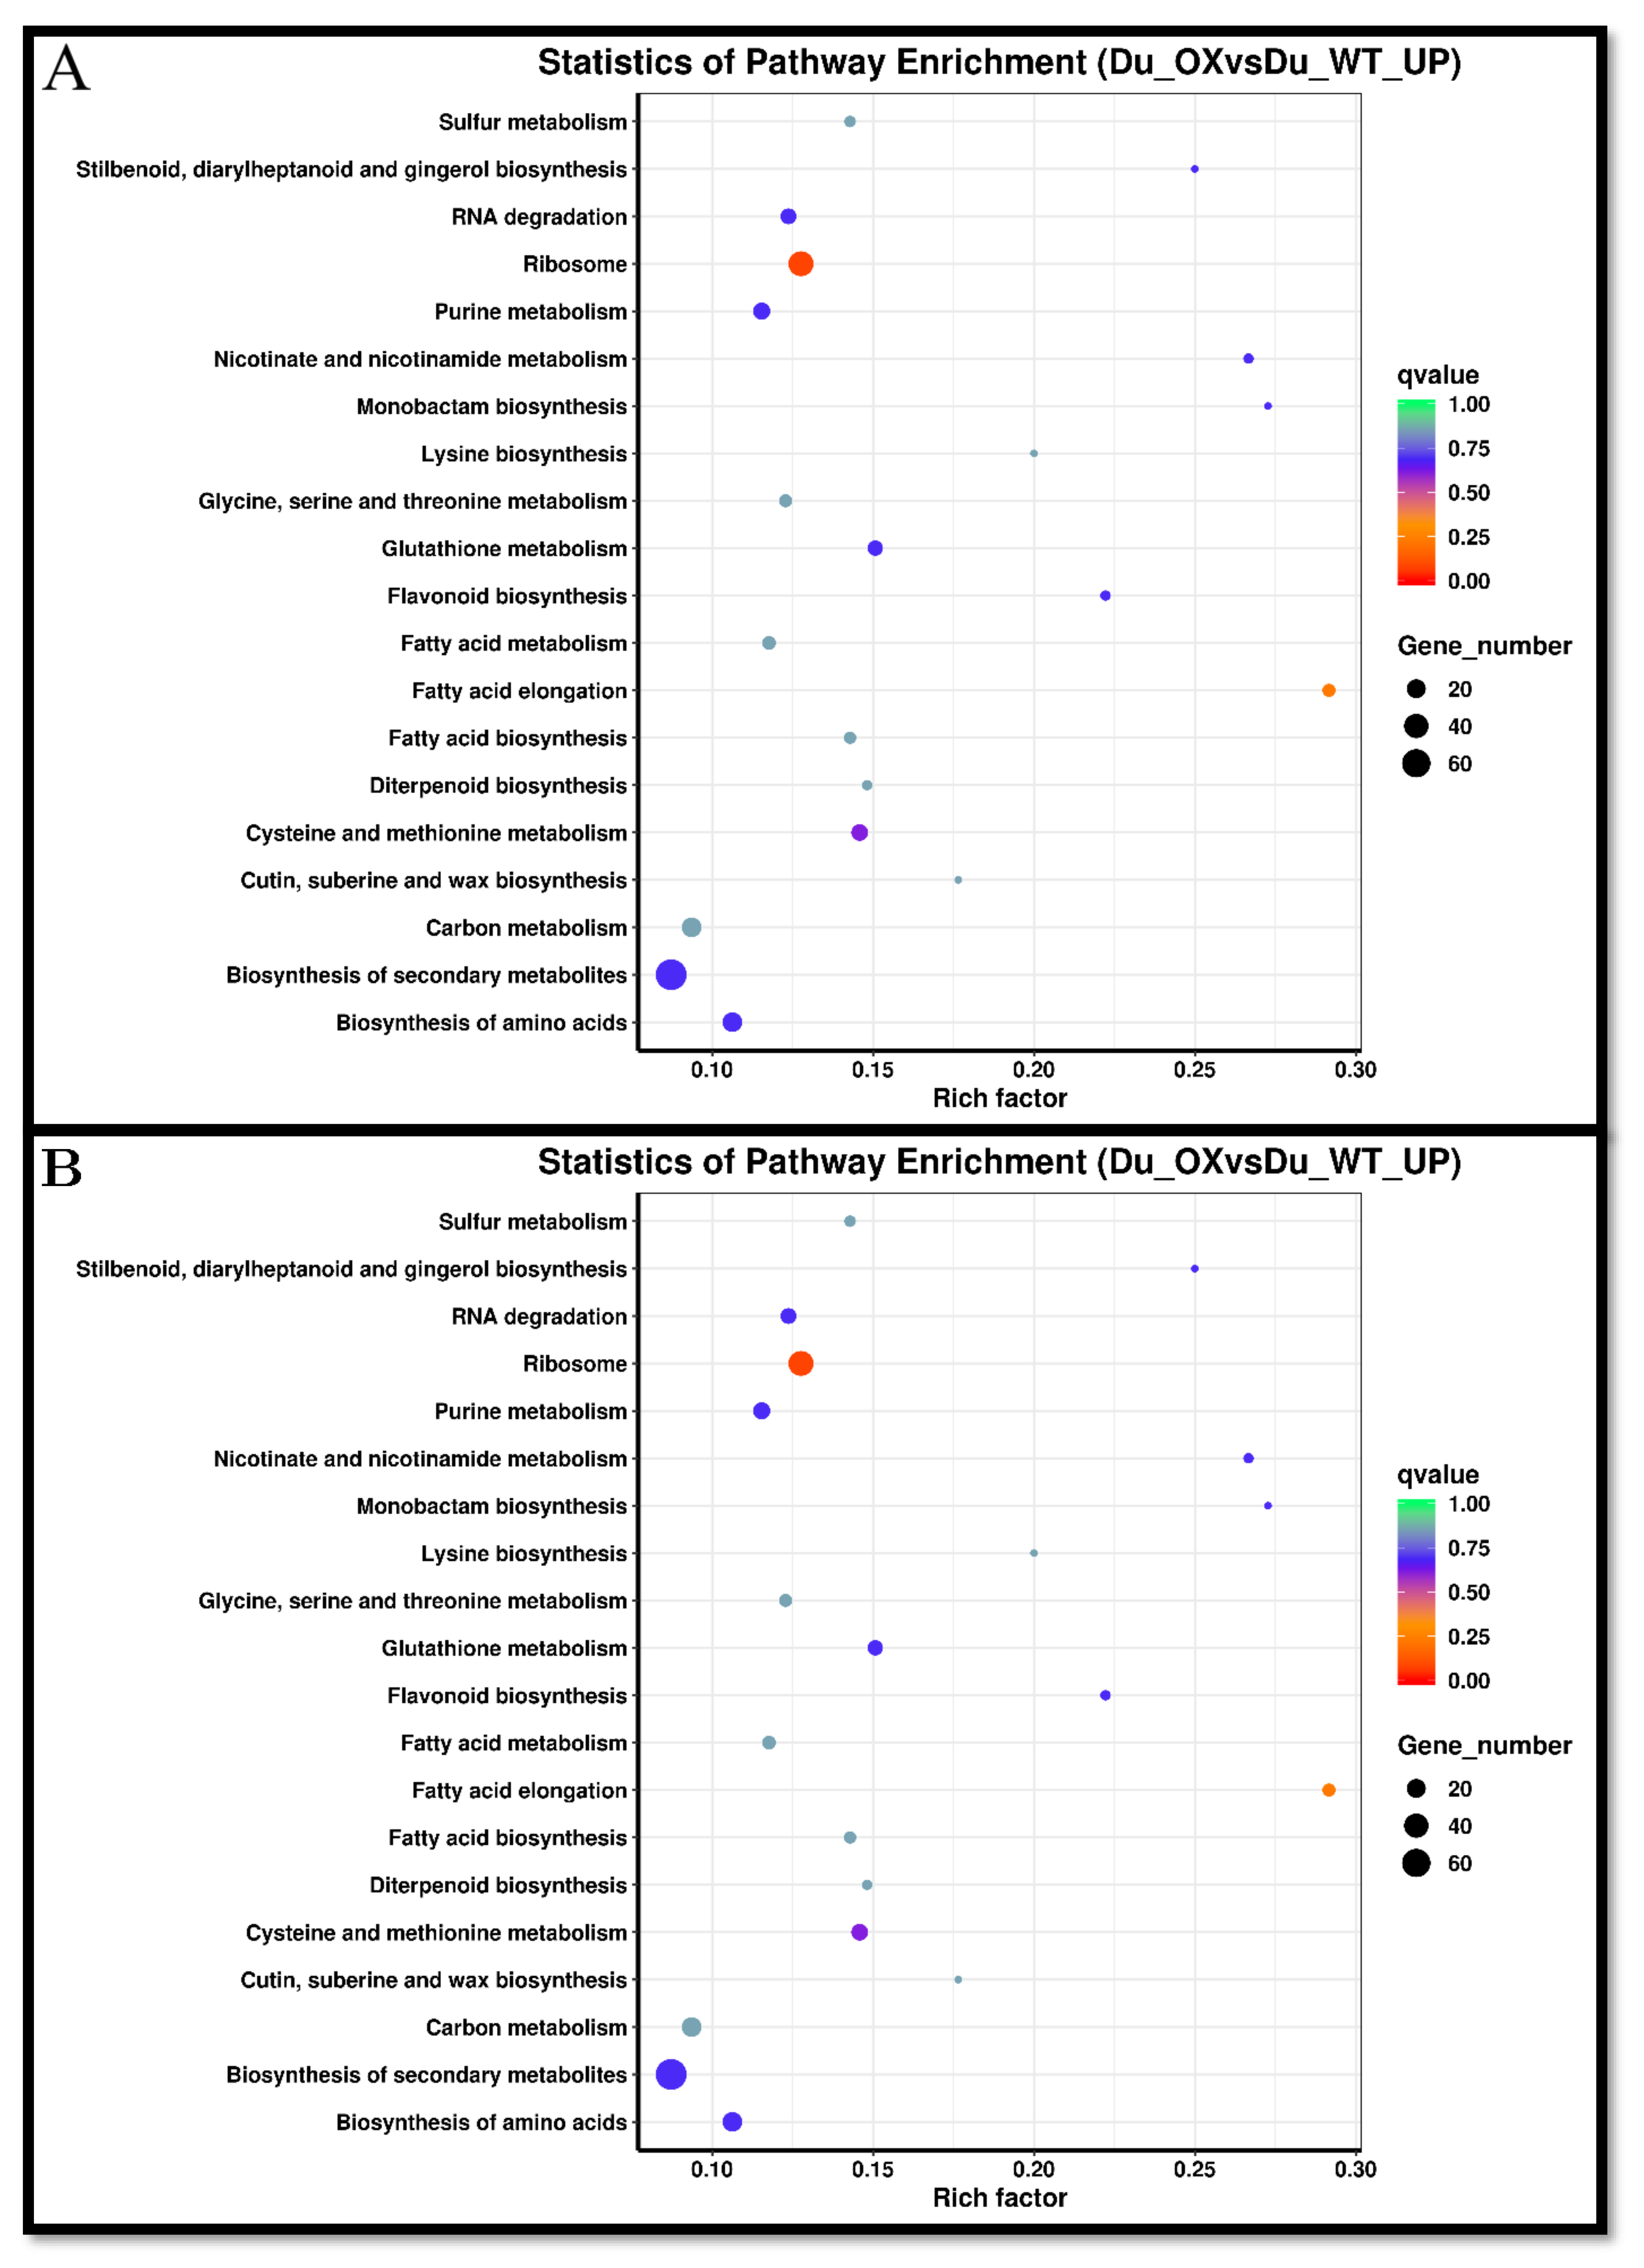
3.5. Transcriptome Analysis of Rice Roots

Illumina high-throughput sequences related to arsenic and silicon in rice were used, and for this purpose, seedlings were treated with 30 μM As + 0.70 mM Si, and the coefficient was calculated to evaluate their reproducibility. Using DESeq, differentially expressed genes (DEGs) were known between DU-WT (CK) and DU-OE (Figure 5).
The list of DEGs for DU-OE included 5823 genes, including 2604 up-regulated genes and 3219 down-regulated genes. We used ViPTree to classify GO on the expressed genes affected by As and Si, and enriched GO terms categorized the cellular component, molecular function, and biological process. GO enrichment conditions of the biological process (GO: 0008152) were mainly related to the cellular process (GO: 0009987) and metabolic process (GO: 0008152) and response to stimulus (GO: 0050896). In the classification of the molecular function (GO: 0003674), the enriched DEGs were related to binding (GO: 0005488), catalytic activity (GO: 0003824), and nutrient reservoir activity (GO: 0045735), while enriched DEGs in the cellular component (GO: 0005575) were related to the cell (GO: 0005623) and cell parts (GO: 0044464) (Figure 6A,B).
Kyoto Encyclopedia of Genes and Genomes (KEGG) enrichment analysis in DU-OE found that DEGs in RNA degradation contained 15 genes, of which 12 genes are up-regulated and 3 are down-regulated; while DEGs in ribosome included 46 genes, of which 7 are up-regulated and 3 are down-regulated. KEGG enrichment analysis also showed that DEGs involved in purine metabolism included 22 genes, of which 15 are up-regulated genes and 7 are down-regulated, while DEGs in glutathione metabolism contained 17 genes, of which 11 genes are up-regulated and 6 are down-regulated.
KEGG enrichment analysis showed that DEGs in cysteine and methionine metabolism contained 21 genes, of which 14 are up-regulated and 6 are down-regulated; however, DEGs in carbon metabolism included 33 genes, of which 22 genes are up-regulated and 11 are down-regulated. KEGG enrichment analysis also showed that DEGs in the biosynthesis of secondary metabolites contained 135 genes, of which 74 are up-regulated and 61 are down-regulated genes, but DEGs in the biosynthesis of amino acids contained 36 genes, of which 22 genes are up-regulated and 14 are down-regulated; on the other hand, DEGs in starch and sucrose metabolism contained 19 genes, of which 2 genes are up-regulated and 17 are down-regulated.
KEGG enrichment analysis showed that DEGs in plant hormone signal transduction included 25 genes, of which 7 are up-regulated and 18 are down-regulated, but DEGs in phenylpropanoid biosynthesis contained 21 genes, of which 7 genes are up-regulated and 18 are down-regulated, while DEGs in metabolic pathways include 229 genes, of which 7 are up-regulated and 18 are down-regulated.
Finally, it was found that the factors that cause rice resistance to arsenic are only regulated by the expression patterns of these genes (Figure 7A,B).

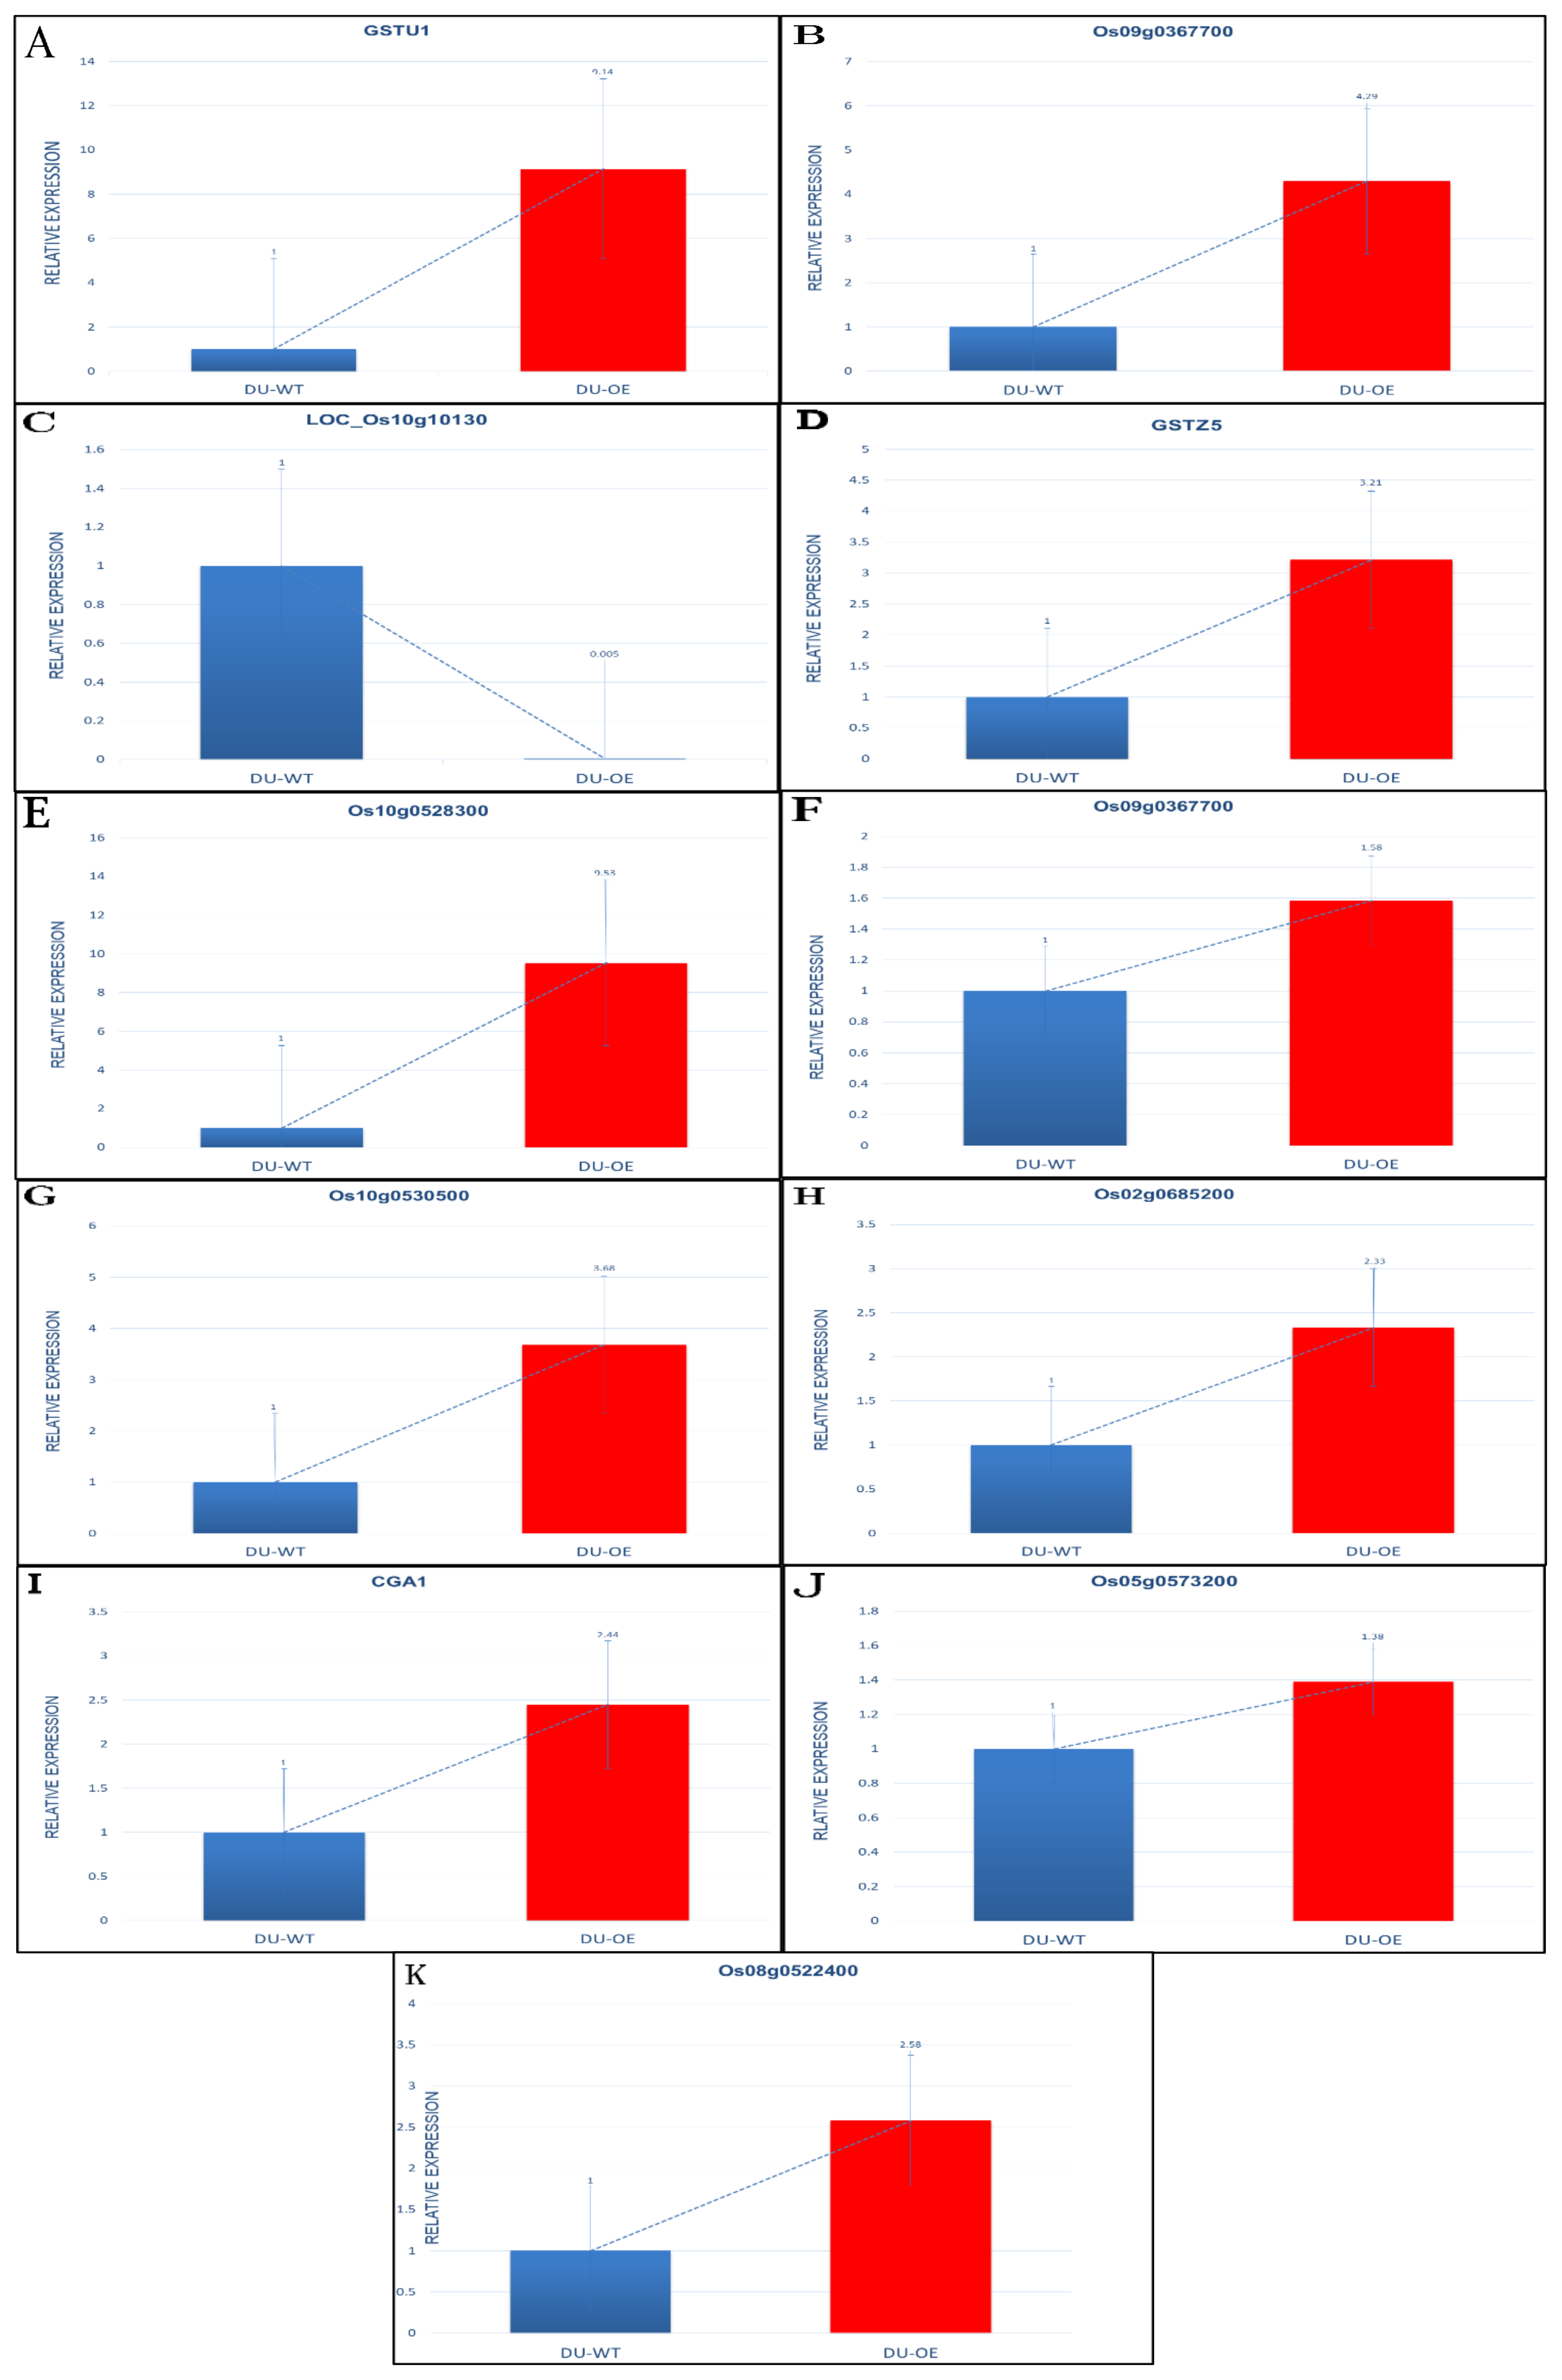
3.6. Expression of Some Genes in DU-OE Exposed to Si and As

The expression of probable glutathione S-transferase GSTU1, which regulates glutathione transferase activity in rice roots, showed that it was up-regulated when seedlings were treated with arsenic and silicon (Figure 8A).
The Os01g0367700 protein, which regulates glutathione transferase activity in rice, was up-regulated when the seedlings were treated with arsenic and silicon (0.43 fold), but the expression of the IN2-1 protein, as putatively expressed (regulates protein glutathionylation), was down-regulated (6.63 fold; Figure 8B,C).
The role of protein IN2-1 homolog B in rice plants is regulated by protein glutathionylation. QRT-PCR showed that the expression of GSTZ5 in DU-OE was up-regulated compared to CK, and the results also showed that the expression of glutathione S-transferase protein (Os10g0528300), which regulates glutathione transferase activity and a glutathione metabolic process in rice, was highly up-regulated (Figure 8D,E).
Os09g0367700 protein, which regulates glutathione transferase activity in DU-OE rice, was up-regulated when the roots were treated by arsenic and silicon (Figure 8F).
The expression of Os10g0530500 protein, which regulates glutathione transferase activity in DU-OE rice, was up-regulated compared to the control, and the expression of Os02g0685200 protein in the presence of arsenic and silicon treatment was also highly up-regulated compared to CK (Figure 8G,H).
The effect of As and Si treatments on the gene expression of cytokinin GATA transcription factor1 (Cga1) in DU-OE was highly up-regulated compared to control (Figure 8I).
Isocitrate dehydrogenase (NADP) (Os05g0573200), which regulates catalytic activity in DU-OE, was highly up-regulated (Figure 8J).
The expression of Os08g0522400 protein, which regulates peroxidase activity and oxidative stress in DU-OE rice, was highly up-regulated (Figure 8K).

4. Discussion

Si decreases the toxicity of some metalloids and heavy metals in plants by building complexes, preventing heavy metals from the roots to the aerial parts of plants, dividing metal ions, and activating plant antioxidant systems [11]. Si can also reduce the uptake and transport of metals in rice. Various researchers have reported that using silicon increases plant tolerance to the toxicity of metals by decreasing the uptake of heavy metals into plant roots, reducing their transfer to stems, and ultimately reducing their toxicity to plant tissues [29,30]. The present study also showed that the addition of Si increases the silicon concentration in rice roots and shoots, while decreasing the As concentration in Dular rice roots and shoots [11]. Seyfferth and Fendorf [16] also reported that, by adding Si to the soil pore water, the concentration of arsenic in rice grains was significantly reduced. Numerous similar studies have shown that As and Si compete for uptake by the root of plants, and increasing one reduces the other [16,30]. In addition, Si significantly affects the concentration of arsenic in various rice organs such as stems, leaves, grains, and husks [31]. Furthermore, different studies have shown that applying Si in different methods, such as spraying and adding to the soil, reduces the concentration of different inorganic and organic species of arsenic in different organs of rice plants [32,33]. Rice is a silicon collector, and concentration of silicon can reach 100 g/kg in rice shoots; however, because Si has similar transport pathways to arsenic (Lsi1 and Lsi2), the addition of As or Si to the culture medium can affect the uptake of the other in rice and eventually reduce its accumulation in different tissues of the rice plant [18,34]. Different studies have shown that different rice lines have different potentials for the uptake Si and As, and their tolerance to As toxicity is also different [35]. Some researchers have reported that adding similar levels of As to the culture medium of different rice genotypes causes different levels of arsenic to accumulate in those rice lines [35], similar to the present study’s results.
This study also showed that the addition of Si to the culture medium increases the amount of soluble protein in different rice, and it has been seen that silicon has a unique role against ROS toxicity, decreasing oxidative damage, decreasing protein degradation, reducing stress, improving protein synthesis, and improving protein stress-induced metabolism [36,37]. Some studies have shown that the addition of As to the culture medium reduces the soluble protein content. It may be due to the reaction of arsenic with sulfhydryl groups of proteins (severely inhibits photosynthetic activity and rice growth), increasing the rate of destruction by disrupting the membrane system, causing further oxidative damage (inhibits protein synthesis), and reducing the level of As (V) to As (Ⅲ) in cells responsible for protein damage through oxidation of thiol groups [36,38].
This study showed that the genes related to metabolic pathways were expressed after the addition of arsenic to the culture medium, and as we know, metabolic pathways are regulated by various physiological processes necessary for plant growth and development [39]. Our research also found that after exposure to stress, transgenic rice reacted differently to gene expression and antioxidant defense, and some studies have provided new insights into plant defense mechanisms, gene regulation, and gene networks in response to toxicity. One of the most important findings is the effect of As on the differential expression of the gene encoding glutathione-S-transferases (GSTs), one of the essential mechanisms in plants against As toxicity [40], which is the same as the results of our study. Different studies on various plants, including rice and Indian mustard, have shown that the overexpression of some genes makes transgenic species more resistant to As and Cd [19].
The present study deals with the differences in susceptibility among two rice lines to arsenic. This study tried to specify the effect of GST and other antioxidative enzyme genes to reduce As pollution and the positive effect of Si on reducing contamination. In this experiment, qRT-PCR showed that the number of genes related to GST was significantly expressed. Those genes included GSTU1, Os01g0369700, LOC_Os03g17460, GSTZ5, Os10g0528300, Os09g0367700, and Os10g0530500. GSTs were found in most eukaryotes, prokaryotes, and aerobic protect cells against toxic chemicals and stress [41]. The decrease and increase of antioxidative enzymes due to different stresses cause the reduction and increase of H2O2 in the plants and show that these genes’ expression is different in diverse varieties of plants [42].
Lsi1 is an active transmitter found mainly in the central region of rice root cells, which transmits Si and As (III) into the rice roots; therefore, the transmission route of As (III) from the culture medium to rice is mediated by Lsi1 [18]. Another study showed that Si is transmitted from the root epidermis to the root stele through Lsi1 and Lsi2 [43]. The expression of the Lsi1 gene in rice increases the resistance of plants to arsenite treatments [44], and studies have shown that transgenic Lsi1 or Lsi1-overexpressor transgenic rice is more resistant to toxicity of Cd by adding Si. It seems that increasing resistance to Cd stress depends not only on the amount of silicon in the culture medium, but also on the Lsi1 expression of rice [19]. Research has shown that suppressing the Lsi1 gene effects reduces the accumulation of arsenic in rice roots and shoots [20].

5. Conclusions

This experiment showed a direct relationship between the accumulation of arsenic and silicon in rice shoots and roots and the addition of these elements to the culture medium. This study also showed that the addition of silicon to the culture medium reduces the accumulation of arsenic in various tissues of the DU-OE line more than DU-WT. However, if silicon is not added to the culture medium, the DU-OE line will be severely affected by arsenic toxicity, especially in the second week, causing the plant to dry completely. The results of RNA-Seq analysis showed that different genes are expressed that belong to different gene families, suggesting that rice has complex pathways to arsenic stress conditions. Therefore, it is recommended to plant transgenic rice lines in arsenic-contaminated environments and add silicone fertilizers to the culture medium to reduce the amount of arsenic-contaminated rice as much as possible, especially in the early planting periods, which ultimately increases the health of human society. It is also recommended that further studies be performed to identify the physiological and molecular mechanisms involved in the uptake, transport, and accumulation of arsenic and silicon in different rice lines.

Author Contributions

M.R.B., W.L. and C.F. designed the experiment. M.R.B., X.Y. and M.D. performed most of the experiments. M.R.B., Z.L. and Z.Z. analyzed the data and wrote the manuscript. W.L. and C.F. edited the manuscript. All authors have read and agreed to the published version of the manuscript.

Funding

This work was supported by the Outstanding Youth Scientific Fund of Fujian Agriculture and Forestry University (Grant No. xjq201805), the National Natural Science Foundation of China (31871556). The funders had no role in study design, data collection, analysis data interpretation, or manuscript writing.

Institutional Review Board Statement

Not applicable.

Informed Consent Statement

Not applicable.

Data Availability Statement

All data generated during this study are included in this published article, and the raw data used or analyzed during the current study are available from the corresponding author on reasonable request.

Acknowledgments

We thank Gabor Pozsgai and Jiang Yuhang for their constructive comments and suggestions to complete this paper.

Conflicts of Interest

The authors declare that they have no competing interests.

References

  1. Zazouli, M.A.; Bandpei, A.M.; Maleki, A.; Saberian, M.; Izanloo, H. Determination of cadmium and lead contents in black tea and tea liquor from Iran. Asian J. Chem. 2010, 22, 1387. [Google Scholar]
  2. Shokrzadeh, M.; Fathalinezhad, F.; Khoshvishkaie, E. Concentrations of Heavy Metals (Cr, Cd, Pb) in Three Types of Rice in Astaneh-Ashrafieh, Iran. J. Maz. Univ. Med. Sci. 2017, 26, 196–200. [Google Scholar]
  3. Bhattacharya, P.; Samal, A.C.; Majumdar, J.; Santra, S. Accumulation of arsenic and its distribution in rice plant (Oryza sativa L.) in Gangetic West Bengal, India. Paddy Water Environ. 2009, 8, 63–70. [Google Scholar] [CrossRef]
  4. Bhattacharya, P.; Samal, A.C.; Majumdar, J.; Banerjee, S.; Santra, S. In vitro assessment on the impact of soil arsenic in the eight rice varieties of West Bengal, India. J. Hazard. Mater. 2013, 262, 1091–1097. [Google Scholar] [CrossRef]
  5. Srivastava, S.; Tripathi, R.D.; Dhankhera, O.P.; Upadhyay, M.K. Arsenic Transport, Metabolism and Toxicity in Plants. Int. J. Plant Environ. 2016, 2, 17–28. [Google Scholar] [CrossRef]
  6. Awasthi, S.; Chauhan, R.; Srivastava, S.; Tripathi, R.D. The Journey of Arsenic from Soil to Grain in Rice. Front. Plant Sci. 2017, 8, 1007. [Google Scholar] [CrossRef] [PubMed] [Green Version]
  7. Nookabkaew, S.; Rangkadilok, N.; Mahidol, C.; Promsuk, G.; Satayavivad, J. Determination of Arsenic Species in Rice from Thailand and Other Asian Countries Using Simple Extraction and HPLC-ICP-MS Analysis. J. Agric. Food Chem. 2013, 61, 6991–6998. [Google Scholar] [CrossRef] [PubMed]
  8. Duan, G.-L.; Hu, Y.; Liu, W.-J.; Kneer, R.; Zhao, F.-J.; Zhu, Y.-G. Evidence for a role of phytochelatins in regulating arsenic accumulation in rice grain. Environ. Exp. Bot. 2011, 71, 416–421. [Google Scholar] [CrossRef]
  9. Vandevenne, F.; Struyf, E.; Clymans, W.; Meire, P. Agricultural silica harvest: Have humans created a new loop in the global silica cycle? Front. Ecol. Environ. 2012, 10, 243–248. [Google Scholar] [CrossRef]
  10. Song, Z.; Wang, H.; Strong, P.J.; Shan, S. Increase of available soil silicon by Si-rich manure for sustainable rice production. Agron. Sustain. Dev. 2014, 34, 813–819. [Google Scholar] [CrossRef] [Green Version]
  11. Wang, H.-Y.; Wen, S.-L.; Chen, P.; Zhang, L.; Cen, K.; Sun, G.-X. Mitigation of cadmium and arsenic in rice grain by applying different silicon fertilizers in contaminated fields. Environ. Sci. Pollut. Res. 2016, 23, 3781–3788. [Google Scholar] [CrossRef] [PubMed]
  12. Hedayatifar, R.; Falahi, E.; Birjandi, M. Determination of Cadmium and Lead levels in high consumed rice (Oryza Sativa L.) cultivated in Lorestan province and its comparison with national standards. Yafteh 2011, 12, 15–22. [Google Scholar]
  13. Hoogenkamp, H.; Kumagai, H.; Wanasundara, J. Rice Protein and Rice Protein Products. In Sustainable Protein Sources; Elsevier: Amsterdam, The Netherlands, 2017; pp. 47–65. [Google Scholar]
  14. Pan, W.; Wu, C.; Xue, S.; Hartley, W. Arsenic dynamics in the rhizosphere and its sequestration on rice roots as affected by root oxidation. J. Environ. Sci. 2014, 26, 892–899. [Google Scholar] [CrossRef]
  15. Wu, C.; Zou, Q.; Xue, S.; Mo, J.; Pan, W.; Lou, L.; Wong, M.H. Effects of silicon (Si) on arsenic (As) accumulation and speciation in rice (Oryza sativa L.) genotypes with different radial oxygen loss (ROL). Chemosphere 2015, 138, 447–453. [Google Scholar] [CrossRef]
  16. Seyfferth, A.L.; Fendorf, S. Silicate Mineral Impacts on the Uptake and Storage of Arsenic and Plant Nutrients in Rice (Oryza sativa L.). Environ. Sci. Technol. 2012, 46, 13176–13183. [Google Scholar] [CrossRef]
  17. Kumar, N.; Dubey, A.K.; Upadhyay, A.K.; Gautam, A.; Ranjan, R.; Srikishna, S.; Sahu, N.; Behera, S.K.; Mallick, S. GABA accretion reduces Lsi-1 and Lsi-2 gene expressions and modulates physiological responses in Oryza sativa to provide tolerance towards arsenic. Sci. Rep. 2017, 7, 8786. [Google Scholar] [CrossRef] [Green Version]
  18. Ma, J.F.; Yamaji, N.; Mitani, N.; Xu, X.-Y.; Su, Y.-H.; McGrath, S.; Zhao, F.-J. Transporters of arsenite in rice and their role in arsenic accumulation in rice grain. Proc. Natl. Acad. Sci. USA 2008, 105, 9931–9935. [Google Scholar] [CrossRef] [Green Version]
  19. Lin, H.; Fang, C.; Li, Y.; Lin, W.; He, J.; Lin, R.; Lin, W. Cadmium-stress mitigation through gene expression of rice and silicon addition. Plant Growth Regul. 2017, 81, 91–101. [Google Scholar] [CrossRef]
  20. Dubey, A.K.; Kumar, N.; Ranjan, R.; Gautam, A.; Pande, V.; Sanyal, I.; Mallick, S. Application of glycine reduces arsenic accumulation and toxicity in Oryza sativa L. by reducing the expression of silicon transporter genes. Ecotoxicol. Environ. Saf. 2018, 148, 410–417. [Google Scholar] [CrossRef]
  21. Cock, J.; Yoshida, S.; Forno, D.A. Laboratory Manual for Physiological Studies of Rice; International Rice Research Institute: Los Baños, Philippines, 1976. [Google Scholar]
  22. Meharg, A.A.; Jardine, L. Arsenite transport into paddy rice (Oryza sativa) roots. New Phytol. 2003, 157, 39–44. [Google Scholar] [CrossRef] [Green Version]
  23. Dai, W.-M.; Zhang, K.-Q.; Duan, B.-W.; Sun, C.-X.; Zheng, K.-L.; Cai, R.; Zhuang, J.-Y. Rapid determination of silicon content in rice. Rice Sci. 2005, 12, 145–147. [Google Scholar]
  24. Hallmark, C.; Wilding, L.; Smeck, N.; Silicon, J. Methods of Soil Analysis: Part 2 Chemical Microbiological Properties; American Society of Agronomy: Madison, WI, USA, 1983; Volume 9, pp. 263–273. [Google Scholar]
  25. Bradford, M.M. A rapid and sensitive method for the quantitation of microgram quantities of protein utilizing the principle of protein-dye binding. Anal. Biochem. 1976, 72, 248–254. [Google Scholar] [CrossRef]
  26. Chomczynski, P.; Mackey, K. Short technical reports. Modification of the TRI reagent procedure for isolation of RNA from polysaccharide- and proteoglycan-rich sources. Biotechniques 1995, 19, 942–945. [Google Scholar]
  27. Wang, L.; Feng, Z.; Wang, X.; Wang, X.; Zhang, X. DEGseq: An R package for identifying differentially expressed genes from RNA-seq data. Bioinformatics 2010, 26, 136–138. [Google Scholar] [CrossRef]
  28. Livak, K.J.; Schmittgen, T.D. Analysis of relative gene expression data using real-time quantitative PCR and the 2−ΔΔCT method. Methods 2001, 25, 402–408. [Google Scholar] [CrossRef]
  29. Ashfaque, F.; Inam, A.; Iqbal, S.; Sahay, S. Response of silicon on metal accumulation, photosynthetic inhibition and oxidative stress in chromium-induced mustard (Brassica juncea L.). S. Afr. J. Bot. 2017, 111, 153–160. [Google Scholar] [CrossRef]
  30. Boorboori, M.; Lin, W.; Fang, C. The effects of arsenic and silicon on the oxidative and non-oxidative enzymes in the seedlings of three different rice (Oryza sativa L.) varieties in different growth periods. Appl. Ecol. Environ. Res. 2020, 18, 5263–5278. [Google Scholar] [CrossRef]
  31. Liu, W.-J.; McGrath, S.; Zhao, F.-J. Silicon has opposite effects on the accumulation of inorganic and methylated arsenic species in rice. Plant Soil 2014, 376, 423–431. [Google Scholar] [CrossRef]
  32. Limmer, M.; Mann, J.; Amaral, D.C.; Vargas, R.; Seyfferth, A.L. Silicon-rich amendments in rice paddies: Effects on arsenic uptake and biogeochemistry. Sci. Total Environ. 2018, 624, 1360–1368. [Google Scholar] [CrossRef]
  33. Zhang, S.; Geng, L.; Fan, L.; Zhang, M.; Zhao, Q.; Xue, P.; Liu, W. Spraying silicon to decrease inorganic arsenic accumulation in rice grain from arsenic-contaminated paddy soil. Sci. Total Environ. 2020, 704, 135239. [Google Scholar] [CrossRef]
  34. Li, G.; Zheng, M.; Tang, J.; Shim, H.; Cai, C. Effect of silicon on arsenic concentration and speciation in different rice tissues. Pedosphere 2018, 28, 511–520. [Google Scholar] [CrossRef]
  35. Bhattacharya, P. Assessment of Arsenic Accumulation by Different Varieties of Rice (Oryza sativa L.) Irrigated with Arsenic-contaminated Groundwater in West Bengal (India). Environ. Pollut. Prot. 2017, 2, 92–99. [Google Scholar] [CrossRef]
  36. Geng, A.; Wang, X.; Wu, L.; Wang, F.; Wu, Z.; Yang, H.; Chen, Y.; Wen, D.; Liu, X. Silicon improves growth and alleviates oxidative stress in rice seedlings (Oryza sativa L.) by strengthening antioxidant defense and enhancing protein metabolism under arsanilic acid exposure. Ecotoxicol. Environ. Saf. 2018, 158, 266–273. [Google Scholar] [CrossRef]
  37. Pontigo, S.; Godoy, K.; Jiménez, H.; Gutiérrez-Moraga, A.; Mora, M.L.; Cartes, P. Silicon-mediated alleviation of aluminum toxicity by modulation of Al/Si uptake and antioxidant performance in ryegrass plants. Front. Plant Sci. 2017, 8, 642. [Google Scholar] [CrossRef] [Green Version]
  38. Joy, E.; Broadley, M.; Young, S.D.; Black, C.R.; Chilimba, A.D.; Ander, E.L.; Barlow, T.S.; Watts, M.J. Soil type influences crop mineral composition in Malawi. Sci. Total Environ. 2015, 505, 587–595. [Google Scholar] [CrossRef] [Green Version]
  39. Chakrabarty, D.; Trivedi, P.K.; Misra, P.; Tiwari, M.; Shri, M.; Shukla, D.; Kumar, S.; Rai, A.; Pandey, A.; Nigam, D.; et al. Comparative transcriptome analysis of arsenate and arsenite stresses in rice seedlings. Chemosphere 2009, 74, 688–702. [Google Scholar] [CrossRef]
  40. Tripathi, R.D.; Tripathi, P.; Dwivedi, S.; Dubey, S.; Chatterjee, S.; Chakrabarty, D.; Trivedi, P.K. Arsenomics: Omics of arsenic metabolism in plants. Front. Physiol. 2012, 3, 275. [Google Scholar] [CrossRef] [PubMed] [Green Version]
  41. Li, G.; Wu, S.; Yu, R.; Cang, T.; Chen, L.; Zhao, X.; Cai, L.; Wu, C. Identification and expression pattern of ag lutathione S-transferase in E chinochloa crus-galli. Weed Res. 2013, 53, 314–321. [Google Scholar] [CrossRef]
  42. Radyukina, N.L.; Shashukova, A.V.; Makarova, S.S.; Kuznetsov, V.V. Exogenous proline modifies differential expression of superoxide dismutase genes in UV-B-irradiated Salvia officinalis plants. Russ. J. Plant Physiol. 2011, 58, 51–59. [Google Scholar] [CrossRef]
  43. Ma, J.F.; Tamai, K.; Yamaji, N.; Mitani, N.; Konishi, S.; Katsuhara, M.; Ishiguro, M.; Murata, Y.; Yano, M. A silicon transporter in rice. Nature 2006, 440, 688–691. [Google Scholar] [CrossRef]
  44. Ranjan, R.; Kumar, N.; Dubey, A.K.; Gautam, A.; Pandey, S.N.; Mallick, S. Diminution of arsenic accumulation in rice seedlings co-cultured with Anabaena sp.: Modulation in the expression of lower silicon transporters, two nitrogen dependent genes and lowering of antioxidants activity. Ecotoxicol. Environ. Saf. 2018, 151, 109–117. [Google Scholar] [CrossRef]
Figure 1. The arsenic concentration of DU-WT and DU-OE shoots, the first and second weeks after adding treatments (A). The arsenic concentration of DU-WT and DU-OE roots, the first and second weeks after adding treatments (B). The different letters on the bars indicate a significant difference among independent treatments (p ≤ 0.05); (DW: dry weight; CK: control; Si: 0.70 mM Si; As: 30 μM As; As+Si: 30 μM As + 0.70 mM Si).
Plants 10 02210 g001
Figure 2. The Si concentration of DU-WT and DU-OE shoots, the first and second weeks after adding treatments (A); and the Si concentration of DU-WT and DU-OE roots, the first and second weeks after adding treatments (B). The different letters on the bars indicate a significant difference among independent treatment (p ≤ 0.05); (DW: dry weight; CK: control; Si: 0.70 mM Si; As: 30 μM As; As+Si: 30 μM As + 0.70 mM Si).
Plants 10 02210 g002
Figure 3. The dry weight of DU-WT and DU-OE shoots, the first and second weeks after adding treatments (A); the dry weight of DU-WT and DU-OE roots, the first and second weeks after adding treatments (B). The different letters on the bars indicate a significant difference among independent treatment (p ≤ 0.05); (FW: fresh weight; CK: control; Si: 0.70 mM Si; As: 30 μM As; As+Si: 30 μM As + 0.70 mM Si).
Plants 10 02210 g003
Figure 4. Soluble protein contents of DU-WT and DU-OE shoots, the first and second weeks after adding treatments (A); soluble protein contents of DU-WT and DU-OE roots, the first and second weeks after adding treatments (B). The different letters on the bars indicate a significant difference among independent treatment (p ≤ 0.05); (FW: fresh weight; CK: control; Si: 0.70 mM Si; As: 30 μM As; As+Si: 30 μM As + 0.70 mM Si).
Plants 10 02210 g004
Figure 5. Differentially expressed genes of DU-OE as compared with DU-WT (including up-regulated and down-regulated genes).
Plants 10 02210 g005
Figure 6. GO classification of up-regulated genes in the DU-OE line (A) and GO classification of down-regulated genes in the DU-OE line (B).
Plants 10 02210 g006
Figure 7. Kyoto Encyclopedia of Genes and Genomes pathway enrichment scatter plot of up-regulated genes in the DU-OE line (A) and Kyoto Encyclopedia of Genes and Genomes pathway enrichment scatter plot of down-regulated genes in the DU-OE line (B).
Plants 10 02210 g007
Figure 8. Fold change of gene expression levels in DU-OE as compared to DU-WT. GSTU1 (A); Os09g0367700 (B); LOC_Os10g10130 (C); GSTZ5 (D); Os10g0528300 (E); Os09g0367700 (F); Os10g0530500 (G); Os02g0685200 (H); Cga1 (I); Os05g0573200 (J); Os08g0522400 (K).
Plants 10 02210 g008
Table 1. All gene primers were used for qRT-PCR.
Gene NameProtein NamePrimer SequencesAmplicon (bp)
GSTU1-FProbable glutathione S-transferase GSTU1GTGAGTTTGTTGTTACCGTTGA84
GSTU1-RGGACTCGTCAGTGTTGTACATA
Os01g0369700-FOs09g0367700 proteinGTTCGGTGAGATTCCAGTACTG86
Os01g0369700-RTGTACTTGCGAAAGATGTACCT
LOC_Os03g17460-FIN2-1 protein, putative, expressedCACCTTGATCTGCATTTGTCAA89
LOC_Os03g17460-RATGGGCAAATGTTGACATGTAC
GSTZ5-FProtein IN2-1 homolog BAAGATTGTCGCGATTGATCTTG95
GSTZ5-RTGATTGTTGTGCTCAAGTGAAG
Os10g0528300-FGlutathione S-transferaseCAAGATCTTCGACGAGGAGAAG123
Os10g0528300-RCTCATCTTAGCGAACTCGACC
Os09g0367700-FOs09g0367700 proteinTGGTTCCACGCCTACGAGA126
Os09g0367700-RCTTCTCAGGATCAGTAAGCGTC
Os10g0530500-FOs10g0530500 proteinACAACATGTTCCCTGGAATGG166
Os10g0530500-RTCGACGTACCCGATGGAGTC
Os02g0685200-FOs02g0685200 proteinCGGTGGGTTCTCGAATAACTC193
Os02g0685200-RCGTGGTTGCAATTGACATCTTA
CGA1-FCYTOKININ-RESPONSIVE GATA TRANSCRIPTION FACTOR 1CACAGAACCCGATATCCAAGG197
CGA1-RGCCCTCATCAAATTAACGGTAC
Os05g0573200-FIsocitrate dehydrogenase [NADP]CTAAATGGCACTGTGTTCAGAG252
Os05g0573200-RGGACTCGTCAGTGTTGTACATA
Os08g0522400-FOs08g0522400 proteinCAAAGACAAGCTTTCACCGTAA282
Os08g0522400-RCAGAAAAGAACGCTGCCTTTAA
actin1(Os03g0718100)-F CTTCATAGGAATGGAAGCTGCGGGTA26
actin1(Os03g0718100)-RCGACCACCTTGATCTTCATGCTGCTA
Table 2. ANOVA results due to As, Si, rice genotypes, and their interactions on the As concentration and dry weight of DU-WT and DU-OE shoots and roots at different sampling times.
Sampling TimeParameterGenotypesAsSiGenotypes × AsGenotypes × SiAs × SiGenotypes × As × Si
1st weekShoot
As concentration
42.01 **16595.59 **2453.05 **118.54 **50.85 **904.34 **15.45 **
Root
As concentration
22.18 **10391.57 **711.33 **5.58 **46.15 **207.94 **92.80 **
Shoot
dry weight
17.21 **55.04 **22.71 **0.701.422.110.26
Root
dry weight
3.2143.13 **23.79 **0.020.381.240.13
2nd weekShoot
As concentration
863.84 **12289.71 **2397.37 **611.74 **799.68 **1161.99 **371.13 **
Root
As concentration
32.77 **12514.50 **866.25 **12.56 **148.88 **217.80 **123.61 **
Shoot
dry weight
2.87 **45.87 **28.03 **0.060.251.200.30
Root
dry weight
0.8644.26 **26.90 **0.020.061.660.03
** Significant at the level of 1%.
Publisher’s Note: MDPI stays neutral with regard to jurisdictional claims in published maps and institutional affiliations.

