Article

Research on PointPillars Algorithm Based on Feature-Enhanced Backbone Network

1
Qingdao Computing Technology Research Institute, Xidian University, Qingdao 266071, China
2
School of Computer Science and Technology, Xidian University, Xi’an 710119, China
*
Author to whom correspondence should be addressed.
Electronics 2024, 13(7), 1233; https://doi.org/10.3390/electronics13071233
Submission received: 5 January 2024 / Revised: 29 January 2024 / Accepted: 4 February 2024 / Published: 27 March 2024

Abstract

:
In the industrial field, the 3D target detection algorithm PointPillars has gained popularity. Improving target detection accuracy while maintaining high efficiency has been a significant challenge. To address the issue of low target detection accuracy in the PointPillars 3D target detection algorithm, this paper proposes an algorithm based on feature enhancement to improve the backbone network. The algorithm enhances preliminary feature information of the backbone network by modifying it based on PointPillars with the aid of channel attention and spatial attention mechanisms. To address the inefficiency caused by the excessive number of subsampled parameters in PointPillars, FasterNet (a lightweight and efficient feature extraction network) is utilized for down-sampling and forming different scale feature maps. To prevent the loss and blurring of extracted features resulting from the use of inverse convolution, we utilize the lightweight and efficient up-sampling modules Carafe and Dysample for adjusting resolution. Experimental results indicate improved accuracy under all difficulties of the KITTI dataset, demonstrating the superiority of the algorithm over PointPillars.

1. Introduction

With the ongoing advancements in automatic driving, virtual reality, and intelligent manufacturing, among other application scenarios, the detection of three-dimensional object targets has emerged as a favored technique in the realm of computer vision [1]. The advancement in LiDAR manufacturing processes has led to a gradual increase in the density of radar output point clouds, resulting in improved measurement accuracy. As a result, the point cloud 3D object detection algorithm, which utilizes point clouds as the input, has become mainstream technology in the field of vision. Currently, 3D target detection in point clouds relies primarily on point- and voxel-based methods. While the PointNet [2] and VoxelNet [3] approaches have adequately prepared for feature extraction from point clouds, the data’s sparsity and complexity present difficulties in capturing the target, leading to poor detection accuracy [4,5].
The PointPillars 3D target detection algorithm has gained immense popularity in the industry owing to its high efficiency and accuracy [6]. The algorithm converts three-dimensional point cloud voxel [3] features into two-dimensional images for detection, thereby greatly reducing operating costs. However, the main challenge presently is to enhance detection accuracy while maintaining efficiency. Several scholars from various countries have proposed different methods to address this issue. Ryota et al. suggest varying voxel sizes and carrying out feature fusion after extracting the features [7]. Li et al. recommend incorporating the attention mechanism within the voxel and introducing relationship features between diverse point clouds [8]. Konrad et al. [9] aim to replace the backbone network with alternative feature extraction networks. However, although these approaches have been attempted, they only result in marginal improvement of the detection accuracy. In light of this, they suggested that a considerable amount of parameters in PointPillars are concentrated in the backbone network. As a solution, novel backbone networks like MobileNet and DarkNet have been employed as substitutes to the original convolution.
The results showed that this modification greatly enhances detection efficiency. After a meticulous investigation, this study concludes that enhancing the backbone network (2D Convolutional Neural Networks) is the most effective way to maximize detection accuracy and efficiency. Down-sampling the model and implementing the attention mechanism, along with sampling the backbone network, can significantly enhance the detection precision and efficiency. Compared with the existing literature, the major contributions of this work can be summarized as follows, and the new backbone network steps are shown in Figure 1.
  • Enhancing features of pseudo-images generated through the algorithm via channel attention, spatial attention, and 1 × 1 2D convolution.
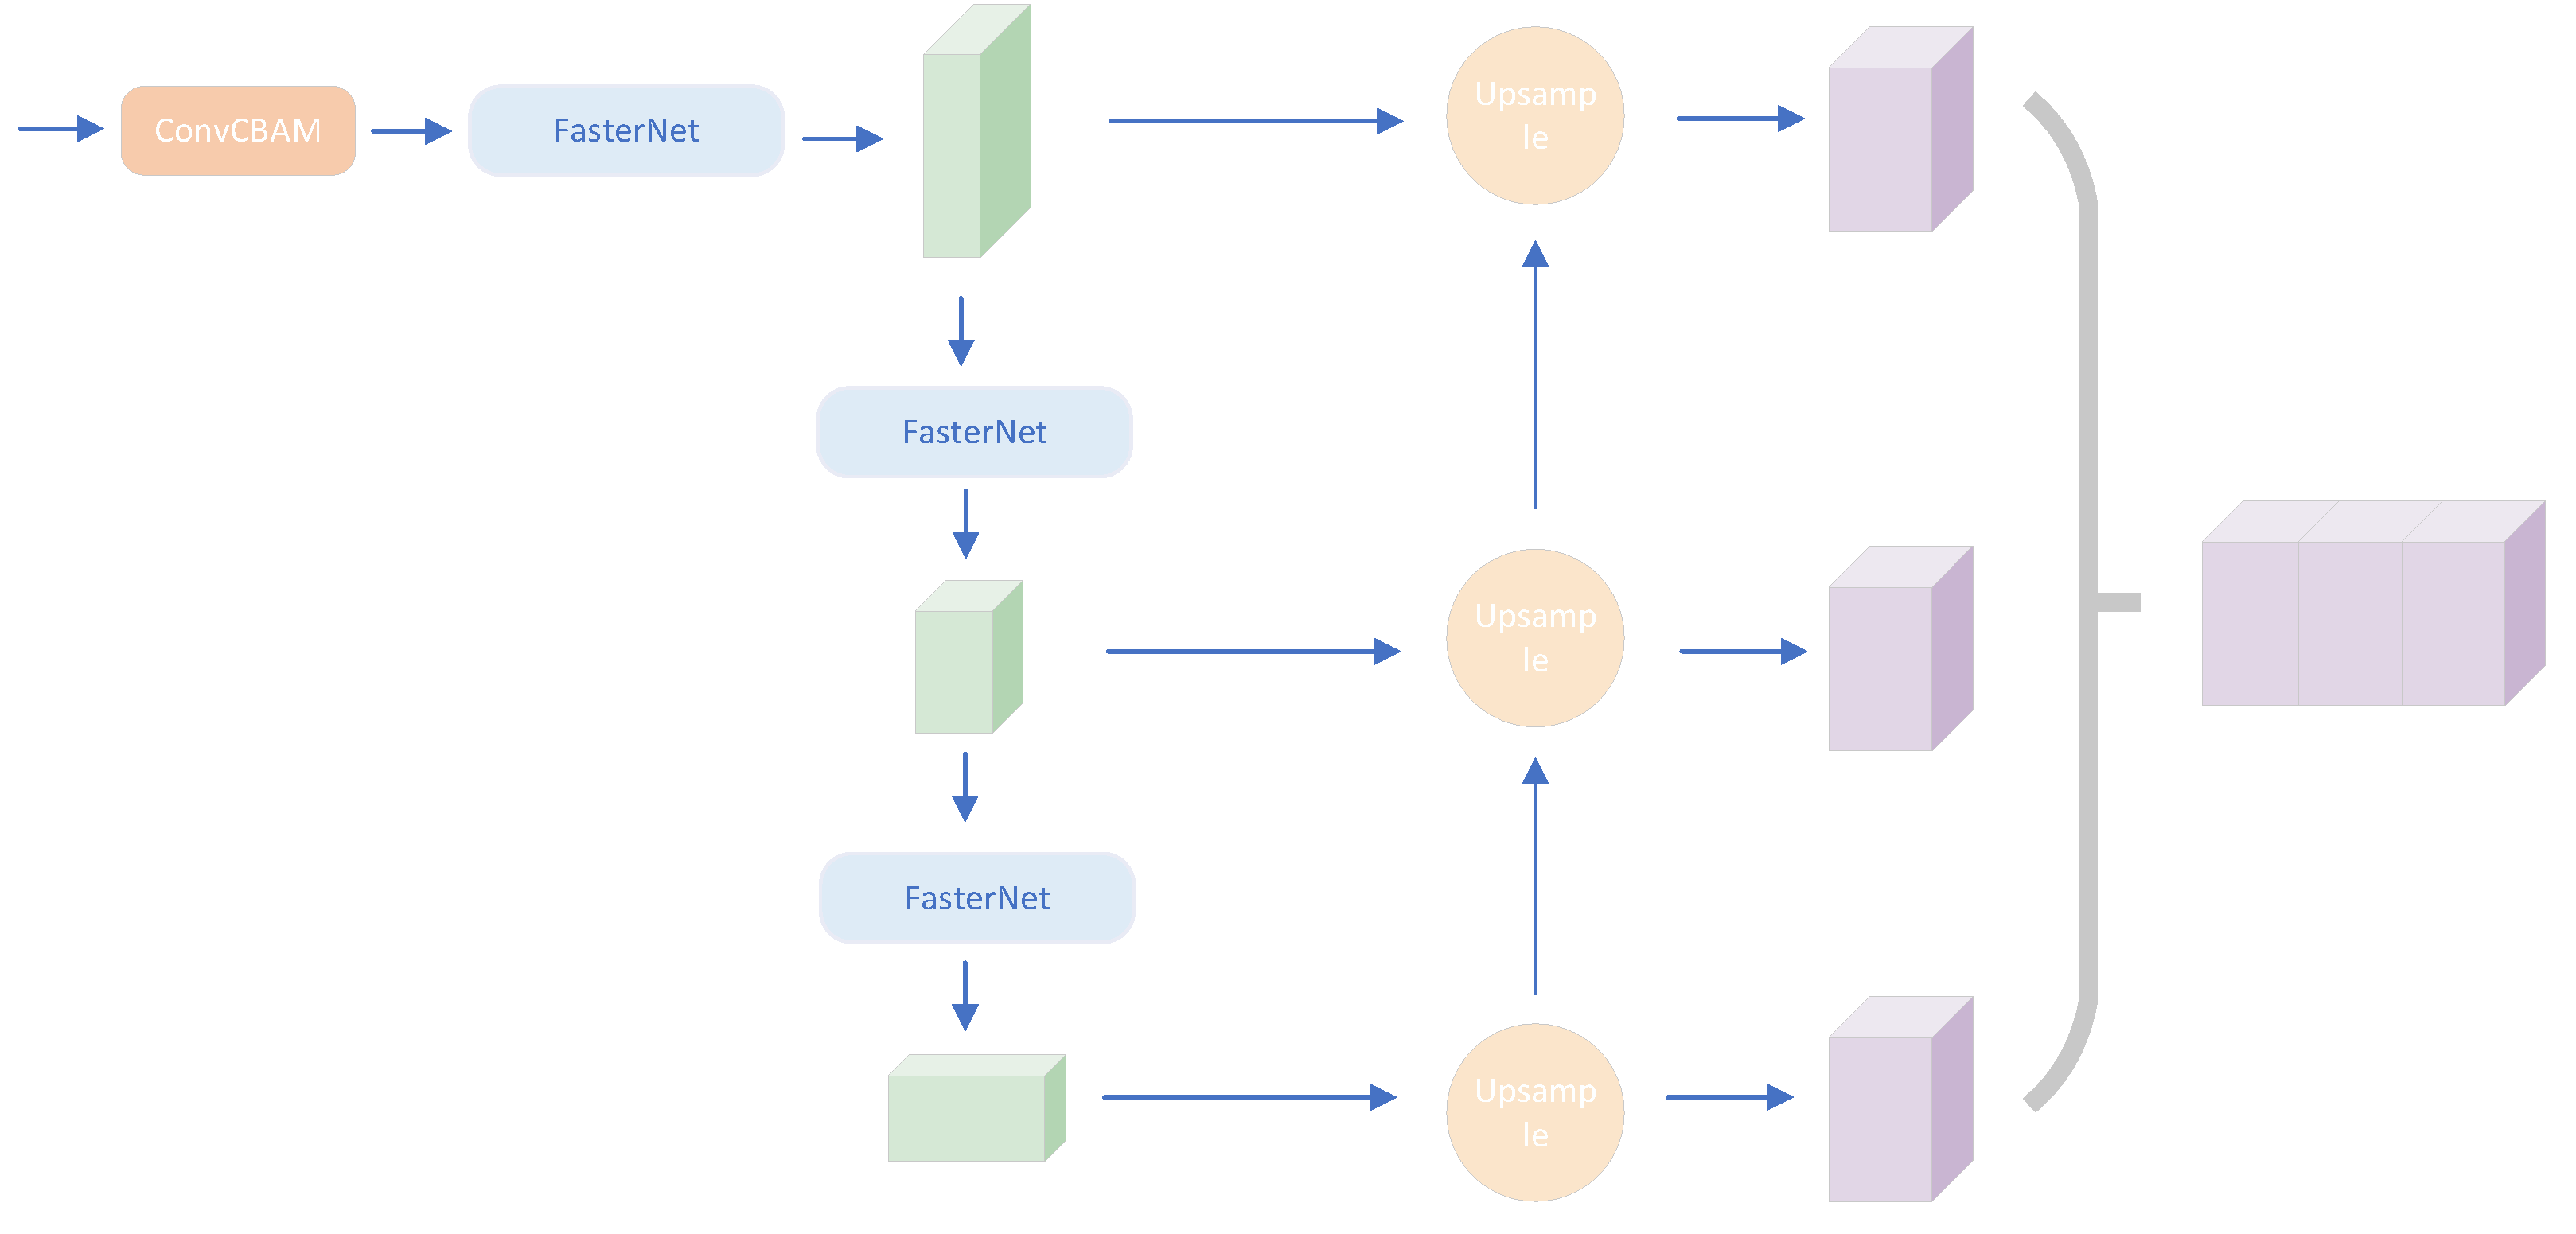
  • FasterNet [10], a more lightweight network, replaces the feature extraction network, resulting in a significant reduction in module parameters. This replacement not only enhances detection accuracy but also decreases the number of parameters required.
  • Replacing the original model’s inverse convolution technique involves the implementation of two up-sampling methods and feature enhancement using proximity scale sampling methods.

2. Related Work

LiDAR data are commonly processed with Deep Convolutional Neural Networks (DCNNs), which integrate the entire processing flow, resulting in high computational and storage complexity. Target detection algorithms based on DCNNs outperform traditional methods in terms of detection accuracy and recognition rate [9]. Traditional 2D image detection algorithms, which utilize a camera as a data source, rely on an external light source and cannot precisely determine information such as distance, position, depth, and angle of targeted vehicles and individuals. In contrast, LiDAR generates three-dimensional point cloud data that provide details such as the object’s position, distance, depth, and angle, making the data representation more realistic. LiDAR provides the benefits of precise ranging and does not require visible light [11].
The unstructured and non-fixed-size characteristics of the point cloud hinder its direct processing by 3D target detectors; therefore, it necessitates transcription into a more condensed structure through some sort of expression form [12]. Currently, there are two primary expression forms: point-based and voxel-based procedures. The transcribed point cloud can undergo feature detection via convolutional or established backbone networks. Networks vary in their feature extraction capabilities and parametric quantities; thus, network choice should be evaluated on a case-by-case basis.

2.1. Point-Based, Voxel-Based Approach to Target Detection

Qi et al. first extracts the PointNet network to derive features directly from the disordered point cloud. The T-Net network is then employed to predict the affine transformation matrix to align all the points with features. The symmetric function (MaxPooling) is utilized to address the disorderedness of the point cloud, while the multilayer perceptron resolves the problem of point cloud order invariance [2]. PointNet fails to address the issue of uncertain local feature extraction. To obtain more efficient features, PointNet++ [13] employs a Hierarchical Set Abstraction layer, with each module using several Set Abstraction modules to extract features. To enhance feature extraction capability, PointNet++ utilizes Hierarchical Set Abstraction (HSA). HSA leverages various Set Abstraction modules for extracting features. Each module differs in the number of sampling points and the sampling radius. Consequently, this approach effectively improves local feature extraction. PointRCNN [14] utilizes PointNet++ for feature extraction, alongside foreground and background segmentation based on the aforementioned extracted features, 3D frame prediction on each foreground point, and, ultimately, further refinement on the object of interest. Whilst these approaches allow for maximization of geometric point cloud features and consequently improve detection performance, they do demand extensive time and computational resources during the feature extraction phase [15].
The process of transforming point clouds into voxels involves dividing the space occupied by the point cloud into blocks of a fixed size. The features of the point clouds within these voxel blocks are then extracted. The VoxelNet algorithm utilizes the Voxel Feature Encoder (VFE) to measure and standardize the features across voxels. Subsequently, a 3D convolutional neural network is employed to extract the features of the voxels, and finally, an RPN network is used to generate the detection frame. Due to numerous voxels, feature extraction is sluggish. Yan et al. [16] proposed utilizing 3D sparse convolution to conduct feature extraction of regulated voxels based on VoxelNet due to the rarity of the point cloud, which significantly improved the processing speed in contrast to VoxelNet. Lang et al. [17] recommended PointPillars, which effectively columnate the voxel points and change the height of the voxel to correspond to that of the point cloud space. A straightforward PointNet is applied to convert the voxel into a pseudo-image, allowing 2D convolution to extract features while maintaining 3D characteristics, thus significantly increasing the operational speed. PointPillars is the most prevalent 3D detection algorithm in the industry due to its rapid operation and exceptional accuracy. Voxel-based techniques have lower detection accuracy than point methods. How to ensure the detection efficiency on the basis of improving the detection accuracy has become a research hotspot.

2.2. Feature Extraction Networks

Different blocks and depths are employed by feature extraction networks to extract features. To prevent the issue of gradient explosion and gradient disappearance from more extensive models, He et al. [18] proposed ResNet, which uses residual networks that allow network layers to reach significant depth. The MobileNet [19] algorithm reduces the number of network parameters by using depth-separable convolution and introducing shrinkage hyperparameters. This approach provides excellent support for real-world scenarios in devices with limited computational power. DarkNet employs a repeated stacked down-sampled convolution and residual block architecture, renowned for its speed and efficiency, particularly in YOLO model series. This structure enables DarkNet to perform real-time or near real-time target detection, making it ideal for use on devices with limited computational power [20]. Extraction networks are progressing towards achieving greater accuracy with fewer parameters, and the utilization of appropriate feature extraction networks can significantly enhance target detection efficiency and accuracy.

3. Feature-Enhanced Backbone Network
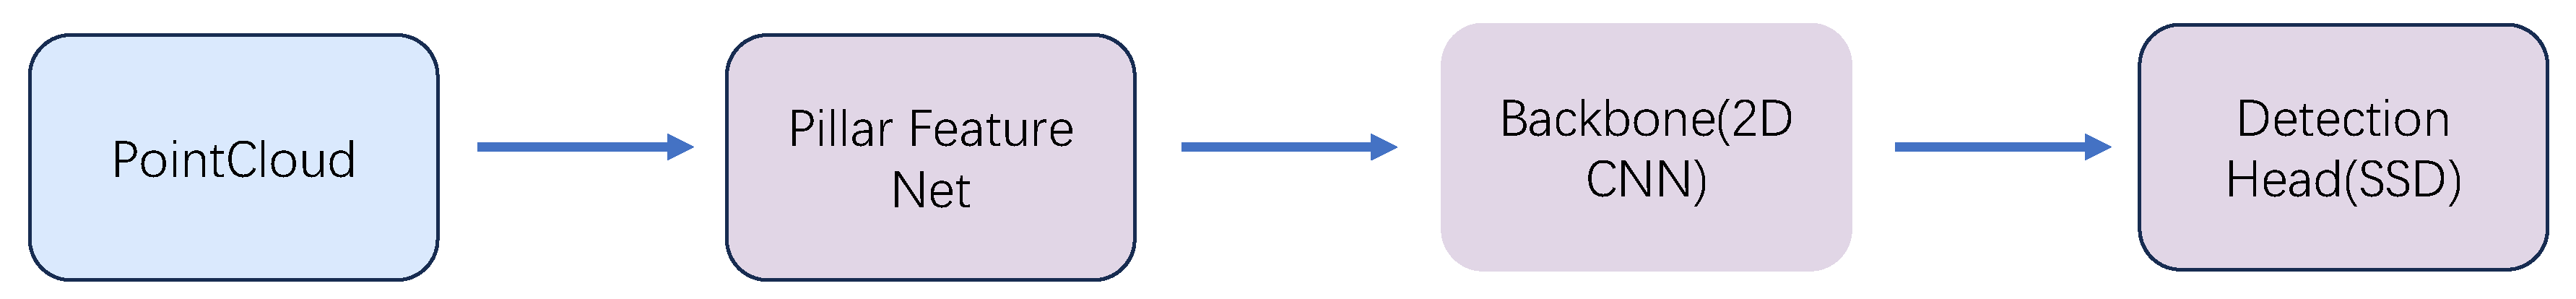
This section will introduce the PointPillars model and how it can be improved for the backbone network.

3.1. PointPillars

The PointPillars algorithm comprises four main parts: point cloud columnarization, backbone feature extraction, and detection header output, as illustrated in Figure 2.
  • Point cloud input. The original input point cloud is entered, and the point cloud is augmented using data augmentation methods, including random inversion and random scaling, to improve model performance.
  • Columnarization of point cloud. A square box is created based on X-Y, with Z as the vertical dimension of point columns. Each column comprises multiple points, and a basic PointNet network is then employed to project the original point cloud onto a 2D plane, generating a sparse 2D pseudo-image that assists in subsequent feature learning. Technical abbreviations are explained when first employed [5].
  • Feature extraction. A 2D convolutional neural network down-samples the pseudo-image several times, creating feature maps with varying resolutions and channels. The down-sampling-generated feature maps are up-sampled using inverse convolution to the same channel and resolution feature maps, and subsequently merged to form the final map.
  • Detection head output. The feature map is fed to the SSD (Single Shot MultiBox Detector) detection head to perform the target’s classification and the regression of the enclosing frame, obtaining the object’s position and type. SSD is a deep learning model used for detecting multiple image targets simultaneously. It achieves this by applying multiple anchor frames (anchors) on different levels of the feature map. PointPillars applies the same idea to point cloud data for target detection.

3.2. FasterNet Lightweight Feature Extraction Network

In the original version of the PointPillars network, most of the multiply-add operations (about 84%) are concentrated in the backbone, specifically in the “top-down” submodule. Thus, potentially, speeding up this part of the algorithm will have the greatest impact on the time results obtained [9]. To create faster neural networks, researchers have concentrated on reducing FLOPs. However, it is important to note that FLOPs and neural network latency do not always have a direct correlation. To achieve greater speed, FasterNet utilizes Partial Convolution (PConv), which improves the extraction of spatial features and reduces both redundant computation and memory access. As a result, FasterNet [10] is considerably quicker than other networks. To fully utilize all channel information, we have incorporated Point-Wise Convolution (PWConv) after PConv. This enhances the effective sensory field of input feature maps to resemble a T-shaped Conv, which focuses more on the central position than regular Conv.
FasterNet is designed primarily as a combination of Stage and Embedding. Each Stage is subject to an Embedding or Merging layer for spatial down-sampling and expansion of channel number. Each stage consists of a series of FasterNet Blocks comprised of PConv and PWConv. This paper presents the fine-tuning of the original FasterNet model to align with the PointPillars setup. The proceedings are elaborated as Figure 3.
  • Block depth settings correspond to PointPillars.
  • Add Embedding before each block for down-sampling.
  • The activation function uses GELU as suggested by FasterNet, and PointPillars remains unchanged using RELU. GELU is an activation function based on the Gaussian distribution. It has the advantage of avoiding the gradient vanishing problem, as the gradient does not become very small when the input value is relatively large or small. Additionally, the GELU function has a non-zero derivative when the input value is negative, which helps to avoid the neuron death problem. This improves the running effect when the computational complexity is low.
For the modifications in this paper, the parameters and other relevant data were calculated for PointPillars with FasterNet replacement.
From the Table 1, it can be seen that by using FasterNet instead of down-sampling, the total parameters are reduced by almost 50% and the multiply-add operation is reduced by about nine times. The detection accuracy is improved after performing the substitution, and we will give detailed results in the next section.

3.3. Attention-Based Feature Enhancement

The primary objective of attentional mechanisms is to suppress the influence of unimportant regions in an image through a heightened focus on regions of interest [21]. Attention mechanisms can be categorized into channel attention mechanisms, spatial attention mechanisms, and self-attention mechanisms. Some commonly used attention mechanism modules include ECA [22], CBAM [23], SENet [24], PAN, STN, and PSA [25], et al.
The channel attention mechanism enhances the network’s expressiveness in the feature representation by evaluating the significance of each channel. This, in turn, advances the model’s performance. Each channel of the feature map acts as a feature detector that concentrates on the positional information within the image. Equation (1) shows that the feature F is computed by a multilayer perceptron using average pooling and maximum pooling. The attention score is obtained by processing the sum of the results through an activation function.
M c ( F ) = σ ( M L P ( A v g P o o l ( F ) ) + M L P ( M a x P o o l ( F ) ) )
The spatial attention mechanism aims to facilitate the model’s adaptive learning of attention weights in various regions through the integration of an attention module. This allows the model to prioritize important image regions while ignoring those that are unimportant. To calculate spatial attention, the average pooling and maximum pooling are performed in the channel dimensions before concatenating the feature maps. Then, a convolution operation is applied to the spliced feature maps to generate the ultimate spatial attention feature maps. Equation (2) shows that the spatial attention score is obtained by combining the results of average pooling and maximum pooling, followed by convolution with a 7 × 7 kernel and activation function. The use of a 7 × 7 kernel significantly improves field of viewability and feature extraction.
M s ( F ) = σ ( f 7 × 7 ( [ A v g P o o l ( F ) ; M a x P o o l ( F ) ] ) )
The attention mechanism aims to highlight significant features of the image while minimizing irrelevant regional responses. Through analyzing research on channel and spatial dimensions, the CBAM (Convolutional Block Attention Module) has been developed and proven to enhance network performance by accurately directing attention and suppressing irrelevant noise information. As shown in Equation (3), the feature map, channel attention scores, and spatial attention scores are multiplied element-wise to obtain the spatial channel attention scores after the activation function.
M c b a m ( F ) = σ ( ( F × M c ( F ) × M s ( F × M c ( F ) ) ) )

3.4. Carafe and Dysample Sampling on the Proximity Scale

The commonly used feature up-samplers are NN and bilinear interpolation. They apply fixed rules to interpolate the low-res feature, ignoring the semantic meaning in the feature map [26]. Max unpooling has been adopted in semantic segmentation by SegNet to preserve the edge information, but the introduction of noise and zero filling destroy the semantic consistency in smooth areas. Similar to convolution, some learnable up-samplers introduce learnable parameters in up-sampling. For example, deconvolution up-samples features in a reverse fashion of convolution. Pixel Shuffle uses convolution to increase the channel number ahead and then reshapes the feature map to increase the resolution.
PointPillars utilizes the inverse convolution technique to up-sample, which can enhance image resolution but disregards significant semantic content. To circumvent this limitation, this study replaces the original deconvolution with Carafe [27] and Dysample’s [26] light-weight up-sampling operators, respectively. Furthermore, an up-sampling approach involving an approximated scale fusion method is introduced to enrich the semantic relationship among various scales. Approximate scale fusion involves combining the current scale with the approximate scale post operator up-sampling. The resulting fused features will serve as current features, facilitating the incorporation of information from various scales. The module structure is shown in Figure 4.
F = R e L U ( X + U p s a m p l e ( Y ) )
In Eqution (4), Y is the current scale feature, and X is the neighbouring scale feature. The final feature map F is obtained by weighting and summing the current feature Y, which has been sampled through the custom up-sampling module, with the neighbouring features.
Content-aware reorganization of features (Carafe) proposed by Wang et al. [27] is a generic, lightweight, and efficient component. Carafe reassembles features in a predefined region centered on each location by weighted combinations, where the weights are generated in a content-aware manner. In addition, each location has multiple sets of such up-sampling weights, and then feature up-sampling is achieved by rearranging the generated features as a spatial block. The advantages of Carafe are as follows:
  • Large sensory field: Unlike previous approaches, such as bilinear interpolation, Carafe can aggregate contextual information within a large receptive field.
  • Content-aware: Instead of using a fixed kernel for all samples, Carafe supports instance-specific content-aware processing and can dynamically generate adaptive kernels.
  • Lightweight and fast: Carafe has low computational overhead and can be easily integrated into existing framework networks.
Dysample is another ultra-lightweight, efficient dynamic up-sampler. Unlike CARAFE, Dysample bypasses dynamic convolution and specifies up-sampling from a point-sampling point of view, which is more resource efficient. Dysample does not require custom CUDA packages and has fewer parameters, FLOPs, GPU memory, and latency.

4. Results

In this study, we conducted experimental evaluations utilizing the extensive KITTI dataset, which is publicly available. The dataset comprises 7481 training samples and 7518 test samples captured from autonomous driving scenarios. We partitioned the training data into a training set of 3712 frames and a validation set of 3796 frames using the PointPillars algorithm. The training set was utilized for testing, while the validation set was utilized for experimental studies. The KITTI dataset encompasses three classifications: car, cyclist, and pedestrian are each classified into three levels of difficulty: easy, medium, and hard, which are determined by various factors such as 3D object size, occlusion level, and truncation level [28].
The experimental environment used in this study comprises Ubuntu 18.04 LTS, CUDA 11.4, Python 3.8, and pytorch 1.13.1. To achieve end-to-end training, the Adam optimizer was applied, with a batch size of 8, a maximum of 100 iterations, and no ground truth frame. In the experiments, each Pillar was set to a size of [0.16, 0.16] in the X–Y dimensions, the maximum number of columns was 12,000, and the global point cloud was randomly scaled in the range of [0.95, 1.05].

4.1. Experimental Results and Analysis

The algorithms in this paper were tested on the KITTI dataset and evaluated for accuracy using 40 predefined locations from the official KITTI test. The IOU (Intersection over Union, one of the evaluation indicators) threshold was set at 0.7 for cars and 0.5 for pedestrians and cyclists.
Table 2, Table 3 and Table 4 compare the results of this paper with those of the PointPillars algorithm on the KITTI dataset for the car, pedestrian, and cyclist categories. This paper analyzes the detection effect. This paper examines the topic from three different perspectives: BEV (accuracy of detection frames in BEV view), 3D (accuracy of 3D inspection frames), and AOS (accuracy of detecting target rotation angle).
From the data in the above table, it is evident that up-sampling in Dysample or Carafe improves the detection of the KITTI dataset in any difficulty, although certain types of objects are biased towards improvement. Notably, Carafe up-sampling shows a more substantial improvement in object types. Specifically, in BEV, there is an improvement of cyclist from 81.44 to 85.64 in easy difficulty, and in 3D mode, there is a 6.51 improvement in easy difficulty. In AOS mode, the most significant enhancement is observed for pedestrian, with a maximum improvement of 6.24 in medium difficulty. The improvement effect is also more apparent in easy and hard modes. Dysample displays the most noticeable improvement in pedestrian. On the other hand, the improvement of Dysample is less pronounced, which could be attributed to its lack of dynamic feature extraction. Meanwhile, the precision of this optimized algorithm has significantly increased compared to other algorithms, such as VoxelNet, SECOND, and others.
It is apparent that the up-sampling techniques of Dysample and Carafe differ in their effect on target feature reconstruction. If detection accuracy is a priority, Carafe up-sampling is a suitable option. However, if detection efficiency is required, then Dysample may be more appropriate.

4.2. Ablation Experiments

In this section, we provide the results of ablation experiments to evaluate the key factors that affect the accuracy of the experiments.
The results of the ablation experiments, shown in Table 5 and Table 6, indicate that replacing each module separately led to an improvement beyond the set parameters. The replacement of the backbone network showed the most significant improvement, with FasterNet demonstrating the most noticeable increase in detection accuracy. The Attention Mechanism module showed an improvement of nearly 1 in detection at all difficulties. Both up-sampling methods, Carafe and Dysample, demonstrated significant improvement. However, the improvement was more pronounced for Carafe up-sampling.

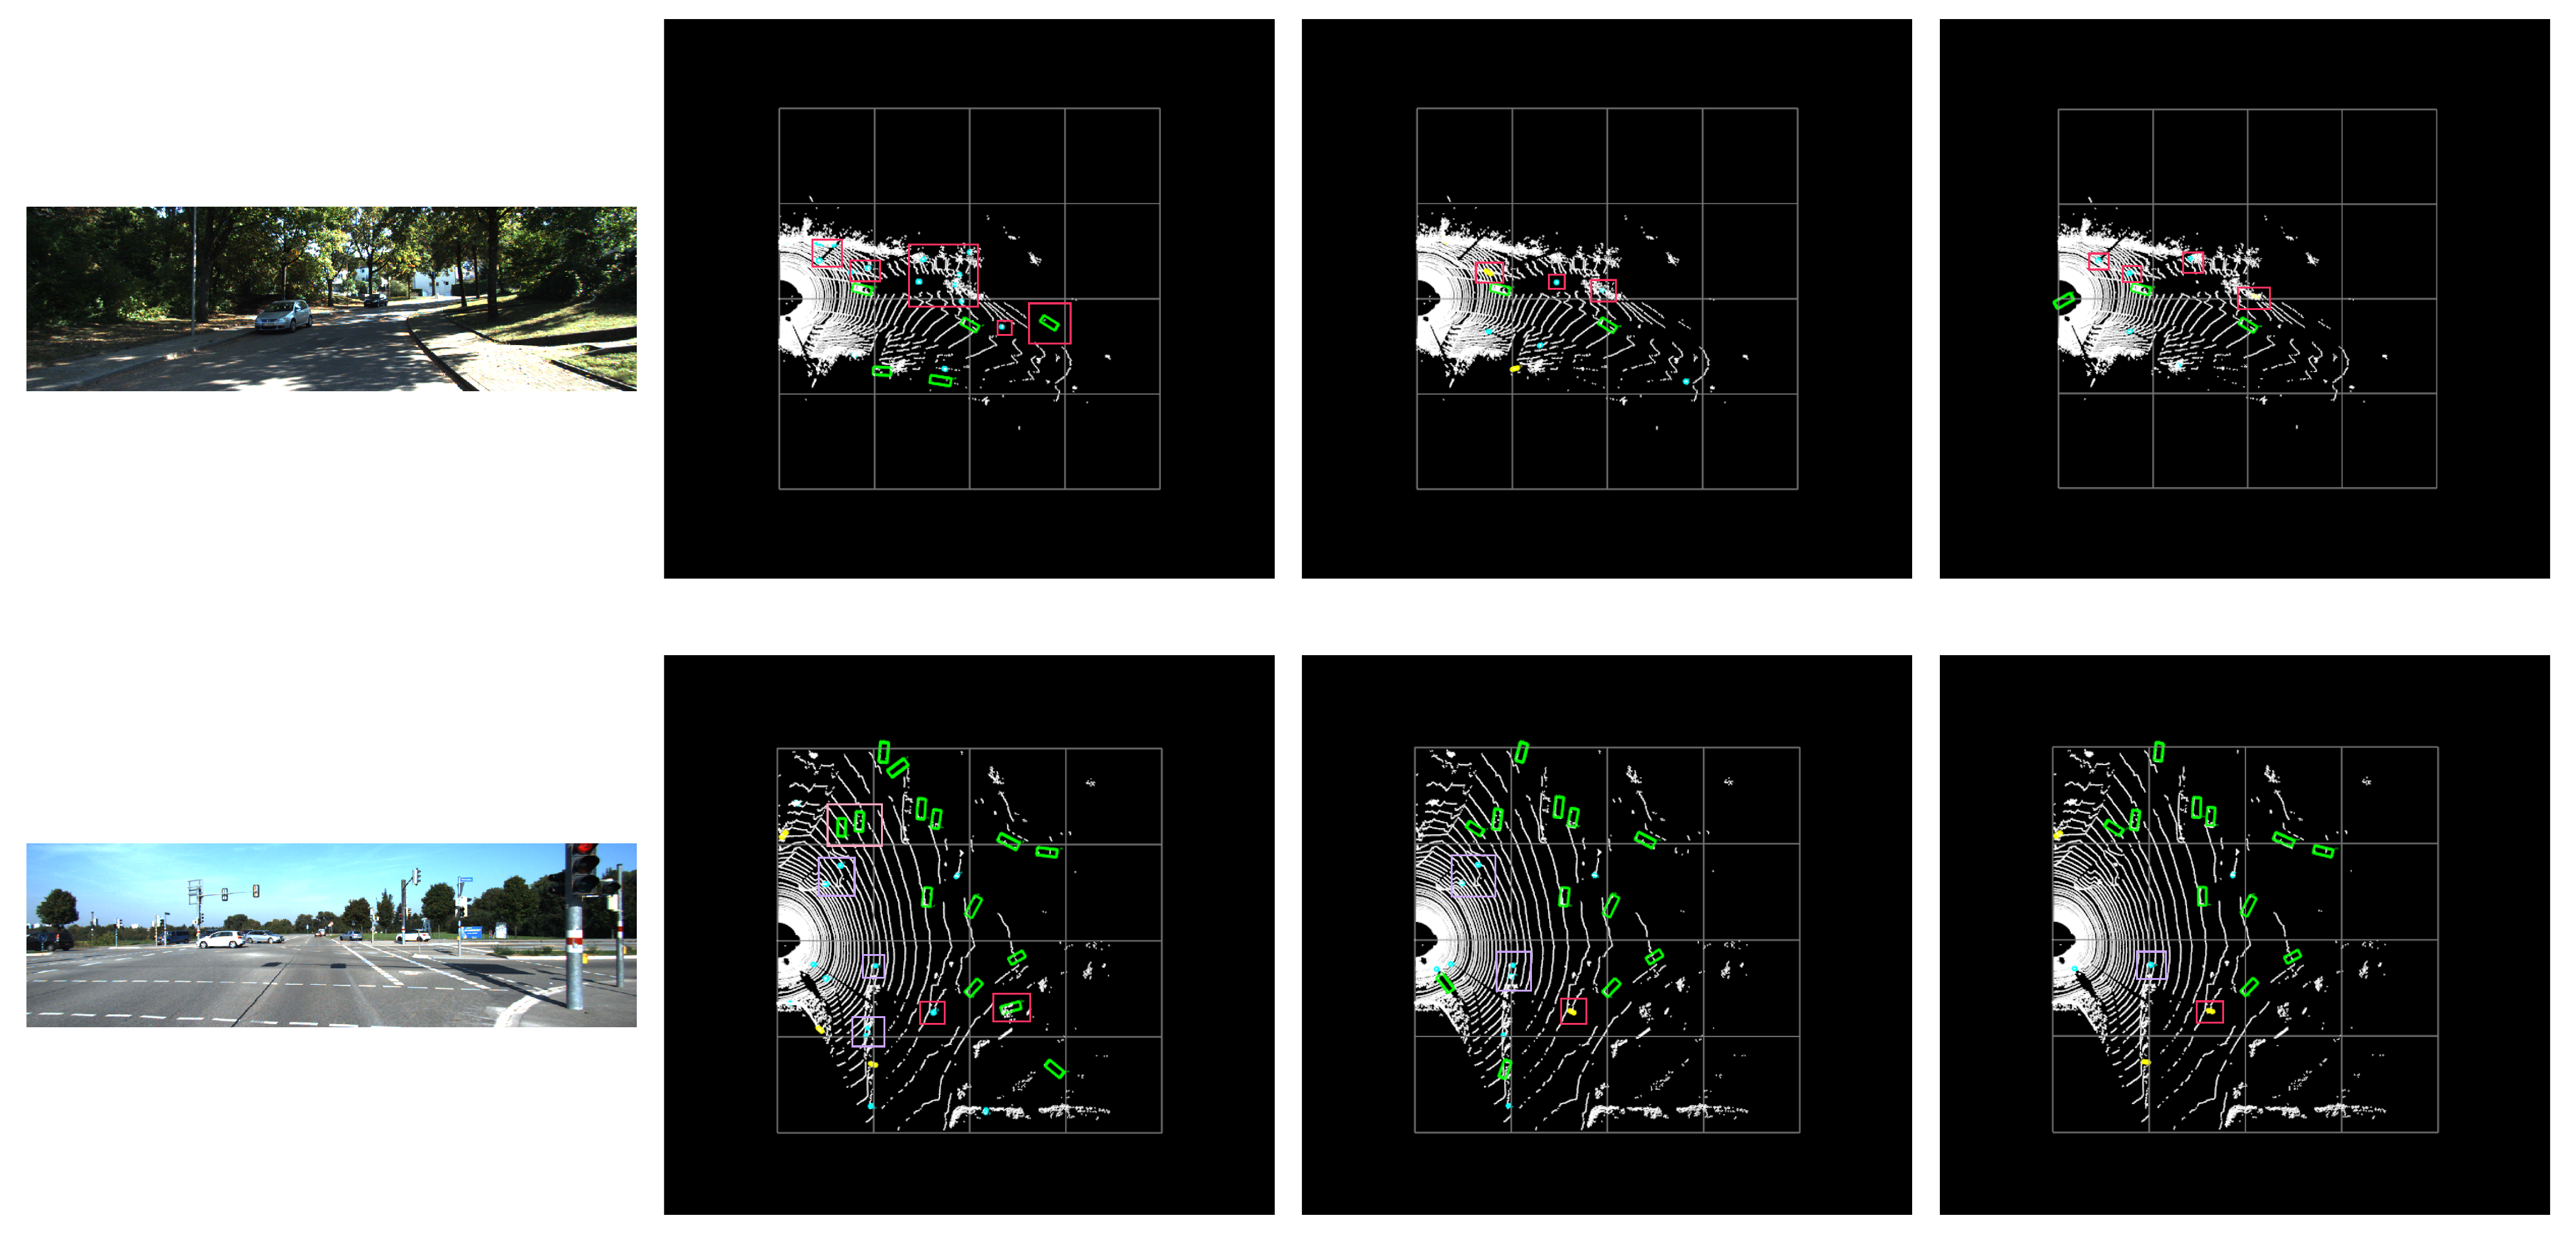
4.3. Visualization Analysis

To provide evidence of the method’s effectiveness in improving detection accuracy, this section presents visualized and analyzed results of the algorithm. Due to the use of pure radar data in the algorithm, the relevant information cannot be visually represented. Therefore, the front-view camera image is referred to as a comparison for the radar detection results in the BEV view.
After analyzing the four scenes in Figure 5, it is evident that the PointPillars network misidentifies point cloud shapes reflected from objects such as tree trunks and line poles as cars or pedestrians. However, the model with the improved backbone network has a significantly lower misdetection and error detection rate. The improved backbone network strengthens the features of the point cloud pseudo-images, while the lightweight network and proximity scale sampling method retain more semantic information and improve the module’s ability to extract features. As a result, the improved PointPillars outperform the pre-improved version by reducing misdetection and omission, ultimately improving network detection performance.
  • In the initial scene, PointPillars identifies the far-off iron house as a vehicle, which the algorithm in the optimization is able to avoid. Additionally, there are more trees on the left side, and PointPillars recognizes the number as people, which is significantly reduced compared to PointPillars in the optimized algorithm, although there is also a misdetection.
  • In the second scenario, PointPillars made a mistake during multi-check by identifying the iron ladder near the car as a car. This error was avoided in the optimized scenario. Multi-checks occurred near the point in PointPillars and PP Carafe, mistaking the road sign for a person. The optimized scheme shows the direction of the two cars in the upper left at a more accurate angle. The three scenarios resulted in a false pickup on the right against the red streetlight army.
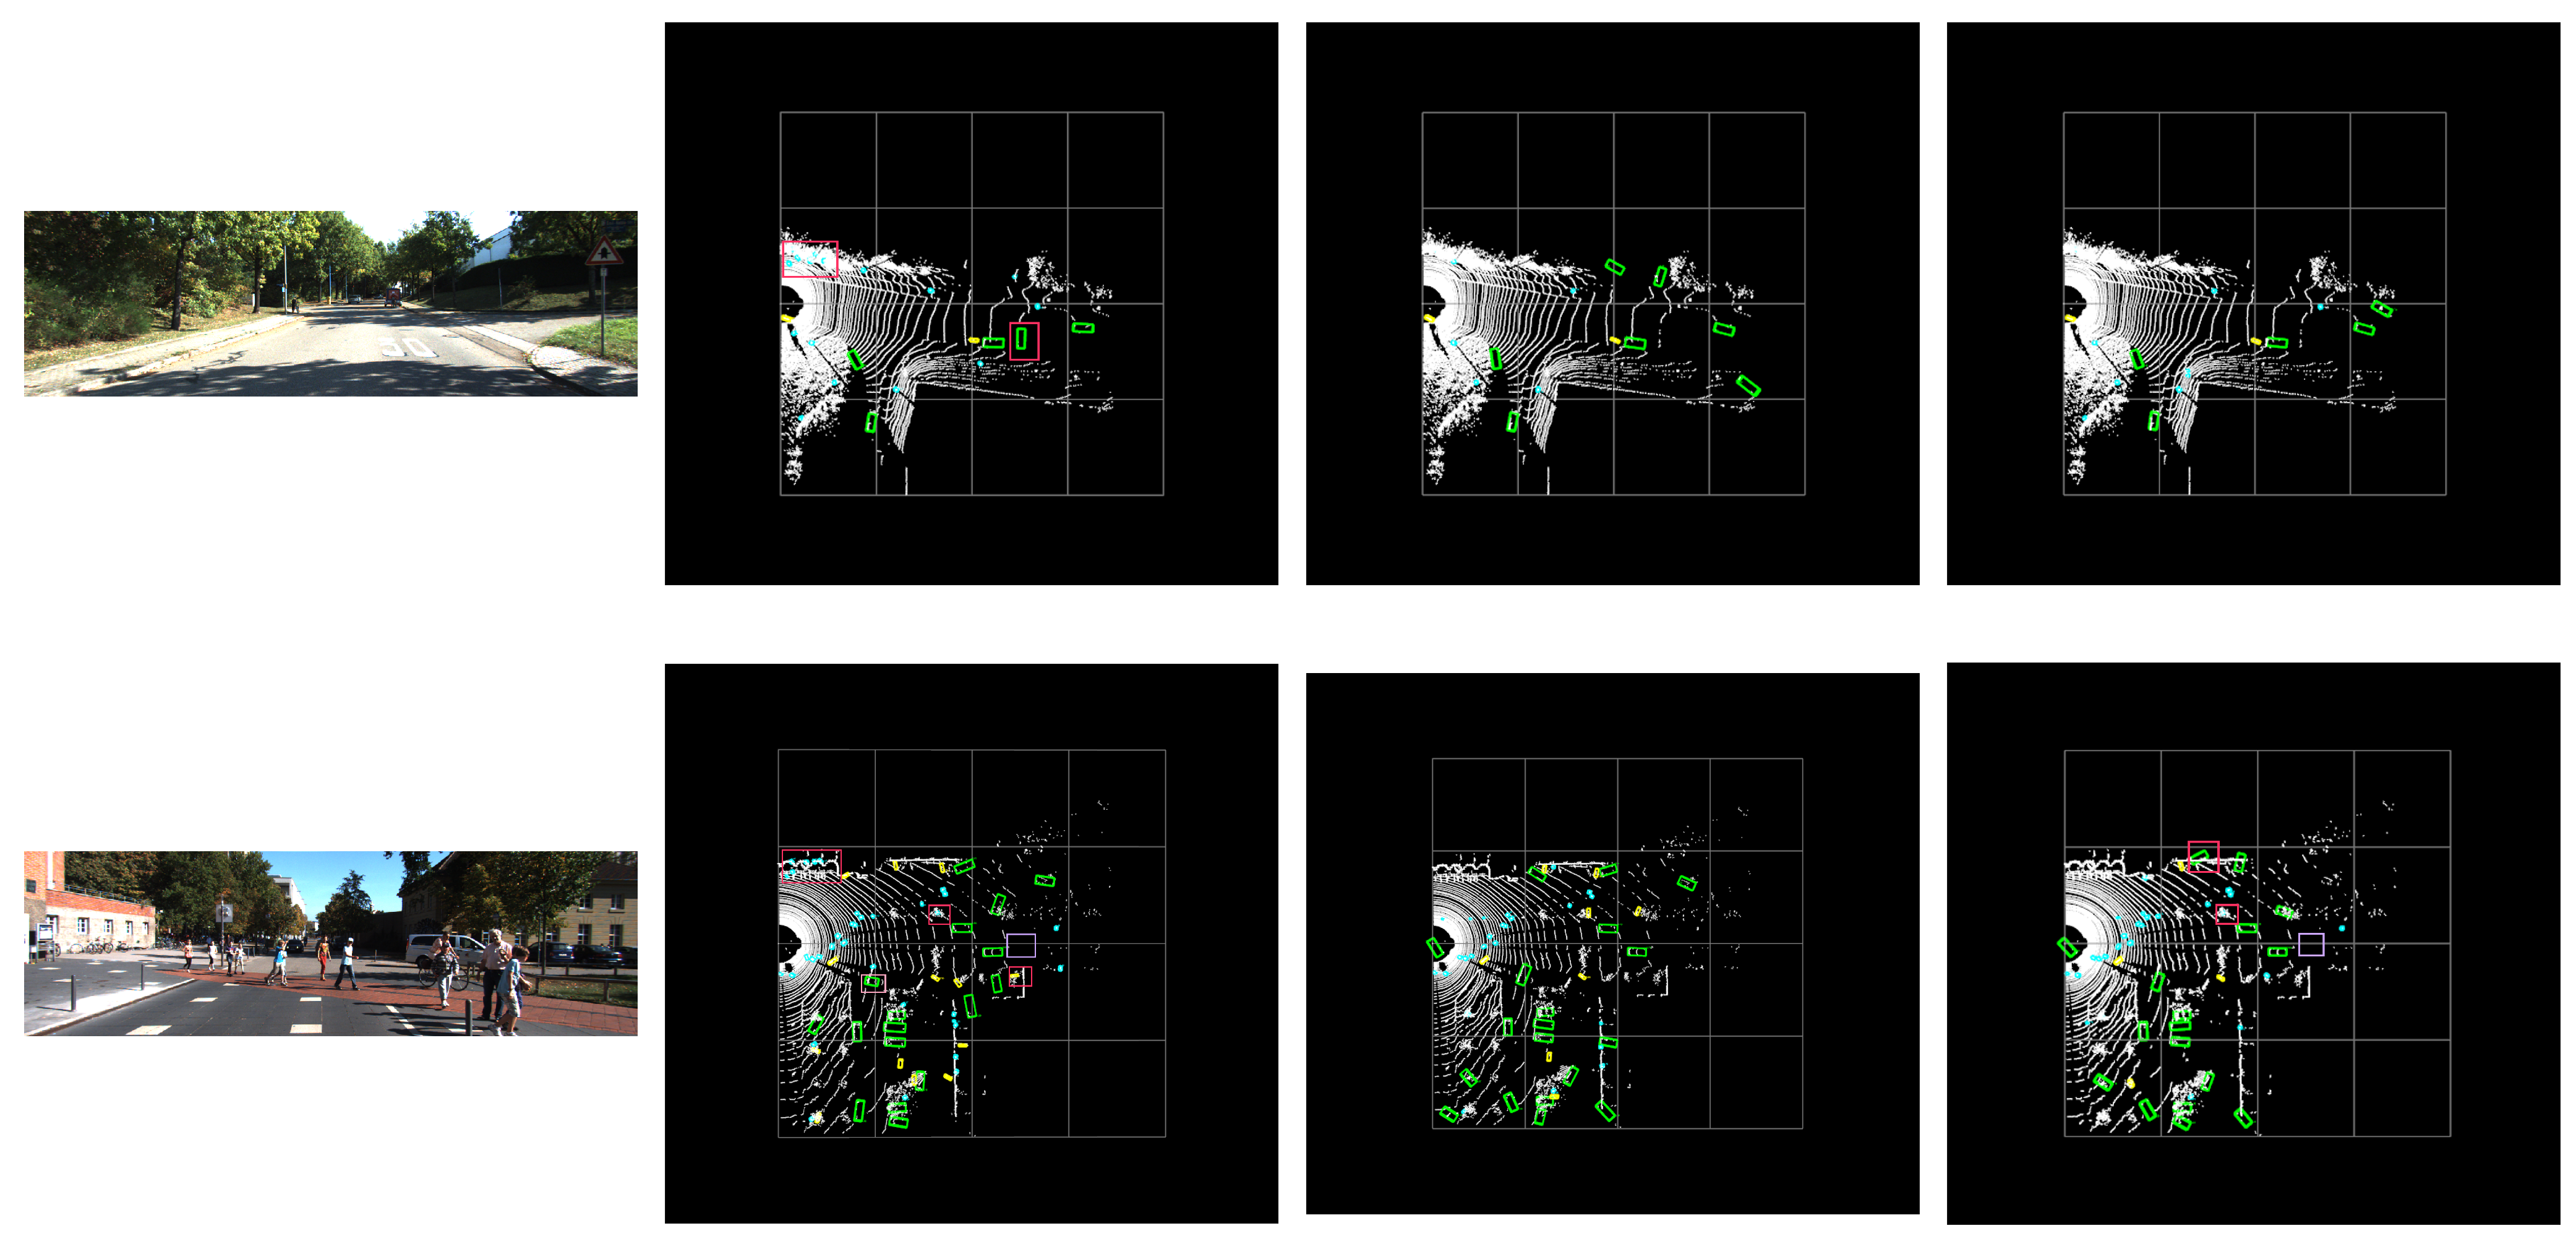
  • The third scenario is straightforward. All three scenarios detected the bicycle following the car. PointPillars produced one multi-detection (a lateral car) for the car directly in front and none in the optimized scenario. PointPillars is especially problematic for the false detection of trees on the left side. In the optimized scenario, PP Carafe produces only one multidetection, and PP Dysample identifies the number on the left side intact.
  • The fourth scenario is complex, involving multiple object types. PointPillars still experiences significant multi-detection issues on the left side. In all three scenarios, there are missed detections directly in front. PP Dysample has more severe detection errors on the left side, and one vehicle lacks direction discrimination. For the nearby vehicles, the optimized scheme improves the vehicle facing angle significantly, resulting in much better direction prediction than PointPillars.
In summary, this paper’s optimization scheme produces a superior visualization effect compared to PointPillars. However, the scheme does have some limitations. For instance, it enhances near objects more than distant targets, possibly due to the limited number of point clouds for distant objects, resulting in errors. To address this, we suggest exploring the use of a multi-frame aggregation method to increase the number of radar point clouds for distant objects. The optimization scheme for enhancing small targets still has certain defects. After processing the point cloud into an image, it may ignore the connection between different voxels, resulting in a loss of contextual information. The next step of this paper will focus on studying point cloud coding.

5. Conclusions

In this paper, we present a 3D target detection algorithm with an enhanced backbone network based on PointPillars for object detection. Initially, we generate a point cloud pseudo-image and subsequently employ channel spatial attention to consolidate contextual information, optimize image features, and establish connections across channels and locations. Additionally, a modified lightweight network, FasterNet, and proximity scale up-sampling have been implemented to enhance the feature extraction capabilities of the convolutional neural network and maintain the integrity of deep point cloud features. The outcome shows significant improvement in comparison to the PointPillars algorithm. The comparison of the algorithm highlights that by introducing the attention mechanism, replacing the feature extraction network, and utilizing a new up-sampling method, target detection accuracy can be significantly enhanced.
However, this experiment has a slight limitation. Despite the improved detection accuracy, it is unable to differentiate false detections and omissions at a glance. Additionally, in the presence of numerous pedestrians or bicycles, it may cause interference, which can influence the results of the detection.

Author Contributions

Methodology, X.S.; Validation, X.S.; Resources, L.Z.; Supervision, L.Z.; Project administration, L.Z.; Funding acquisition, L.Z. All authors have read and agreed to the published version of the manuscript.

Funding

This research received no external funding.

Data Availability Statement

All data generated or analyzed during this study are included in this published article.

Conflicts of Interest

The authors declare no conflicts of interest.

References

  1. Li, F.; Jin, W.; Fan, C.; Zou, L.; Chen, Q.; Li, X.; Jiang, H.; Liu, Y. PSANet: Pyramid Splitting and Aggregation Network for 3D Object Detection in Point Cloud. Sensors 2020, 21, 136. [Google Scholar] [CrossRef]
  2. Qi, C.R.; Su, H.; Mo, K.; Guibas, L.J. PointNet: Deep Learning on Point Sets for 3D Classification and Segmentation. In Proceedings of the IEEE Conference on Computer Vision and Pattern Recognition 2017, Honolulu, HI, USA, 26 July 2017. [Google Scholar]
  3. Zhou, Y.; Tuzel, O. VoxelNet: End-to-End Learning for Point Cloud Based 3D Object Detection. In Proceedings of the 2018 IEEE/CVF Conference on Computer Vision and Pattern Recognition (CVPR), Salt Lake City, UT, USA, 18–23 June 2018. [Google Scholar]
  4. Zhang, Q.; Che, H.; Liu, J.; Liu, R. Small object 3D detection algorithm based on lidar point cloud. In Proceedings of the 2023 IEEE 3rd International Conference on Information Technology, Big Data and Artificial Intelligence (ICIBA), Chongqing, China, 26–28 May 2023. [Google Scholar] [CrossRef]
  5. Chen, D.; Yu, W.; Gao, Y. LIDAR 3D target detection based on improved PointPillars. Adv. Lasers Optoelectron. 2023, 60, 1028012. [Google Scholar]
  6. Lee, M.; Kim, H.; Park, S.; Yoon, M.; Lee, J.; Choi, J.; Kang, M.; Choi, J. PillarAcc: Sparse PointPillars Accelerator for Real-Time Point Cloud 3D Object Detection on Edge Devices. arXiv 2023, arXiv:2305.07522. [Google Scholar]
  7. Nakamura, R.; Enokida, S. Robust 3D Object Detection for Moving Objects Based on PointPillars. In Proceedings of the 2022 IEEE/CVF Winter Conference on Applications of Computer Vision Workshops (WACVW), Waikoloa, HI, USA, 4–8 January 2022. [Google Scholar]
  8. Li, X.; Liang, B.; Huang, J.; Peng, Y.; Yan, Y.; Li, J.; Shang, W.; Wei, W. Pillar-Based 3D Object Detection from Point Cloud with Multiattention Mechanism. Wirel. Commun. Mob. Comput. 2023, 2023, 5603123. [Google Scholar] [CrossRef]
  9. Konrad Lis, T.K. Encyclopedia of Parallel Computing; Springer Science & Business Media B.V.: New York, NY, USA, 2022. [Google Scholar]
  10. Chen, J.; Kao, S.H.; He, H.; Zhuo, W.; Wen, S.; Lee, C.H.; Chan, S.H.G. Run, Don‘t Walk: Chasing Higher FLOPS for Faster Neural Networks. In Proceedings of the 2023 IEEE/CVF Conference on Computer Vision and Pattern Recognition (CVPR), Vancouver, BC, Canada, 17–24 June 2023. [Google Scholar]
  11. Wei-Qin, Z.; Ni, R.; Yang, B. PointPillars+3D Target Detection Based on Attention Mechanisms. Jiangsu Univ. J. Nat. Sci. Ed. 2020, 41, 268–273. [Google Scholar]
  12. Zamanakos, G.; Tsochatzidis, L.; Amanatiadis, A.; Pratikakis, I. A comprehensive survey of LIDAR-based 3D object detection methods with deep learning for autonomous driving. Comput. Graph. 2021, 99, 153–181. [Google Scholar] [CrossRef]
  13. Qi, C.R.; Yi, L.; Su, H.; Guibas, L.J. PointNet++: Deep Hierarchical Feature Learning on Point Sets in a Metric Space. arXiv 2017, arXiv:1706.02413. [Google Scholar]
  14. Shi, S.; Wang, X.; Li, H. PointRCNN: 3D Object Proposal Generation and Detection from Point Cloud. In Proceedings of the IEEE/CVF Conference on Computer Vision and Pattern Recognition 2018, Salt Lake City, UT, USA, 18–23 June 2018. [Google Scholar]
  15. Liu, W.; Zhu, D.; Luo, H.; Li, Y. 3D Target Detection by Fusing Point Attention Mechanisms in LiDAR Point Clouds. J. Photonics 2023, 52, 213–223. [Google Scholar]
  16. Yan, Y.; Mao, Y.; Li, B. SECOND: Sparsely Embedded Convolutional Detection. Sensors 2018, 18, 3337. [Google Scholar] [CrossRef] [PubMed]
  17. Lang, A.H.; Vora, S.; Caesar, H.; Zhou, L.; Yang, J.; Beijbom, O. PointPillars: Fast Encoders for Object Detection from Point Clouds. In Proceedings of the IEEE/CVF Conference on Computer Vision and Pattern Recognition 2018, Salt Lake City, UT, USA, 18–23 June 2018. [Google Scholar]
  18. Chapala, H.; Sujatha, B. ResNet: Detection of Invasive Ductal Carcinoma in Breast Histopathology Images Using Deep Learning. In Proceedings of the 2020 International Conference on Electronics and Sustainable Communication Systems (ICESC), Coimbatore, India, 2–4 July 2020. [Google Scholar] [CrossRef]
  19. Howard, A.; Zhu, M.; Chen, B.; Kalenichenko, D.; Wang, W.; Weyand, T.; Andreetto, M.; Adam, H. MobileNets: Efficient Convolutional Neural Networks for Mobile Vision Applications. arXiv 2017, arXiv:1704.04861. [Google Scholar]
  20. Redmon, J.; Farhadi, A. YOLOv3: An Incremental Improvement. arXiv 2018, arXiv:1804.02767. [Google Scholar]
  21. Tao, Z.; Su, J. Research on object detection algorithm of 3D point cloud PointPillar based on attention mechanism. In Proceedings of the 2022 China Automation Congress (CAC), Xiamen, China, 25–27 November 2022. [Google Scholar]
  22. Wang, Q.; Wu, B.; Zhu, P.; Li, P.; Zuo, W.; Hu, Q. ECA-Net: Efficient Channel Attention for Deep Convolutional Neural Networks. In Proceedings of the 2020 IEEE/CVF Conference on Computer Vision and Pattern Recognition (CVPR), Seattle, WA, USA, 13–19 June 2020. [Google Scholar] [CrossRef]
  23. Woo, S.; Park, J.; Lee, J.Y.; Kweon, I.S. CBAM: Convolutional Block Attention Module. In Proceedings of the Computer Vision—ECCV 2018, Lecture Notes in Computer Science, Munich, Germany, 8–14 September 2018; pp. 3–19. [Google Scholar] [CrossRef]
  24. Cheng, D.; Meng, G.; Cheng, G.; Pan, C. SeNet: Structured Edge Network for Sea—Land Segmentation. IEEE Geosci. Remote Sens. Lett. 2017, 11211, 247–251. [Google Scholar] [CrossRef]
  25. Zhao, H.; Zhang, Y.; Liu, S.; Shi, J.; Loy, C.C.; Lin, D.; Jia, J. PSANet: Point-wise Spatial Attention Network for Scene Parsing. In Proceedings of the Computer Vision—ECCV 2018, Lecture Notes in Computer Science, Munich, Germany, 8–14 September 2018; pp. 270–286. [Google Scholar] [CrossRef]
  26. Liu, W.; Lu, H.; Fu, H.; Cao, Z. Learning to Upsample by Learning to Sample. In Proceedings of the IEEE/CVF International Conference on Computer Vision (ICCV), Paris, France, 1–6 October 2023. [Google Scholar]
  27. Wang, J.; Chen, K.; Xu, R.; Liu, Z.; Loy, C.C.; Lin, D. CARAFE: Content-Aware ReAssembly of FEatures. In Proceedings of the IEEE International Conference on Computer Vision (ICCV), Seoul, Republic of Korea, 27 October 2019. [Google Scholar]
  28. Geiger, A.; Lenz, P.; Stiller, C.; Urtasun, R. Vision meets robotics: The KITTI dataset. Int. J. Robot. Res. 2013, 32, 1231–1237. [Google Scholar] [CrossRef]
Figure 1. New backbone network steps.
Electronics 13 01233 g001
Figure 2. PointPillars process.
Electronics 13 01233 g002
Figure 3. Multi-scale extraction network after FasterNet replacement. The blue and green colors represent the feature maps, and the purple colors represent the Block Convolution operation.
Electronics 13 01233 g003
Figure 4. Approaching up-sampling fusion, the blue and green colors represent the feature maps, and the purple colors represent the Block Convolution operation.
Electronics 13 01233 g004
Figure 5. Visualize the results. Different rows represent different scenarios. The columns represent the front camera, PointPillars results, PP Carafe up-sampling results, and PP Dysample results one at a time. Red boxes represent misdetections, purple boxes represent omissions, and pink boxes represent positional orientation.
Electronics 13 01233 g005aElectronics 13 01233 g005b
Table 1. Parameter characteristics. TotalpParams represent the overall number of trainable parameters in the down-sampling process, such as weights and biases. The total mul-adds and pseudo-add operations executed during the propagation period is known as Total multiplicative addition, and it enables us to evaluate the procedure’s complexity. Params size measures the amount of memory consumed by the parameters, with the estimated total size indicating the entire space occupied by the down-sampling process. The estimated total size pertains to the memory that the down-sampling process uses.
PointPillarTotal ParamsTotal Mult-Adds (G)Params Size (MB)Estimated Size (MB)
PointPillars4,207,61629.63444.66513.02
OurFasterNet2,339,7123.9691.55152.78
Table 2. Results on the KITTI test BEV detection benchmark.
Car Pedestrian Cyclist
EasyMediumHardEasyMediumHardEasyMediumHard
MV3D86.0276,8868.59N/AN/AN/AN/AN/AN/A
VoxelNet89.3579.2677.3946.1340.7438.1166.7054.7650.55
SECOND88.0779.3777.9555.1046.2744.7673.6756.0448.78
PointPillars90.7486.5784.0555.8948.8644.4281.4463.6359.29
PP Carafe91.5587.7685.0458.9751.8848.4785.6466.1561.59
PP Dysample91.7887.7985.0859.2851.7647.2884.7466.0161.79
PP Carafe stands for down-sampling using carafe. PP Dysample stands for down-sampling using dysample, as do the tables that follow.
Table 3. Results on the KITTI test 3D detection benchmark.
Car Pedestrian Cyclist
EasyMediumHardEasyMediumHardEasyMediumHard
MV3D71.0962.3555.12N/AN/AN/AN/AN/AN/A
VoxelNet78.4766.1357.7339.4834.6731.5063.5648.3645.73
SECOND83.6973.9866.6751.8843.6537.2971.1554.5846.90
PointPillars85.4075.1472.7148.1641.5837.0776.7659.7455.53
PP Carafe87.9578.5975.2051.6344.3541.1383.2762.6157.95
PP Dysample87.8978.1373.4450.6243.2839.0181.6963.4658.96
Table 4. Results on the KITTI test AOS detection benchmark.
Car Pedestrian Cyclist
EasyMediumHardEasyMediumHardEasyMediumHard
SECOND87.8481.5471.5952.5643.5938.9881.9759.2056.14
PointPillars94.7591.2788.2946.3442.9639.6886.1570.3565.98
PP Carafe95.5792.0390.5654.7349.2047.7387.6570.2265.58
PP Dysample95.4791.7988.9053.9848.4245.4486.4070.0866.01
Table 5. Ablation Results on the KITTI test BEV mode.
Car Pedestrian Cyclist
EasyMediumHardEasyMediumHardEasyMediumHard
root90.7486.5784.0555.8948.8644.4281.4463.6359.29
Attention91.6787.7585.1856.1949.8946.1685.0565.9161.41
FasterNet92.6388.3286.9156.1949.9545.8288.0967.9863.46
Carafe92.0587.8085.1355.5549.1244.8685.0767.4962.85
Dysample91.7887.7985.0859.2851.7647.2884.7466.0161.79
Table 6. Ablation Results on the KITTI test 3D mode.
Car Pedestrian Cyclist
EasyMediumHardEasyMediumHardEasyMediumHard
root85.4075.1472.7148.1641.5837.0776.7659.7455.53
Attention86.5276.2473.0949.8143.1339.1379.8860.4856.57
FasterNet88.7378.7675.5850.6943.9839.2583.4161.9457.69
Carafe86.9275.4772.3148.3742.1337.3579.8862.5058.23
Dysample87.8978.1373.4450.7243.2839.0181.6963.4658.96
Disclaimer/Publisher’s Note: The statements, opinions and data contained in all publications are solely those of the individual author(s) and contributor(s) and not of MDPI and/or the editor(s). MDPI and/or the editor(s) disclaim responsibility for any injury to people or property resulting from any ideas, methods, instructions or products referred to in the content.

