Abstract
Engineering and technological breakthroughs in sustainability play a crucial role in reducing carbon emissions. An important aspect of this is the active participation of enterprises in addressing carbon reduction as a systemic approach. In response to government incentives in the People’s Republic of China, Chinese enterprises have developed carbon reduction systems to align their organizational goals with national long-term plans. This paper evaluates the carbon reduction schemes employed by six companies as a multi-criteria decision-making (MCDM) problem. To this end, we propose a new hybrid MCDM method called the grey-MEREC-MAIRCA method. This method combines the recently developed method based on the removal effects of criteria (MEREC) for weighting and multi-attribute ideal-real comparative analysis (MAIRCA) based on the grey system theory. The proposed hybrid method provides the additional benefit of accounting for uncertainty in decision making. Notable findings of this research, based on the decision-maker scores, are that the control of direct carbon emissions and energy-saving efficiency are top priorities. In contrast, committing to corporate social responsibility through carbon public welfare and information disclosure are considered lesser priorities. Furthermore, the ranking results obtained using this method are compared with those from the classical weighted sum model and the technique for order preference by similarity to ideal solution (TOPSIS), confirming the selection of the best company. Despite the limitation of the proposed method and the additional steps needed in the evaluation, it opens up opportunities for future research to develop simpler MCDM methods under uncertainty.
1. Introduction
Global sustainability is one of the challenges faced by humanity today. The benefits of carbon reduction are well-known, as they help mitigate the effects of global warming, improve public health, and enhance plant and animal diversity. To promote these benefits, the Chinese government has set short and long-term goals, which are estimated to require an additional capital investment of US $14–17 Trillion in green infrastructure [1]. Chinese enterprises that align their operations with these dual goals, also known as the double-carbon goals, have a higher chance of benefiting from government incentives and avoiding penalties for excessive carbon emissions. The double carbon goal, or dual carbon goal, implemented by the Chinese government reflects its commitment to carbon reduction. The immediate goal is for China to reach its “carbon peak” by 2030, and the ultimate goal is for China to achieve “carbon neutrality” by 2060. These goals have driven Chinese enterprises to re-engineer their business practices to align with national plans. Evaluating the performance of these enterprises in their carbon reduction efforts is important as a self-assessment feedback system to ensure the double carbon goals are met.
The evaluation of enterprise decarbonization systems is addressed as a multi-criteria decision-making (MCDM) problem. An MCDM problem involves assessing decision alternatives based on their performance values in each evaluation criterion, which are weighted according to their level of importance to the decision makers (DMs) [2]. Lots of MCDM methods have been developed to solve decision problems, and they may be classified into compensatory and non-compensatory techniques [3]. Compensatory techniques are methods where a lower performance value of an alternative in one criterion can be balanced by a higher performance value in some other criteria. Examples of compensatory techniques include the weighted sum model (WSM), also known as the simply additive weighting (SAW) [4], technique for order preference by similarity to ideal solution (TOPSIS), and complex proportional assessment of alternatives (COPRAS). Conversely, non-compensatory techniques do not possess the balancing properties of using higher performance values of an alternative in one criterion to makeup for the lower ones. Examples of non-compensatory techniques are elimination and choicetranslating reality (ELECTRE III) [5], VIKOR (VIseKriterijumska Optimizacija I Kompromisno Resenje; multi-criteria optimization and compromise solution), and preference ranking organization method for enrichment evaluations (PROMETHEE II) methods [6,7].
While there are objective and scientific methods to measure the carbon emissions of an enterprise, the associated costs can be significant. An alternative and cost-effective approach is the use of expert opinions, measured as latent constructs by a group of DMs, but this introduces a certain level of uncertainty. To account for this uncertainty in the evaluation, the grey system theory (GST) is employed in this research. The grey system is defined as a system with incomplete information, where some information is known and some is unknown [8]. For example, the GST has been applied in sustainability for contractor selection in the installation of floating solar power panels [9] and the construction of photo-thermal power stations [10]. They employed the FUCOM, SWARA, GRA (Grey Relational Analysis) as hybrid MCDM methods [11]. These green electricity solutions facilitate the attainment of the overall goal of decarbonization. Accounting for uncertainty is one of the benefits of grey-MEREC-MAIRCA Furthermore, the term decarbonization refers to the reduction in carbon dioxide emissions () in the atmosphere, with the ultimate goal of eliminating from energy consumption and manufacturing processes. Additionally, in this paper, the term “scheme” refers to the system with plans that an enterprise assigns for decarbonization. In other words, evaluating a decarbonization scheme involves assessing a company’s current performance, their current approach, and future plans towards reducing carbon emissions. The terms “enterprise” and “company” are used interchangeably in this context because the case presented focuses on for-profit companies. However, this study can also be replicated in non-profit organizations and businesses.
There is evidence to show that China is making progress in its efforts to reduce carbon emissions. Zhou et al. [12] reported the outcomes of the initial allocation of inter-provincial carbon emission rights in China at the provincial level. Xu et al. [13] showed that government regulation with financial incentives can promote carbon reduction, and this was validated using evolutionary game modeling. Yi and Li [14] demonstrated that a carbon tax will unequivocally reduce carbon emissions based on the optimization of a two-echelon supply chain consisting of manufacturers and sellers. Interestingly, through a scientific approach of multi-scenario simulation, Zhang et al. [15] showed that moderate government supervision at the beginning of low-carbon development in enterprises contributes more to decarbonization. While progress is being made by the government, more can be achieved with the involvement of enterprises.
This research is motivated by the need to understand the performances, plans and strategies enterprises are using to cut their carbon footprint. The aim of the research is to evaluate the carbon emission reduction systems and plans of six companies by improving the improved-MEREC and improved-MAIRCA as a hybrid MCDM method that captures uncertainty represented as grey numbers. To achieve this aim, a hierarchical model is presented, and the grey-MEREC-MAIRCA hybrid method is proposed. This paper presents a new perspective for assessing enterprises based on their sustainability performance using a novel model. Therefore, the main contribution of the paper is an extension of the method based on the removal effects of criteria (MEREC) with the grey system theory, and the proposed of grey-MEREC method. Another contribution is the hierarchical model for evaluating carbon reduction at the enterprise level.
The remaining sections of this paper are as follows: Section 2 presents the literature review on trends in carbon reduction as an MCDM problem. Section 3 presents the hierarchical model along with the methods used for weighting and evaluating enterprises. Section 4 presents the results of the evaluation and analyses, comparing them with other traditional MCDM methods. Finally, Section 5. draws a conclusion.
2. Literature Review
2.1. Enterprise Decarbonization
Before the Chinese government presented its double-carbon plans, which set the time frame for carbon peak in 2030 and net-zero carbon emissions in 2060, Rockström et al. [16] suggested a decarbonization plan. They referred to the period from 2017 to 2020 as the “No-brainers period”, emphasizing the need to reduce fossil fuel consumption by 2020. From 2020 to 2030, they identified the “Herculean Efforts” phase, calling for the implementation of intelligent and distributive actions. The period from 2030 to 2040 is known as the “Many Breakthroughs period”, during which discontinuing the use of oil in the energy mix is a key objective. Lastly, the period from 2040 to 2050 is referred to as the "Revise, Reinforce period," involving feedback processes. Griscom et al. [17] highlighted various climate mitigation potentials, including reforestation, forest conservation, proper agricultural and grassland nutrition management, and the impact of peat on wetlands.
The primary focus for achieving carbon reduction is to transition towards net-zero carbon emissions. Davis et al. [18] identified several areas where net-zero solutions can be implemented, such as solar power, wind energy, nuclear power, hydrogen synthetic gas, compressed air energy storage, hydropower pump storage, and other storage solutions such as thermal and batteries. In a qualitative analysis of the literature, Minx et al. [19] presented the main approaches for negative emission technologies (NETs), including afforestation and reforestation, bioenergy carbon capture and storage, biochar, improved weathering, direct air capture, ocean fertilization, and soil carbon sequestration. Drawing attention to demand-side solutions for mitigating climate change, Creutzig et al. [20] highlighted the importance of improving transportation through electric vehicles (EVs) and lightweight vehicles, enhancing energy efficiency in buildings by installing energy-efficient appliances, promoting a shift towards healthy fresh foods over processed foods in the food sector, and improving the manufacturing process and equipment to enhance the sustainability of manufactured products and services.
The use of management information systems can make a positive contribution to carbon reduction. Zvezdov and Hack [21] employed enterprise resource planning software that continuously accounts for carbon emissions, fulfilling its information technology role by enhancing the efficiency, scalability, and reliability of the business’s stock-keeping units. This simplifies data collection and improves computational accuracy with consistency. Ma and Tao [22] conducted a regression analysis, demonstrating that the digitization of enterprises can significantly reduce carbon emissions.
Grubler et al. [23] introduced low-energy solutions that focus on reducing energy demand and achieving sustainable development goals without relying on negative energy technologies. These solutions encompass various strategies, including the implementation of high-service efficiency thermal end-use technologies, doubling the rate of retrofits, and establishing new building standards to decrease energy intensity in thermal comfort. Additionally, they emphasize the importance of reducing electricity intensity in lighting, appliances, and consumer goods, as well as lowering electricity consumption in road-based modes of transportation, particularly in public and commercial buildings. The authors also stress the significance of improving manufacturing and construction processes in the upstream industry and enhancing the efficiency of freight transportation through advancements in trucking and rail systems. It is crucial to prioritize carbon reduction, both with and without negative emission technologies, in order to enhance global sustainability.
Game theory has been employed to study carbon reduction strategies, shedding more light on the potential outcomes of implementing different approaches. Wu et al. [24] applied game-based learning theory to develop evolutionary low-carbon strategies, considering the players as government and enterprises. The results suggest that government incentives, such as subsidies and regulations, play a crucial role in determining the diffusion rate of low-carbon strategies. Fan and Xu [25] presented an enterprise equilibrium game that combined direct subsidies and indirect tax incentives, developing a bi-objective bi-level linear model under uncertainty constraints. Qu and Sun [26] introduced a three-stage dynamic game to improve carbon tax in enterprises. They found that a moderate carbon tax is sufficient to drive decarbonization in an enterprise, while higher taxes may not be conducive to promoting carbon emissions reduction, thus suggesting a unified carbon tax. In another study, Geng et al. [27] conducted an evolutionary game analysis on forming enterprise alliances towards carbon reduction. The research indicates that evolutionary stable strategies for enterprises equally require technical support. Based on their findings, some enterprises underreport their carbon emissions, which exceeds the critical emission level, leading to dishonest carbon emission reporting.
It is worth mentioning that in 2010, Gell [28] presented a framework for a carbon-constrained healthcare enterprise. The main costs associated with controlling carbon emissions in this framework include operational cost, supply chain cost, capital expenditure, emission and energy waste cost, and effluent and other waste cost. Zhao et al. [29] employed the theory of planned behavior to identify the behavioral intentions of employees towards the goal of carbon neutrality in the petrochemical enterprise. Their study revealed that employees’ psychological motivation and behavioral intentions towards low-carbon behavior are positively influenced by their perception of daily work and the economy of energy-saving measures. Sindhwani et al. [30] extracted 15 critical factors for implementing net-zero emissions and ranked them using Pythagorean fuzzy delphi analytic hierarchy process combined compromised solution (CoCoSo). They found that the lack of professional expertise on net-zero emissions, software with an in-depth understanding of building information modeling (BIM) and building energy analysis, and project management techniques are the main factors hindering net-zero emission and promoting resilience with social value creation. The use of MCDM methods under uncertainty requires further research.
2.2. MEREC with Related MCDM Methods
First and foremost, a comprehensive overview of MCDM methods as a systematic literature review was presented by Ayan et al. [31], summarizing the MEREC method. Similarly, a systematic literature review of classical MCDM methods streamlined to green logistics and low-carbon transportation was presented by Tian et al. [32]; the WSM and TOPSIS were among the methods applied towards decarbonization.
The MEREC method, which was developed two years ago, has gained significant popularity among researchers and is being increasingly applied in various domains, including transportation and logistic management. In particular, the MEREC method, developed by Keshavarz-Ghorabaee et al. [33], employs logarithmic measurements to calculate the removal effect on the performance of alternatives. For instance, Simic et al. [34] integrated the MEREC and CoCoSo methods with the Fermatean fuzzy model to address uncertainty when evaluating urban transportation plans during the COVID-19 pandemic. Deveci et al. [35] devised a decision support system for evaluating sustainable urban transportation in the metaverse. They utilized the q-rung orthopair fuzzy set (q-ROFS) in combination with the stepwise weight analysis ratio assessment (SWARA) and MEREC methods to determine the weights of evaluation criteria. The weighted sum product method was employed to assess public transportation options.
When evaluating thermal materials for vehicles, Nicolalde et al. [36] combined entropy and the MEREC method with VIKOR, COPRAS, and TOPSIS to assess the best material. The consensus across all three evaluation methods identified the same optimal material. Mishra et al. [37] utilized the MEREC method along with the RS method for weighting in the assessment of battery energy storage systems (BESS). This versatile application of BESS includes home use, grid support, and electric vehicle charging. In another study, Mishra et al. [38] combined the MEREC method with SWARA for weighting. They employed the double normalization-based multiple aggregation (DNMA) method using single-valued neutrosophic sets, an extension of fuzzy sets, to select the optimal location for siting a lithium–ion battery factory, which is essential for EV manufacturing. Ul Haq et al. [39] applied the single-valued neutrosophic (SVN) number method along with the MEREC method and measurement alternatives and ranking according to the compromise solution (MARCOS) for the selection of sustainable materials, specifically lighter-weight aircraft wing spars made of different alloys. In a previous work, Mishra [40] employed the SVN number method with the MEREC method and MULTIMOORA for assessing low-carbon tourism strategies.
Normalization is essential in MCDM because the choice of normalization method can significantly impact the ranking of alternatives. Various normalization techniques are employed, including linear normalization (sum, maximization, max-min), non-linear max-min normalization, logarithm normalization, and vector normalization [41,42,43,44]. Ivanovic et al. [45] introduced the MEREC double normalization MARCOS method for selecting the optimal truck mixer concrete pump. Hezam [46] proposed a hybrid approach that combined intuitionistic fuzzy set with MEREC, rank sum, and DNMA to assess alternative fuel vehicles, including electric vehicles (EVs), hydrogen vehicles, and hybrid EVs. Bosvovic et al. [47] presented a ranking order method accounting for two-step normalization (AROMAN) for evaluating the last mile of EV delivery. AROMAN utilizes both linear and vector normalization techniques to obtain the aggregated weighted and normalized decision matrix. These EVs can be changer using clean energy.
The MEREC method has found application in the design of experiments. Trung and Thinh [48] combined entropy and MEREC to determine the weights of criteria for evaluating a turning process machine. They compared the ranking of eight experiments based on Taguchi design using TOPSIS, EAMR, MAIRCA, and MARCOS methods to select the best alternative. Nguyen et al. [49] employed the Taguchi design of experiment to select the optimal dressing process for internal grinding. They conducted comparative studies using the MEREC and entropy weighting methods, along with TOPSIS, MARCOS, Evaluation by an area-based method of ranking (EAMR), and MAIRCA methods to identify the best design. Le et al. [50] combined MEREC and MABAC to evaluate cylinder dressing parameter settings based on the Taguchi design of the experiment. The optimal settings were confirmed using the TOPSIS and MARCOS methods. Esangbedo et al. [51] combined Taguchi design with grey relational analysis to optimize the cost and quality of a nanotube composite used in computer numerical control machines.
There are some applications of the MEREC method in information technology. Kumar et al. [52] presented an application of the MEREC method in information technology, specifically in prioritizing solid-state drive (SSD) as a MCDM problem. They utilized the Bonferroni operator to combine entropy, MEREC, and the criteria importance through the inter-criteria correlation (CRITIC) weighting method. The MARCOS method was employed for evaluations, and the obtained results were compared with ranks determined by TOPSIS, ARAS, MABAC, SAW, WASPAS, CoCoSo, and EDAS methods. Chaurasiya and Jain [53] applied the Pythagorean fuzzy MEREC method along with the SWARA weighting method using the MARCOS method to evaluate a hospital management system.
Some industrial applications of the MEREC are presented as paramount to the reduction in carbon; Keshavarz-Ghorabaee [54] combined the SWARA and MEREC methods to determine the weights and assess the distribution center of a detergent and hygienic company. However, this study was limited by the application of a crisp set instead of linguistic values. Miskic et al. [38] combined the MEREC and MARCOS methods, converting linguistic variables into fuzzy triangular numbers, to evaluate Industry 4.0 in a logistic center. Yu et al. [55] utilized four MCDM methods to evaluate offshore wind turbine selection. They aggregated group decision-making preferences using interval 2-tuple linguistic values with power weighted average (PWA), and obtained criteria weights using the SWARA II and MEREC methods. The turbines were then evaluated using the cumulative prospect theory (CPT) and CoCoSo method. A similar study on offshore wind turbine assessment using the MEREC method and a simplified version of the best-worst method was conducted by Yu et al. [56]. Narayanamoorthy et al. [57] extended the Fermatean fuzzy set to the MEREC method and utilized the (multiplicative multi-objective optimization by ratio analysis) MULTIMOORA method to address the problem of renewable energy power plant selection. Gligoric et al. [58] applied the MEREC method to verify their studies on the efficiency evaluation of mineral deposits based on the symmetry point of the criterion weighting method. Rani et al. [59] applied the entropy and MEREC methods combined with additive ratio assessment (ARAS) to address the selection problem of food waste treatment technology.
Generally, the MEREC method is commonly applied in a single-level hierarchical model. However, this paper introduces a novel approach by presenting a multi-level hierarchical model that utilizes the MEREC method for group decision-making. Table 1 provides a summary of the applications of the MEREC method. Commonly, in real-world decision-making, we are faced with uncertainties that the original MEREC and MAIRCA approaches are unable to address. This limitation has been addressed by other researchers who extended the MEREC method by incorporating fuzzy sets. It is worth noting that this paper is the first to combine the MEREC method and MAIRACA based on the grey system theory for group decision-making under conditions of uncertainty.

Table 1.
Application of the MEREC and it hybrid method.
3. Methodology
The use of a hierarchical model addressing an MCDM problem provides a granular assessment of alternatives, considering the details of the evaluation criteria. The weights of the criteria are objectively computed using the proposed grey-MEREC and extended to the MAIRCA for rankings. The criteria used in this study are presented in Figure 1 and are explained as follows:
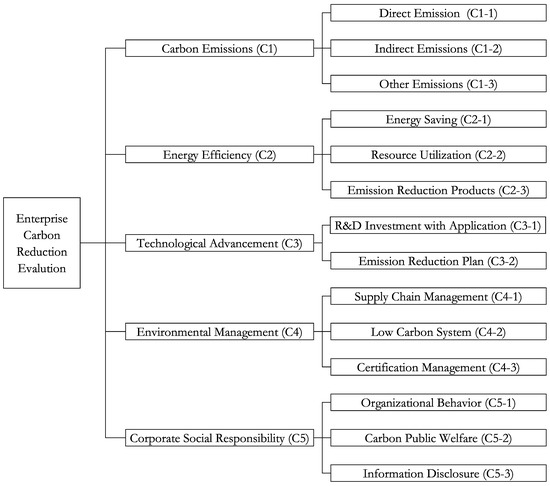
Figure 1.
Hierarchical Model for Enterprise Carbon Reduction (See Section 3.1 for more details).
3.1. Evaluation Criteria
3.1.1. Carbon Emission ()
This considers all possible areas where there could be carbon emissions. Direct emissions () measure the immediate carbon emissions from fossil fuel combustion, production process emissions, and emissions during logistics and transportation. It also takes into account emissions from the waste disposal process, including illegal carbon emissions. Indirect emissions (): This considers less apparent carbon emissions, such as those resulting from electricity and heat consumption, as well as heat consumption emissions. Other emission considerations () may be overlooked, including emissions from biofuel consumption, carbon emissions from office buildings, and commuting and travel carbon emissions.
3.1.2. Energy Efficiency ()
This measures how much work can be performed in relation to the energy used. Energy savings () refer to the proportion of renewable energy consumption, the green lighting ratio, and energy consumption per unit output. Resource utilization () measures how our resources are managed, including the unit industrial water consumption, industrial water reuse rate, and industrial solid waste management. Furthermore, the company’s commitment to emission reduction Products () can be observed through the product carbon code and conduct, green packaging parameters, green supply chain and logistics practices, and recycling guidelines.
3.1.3. Technological Advancement ()
The measure assesses the progress made in investing in new solutions that reduce or eliminate emissions. Research and development (R&D) investment with application () is crucial for carbon reduction. The results of R&D can be observed through the application of low-carbon technology and digital intelligence, as well as the reduction in the use of carbon-containing raw materials through investment in low-carbon technological transformation. The emission reduction plan () is evaluated through various factors, such as the control of coal consumption, the adoption of emission reduction technologies, the strategy for renewable energy use coupled with carbon capture and storage, and the implementation of low-carbon construction practices for facilities.
3.1.4. Environment Management ()
It encompasses the integration of management science with engineering. The central aspects include supply chain management (), which involves green supplier management, examining the proportion of low-carbon purchases, and implementing preferential policies that favour low-carbon suppliers. Additionally, the low carbon system () plays a vital role, encompassing components such as the low-carbon enterprise construction system, greenhouse gas management system, energy management system, green procurement and logistics management system, and low carbon monitoring and assessment system. Moreover, adhering to national directly measured certification management () is crucial. This involves obtaining relevant environmental management system certifications, energy management system certifications, green product certifications, and regularly conducting cleaner production audits.
3.1.5. Corporate Social Responsibility ()
This measure reflects how an enterprise supports its immediate community in the effort towards carbon reduction. Organizational behavior () is taken into account, including practices such as low carbon consumption, implementing a carbon ticket mechanism, and adopting low carbon office initiatives. Carbon public welfare () involves the participation of enterprises in public welfare projects that generate carbon sinks, corporate initiatives towards public welfare, purchasing emission reductions through carbon sink projects, and the development of carbon public welfare products. Lastly, information disclosure () considers whether the company is transparent in its dealings with carbon emissions, as this can have an impact on the public. It involves aspects such as voluntary disclosure of complete information and objectives, along with the use of clear and understandable language in disclosures for the public to comprehend.
3.2. Grey-MEREC
The grey system theory with the method based on the removal effects of criteria (grey-MEREC) is a hybrid MCDM weighting method. In this paper, the interval-grey number is used, and some of its basic operations involving two grey numbers are: and are [64,65]:
- Addition:
- Subtraction:
- Multiplication:
- Division: .
Based on the MEREC [33] approach, the main idea of grey-MEREC is to first obtain the grey normalized decision matrix. The kernel is then obtained, and subsequently, the logarithmic performance of the alternatives is calculated. Each criterion is then removed to obtain the deviation for each alternative, which is used to determine the final weight.
Step 1: Construct the grey decision matrix. The grey decision matrix is constructed based on the grey performance values () of alternative-i and criterion-j, where there are m alternatives and n criteria. The grey decision matrix is then formed.
Step 2: Normalize the grey decision matrix (). The normalization approach used scales the grey decision matrix to a unit value, where represents the elements of the normalized decision matrix. For beneficial criteria (), where higher performance values are better, and for cost criteria (), where lower performance values are better.
Step 3: Calculate the kernel of the normalized decision matrix. This involves a whitenization process to obtain crisp numbers from grey numbers. The elements of the kernel matrix, K, are obtained using Equation (3).
Step 4: Calculate the overall performance of the alternatives (). This is achieved by applying a non-linear logarithmic function, as described in Equation (4). The result is that a smaller kernel value corresponds to a larger overall performance.
Step 5: Calculate the performance of the alternatives by removing each criterion. When each criterion-j is removed, it results in a set of performance results for each alternative, denoted as m. The performance result set for the removed criterion is computed using Equation (5).
Step 6: Compute the summation of absolute deviations. This step is performed to determine the effect of removing the overall performance obtained in Step 4 and the performance of the removed criteria from Step 5. The computation is performed using Equation (6).
Step 7: Determine the final weights of the criteria. This involves calculating the local weights and then the effective weights. The local weights represent the fractional contribution of each criterion to its higher-level weight, which contributes to the overall goal.
The local weight are calculated, then the effective weight are calculated. The local weights make the factional contribution to its higher level weight that amount to the overall goal.
- The local weights are calculated using Equation (7).
- The effective weight is obtained by multiplying the local weight of the first-level criteria with the local weight of the second-level criteria. Equation (8) represents this calculation.
The final weight, grey-MEREC, can be used in conjunction with other MCDM evaluation methods.
3.3. Grey-MAIRCA
Based on the multi-attributive ideal-real comparative analysis (MAIRCA) [66], the main idea of the grey-MAIRCA is after constructing the grey decision matrix, the grey theoretical ratings matrix and the grey real matrix are obtained, then the gap between them is computed. The value of the criteria function used for ranking is determined from the total gap. Lastly, the best alternative is determined based on the rankings.
Step 1: Construct the grey decision-making matrix (). This matrix is obtained from a grey decision table and consists of the grey performance values for each alternative (i) based on the evaluation criteria (j). The elements of the grey decision matrix () represent the performance values, with n being the number of criteria and m being the number of alternatives. The construction of the grey decision matrix () is defined by Equation (9).
Step 2: Define the preferences for the choice of alternatives, . It is generally assumed that the decision-makers (DMs) have neutral preferences towards all the alternatives. This means that they have no preference for one alternative over the others. In other words, the DMs have equal preference towards all the alternatives. This neutrality is expressed using Equation (10), and it holds true as shown in Equation (11).
Step 3: Calculate the elements of the theoretical ratings matrix ().
It should be noted that if the weights are grey values, then the resulting elements would also be grey, leading to a grey theoretical ratings matrix, as shown in Equation (14).
Step 4: Define the elements of the real ratings matrix (). This matrix is obtained by multiplying the elements of the theoretical ratings matrix with the elements of the grey decision matrix.
In Equation (17), beneficial criteria are calculated using the formula:
In Equation (18), non-beneficial (cost) criteria are calculated using the formula:
where , obtained for from the grey decision matrix in Equation (9), and representing the maximum and minimum values of the upper and lower bound of observed criterion by alternatives.
Step 5: Calculate the total gap matrix (G). This matrix represents the difference between the theoretical and real matrices. The elements of the gap matrix are obtained using an arbitrary distance measure between two grey numbers. As the gap reduces, the alternative tends towards the ideal alternative. When the gap is zero, the alternative is considered ideal, which is the best. The gap matrix (G) is computed using Equation (19), the maximum absolute difference between the upper and lower bounds of the grey numbers is taken as the distance measure, denoted as for the upper bound and for the lower bound.
where represents the arbitrary distance between the elements of the theoretical and real matrices.
Step 6: Calculate the final values of criteria functions () for each alternative. This is achieved by summing the gaps for all criteria to obtain the total gap for each alternative. These total gaps are then ranked to determine the final values of the criteria functions.
4. Result and Analysis
In this research, six heavy machinery companies have come together to form an alliance with the common goal of decarbonization. Each company, referred to as Company-one () to Company-six (), has individually evaluated their decarbonization schemes in order to identify the best practices and rank their performances. The evaluation process involved six decision-makers ( to ), who conducted visits and tours of the companies. Following the visits, the decision-makers were provided with score sheets to grade in percentage (0–100%) the performance of each company using the evaluation criteria outlined in Section 3.1. Table 2 presents the scores given by the decision-makers to each company, while Figure 2 displays the scatter plot of these scores. The steps described in Section 3 were employed to evaluate the companies, and these steps are summarized in the flowchart depicted in Figure 3.
Table 2.
Scores obtained from decision makers (%).
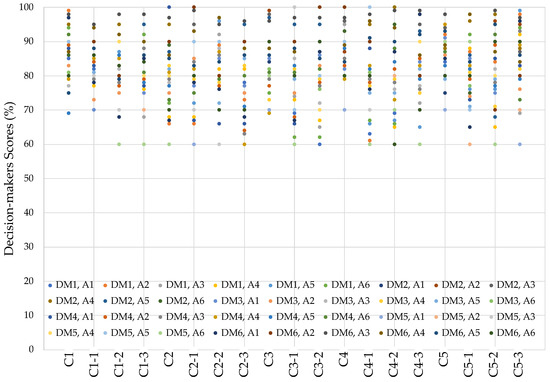
Figure 2.
Scatter plots of decision-maker scores about the companies.
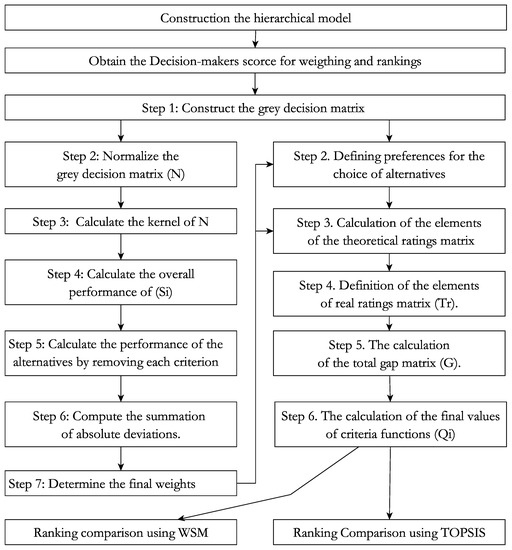
Figure 3.
Flowchart for evaluating decarbonization scheme.
4.1. Grey-MEREC for Group DM Weighting
The the ratings of the the DMs are converted to a grey decision table as shown in Table 3. Next, the weights of the criteria is obtained using the procedure in Section 3.2.
Table 3.
Grey decision table.
Step 1: Construct the grey decision matrix (). This is obtained from Table 3 using Equation (1). To calculate the grey decision matrix, the ratings provided by the DMs are used. Each row represents an alternative (company) and each column represents a criterion. The values in the table are the grey performance values, denoted as , where i corresponds to the alternative and j corresponds to the criterion.
By following Equation (1), the grey decision matrix is constructed based on the ratings provided by the decision makers.
Step 2: Normalize the grey decision matrix (). The normalized grey decision matrix is constructed using the elements , as given in Equation (2). Since all the evaluation criteria are considered beneficial criteria (), the normalization process is performed accordingly.
Step 3: Calculate the kernel of the normalized decision matrix. This step involves transforming the grey numbers to white numbers using Equation (3).
The kernel matrix, denoted as K, is obtained by applying the kernel transformation to the elements of the normalized decision matrix. This transformation converts the grey numbers to crisp (white) numbers, enabling further analysis and calculations.
Step 4: Calculate the overall performance of the alternatives (). This is obtained using Equation (4), where .
Step 5: Compute the summation of absolute deviations. The absolute deviation is computed using Equation (5).
Step 6: Compute the summation of absolute deviations. The absolute deviation is computed using Equation (6), which is the absolute deviation between the overall performance values () and the performance () is calculated for each alternative.
Step 7: Determine the final weights of the criteria. To determine the final weights of the criteria, the local weights are calculated.
The local weights are obtained using Equation (7).
Effective weights is obtained using Equation (8). The weights are
, , , , , , , , , , , , , , , , , , .
In other words, the criteria weight used in this research is ; is ; is ; is ; is is ; is ; is ; is is ; is ; is is ; is ; is ; is is ; is ; is .
Based on the scores and importance assigned to the criteria, it is determined that the most important criterion is direct carbon emission (), with the highest weight. This criterion should receive the most attention and effort in pursuit of decarbonization. The second most important criterion is energy saving (), which also deserves significant attention in decarbonization efforts. On the other hand, the criteria of carbon public warfare () and information disclosure () are deemed less important in the context of decarbonization. These criteria should receive comparatively less effort and focus in the pursuit of decarbonization objectives.
4.2. Grey-MAIRCA for Ranking Enterprise
Following the steps presented in Section 3.3 and using the weights obtained in Section 4.1, the rankings of these six companies based on the DMs’ preferences are as follows:
Step 1: Construct the grey decision-making matrix (). This matrix is constructed using the last level of the hierarchical structure, based on Equation (9).
It should be noted that the grey decision matrix used for weighting in Equation (1) is different from the grey decision matrix used in Equation (9) for ranking. The ranking matrix excludes the first-level criteria as it is a latent value obtained from the second-level criteria.
Step 2: Define the preferences for the choice of alternatives . In this paper, the DMs are neutral, meaning they have no preference for the alternatives. Based on Equation (10), for the 6 alternatives,
Step 3: Calculate the elements of the theoretical ratings matrix (). This matrix is obtained based on Equation (13), using the weights obtained in Section 3.2, as given in Equation (22).
The theoretical ratings is:
Step 4: Define the elements of the real ratings matrix (). This matrix is computed using Equation (16).
Since the criteria for evaluation are all beneficial, Equation (17) is used to calculate the real ratings matrix ().
Step 6: Calculate the final values of the criteria functions () by alternatives. This is obtained using Equation (20).
Finally, sort and rank the companies as follows: is in the position, is in the position, is in the position, is in the position, is in the position, and is in the position. In other words, company-four () has the best scheme in decarbonization.
4.3. Comparison of Using the Weighted Sum Model and TOPSIS
The weighted sum model (WSM) and the technique for order preference by similarity to ideal solution (TOPSIS) were applied to verify the rankings and confirm the best company. Both methods utilized white data, and the DMs’ points in Table 2 were aggregated to construct a decision matrix. The MEREC weights in Equation (21) were used for this comparison.
4.3.1. WSM for Ranking Enterprise
The weighted sum model (WSM), also known as the simple additive weighting (SAW) method, is a linear aggregation of the normalized performance values of the alternatives based on the weights of the criteria. It is computed using Equation (24).
where is the normalized performance value of the decision matrix. Here, , which is beneficial criteria normalization.
The alternative with the largest value is considered the best. Based on the WSM rankings, is in the position, is in the position, is in the position, is in the position, is in the position, and is in the position.
4.3.2. TOPSIS for Ranking Enterprise
The technique for order preference by similarity to ideal solution (TOPSIS) is a well-known classical method that utilizes both the ideal and non-ideal solutions to determine the best alternative. The TOPSIS method is chosen because of its wide acceptability. DMs are very familiar with the computation, the use of vector normalization, and the dual-reference points for evaluation, namely, the ideal solution and anti-ideal solution. The decision matrix, as given in Equation (25), is normalized as a vector using Equation (26).
Then, the normalized decision matrix is obtained as given in Equation (27).
Next, the weighted normalization matrix is computed, where each element of the matrix is computed as ,
The ideal solution and anti ideal solution are obtained using Equation (28) and Equation (29), respectively.
The distances of the alternatives from the ideal solution and the anti-ideal solution are calculated using Equation (30) and Equation (31), respectively.
According to the rankings obtained from the grey-MEREC-MAIRCA, WSM, and TOPSIS methods, the company with the highest closeness value is considered the best. The rankings are as follows: is in the position, is in the position, is in the position, is in the position, is in the position, and is in the position.
While the rankings obtained from the grey-MEREC-MAIRCA, WSM, and TOPSIS methods might not be the same, it is noted that all three methods ranked Company-four () as the best. Additionally, all three methods ranked Company-two () in the fourth position, while Company-five () is ranked in the second position by both the grey-MEREC-MAIRCA and TOPSIS methods. Figure 4 illustrates the rankings from all three methods. Furthermore, the Spearman’s rho () correlations, Kendall’s Tau B () correlations, weighted correlations (), and similarity coefficients () [67] provided in Table 4 indicates a strong correlation among the methods.
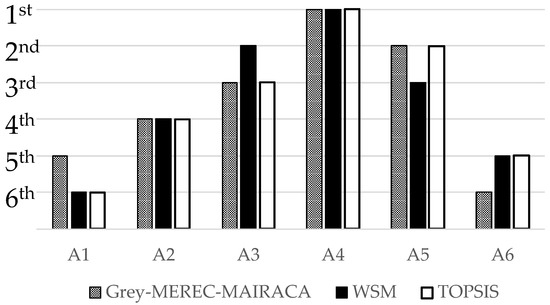
Figure 4.
Rankings comparison.
Table 4.
Correlation of MCDM methods.
5. Conclusions
The challenge of global warming is faced by all of humanity, not just scientists and engineers. Enterprises that provide goods and services should join the bandwagon to champion the course of carbon reduction. Forming alliances by companies presents the opportunity for synergistic benefits, including companies adopting the best practices of the other companies, which is the ideal alternative. This paper evaluates and ranks six enterprises’ decarbonization schemes using a new hybrid MCDM method based on assessments provided by experts in the form of points. The proposed hybrid multi-criteria decision-making (MCDM) method is named grey-MEREC-MAIRCA. The evaluation process begins by developing a hierarchical model to assess the performance of the companies. Subsequently, decision makers (DMs) assign points to each company as performance values for each criterion. As the points are subjective, a certain level of uncertainty is inherent in group decision-making. To address this uncertainty in both weighting and ranking, the grey system theory (GST) is utilized in the grey-MEREC-MAIRCA approach. Based on the companies’ performance, as graded by the DMs using the grey-MEREC-MAIRCA method, Company-four () is ranked as the best in terms of decarbonization.
While it will be possible to objectively measure the performance of the companies, such as the amount spent and budgeted for R&D (), some can only be measured as a latent construct, for example, organization behavior (). The range to account for uncertainty would be more precise if when objective measurements were used instead of subjective measurements based on the scoring of points by the company given by the DMs. Further studies can be performed to combine both subjective and objective assessment, i.e., measuring the performance value of the companies and the MCDM weighting method. Most importantly, researchers, industry practitioners, and policy makers should persist in their efforts with more funding allocation towards reducing direct carbon emissions (). Lastly, a longitudinal study of the companies on their contribution to the ultimate goal of decarbonization can be conducted for the next several decades, preferably till the year 2060.
Author Contributions
Conceptualization, methodology, formal analysis, writing—original draft preparation, review and editing, M.O.E.; data curation, M.T. All authors have read and agreed to the published version of the manuscript.
Funding
This research received no external funding.
Data Availability Statement
Data available on request from the authors.
Conflicts of Interest
The authors declare no conflict of interest.
Abbreviations
The following abbreviations are used in this manuscript:
| ARAS | Additive Ratio Assessment |
| AROMAN | A Ranking Order Method Accounting for Two-Step Normalization |
| BESS | Battery Energy Storage Systems |
| CoCoSo | Combined Compromise Solution |
| COPRAS | COmplex PRoportional ASsessment of alternatives |
| CPT | Cumulative Prospect Theory |
| CRITIC | Criteria Importance Through the Inter-criteria Correlation |
| DMs | Decision-Makers |
| DNMA | Double Normalization-Based Multiple Aggregation |
| EAMR | Evaluation by an Area-based Method of Ranking |
| EVs | Electric Vehicles |
| GRA | Grey Relational Analysis |
| GST | Grey System Theory |
| MAIRCA | Multi-Attribute Ideal-Real Comparative Analysis |
| MARCOS | Measurement Alternatives and |
| Ranking according to the Compromise Solution | |
| MCDM | Multi-Criteria Decision Making |
| MEREC | Method based on the Removal Effects of Criteria |
| MULTIMOORA | Multiplicative Multi-Objective Optimization by Ratio Analysis |
| NETs | Negative Emission Technologies |
| PWA | Power Weighted Average |
| q-ROFS | Q-Rung Orthopair Fuzzy Set |
| SMART | Simple Multi-Attribute Rating Technique Extended to Ranking |
| SSD | Solid-State Drive |
| SVNN | Single-Valued Neutrosophic |
| SWARA | Stepwise Weight Analysis Ratio Assessment |
| TOPSIS | Technique for Order Preference by Similarity to Ideal Solution |
| WASPAS | Weighted Aggregated Sum Product Assessment |
| VIKOR | VIseKriterijumska Optimizacija I Kompromisno Resenje |
| (Multicriteria Optimization and Compromise Solution) |
References
- Chen, T.; Yu, J.; Keyes, N. China’s Transition to a Low-Carbon Economy and Climate Resilience Needs Shifts in Resources and Technologies. 2023. Available online: https://www.worldbank.org/en/news/press-release/2022/10/12/china-s-transition-to-a-low-carbon-economy-and-climate-resilience-needs-shifts-in-resources-and-technologies (accessed on 25 June 2023).
- Alinezhad, A.; Khalili, J. New Methods and Applications in Multiple Attribute Decision Making (MADM); International Series in Operations Research & Management Science; Springer International Publishing: Cham, Switzerland, 2019; Volume 277. [Google Scholar] [CrossRef]
- Banihabib, M.E.; Hashemi-Madani, F.S.; Forghani, A. Comparison of Compensatory and Non-Compensatory Multi Criteria Decision Making Models in Water Resources Strategic Management. Water Resour. Manag. 2017, 31, 3745–3759. [Google Scholar] [CrossRef]
- Esangbedo, M.O.; Che, A. Grey Weighted Sum Model for Evaluating Business Environment in West Africa. Math. Probl. Eng. 2016, 2016, 3824350. [Google Scholar] [CrossRef][Green Version]
- Douissa, M.R.; Jabeur, K. A Non-Compensatory Classification Approach for Multi-Criteria ABC Analysis. Soft Comput. 2020, 24, 9525–9556. [Google Scholar] [CrossRef]
- Banihabib, M.E.; Chitsaz, N.; Randhir, T.O. Non-Compensatory Decision Model for Incorporating the Sustainable Development Criteria in Flood Risk Management Plans. SN Appl. Sci. 2020, 2, 6. [Google Scholar] [CrossRef]
- Dotoli, M.; Epicoco, N.; Falagario, M. Multi-Criteria Decision Making Techniques for the Management of Public Procurement Tenders: A Case Study. Appl. Soft Comput. 2020, 88, 106064. [Google Scholar] [CrossRef]
- Deng, J. The Primary Methods of Grey System Theory; Huazhong University of Science and Technology Press: Wuhan, China, 2005. [Google Scholar]
- Cao, Q.; Esangbedo, M.O.; Bai, S.; Esangbedo, C.O. Grey SWARA-FUCOM Weighting Method for Contractor Selection MCDM Problem: A Case Study of Floating Solar Panel Energy System Installation. Energies 2019, 12, 2481. [Google Scholar] [CrossRef]
- Esangbedo, M.O.; Xue, J.; Bai, S.; Esangbedo, C.O. Relaxed Rank Order Centroid Weighting MCDM Method With Improved Grey Relational Analysis for Subcontractor Selection: Photothermal Power Station Construction. In IEEE Transactions on Engineering Management; IEEE: Piscataway, NJ, USA, 2022; pp. 1–18. [Google Scholar] [CrossRef]
- Esangbedo, M.O.; Bai, S. Scaling Foreign-Service Premium Allowance Based on SWARA and GRA with Grey Numbers. J. Grey Syst. 2020, 32, 38–58. [Google Scholar]
- Zhou, H.; Ping, W.; Wang, Y.; Wang, Y.; Liu, K. China’s Initial Allocation of Interprovincial Carbon Emission Rights Considering Historical Carbon Transfers: Program Design and Efficiency Evaluation. Ecol. Indic. 2021, 121, 106918. [Google Scholar] [CrossRef]
- Xu, J.; Cao, J.; Wang, Y.; Shi, X.; Zeng, J. Evolutionary Game on Government Regulation and Green Supply Chain Decision-Making. Energies 2020, 13, 620. [Google Scholar] [CrossRef]
- Yi, Y.; Li, J. The Effect of Governmental Policies of Carbon Taxes and Energy-Saving Subsidies on Enterprise Decisions in a Two-Echelon Supply Chain. J. Clean. Prod. 2018, 181, 675–691. [Google Scholar] [CrossRef]
- Zhang, H.; Li, P.; Zheng, H.; Zhang, Y. Impact of Carbon Tax on Enterprise Operation and Production Strategy for Low-Carbon Products in a Co-Opetition Supply Chain. J. Clean. Prod. 2021, 287, 125058. [Google Scholar] [CrossRef]
- Rockström, J.; Gaffney, O.; Rogelj, J.; Meinshausen, M.; Nakicenovic, N.; Schellnhuber, H.J. A Roadmap for Rapid Decarbonization. Science 2017, 355, 1269–1271. [Google Scholar] [CrossRef]
- Griscom, B.W.; Adams, J.; Ellis, P.W.; Houghton, R.A.; Lomax, G.; Miteva, D.A.; Schlesinger, W.H.; Shoch, D.; Siikamäki, J.V.; Smith, P.; et al. Natural Climate Solutions. Proc. Natl. Acad. Sci. USA 2017, 114, 11645–11650. [Google Scholar] [CrossRef] [PubMed]
- Davis, S.J.; Lewis, N.S.; Shaner, M.; Aggarwal, S.; Arent, D.; Azevedo, I.L.; Benson, S.M.; Bradley, T.; Brouwer, J.; Chiang, Y.M.; et al. Net-Zero Emissions Energy Systems. Science 2018, 360, eaas9793. [Google Scholar] [CrossRef]
- Minx, J.C.; Lamb, W.F.; Callaghan, M.W.; Fuss, S.; Hilaire, J.; Creutzig, F.; Amann, T.; Beringer, T.; Garcia, W.d.O.; Hartmann, J.; et al. Negative Emissions—Part 1: Research Landscape and Synthesis. Environ. Res. Lett. 2018, 13, 063001. [Google Scholar] [CrossRef]
- Creutzig, F.; Roy, J.; Lamb, W.F.; Azevedo, I.M.L.; Bruine de Bruin, W.; Dalkmann, H.; Edelenbosch, O.Y.; Geels, F.W.; Grubler, A.; Hepburn, C.; et al. Towards Demand-Side Solutions for Mitigating Climate Change. Nat. Clim. Chang. 2018, 8, 260–263. [Google Scholar] [CrossRef]
- Zvezdov, D.; Hack, S. Carbon Footprinting of Large Product Portfolios. Extending the Use of Enterprise Resource Planning Systems to Carbon Information Management. J. Clean. Prod. 2016, 135, 1267–1275. [Google Scholar] [CrossRef]
- Ma, Y.; Tao, P. A Perspective on Management Myopia: The Impact of Digital Transformation on Carbon Emission Intensity. Sustainability 2023, 15, 9417. [Google Scholar] [CrossRef]
- Grubler, A.; Wilson, C.; Bento, N.; Boza-Kiss, B.; Krey, V.; McCollum, D.L.; Rao, N.D.; Riahi, K.; Rogelj, J.; De Stercke, S.; et al. A Low Energy Demand Scenario for Meeting the 1.5 °C Target and Sustainable Development Goals without Negative Emission Technologies. Nat. Energy 2018, 3, 515–527. [Google Scholar] [CrossRef]
- Wu, B.; Liu, P.; Xu, X. An Evolutionary Analysis of Low-Carbon Strategies Based on the Government–Enterprise Game in the Complex Network Context. J. Clean. Prod. 2017, 141, 168–179. [Google Scholar] [CrossRef]
- Fan, L.; Xu, J. Authority–Enterprise Equilibrium Based Mixed Subsidy Mechanism for Carbon Reduction and Energy Utilization in the Coalbed Methane Industry. Energy Policy 2020, 147, 111828. [Google Scholar] [CrossRef]
- Qu, X.; Sun, X. How to Improve the Function of Government Carbon Tax in Promoting Enterprise Carbon Emission Reduction: From the Perspective of Three-Stage Dynamic Game. Environ. Sci. Pollut. Res. 2022, 29, 31348–31362. [Google Scholar] [CrossRef]
- Geng, J.; Ji, M.; Yang, L. Role of Enterprise Alliance in Carbon Emission Reduction Mechanism: An Evolutionary Game Analysis. Int. J. Environ. Res. Public Health 2022, 19, 11368. [Google Scholar] [CrossRef]
- Gell, M. Carbon-Constrained Health Care Enterprise. J. Eval. Clin. Pract. 2010, 16, 220–227. [Google Scholar] [CrossRef] [PubMed]
- Zhao, S.; Dai, A.; Zhao, D.; Song, Q. Identifying the Influence Factors on Low-Carbon Behavior of Employees from Petrochemical Enterprise under “Carbon Neutrality”. Environ. Dev. Sustain. 2022, 1–22. [Google Scholar] [CrossRef]
- Sindhwani, R.; Singh, P.L.; Behl, A.; Afridi, M.S.; Sammanit, D.; Tiwari, A.K. Modeling the Critical Success Factors of Implementing Net Zero Emission (NZE) and Promoting Resilience and Social Value Creation. Technol. Forecast. Soc. Chang. 2022, 181, 121759. [Google Scholar] [CrossRef]
- Ayan, B.; Abacıoğlu, S.; Basilio, M.P. A Comprehensive Review of the Novel Weighting Methods for Multi-Criteria Decision-Making. Information 2023, 14, 285. [Google Scholar] [CrossRef]
- Tian, G.; Lu, W.; Zhang, X.; Zhan, M.; Dulebenets, M.A.; Aleksandrov, A.; Fathollahi-Fard, A.M.; Ivanov, M. A Survey of Multi-Criteria Decision-Making Techniques for Green Logistics and Low-Carbon Transportation Systems. Environ. Sci. Pollut. Res. 2023, 30, 57279–57301. [Google Scholar] [CrossRef] [PubMed]
- Keshavarz-Ghorabaee, M.; Amiri, M.; Zavadskas, E.K.; Turskis, Z.; Antucheviciene, J. Determination of Objective Weights Using a New Method Based on the Removal Effects of Criteria (MEREC). Symmetry 2021, 13, 525. [Google Scholar] [CrossRef]
- Simic, V.; Gokasar, I.; Deveci, M.; Svadlenka, L. Mitigating Climate Change Effects of Urban Transportation Using a Type-2 Neutrosophic MEREC-MARCOS Model. In IEEE Transactions on Engineering Management; IEEE: Piscataway, NJ, USA, 2022. [Google Scholar] [CrossRef]
- Deveci, M.; Gokasar, I.; Mishra, A.R.; Rani, P.; Ye, Z. Evaluation of Climate Change-Resilient Transportation Alternatives Using Fuzzy Hamacher Aggregation Operators Based Group Decision-Making Model. Eng. Appl. Artif. Intell. 2023, 119, 105824. [Google Scholar] [CrossRef]
- Nicolalde, J.F.; Cabrera, M.; Martinez-Gomez, J.; Salazar, R.B.; Reyes, E. Selection of a Phase Change Material for Energy Storage by Multi-Criteria Decision Method Regarding the Thermal Comfort in a Vehicle. J. Energy Storage 2022, 51, 104437. [Google Scholar] [CrossRef]
- Mishra, A.R.; Tripathi, D.K.; Cavallaro, F.; Rani, P.; Nigam, S.K.; Mardani, A. Assessment of Battery Energy Storage Systems Using the Intuitionistic Fuzzy Removal Effects of Criteria and the Measurement of Alternatives and Ranking Based on Compromise Solution Method. Energies 2022, 15, 7782. [Google Scholar] [CrossRef]
- Mishra, A.R.; Rani, P.; Saha, A.; Hezam, I.M.; Cavallaro, F.; Chakrabortty, R.K. An Extended DNMA-based Multi-Criteria Decision-Making Method and Its Application in the Assessment of Sustainable Location for a Lithium-Ion Batteries? Manufacturing Plant. Heliyon 2023, 9, e14244. [Google Scholar] [CrossRef] [PubMed]
- Ul Haq, R.S.; Saeed, M.; Mateen, N.; Siddiqui, F.; Naqvi, M.; Yi, J.B.; Ahmed, S. Sustainable Material Selection with Crisp and Ambiguous Data Using Single-Valued Neutrosophic-MEREC-MARCOS Framework. Appl. Soft Comput. 2022, 128, 109546. [Google Scholar] [CrossRef]
- Mishra, A.R.; Saha, A.; Rani, P.; Hezam, I.M.; Shrivastava, R.; Smarandache, F. An Integrated Decision Support Framework Using Single-Valued-MEREC-MULTIMOORA for Low Carbon Tourism Strategy Assessment. IEEE Access 2022, 10, 24411–24432. [Google Scholar] [CrossRef]
- Jahan, A.; Edwards, K.L. A State-of-the-Art Survey on the Influence of Normalization Techniques in Ranking: Improving the Materials Selection Process in Engineering Design. Mater. Des. 2015, 65, 335–342. [Google Scholar] [CrossRef]
- Gardziejczyk, W.; Zabicki, P. Normalization and Variant Assessment Methods in Selection of Road Alignment Variants–Case Study. J. Civ. Eng. Manag. 2017, 23, 510–523. [Google Scholar] [CrossRef]
- Brauers, W.; Zavadskas, E. The MOORA Method and Its Application to Privatization in a Transition Economy. Control Cybern. 2006, 35, 445–469. [Google Scholar]
- Zavadskas, E.K.; Turskis, Z. A New Logarithmic Normalization Method in Games Theory. Informatica 2008, 19, 303–314. [Google Scholar] [CrossRef]
- Ivanovic, B.; Saha, A.; Stevic, Z.; Puska, A.; Zavadskas, E.K. Selection of Truck Mixer Concrete Pump Using Novel MEREC DNMARCOS Model. Arch. Civ. Mech. Eng. 2022, 22, 173. [Google Scholar] [CrossRef]
- Hezam, I.M.; Mishra, A.R.; Rani, P.; Cavallaro, F.; Saha, A.; Ali, J.; Strielkowski, W.; Streimikiene, D. A Hybrid Intuitionistic Fuzzy-MEREC-RS-DNMA Method for Assessing the Alternative Fuel Vehicles with Sustainability Perspectives. Sustainability 2022, 14, 5463. [Google Scholar] [CrossRef]
- Bošković, S.; Švadlenka, L.; Jovčić, S.; Dobrodolac, M.; Simić, V.; Bacanin, N. An Alternative Ranking Order Method Accounting for Two-Step Normalization (AROMAN)—A Case Study of the Electric Vehicle Selection Problem. IEEE Access 2023, 11, 39496–39507. [Google Scholar] [CrossRef]
- Trung, D.D.; Thinh, H.X. A Multi-Criteria Decision-Making in Turning Process Using the MAIRCA, EAMR, MARCOS and TOPSIS Methods: A Comparative Study. Adv. Prod. Eng. Manag. 2021, 16, 443–456. [Google Scholar] [CrossRef]
- Nguyen, H.Q.; Le, X.H.; Nguyen, T.T.; Tran, Q.H.; Vu, N.P. A Comparative Study on Multi-Criteria Decision-Making in Dressing Process for Internal Grinding. Machines 2022, 10, 303. [Google Scholar] [CrossRef]
- Le, H.A.; Hoang, X.T.; Trieu, Q.H.; Pham, D.L.; Le, X.H. Determining the Best Dressing Parameters for External Cylindrical Grinding Using MABAC Method. Appl. Sci. 2022, 12, 8287. [Google Scholar] [CrossRef]
- Esangbedo, M.O.; Abifarin, J.K. Cost and Quality Optimization Taguchi Design with Grey Relational Analysis of Halloysite Nanotube Hybrid Composite: CNC Machine Manufacturing. Materials 2022, 15, 8154. [Google Scholar] [CrossRef]
- Kumar, R.; Goel, P.; Zavadskas, E.K.; Stevic, Z.; Vujovic, V. A New Joint Strategy for Multi-Criteria Decision-Making: A Case Study for Prioritizing Solid-State Drive. Int. J. Comput. Commun. Control 2022, 17. [Google Scholar] [CrossRef]
- Chaurasiya, R.; Jain, D. A New Algorithm on Pythagorean Fuzzy-Based Multi-Criteria Decision-Making and Its Application. Iran. J. Sci.-Technol.-Trans. Electr. Eng. 2023, 47, 871–886. [Google Scholar] [CrossRef]
- Keshavarz-Ghorabaee, M. Assessment of Distribution Center Locations Using a Multi-Expert Subjective–Objective Decision-Making Approach. Sci. Rep. 2021, 11, 19461. [Google Scholar] [CrossRef]
- Yu, Y.; Wu, S.B.; Yu, J.X.; Xu, Y.; Song, L.; Xu, W.P. A Hybrid Multi-Criteria Decision-Making Framework for Offshore Wind Turbine Selection: A Case Study in China. Appl. Energy 2022, 328, 120173. [Google Scholar] [CrossRef]
- Yu, Y.; Wu, S.B.; Yu, J.X.; Chen, H.C.; Zeng, Q.Z.; Xu, Y.; Ding, H.Y. An Integrated MCDM Framework Based on Interval 2-Tuple Linguistic: A Case of Offshore Wind Farm Site Selection in China. Process Saf. Environ. Prot. 2022, 164, 613–628. [Google Scholar] [CrossRef]
- Narayanamoorthy, S.; Parthasarathy, T.N.; Pragathi, S.; Shanmugam, P.; Baleanu, D.; Ahmadian, A.; Kang, D. The Novel Augmented Fermatean MCDM Perspectives for Identifying the Optimal Renewable Energy Power Plant Location. Sustain. Energy Technol. Assess. 2022, 53, 102488. [Google Scholar] [CrossRef]
- Gligoric, Z.; Gligoric, M.; Miljanovic, I.; Lutovac, S.; Milutinovic, A. Assessing Criteria Weights by the Symmetry Point of Criterion (Novel SPC Method)-Application in the Efficiency Evaluation of the Mineral Deposit Multi-Criteria Partitioning Algorithm. CMES-Comput. Model. Eng. Sci. 2023, 136, 955–979. [Google Scholar] [CrossRef]
- Rani, P.; Mishra, A.R.; Saha, A.; Hezam, I.M.; Pamucar, D. Fermatean Fuzzy Heronian Mean Operators and MEREC-based Additive Ratio Assessment Method: An Application to Food Waste Treatment Technology Selection. Int. J. Intell. Syst. 2022, 37, 2612–2647. [Google Scholar] [CrossRef]
- Miskic, S.; Tadic, S.; Stevic, A.; Krstic, M.; Roso, V. A Novel Hybrid Model for the Evaluation of Industry 4.0 Technologies’ Applicability in Logistics Centers. J. Math. 2023, 2023, 3532862. [Google Scholar] [CrossRef]
- Simic, V.; Ivanovic, I.; Doric, V.; Torkayesh, A.E. Adapting Urban Transport Planning to the COVID-19 Pandemic: An Integrated Fermatean Fuzzy Model. Sustain. Cities Soc. 2022, 79, 103669. [Google Scholar] [CrossRef]
- Keshavarz-Ghorabaee, M. Sustainable Supplier Selection and Order Allocation Using an Integrated ROG-Based Type-2 Fuzzy Decision-Making Approach. Mathematics 2023, 11, 2014. [Google Scholar] [CrossRef]
- Deveci, M.; Mishra, A.R.; Gokasar, I.; Rani, P.; Pamucar, D.; Ozcan, E. A Decision Support System for Assessing and Prioritizing Sustainable Urban Transportation in Metaverse. IEEE Trans. Fuzzy Syst. 2023, 31, 475–484. [Google Scholar] [CrossRef]
- Liu, S.; Yang, Y.; Forrest, J. Grey Data Analysis; Computational Risk Management; Springer: Singapore, 2017. [Google Scholar] [CrossRef]
- Esangbedo, M.O.; Bai, S. Grey regulatory focus theory weighting method for the multi-criteria decision-making problem in evaluating university reputation. Symmetry 2019, 11, 230. [Google Scholar] [CrossRef]
- Pamucar, D.S.; Tarle, S.P.; Parezanovic, T. New Hybrid Multi-Criteria Decision-Making DEMATEL-MAIRCA Model: Sustainable Selection of a Location for the Development of Multimodal Logistics Centre. Econ. Res.-Ekon. Istraživanja 2018, 31, 1641–1665. [Google Scholar] [CrossRef]
- Sałabun, W.; Urbaniak, K. A New Coefficient of Rankings Similarity in Decision-Making Problems. In Lecture Notes in Computer Science, Proceedings of the Computational Science–ICCS 2020, Amsterdam, The Netherlands, 3–5 June 2020; Krzhizhanovskaya, V.V., Závodszky, G., Lees, M.H., Dongarra, J.J., Sloot, P.M.A., Brissos, S., Teixeira, J., Eds.; Springer: Berlin/Heidelberg, Germany, 2020; pp. 632–645. [Google Scholar] [CrossRef]
Disclaimer/Publisher’s Note: The statements, opinions and data contained in all publications are solely those of the individual author(s) and contributor(s) and not of MDPI and/or the editor(s). MDPI and/or the editor(s) disclaim responsibility for any injury to people or property resulting from any ideas, methods, instructions or products referred to in the content. |
© 2023 by the authors. Licensee MDPI, Basel, Switzerland. This article is an open access article distributed under the terms and conditions of the Creative Commons Attribution (CC BY) license (https://creativecommons.org/licenses/by/4.0/).