Article

Genome-Wide Identification and Expression Analysis of the Broad-Complex, Tramtrack, and Bric-à-Brac Domain-Containing Protein Gene Family in Potato

1
Department of Biotechnology, BMS Block I, Panjab University, Sector 25, Chandigarh 160014, India
2
Department of Botany, Panjab University, Sector 14, Chandigarh 160014, India
*
Author to whom correspondence should be addressed.
Agriculture 2024, 14(5), 771; https://doi.org/10.3390/agriculture14050771
Submission received: 5 April 2024 / Revised: 13 May 2024 / Accepted: 15 May 2024 / Published: 16 May 2024
(This article belongs to the Special Issue Abiotic Stress Responses in Horticultural Crops)

Abstract

:
The BTB (broad-complex, tramtrack, and bric-à-brac) domain, also known as the POZ (POX virus and zinc finger) domain, is a conserved protein–protein interaction domain present in various organisms. In this study, we conducted a genome-wide search to identify and characterize BTB genes in Solanum tuberosum. A total of 57 StBTBs were identified and analyzed for their physicochemical properties, chromosomal distribution, gene structure, conserved motifs, phylogenetic relationships, tissue-specific expression patterns, and responses to hormonal and stress treatments. We found that StBTBs were unevenly distributed across potato chromosomes and exhibited diverse gene structures and conserved motifs. Tissue-specific expression analysis revealed differential expression patterns across various potato tissues, implying their roles in plant growth and development. Furthermore, differential expression analysis under hormonal and stress treatments indicated the involvement of StBTBs in abiotic and biotic stress responses and hormone signaling pathways. Protein–protein interaction analysis identified potential interactions with ribosomal proteins, suggesting roles in translational regulation. Additionally, microRNA target site analysis revealed regulatory relationships between StBTBs and miRNAs. Our study provides a comprehensive understanding of the StBTB gene family in potato, laying the groundwork for further functional characterization and manipulation of these genes to improve stress tolerance and agricultural productivity in potato and related plant species.

1. Introduction

The BTB domain (broad-complex, tramtrack, and bric-à-brac) is a conserved domain which was first identified in the Drosophila broad-complex, tramtrack, and bric-à-brac genes [1,2]. A total of 183 BTB proteins were found in Homo sapiens, 195 in Mus musculus, 178 in Caenorhabditis elegans, 77 in Arabidopsis thaliana, and 5 in Saccharomyces cerevisiae [3]. The structure of the BTB domain consists of five conserved alpha helices and three beta strands along with extension regions at N- and C-terminal sites. The BTB domain consists of 116 amino acids and acts as a homodimer or heterodimer to interact with various other non-BTB proteins to perform various functions [4]. The BTB domain serves two functions: it has the capability to self-assemble into a dimer and to engage with proteins lacking the BTB domain. Given that the conserved groove within the BTB domain resides at the interface of the dimer, it has been anticipated that the formation of dimers is crucial for the envisaged interactions occurring within this groove [5]. BTB domains undergo particular adaptations, acquiring novel functions such as the multimerization of proteins engaged in DNA binding and ion channel activity [6].
The BTB domain is recognized for its capacity to facilitate protein–protein interactions. Within plants, BTB domain-containing proteins engage with a range of partner proteins, such as transcription factors, kinases, and other regulatory molecules. These interactions frequently take place via the BTB domain, facilitating the assembly of multiprotein complexes crucial for diverse cellular functions. BTB domain-containing proteins frequently serve as substrate adaptors for Cullin-RING E3 ubiquitin ligases (CRLs) within the ubiquitin–proteasome system (UPS). Through the BTB domain, they selectively recruit target proteins to the CRL complex, triggering their ubiquitination and subsequent breakdown by the 26S proteasome [7]. This process tightly controls the levels of pivotal regulatory proteins crucial for governing plant growth, development, and responses to stress. Certain BTB domain-containing proteins function as transcriptional regulators by modulating the function of transcription factors. They have the capacity to act as either co-repressors or co-activators, thereby impacting the expression of target genes involved in diverse physiological processes. By interacting with transcription factors or chromatin-modifying enzymes, BTB domain-containing proteins govern gene expression through modulation of chromatin structure or transcriptional activity [8].
BTB is a protein–protein interaction domain as it interacts with other domains like NPH3 (non-phototropic hypocotyl 3), BACK (for BTB and C-terminal Kelch), TAZ (Transcription Adaptor putative zinc finger), MATH (meprin and TRAF homology), SKP1 (S-phase kinase-associated protein 1), and ARM (armadillo) to perform important roles in plant growth and development [9]. Previous studies have shown that plants overexpressing the BT2 (BTB AND TAZ DOMAIN PROTEIN 2) gene have reduced nitrogen uptake efficiency under limiting nitrate conditions as compared to wild type plants [10]. The BTB domain plays an important role in transcriptional regulation [11], chromatin remodeling, cytoskeleton regulation [3], lymphocyte development [12], axon guidance [13], leukemia [14], and protein ubiquitination [15]. The BTB domain is essential for gametophytic development in plants [14,16] and provides abiotic and biotic stress tolerance [17,18,19,20,21]. Various BTB domain-containing proteins help regulate plant signaling mediated by hormones such as abscisic acid, jasmonic acid, gibberellic acid, and salicylic acid [17].
Plants suffer from various types of biotic and abiotic stresses, which result in both qualitative and quantitative losses of crops. Abiotic stresses like drought stress and heat stress cause huge damage to the potato crop and reduce its yield. IbBT4, a BTB-TAZ domain protein-encoding gene from sweet potato, was shown to provide drought tolerance in transgenic Arabidopsis [18]. AtSIBP1 is a novel BTB domain-containing gene whose overexpression significantly elevated the expression of stress-responsive genes, indicating its role as a positive regulator in salt stress responses [19]. Previous studies show that overexpression of BTB domain-containing protein NPR1 in Arabidopsis leads to resistance against Pseudomonas syringae, Peronospora parasitica, and Erysiphe cichoracearum [20]. The overexpression of NbBTB in Nicotiana benthamiana resulted in enhanced susceptibility to P. parasitica infection, whereas the silencing of NbBTB led to higher resistance to P. parasitica, suggesting that NbBTB plays a suppressive role in the plant’s innate defence mechanisms [21]. It was also observed that NbBTB was specifically implicated in the basal defence response against oomycete infections as either its overexpression or silencing did not have any impact on plant resistance against the bacterial pathogens Ralstonia solanacearum and P. syringae. The hypersensitive reaction (HR) elicited by avirulence proteins from R. sonanacearum and Phytophthora infestans was shown to be decreased by the expression of NbBTB. Conversely, the silencing of NbBTB resulted in the opposite effect, suggesting its negative regulatory role in effector-triggered immunity (ETI). The protein accumulation of avirulence effectors in plants with silenced NbBTB was found to be dramatically increased, indicating that it is likely to exert a detrimental influence on effector protein accumulation and, consequently, the effector-triggered immunity (ETI) response [21].
This study aims at performing a genome-wide search to identify BTBs in potato and analyzing their chromosomal distribution, gene structure, conserved motif analysis, phylogenetic analysis, protein–protein interactions, and miRNA target prediction. Furthermore, the expression patterns of the identified genes were studied under specific plant tissues, hormonal treatments, and various abiotic and biotic stress treatments. The present investigation presents a comprehensive analysis of the BTB gene family, offering a robust foundation for the systematic investigation and functional characterization of BTBs in potato and other related plant species.

2. Materials and Methods

2.1. Identification and Sequence Analysis of the StBTB Gene Family

The Solanum tuberosum genome (DM v6.1) was downloaded from the Spud database (http://spuddb.uga.edu/dm_v6_1_download.shtml, accessed on 9 September 2023). BTBs were identified by conducting a standalone HMMER [22] search against the protein database of potato using the Pfam ID PF00651. The putative StBTB protein sequences were checked for the presence of a conserved BTB domain using the NCBI protein Batch CD-Search database (https://www.ncbi.nlm.nih.gov/Structure/bwrpsb/bwrpsb.cgi, accessed on 10 October 2023) [23], InterProScan (https://www.ebi.ac.uk/interpro/, accessed on 10 October 2023) [24], and SMART (http://smart.embl-heidelberg.de/, accessed on 10 October 2023) [25]. The protein sequences of the resulting genes were used to analyze the physicochemical properties using the Expasy ProtParam tool (https://web.expasy.org/protparam/, accessed on 15 October 2023) [26]. The subcellular location of all BTB proteins was investigated using WolfPSORT (https://www.genscript.com/wolf-psort.html, accessed on 12 October 2023) [27]. SOPMA was used to understand the secondary structure composition of STBTB proteins (https://npsa-prabi.ibcp.fr/cgi-bin/npsa_automat.pl?page=/NPSA/npsa_sopma.html, accessed on 14 October 2023) [28].

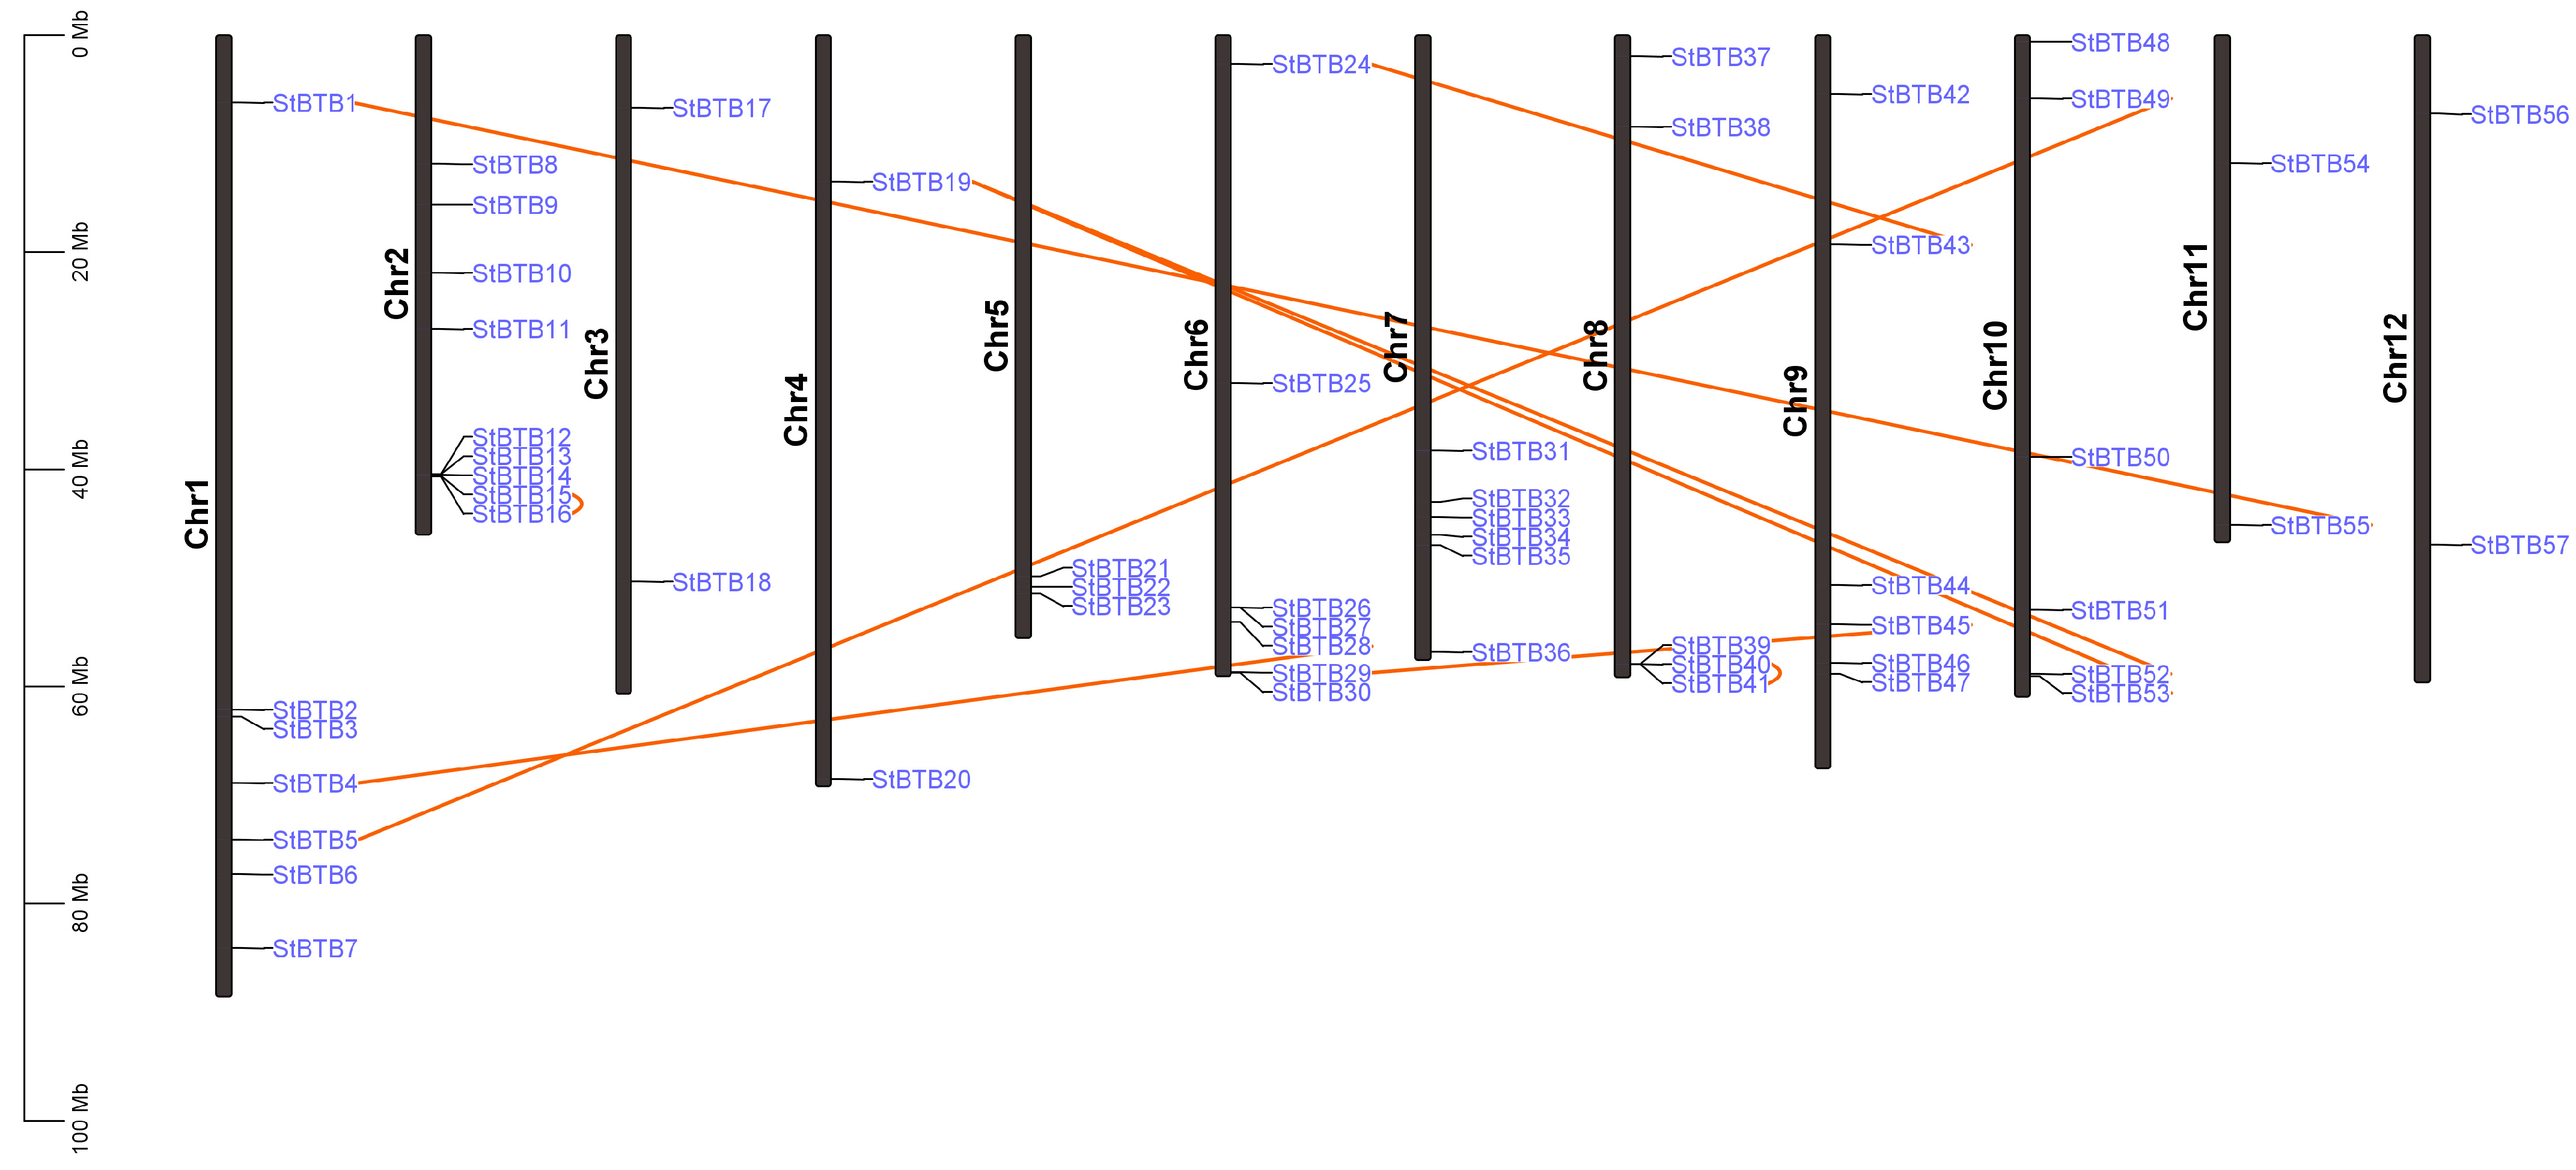
2.2. Chromosomal Distribution and Gene Duplication Event

The chromosomal locations of all identified StBTBs were retrieved from the Spud database (http://spuddb.uga.edu/dm_v6_1_download.shtml, accessed on 12 October 2023). Bidirectional BLAST was performed using the identified StBTBs and the genes showing >80% similarity were considered to be duplicated. Duplicated genes situated within a 5 megabase (Mb) range on the same chromosome were classified as tandem duplications, whereas those found beyond the 5 Mb threshold were categorized as segmental duplications [29]. The positions of all the genes along with duplications were mapped on their respective chromosomes using TBTools-II v2.010 software [30]. The ratio of the number of nonsynonymous substitutions per nonsynonymous site (Ka) to the number of synonymous substitutions per synonymous site (Ks) of the duplicated gene pairs was calculated using TBTools-II v2.010 software [30].

2.3. Gene Structure and Conserved Motif Analyses of the StBTBs

The genomic and coding sequences of the identified StBTBs were retrieved from the Spud database and were used to study the intron–exon organization using GSDS 2.0 (http://gsds.gao-lab.org/, accessed on 16 October 2023) [31]. The StBTB protein sequences were used to analyze the conserved motifs using MEME Suite (version 5.4.1) (https://meme-suite.org/meme/index.html, accessed on 17 October 2023) with default parameters except the number of motifs was set to 20 and the width of the motifs was set from 20 to 200 [32]. The resulting motifs were visualized using TBTools-II v2.010 software [30].

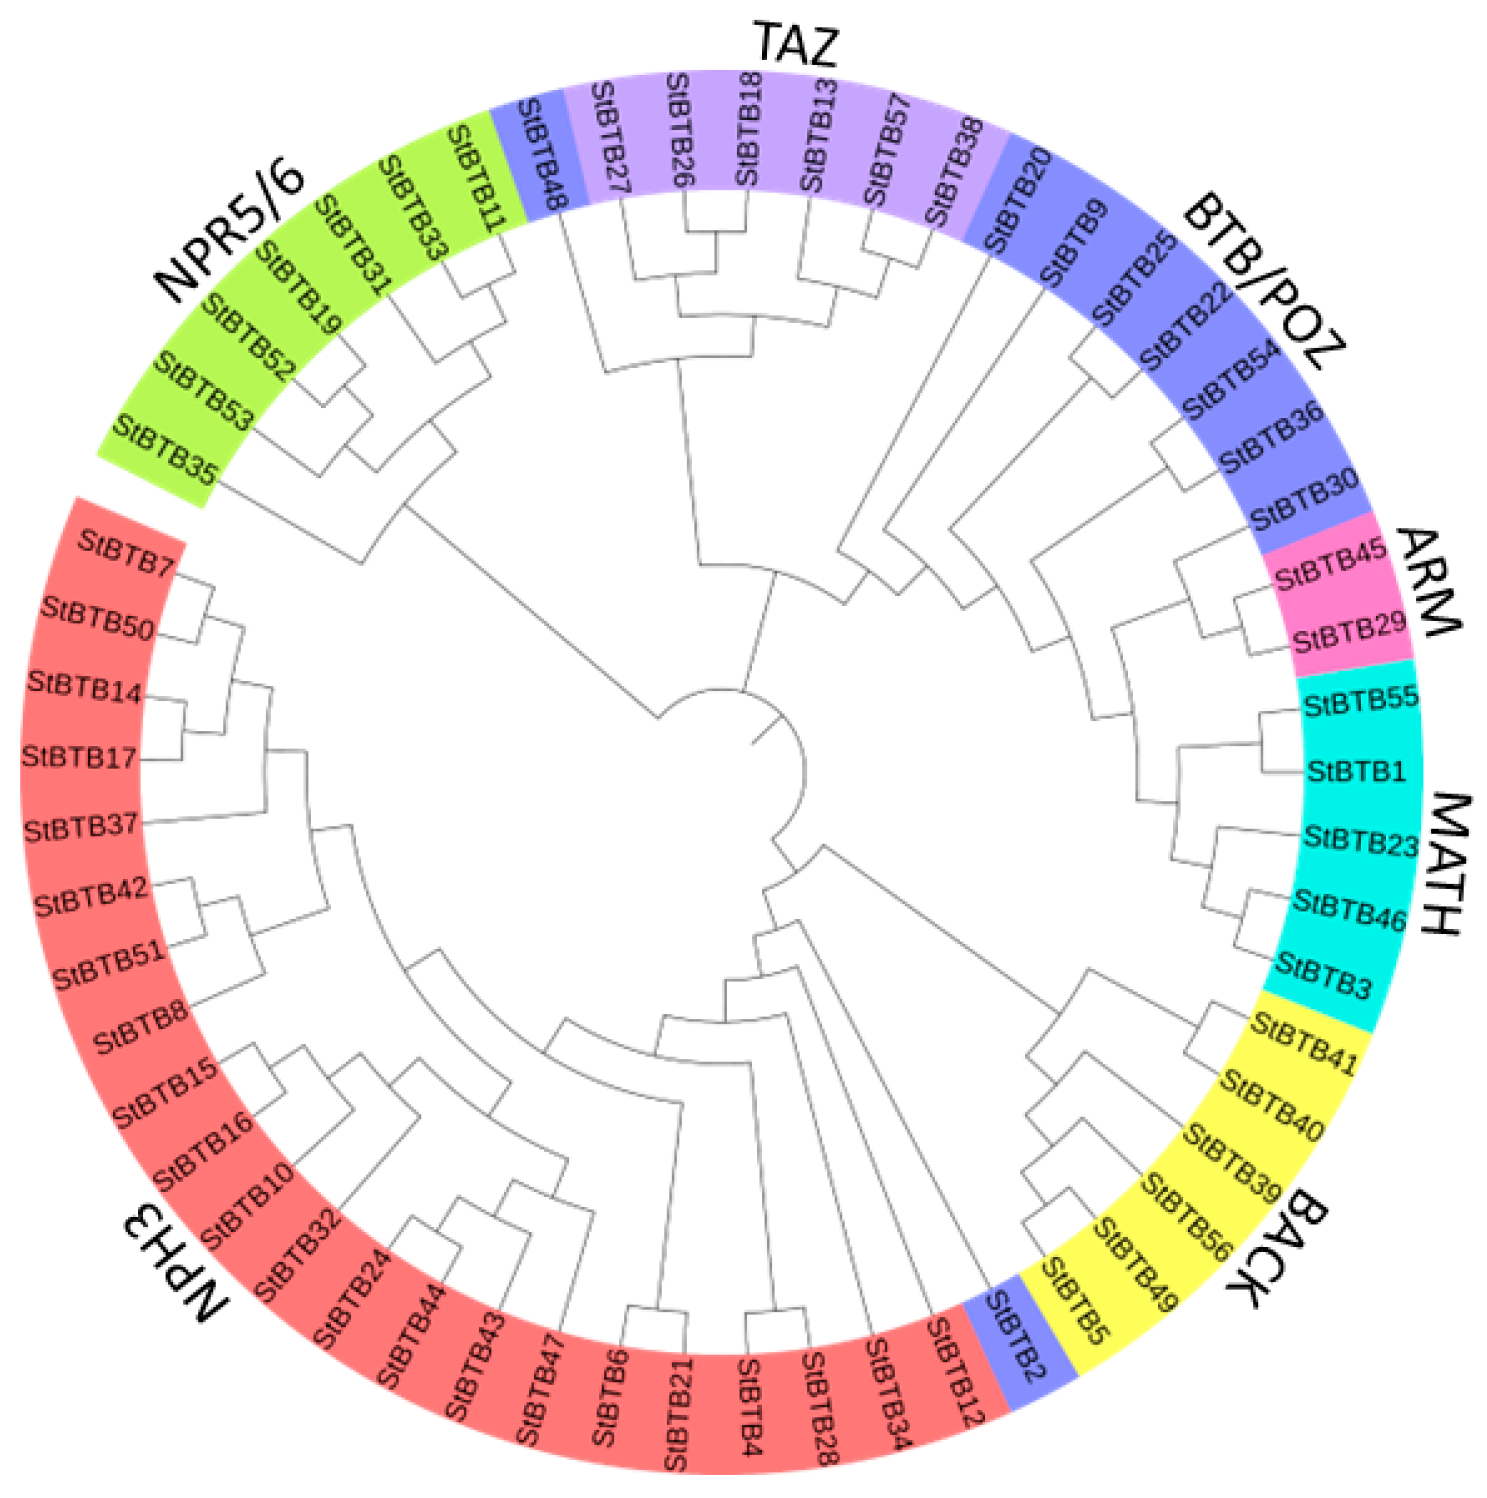
2.4. Multiple Sequence Alignment and Phylogenetic Tree Construction

Multiple sequence alignment of the StBTB protein sequences was performed using the MUSCLE algorithm [33]. A neighbor-joining phylogenetic tree was constructed with the Mega-X v2.1 software using the p-distance method with pairwise deletion and 1000 bootstrap replications [34]. The phylogenetic tree was visualized using i-TOL (https://itol.embl.de/, accessed on 9 January 2024) [35].

2.5. Tissue-Specific Expression Analysis of StBTBs

The tissue-specific gene expression values (TPM) for RNA-seq libraries of potato DM v6.1 were retrieved from the Spud database (http://spuddb.uga.edu/dm_v6_1_download.shtml, accessed on 9 January 2024) for 16 different tissues (stamen, flower, mature tuber, tuber sprout, young tuber, tuber pith, leaf, water-stressed leaf, tuber peel, shoot apex, stem, stolon, petiole, tuber cortex, root, whole in vitro plant) from the plant. The retrieved TPMs of StBTBs were then plotted as heatmaps on a log scale using TBTools-II v2.010 software [30].

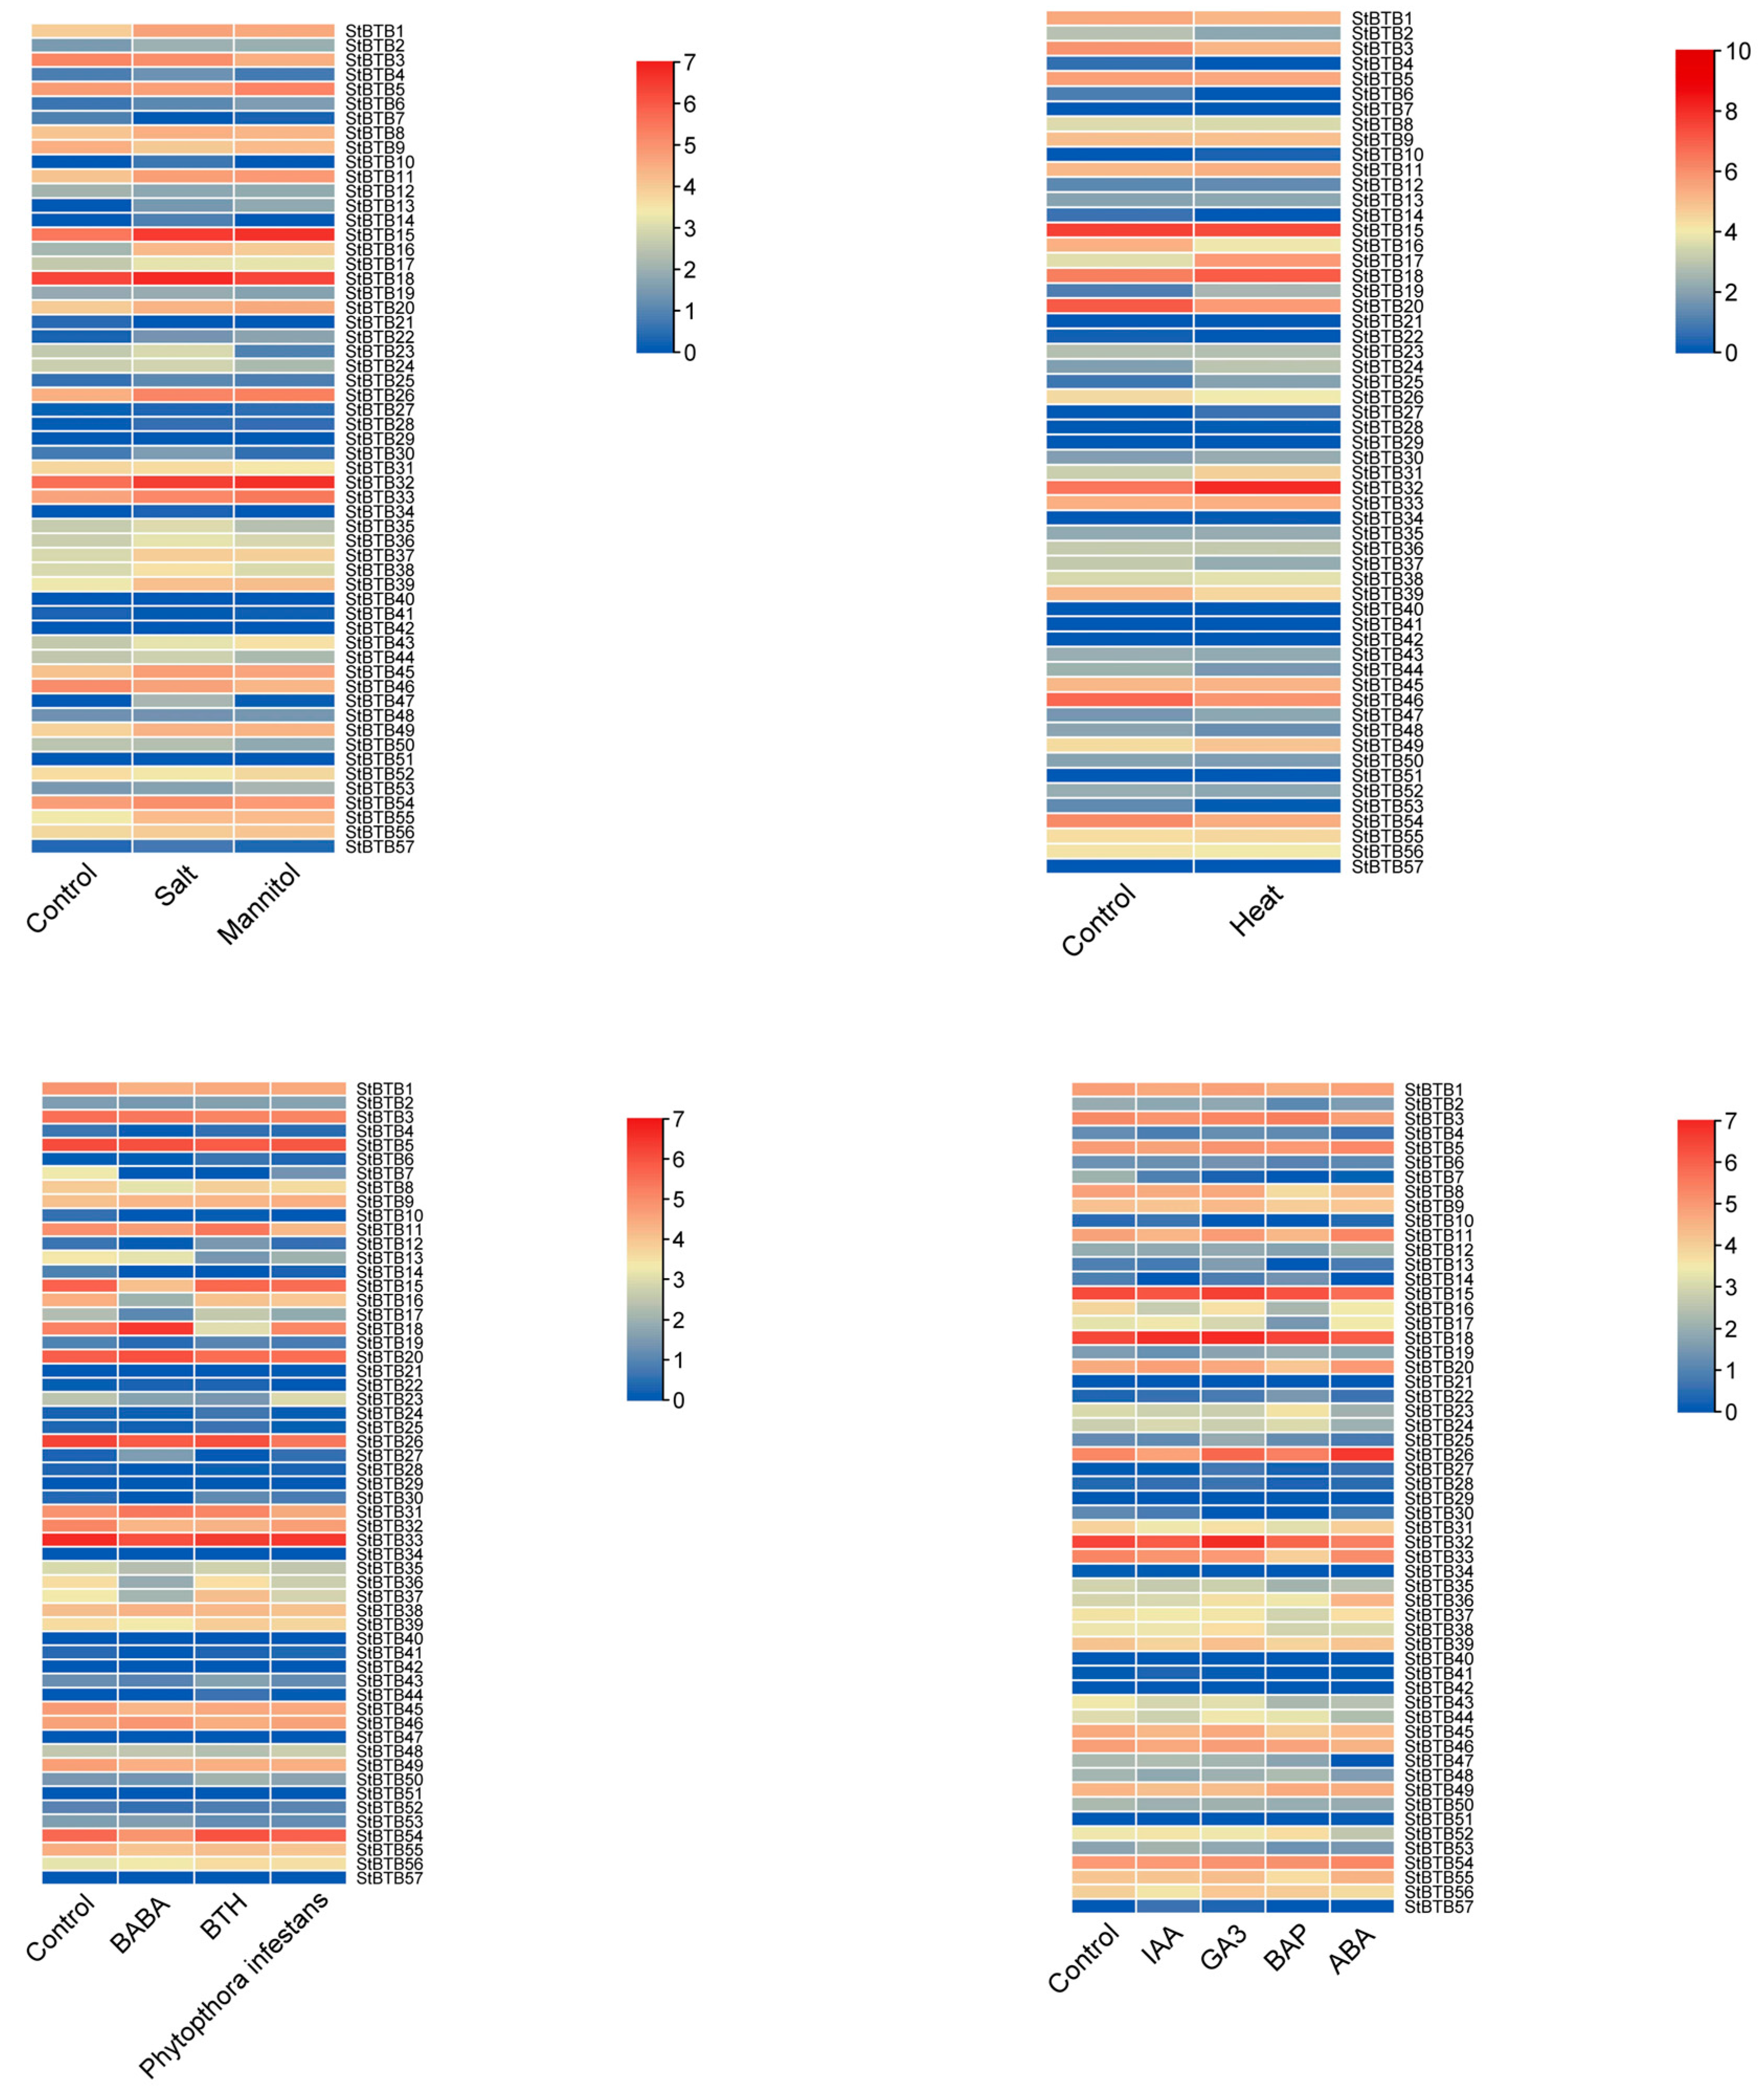
2.6. Expression Analysis of StBTBs under Various Hormonal and Stress Treatments

The gene expression values (TPM) for RNA-seq libraries of potato DM v6.1 were retrieved from the Spud database (http://spuddb.uga.edu/dm_v6_1_download.shtml, accessed on 9 January 2024) for various hormonal treatments, i.e., IAA, GA3, BAP, and ABA. The gene expression values of potato under heat stress, salt stress, and mannitol treatment were also retrieved. Additionally, the TPMs for Phytophthora infestans infected plants and systemic acquired resistance (SAR) elicitors such as BABA- and BTH-treated plants were also taken. All the retrieved StBTB TPMs were then plotted as heatmaps on a log scale using TBTools-II v2.010 software [30].

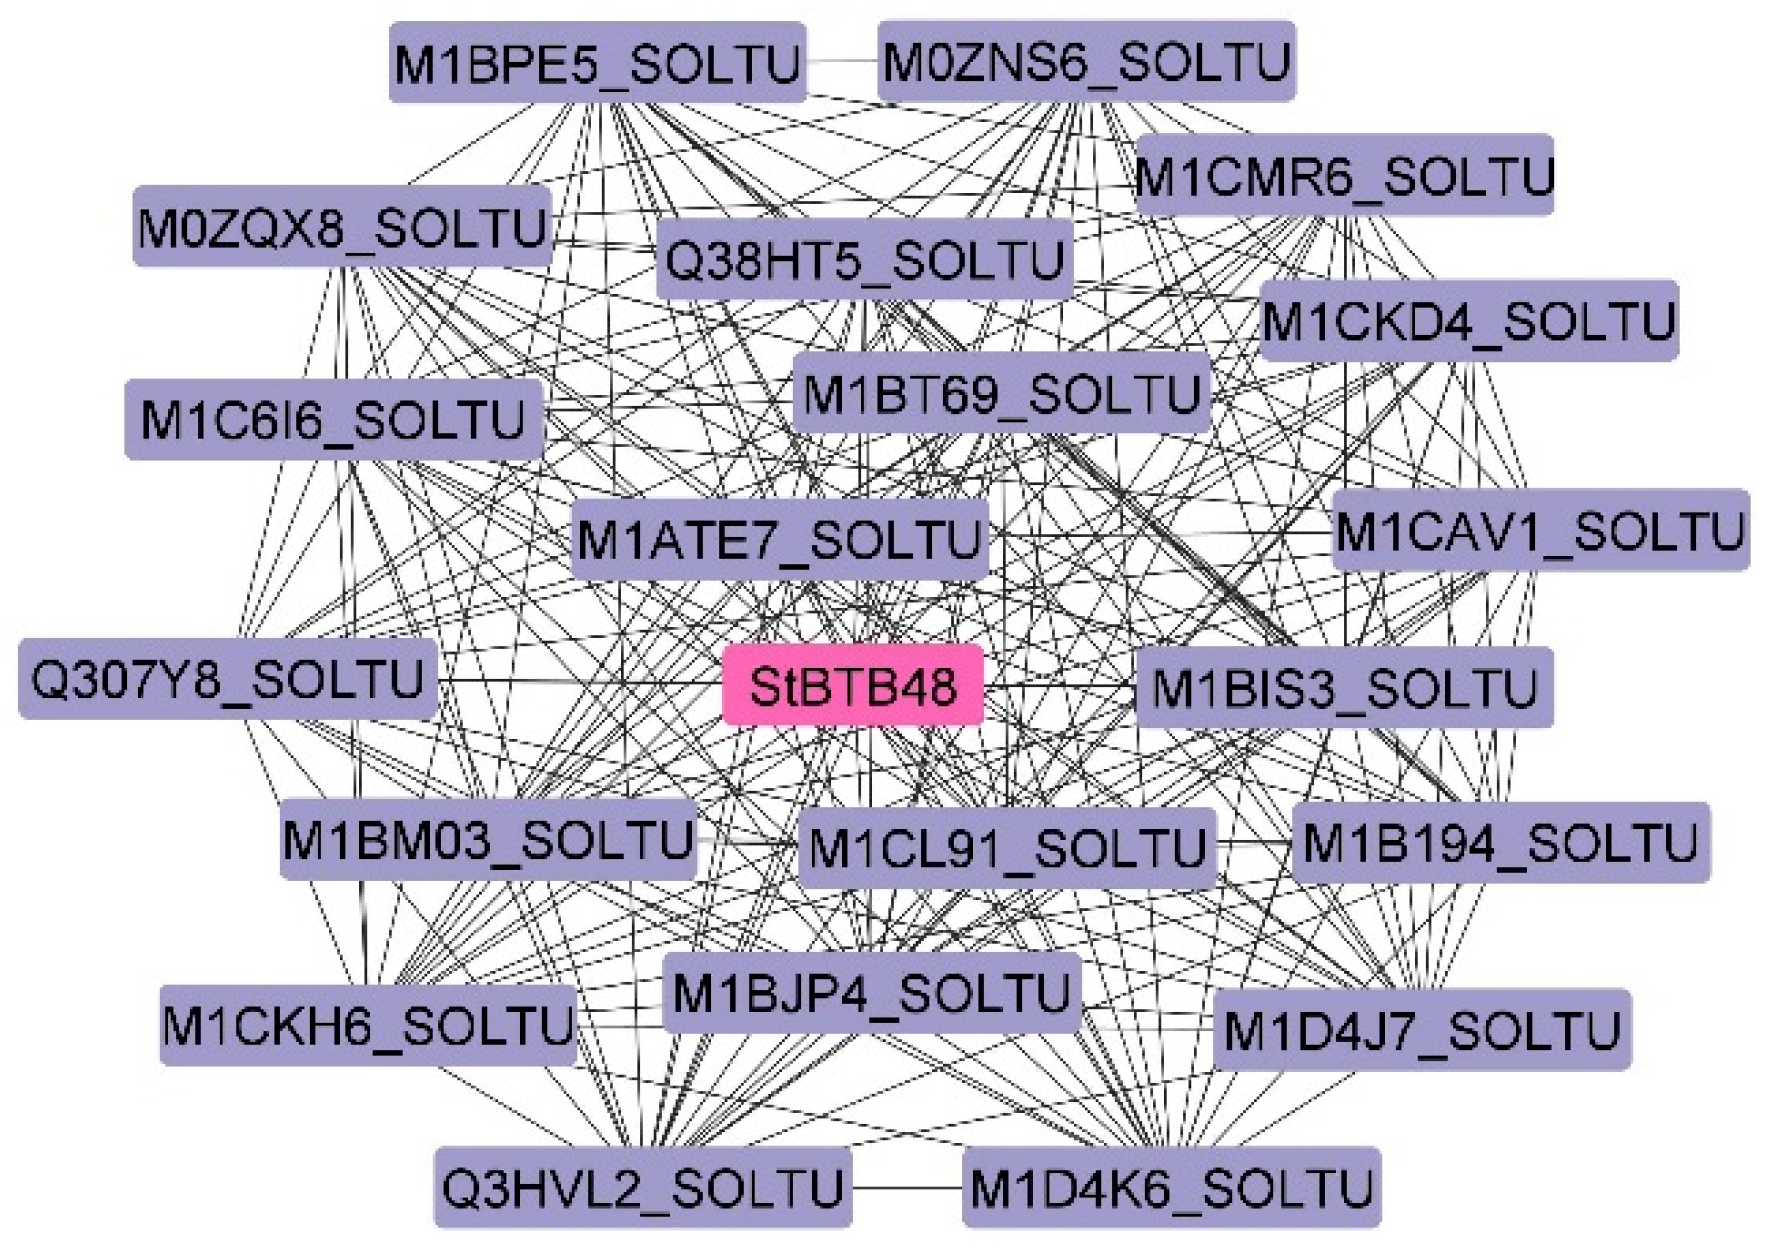
2.7. Protein–Protein Interaction and GO Analysis

The protein sequences of StBTBs were used to create a protein–protein network using the String database v12.0 (https://string-db.org/, accessed on 1 February 2024) with a high confidence score (0.700) and no more than 20 interactors [36]. The network was visualized using Cytoscape v3.9.1 software [37]. Pathway analysis and gene ontology analysis of all StBTBs under all three categories, namely “biological process”, “cellular component”, and “molecular function” were carried out using the OmicsBox2.2.4 software package (https://www.biobam.com/omicsbox, accessed on 31 October 2024).

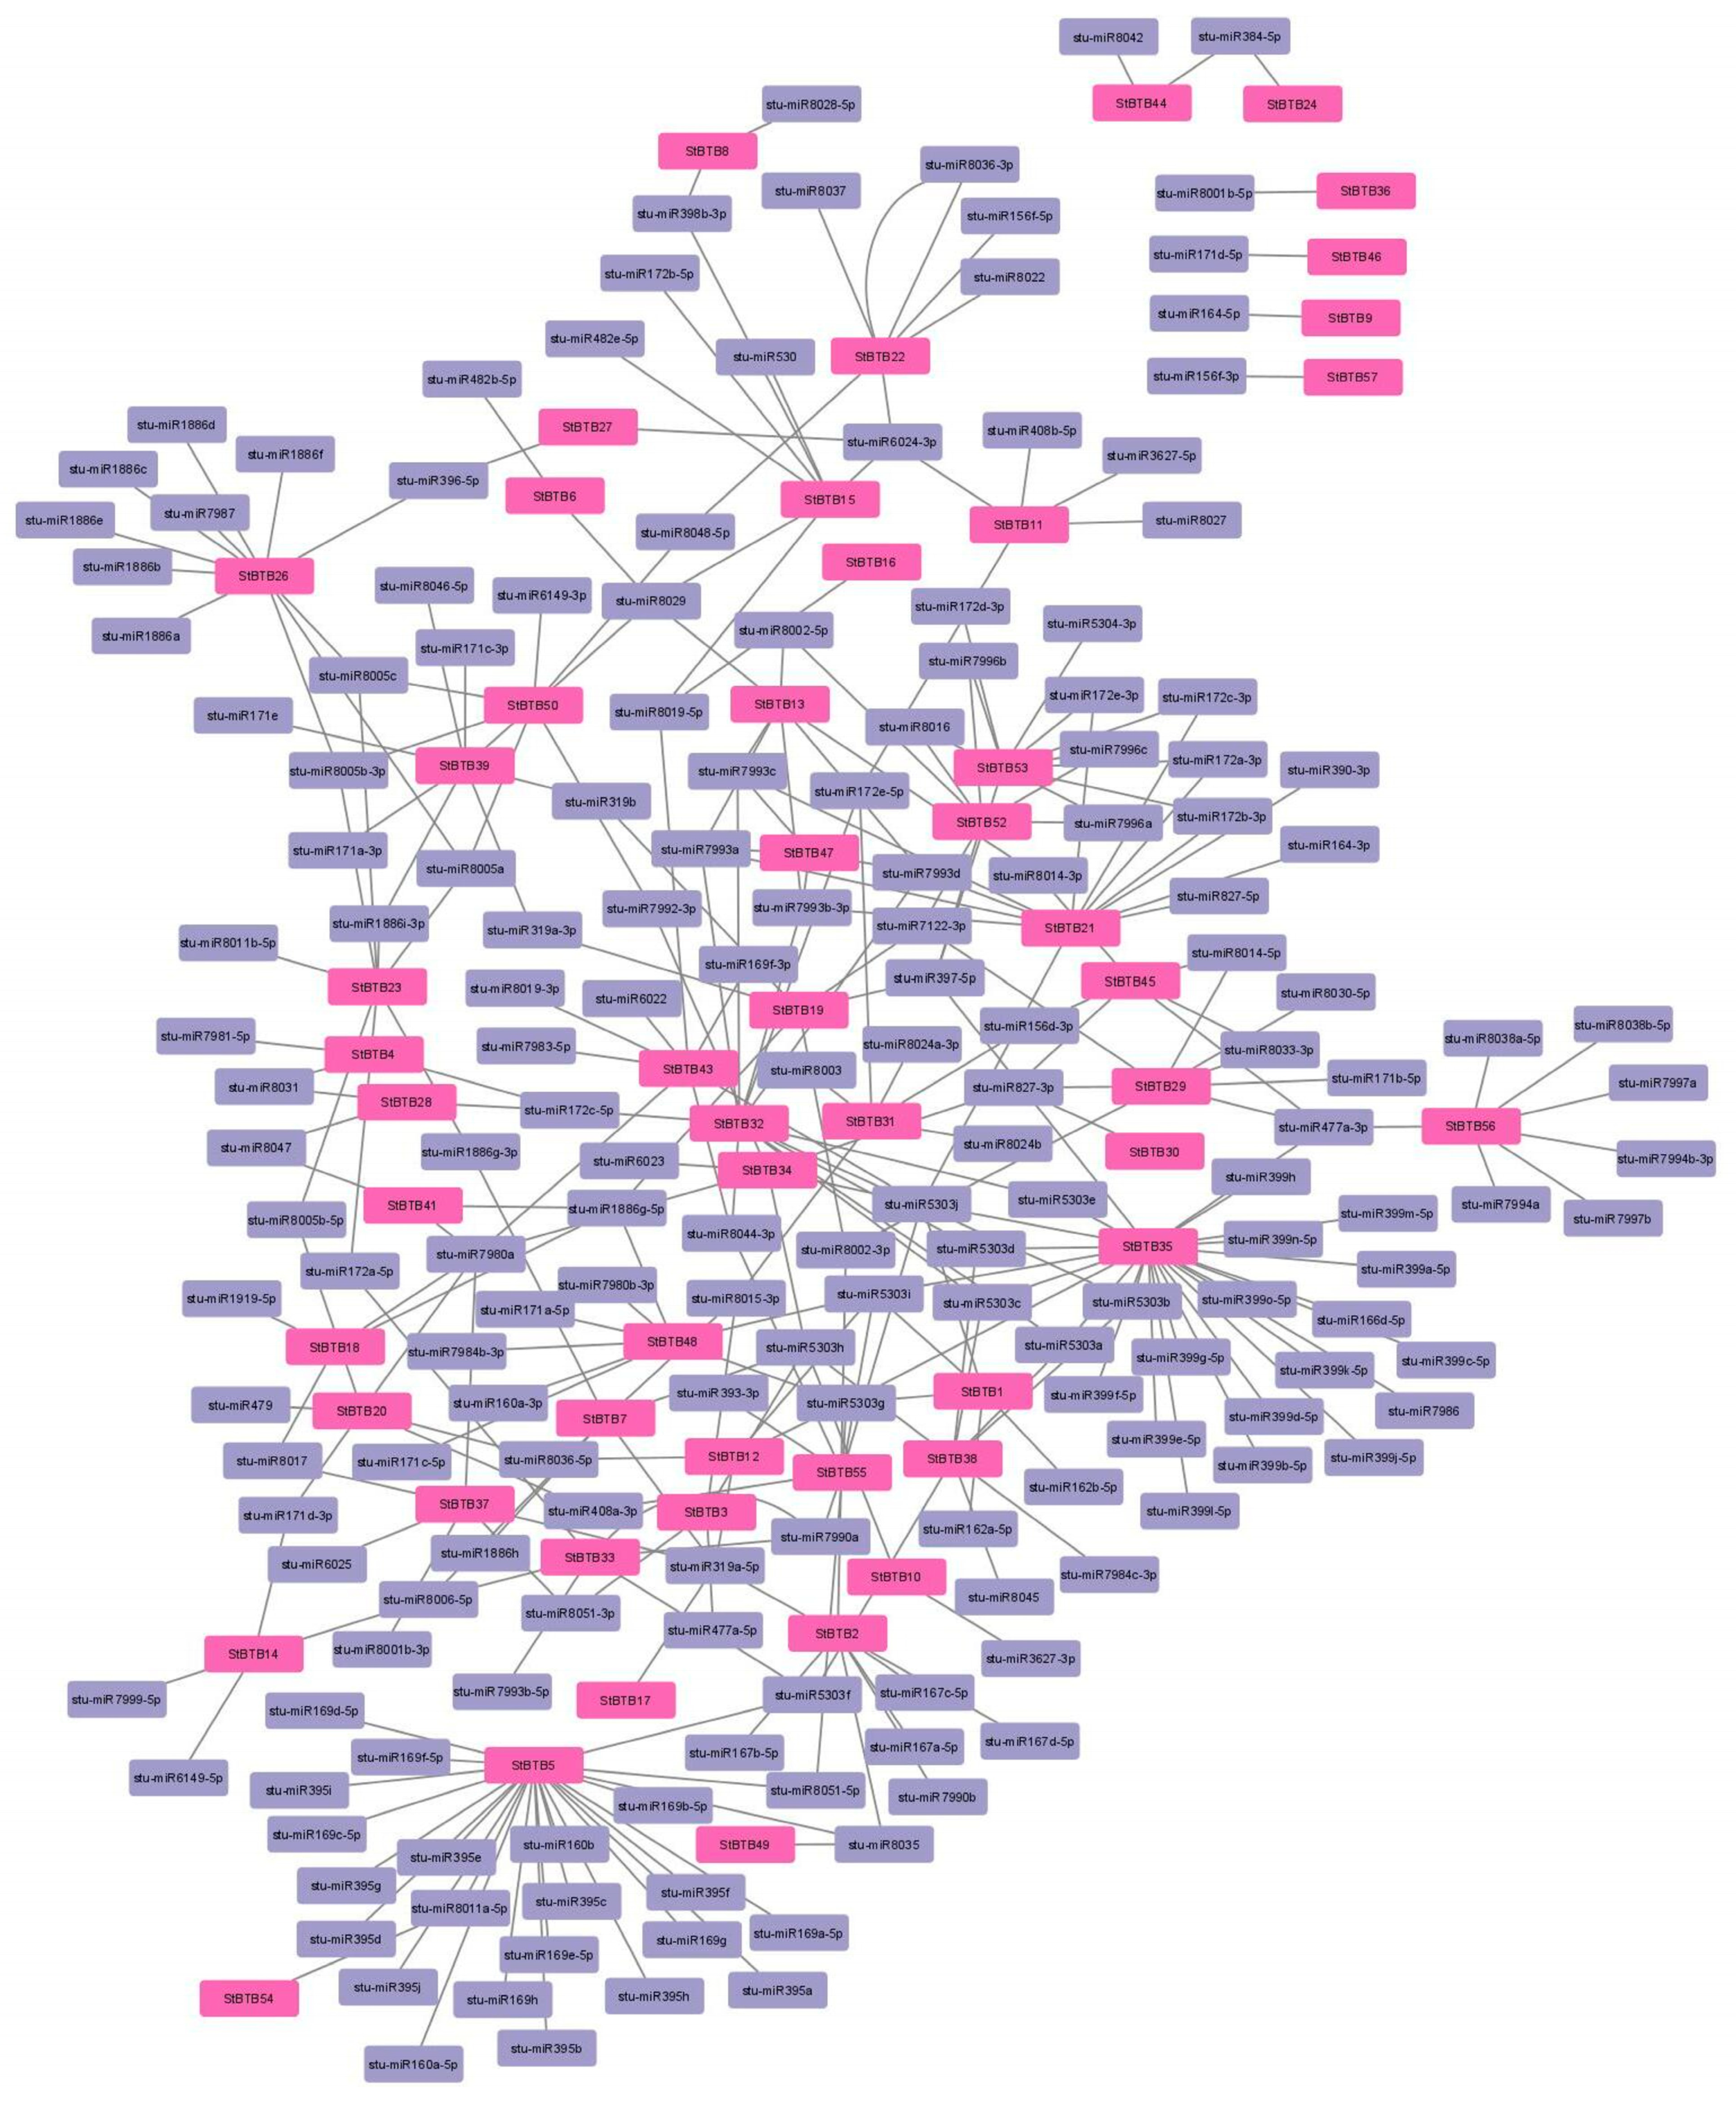
2.8. microRNA Target Site Analysis

The coding sequences of StBTBs were searched against the published miRNAs in the pSRNATarget server (https://www.zhaolab.org/psRNATarget/analysis, accessed on 1 February 2024) to predict the miRNAs targeted by StBTBs [38]. The interactions were visualized using Cytoscape v3.9.1 software [37].

3. Results

3.1. Identification of BTB Genes in Potato and Their Sequence Analysis

An HMM search using PF00651 resulted in 57 putative StBTBs encoding 103 BTB proteins. The proteins with the highest number of amino acid residues were selected for each BTB gene for further analyses. The presence of BTB domains in the protein sequences of these 57 genes was further confirmed using the NCBI-CDD, SMART, and InterproScan databases. These genes were named from StBTB1 to StBTB57 based on their location on the potato chromosomes. The CDS length of StBTBs varied from 441 bp in StBTB30 to 2598 bp in StBTB2, while the amino acid residues varied from 146 in StBTB30 to 865 in StBTB2 (Table 1). The molecular weight of proteins varied from 16.648 kDa in StBTB30 to 94.892 kDa in StBTB2. The theoretical isoelectric point of the proteins ranged from 4.62 in StBTB30 to 9.32 in StBTB13, while the instability index varied from 21.89 in StBTB22 to 62.06 in StBTB26. StBTB5 was found to have the lowest aliphatic index (74.09), while StBTB29 had the highest aliphatic index (113.48). The highest GRAVY (grand average of hydropathicity) value was observed in StBTB29, which had a positive value of 0.125, while the lowest value was found in StBTB9, which had a negative value of 0.564 (Table S1). The subcellular localization analysis revealed that StBTB proteins were majorly found in the nucleus followed by the cytoplasm and chloroplast (Table 1). The secondary structure of most of the StBTB proteins mainly comprised of alpha helices (51.36%) followed by 35.53% random coils, 9.65% extended strands, and 3.46% beta turns (Table S2).

3.2. Chromosomal Mapping and Gene Duplication Analysis

The chromosomal locations and sequences of all StBTBs were retrieved from the Spud database (Table 1) and were mapped on their respective chromosomes (Figure 1). All the StBTBs were observed to be located unevenly on all 12 potato chromosomes. The maximum number of StBTBs (seven genes) were found on chromosome 2, followed by six genes on chromosomes 1 and 6. Chromosomes 7, 9, and 10 contained six genes, while chromosome 8 contained five StBTBs, followed by chromosome 8 with three genes. Chromosomes 3, 4, 11, and 12 contained the least number of StBTBs with two genes each. We observed nine duplicated StBTB gene pairs in potato. Out of the nine gene pairs, StBTB15-StBTB16 and StBTB40-StBTB41 were found to be tandemly duplicated, while the other seven gene pairs (StBTB4-StBTB28, StBTB43-StBTB24, StBTB29-StBTB45, StBTB5-StBTB49, StBTB53-StBTB19, StBTB19-StBTB52, and StBTB1-StBTB55) were found to be segmental duplications (Figure 1). All the duplicated gene pairs had a Ka/Ks ratio of less than one, indicating purifying selection. StBTB43 and StBTB24 showed a high sequence divergence value as their pS (synonymous variation within species) value is greater than 0.75.

3.3. Gene Structure and Conserved Motif Analysis

Intron–exon structure analysis was performed to study the gene structure of StBTBs. Significant variation was observed within StBTBs in terms of both intron length and intron numbers. StBTB48 had the highest number of 18 introns, while four genes (StBTB9, StBTB19, StBTB52, and StBTB53) contained only one intron (Figure 2). In total, 42.1% of StBTBs were found to have three introns. StBTB31 was constituted of the longest intron made up of 8771 bp.
Conserved motif analysis was performed using the sequences of all StBTB proteins (Figure 3). Motif 4 (BTB/POZ) was observed to be conserved throughout all the StBTBs except StBTB21, StBTB30, and StBTB39. Motifs 1, 2, 7, 8, 9, 18, and 20 (NPH3) were found to be distributed across 22 StBTB proteins, while motifs 3, 5, and 12 (POB1-like) were conserved across 30 StBTB proteins, motifs 13 and 14 (TAZ) were conserved across five StBTB proteins, motifs 15 and 16 (NPR5/6) were found to be conserved among six StBTB proteins, motif 6 (MATH/TRAF) was conserved within five StBTB proteins, motifs 10 and 17 (ARM) were seen to be present in 22 StBTB proteins, and motif 11 (AtSIBP1-like) was found in 26 StBTB proteins (Table 2).

3.4. Phylogenetic Analysis

A phylogenetic analysis was performed using 57 StBTB proteins to analyze the evolutionary relationship within the BTB gene family in potato. Phylogenetic tree analysis showed that all the StBTBs were found to be broadly divided into three groups with Group I consisting of the NPR5/6 clade (StBTB11, StBTB19, StBTB31, StBTB33, StBTB35, and StBTB53). Group II consisted of six TAZ members (StBTB13, StBTB 18, StBTB26, StBTB27, StBTB38, and StBTB57), eight BTB proteins (StBTB9, StBTB20, StBTB22, StBTB25, StBTB30, StBTB36, StBTB48, and StBTB54), two ARM proteins (StBTB29 and StBTB45), and five MATH domain-containing proteins (StBTB1, StBTB3, StBTB23, StBTB46, and StBTB55). Group III consisted of six BACK proteins (StBTB5, StBTB39, StBTB40, 41, StBTB49, and StBTB56), one BTB protein (StBTB2), and 22 NPH3 proteins (StBTB4, StBTB6, StBTB7, StBTB8, StBTB10, StBTB12, StBTB14, StBTB15, StBTB16, StBTB17, StBTB21, StBTB24, StBTB28, StBTB32, StBTB34¸ StBTB37, StBTB42¸ StBTB43, StBTB44, StBTB47, StBTB50, and StBTB51) (Figure 4).

3.5. Tissue-Specific Gene Expression Analysis of StBTBs

The expression levels of StBTBs were analyzed in 16 different potato tissues (flower, leaf, petiole, shoot apex, stem, stolon, young tuber, mature tuber, root, stamen, water stressed leaf, tuber pith, tuber peel, whole in vitro plant, tuber sprout, and tuber cortex) (Supplementary File S1). All the StBTBs showed some level of expression in all the tissues, except StBTB40, which showed no expression in any tissues. StBTB21, StBTB28, StBTB41, and StBTB57 also exhibited significantly low expression levels across all tissues. Overall, StBTB26 showed the highest expression levels among all StBTBs, followed by StBTB32. The cumulative highest expression of all StBTBs was observed in the petiole followed by the water-stressed leaf, while the shoot apex and mature tuber exhibited the lowest expression levels. StBTB32 showed the highest expression levels in the whole in vitro plant, followed by StBTB26, which showed the highest expression level in the petiole and water-stressed leaf of potato (Figure 5).

3.6. Expression Profile Analysis under Hormonal and Stress Treatments

The SRA (Sequence Read Archive) data of potato under hormonal treatments (BAP, ABA, IAA, and, GA3), abiotic stress (salt, mannitol, and heat), biotic stress (P. infestans), and SAR elicitors treatment (BABA and BTH) were used to analyze the differential expression levels of StBTBs (Supplementary File S1). StBTB7 and StBTB14 were found to be significantly downregulated under P. infestans infection with a log2fold change of −2.48 and −2.12, respectively. Various StBTBs, namely StBTB16, StBTB22, StBTB28, and StBTB29, were observed to be upregulated under salt stress with log2fold changes of 2.41, 2.79, 2.23, and 6.41, respectively. Under drought stress due to mannitol treatment, StBTB16, StBTB22, and StBTB28 were upregulated with a log2fold change of 2.08, 3.31, and 2.09, respectively, while StBTB23 was downregulated with a log2fold change of −2.45. StBTB17 and StBTB19 were upregulated with log2fold changes of 2.15 and 2.23, and StBTB53 was downregulated with a log2fold change of −3.97. GA3 treatment led to StBTB27 being upregulated with a log2fold change of 3.25 and StBTB7 being downregulated with a log2fold change of −3.84. StBTB17 and StBTB29 were downregulated with a log2fold change of −2.32 and −5.20, while StBTB22 was upregulated with a log2fold change of 2.67 under BAP treatment. StBTB7 and StBTB47 were downregulated with a log2fold change of −4.21 and −7.18, while StBTB27 was upregulated with a log2fold change of 2.93 under ABA treatment. Six StBTBs were observed to be downregulated, while StBTB27 was upregulated under BABA treatment. StBTB6 and StBTB30 were upregulated, while StBTB10, StBTB13, and StBTB18 were downregulated under BTH treatment (Figure 6).

3.7. Protein–Protein Interaction and GO Analysis

StBTB48 was found to be the only BTB protein in potato interacting with various potato proteins such as M1CMR6 and M1BM03 (Ribosomal_L7Ae domain-containing protein); M1BJP4, M1D4J7, and M1CAV1 (Ribosomal_L18e/L15P domain-containing protein); M1BT69 (Ribosomal_L18_c domain-containing protein); M1CL91 (60S ribosomal protein L29); M1D4K6 and M1BIS3 (Ribosomal protein L19); Q3HVL2 (Ribosomal protein L27a-like protein); Q307Y8 (Ribosomal protein L11-like protein); M1BPE5 (40S ribosomal protein S24); M0ZQX8 (40S ribosomal protein S30); and some uncharacterized proteins including M1C6I6, M1B194, M1CKH6, M1CKD4, M0ZNS6, M1ATE7, and Q38HT5, all of which are most likely ribosomal proteins based on the domains present in these proteins (Figure 7).
Gene enrichment analysis revealed that the highest number of StBTBs (26) were involved in protein ubiquitination followed by the response to salicylic acid and hydrogen peroxide in terms of biological processes (Figure S1). In terms of molecular function, six StBTBs each were involved in metal ion binding and calmodulin binding. Sixteen StBTBs were found to be present in the nucleus. Thirty-three StBTBs were found to be involved in various metabolic processes such as nitrogen compound metabolic processes, cellular biosynthetic processes, protein metabolic processes, etc. Twenty-four StBTBs were involved in the response to a stimulus such as immune response, response to stress, response to abiotic and biotic stimuli, cellular response to chemical stimuli, response to endogenous stimuli, response to oxidative stress, etc. (Figure S2). The cellular component revealed that StBTBs were mostly associated with the cytoplasm, followed by the nucleus (Figure S3) (Table S3).
Pathway analysis revealed that 22 StBTBs were involved in peptidoglycan biosynthesis, while 16 StBTBs were involved in the hedgehog signaling pathway and 10 StBTBs were involved in alanine biosynthesis and cysteine degradation pathways.

3.8. microRNA Target Site Analysis

Various StBTBs were found to be targeted by several important miRNAs including 78 miRNA families targeting 53 out of 57 StBTBs (Table S4). Four StBTBs (StBTB25, StBTB40, StBTB42, and StBTB51) were not targeted by any miRNAs. stu-miR5303 targeted 15 StBTBs (StBTB1, StBTB3, StBTB5, StBTB7, StBTB10, StBTB12, StBTB21, StBTB32, StBTB33, StBTB33, StBTB34, StBTB35, StBTB38, StBTB43, and StBTB48). The stu-miR172 family was found to target ten StBTBs (StBTB4, StBTB11, StBTB15, StBTB21, StBTB23, StBTB2831, StBTB32, StBTB33, and StBTB53). StBTB29 was targeted by the highest number of eight miRNA families. Stu-miR1886 and stu-miR1919 both targeted eight StBTBs, while stu-miR7980 targeted seven StBTBs. StBTB15 was found to be targeted by seven stu-miRNA families (Figure 8).

4. Discussion

The present work focused on identifying and characterizing the BTB gene family across the genome of S. tuberosum. As per earlier studies, the number of BTBs identified were 77 in A. thaliana [4], 38 in Solanum lycopersicum [39], and 69 in Vitis vinifera [40]. We identified a total of 57 BTBs in the potato genome. A signification variation in the number of BTBs present in various plants can clearly be seen. All the identified StBTB proteins had at least one BTB/POZ domain. Along with the BTB/POZ domain, many StBTB proteins were found to have several other domains such as NPH3, MATH, BACK, ARM, NPR5/6, and TAZ, all of which are involved in fundamental biological and molecular processes. The majority of the StBTB proteins were located in the nucleus, while a few were also located in the cytoplasm and chloroplast. StBTB2 encoded a protein with the highest number of amino acid residues (865) and the highest molecular weight (94.892 kDa). The genes were unevenly distributed across all 12 chromosomes of potato, with chromosome 2 having the highest number of seven genes, and chromosomes 3, 4, 11, and 12 having only two genes each. Nine StBTB gene pairs were found to be duplicated within the potato genome, out of which two were tandemly duplicated, while the other seven were segmentally duplicated. All the duplicated genes were found to undergo purifying selection. Gene structure analysis revealed no significant pattern of intron–exon organization. The highest number of introns (18) was found in StBTB48, while the lowest number of introns (1) was found in StBTB9, StBTB19, StBTB52, and StBTB53. The longest intron was found in StBTB31 with a length of 8871 bp. Conserved motif analysis revealed the presence of various motifs within StBTB proteins. BTB motifs were found in all the StBTB proteins. In addition to BTB, 22 StBTB proteins were observed to also contain NPH3 motifs, which suggests the role of these proteins in blue light-mediated phototropic responses [41]. The NPR5/6 motif was also found in seven StBTB proteins, indicating their role in leaf formation [42]. Six StBTB proteins constituted BACK motifs, which implies their role in plant ubiquitin degradation. The MATH domain, which is involved in the plant response to abiotic stress [43], was found in five StBTB proteins. The MATH domain-containing proteins within the BTB superfamily serve as substrate-specific adaptors for CULLIN (CUL3)-based ubiquitin E3 ligases, facilitating the targeting of proteins for ubiquitination [44]. Ubiquitin plays a significant role in various aspects such as cell cycle regulation, photomorphogenesis, self-incompatibility, circadian rhythms, flower development, hormonal balance, ecological adaptation, regulation of cell death, and disease resistance across all eukaryotes [45,46,47,48]. Five StBTB proteins (StBTB13, StBTB18, StBTB26, StBTB27, and StBTB38) consisted of the TAZ domain along with the BTB domain, which, in addition to playing a detrimental function in the ABA response, is a key player in a complex signaling network that senses and responds to hormones, stressors, and nutrients [19]. Two StBTB proteins consisted of the ARM domain, which along with the BTB/POZ domain has been shown to affect the stress tolerance of plants, seedling growth, and ABA-regulated gene expression in Arabidopsis [49]. Phylogenetic tree analysis showed that StBTB proteins containing the same domains were present within the same clade. Tissue-specific gene expression levels of all StBTBs were studied using the RNA-seq data of 16 different tissues of potato, namely flower, leaf, petiole, shoot apex, stem, stolon, young tuber, mature tuber, root, stamen, water stressed leaf, tuber pith, tuber peel, whole in vitro plant, tuber sprout, and tuber cortex. It was observed that StBTB40, a BTB/POZ-containing G-protein, did not show any level of expression in any of the aforementioned tissues. Except for this, all StBTBs showed expression in different potato tissues. This is in accordance with other studies that showed the involvement of BTBs in growth and development [16,39,50,51,52,53]. The BTB domain’s significant contribution to plant growth and development is primarily due to its capability to interact with other functional domains, facilitated by the extension regions located at its N- and C-terminals [52]. Another investigation revealed that the BT2 gene enhanced telomerase expression in leaves [54]. StBTB26 (BTB and TAZ domain protein), which is a stress-responsive protein, was observed to show the highest levels of expression across all the tissues. StBTB32 (phototropic-responsive NPH3 family protein), which is involved in cellular protein modification processes, also showed the highest expression levels in the whole in vitro plant. Expression profile analysis revealed the role of various StBTBs in biotic and abiotic stress tolerance. Upon analyzing the SRA data, it was observed that P. infestans infection caused significant downregulation of StBTB7 and StBTB14, both of which contained the NPH3 domain alongside the BTB domain. These results are similar to the downregulation of a BTB domain-containing gene CaBPM4 in response to Phytophthora capsica infection in pepper plants [55]. Overexpressed GmBTB/POZ also led to increased Phytophthora sojae resistance in soybean [56]. Transcriptome data of potato under salt stress showed significant upregulation in the expression of StBTB16, StBTB22, StBTB28, and StBTB29. StBTB16, StBTB22, and StBTB28 were upregulated in response to drought stress in potato plants caused by mannitol treatment. BTB domain-containing genes have been studied and shown to be involved in both salt and drought stress. AtSIBP1, an Arabidopsis BTB protein, was observed to positively regulate the salt stress response in Arabidopsis [19]. In the case of drought stress, MdBT2 is a negative regulator and causes drought sensitivity in apple [57]. On the other hand, IbBT4, a sweet potato BTB gene, confers drought tolerance when overexpressed in Arabidopsis [16]. When silenced, CaBPM4 leads to improved tolerance under drought and salt stress exposure in pepper [55]. StBTB7 (NPH3) was significantly downregulated, while StBTB27 (TAZ) was significantly upregulated in response to both GA3 and ABA. Both these genes might prove to have a substantial role in hormone signaling and hence stress tolerance mechanisms. BT2, a BTB protein, has been shown to suppress ABA signaling in Arabidopsis [17]. It was reported that GMPOZ, a nuclear localized BTB/POZ domain protein, functioned as a repressor and activator of ABA- and GA-regulated genes in barley [58]. It was observed that BTB-MATH proteins have the capability to engage with homeodomain-leucine zipper transcription factors like ATHB6, thereby modulating phytohormone ABA responses and responses to abiotic stresses [44]. Studies showed that GA inhibited and induced SlBTB12 and SlBTB18, respectively, in tomato plants [39]. It has been suggested that BT2 holds a central role within a complex signaling network that detects, integrates, and reacts to numerous, occasionally conflicting, signals. The hypothesis suggests its involvement in the formation of multiprotein complexes. Should the complex necessitate CULLIN3 or a comparable protein, it could potentially act as a ubiquitin ligase, marking specific proteins for degradation [17]. Several StBTBs were also found to be involved in the response to hydrogen peroxide, which might also explain their role in abiotic stress tolerance as MdBT2-overexpressed plants exhibited increased accumulation of H2O2, consequently leading to decreased drought stress tolerance [57]. Protein–protein interaction studies revealed no interaction among the BTB proteins of potato. However, StBTB48 was observed to be interacting with 20 non-BTB proteins of potato. Interestingly, StBTB48 does not contain any interacting domain other than BTB/POZ. All of the 20 interacting proteins were ribosomal proteins, which suggests the potential involvement of StBTBs in translation regulation, cellular signaling, and cellular stress response.
All StBTBs except StBTB25, StBTB40, StBTB42, and StBTB51 were targeted by several miRNAs. Fifteen StBTBs were targeted by stu-miR5303, which potentially targets metabolic enzymes and proteins responsive to abiotic stress [59]. Ten StBTBs were targeted by stu-miR172, which plays a role in the tuberization process by regulating long-distance signals and targeting RAP1 mRNA and is involved in graft transmissible movement through the conductive vascular tissues [60]. StBTB29 was observed to be targeted by eight different stu-miRNA families, which play various roles in plant development [61]. stu-miR156, which was first discovered to respond to cold stress in potato seedlings, plays various vital roles in the tuberization process, abiotic stress tolerance and controlling leaf development, apical dominance, and floral transition and development [62]. stu-miR156 targeted four StBTBs including StBTB22, StBTB31, StBTB45, and StBTB57. Based on these results, potential StBTB gene candidates can be selected for further investigations regarding the stress mechanisms, hormone signaling pathways, and growth and development processes in potato and other plants.

5. Conclusions

In this study, we identified and characterized 57 StBTBs in the genome of S. tuberosum for the first time. Domain and motif analysis of the StBTB proteins revealed interaction of the BTB domain with other domains, namely NPH3, NPR5/6, TAZ, MATH, BACK, and ARM. The majority of StBTBs showed tissue-specific expression, indicating their involvement in plant growth and development. Through differential expression studies, we predicted the role of various StBTBs in abiotic and biotic stresses and hormone signaling. Protein–protein interaction studies showed interaction of StBTB48 with ribosomal proteins, suggesting its role in translational regulation. We found 53 StBTBs were targeted by several miRNAs, indicating the role of miRNAs in regulating the expression of BTB domain-containing proteins. Our research introduces the initial comprehensive framework regarding the potato BTB domain-containing protein gene family, offering a foundational platform for subsequent in-depth investigations into the biological roles of the BTB domain in potato growth, development, hormone signaling, and responses to both abiotic and biotic stresses.

Supplementary Materials

The following supporting information can be downloaded at: https://www.mdpi.com/article/10.3390/agriculture14050771/s1, Table S1: Physicochemical properties of StBTB proteins; Table S2: Secondary structure composition of StBTB proteins; Table S3: GO IDs and names of StBTBs; Table S4: miRNAs targeting StBTBs and their mode of inhibition; Figure S1: Pie chart depicting biological process sequence distribution of StBTBs; Figure S2: Pie chart depicting molecular function sequence distribution of StBTBs; Figure S3: Pie chart depicting cellular component sequence distribution of StBTBs; Supplementary File S1: FPKM values for differential expression analysis. Sheet 1 shows data related to various stresses and sheet 2 for various developmental stages.

Author Contributions

A.: Data curation, formal analysis, methodology, roles/writing—original draft. A.K.: Software, validation. H.C.: Investigation, validation. S.K.U.: Data curation, writing—review and editing, supervision. K.S.: Conceptualization, funding acquisition, project administration, writing—review and editing. All authors have read and agreed to the published version of the manuscript.

Funding

The research was funded by Department of Biotechnology (DBT), India.

Data Availability Statement

The original contributions presented in the study are included in the Supplementary Materials, further inquiries can be directed to the corresponding author.

Conflicts of Interest

The authors declare no conflicts of interest.

References

  1. Bardwell, V.J.; Treisman, R. The POZ domain: A conserved protein-protein interaction motif. Genes Dev. 1994, 8, 1664–1677. [Google Scholar] [CrossRef] [PubMed]
  2. Zollman, S.; Godt, D.; Privé, G.G.; Couderc, J.L.; Laski, F.A. The BTB domain, found primarily in zinc finger proteins, defines an evolutionarily conserved family that includes several developmentally regulated genes in Drosophila. Proc. Natl. Acad. Sci. USA 1994, 91, 10717–10721. [Google Scholar] [CrossRef]
  3. Perez-Torrado, R.; Yamada, D.; Defossez, P.A. Born to bind: The BTB protein–protein interaction domain. Bioessays 2006, 28, 1194–1202. [Google Scholar] [CrossRef] [PubMed]
  4. Stogios, P.J.; Downs, G.S.; Jauhal, J.J.; Nandra, S.K.; Privé, G.G. Sequence and structural analysis of BTB domain proteins. Genome Biol. 2005, 6, R82. [Google Scholar] [CrossRef] [PubMed]
  5. Ahmad, K.F.; Engel, C.K.; Privé, G.G. Crystal structure of the BTB domain from PLZF. Proc. Natl. Acad. Sci. USA 1998, 95, 12123–12128. [Google Scholar] [CrossRef] [PubMed]
  6. Bonchuk, A.; Balagurov, K.; Georgiev, P. BTB domains: A structural view of evolution, multimerization, and protein–protein interactions. Bioessays 2023, 45, 2200179. [Google Scholar] [CrossRef] [PubMed]
  7. Nguyen, H.C.; Wang, W.; Xiong, Y. Cullin-RING E3 ubiquitin ligases: Bridges to destruction. Macromol. Protein Complexes Struct. Funct. 2017, 83, 323–347. [Google Scholar]
  8. Chaharbakhshi, E.; Jemc, J.C. Broad-complex, tramtrack, and bric-à-brac (BTB) proteins: Critical regulators of development. Genesis 2016, 54, 505–518. [Google Scholar] [CrossRef] [PubMed]
  9. Shalmani, A.; Ullah, U.; Muhammad, I.; Zhang, D.; Sharif, R.; Jia, P.; Saleem, N.; Gul, N.; Rakhmanova, A.; Tahir, M.M.; et al. The TAZ domain-containing proteins play important role in the heavy metals stress biology in plants. Environ. Res. 2021, 197, 111030. [Google Scholar] [CrossRef] [PubMed]
  10. Araus, V.; Vidal, E.A.; Puelma, T.; Alamos, S.; Mieulet, D.; Guiderdoni, E.; Gutiérrez, R.A. Members of BTB gene family of scaffold proteins suppress nitrate uptake and nitrogen use efficiency. Plant Physiol. 2016, 171, 1523–1532. [Google Scholar]
  11. Ahmad, K.F.; Melnick, A.; Lax, S.; Bouchard, D.; Liu, J.; Kiang, C.L.; Mayer, S.; Takahashi, S.; Licht, J.D.; Privé, G.G. Mechanism of SMRT corepressor recruitment by the BCL6 BTB domain. Mol. Cell 2003, 12, 1551–1564. [Google Scholar] [CrossRef] [PubMed]
  12. Siggs, O.; Beutler, B. The BTB-ZF transcription factors. Cell Cycle 2012, 11, 3358–3369. [Google Scholar] [CrossRef] [PubMed]
  13. Ito, H.; Sato, K.; Yamamoto, D. Sex-switching of the Drosophila brain by two antagonistic chromatin factors. Fly 2013, 7, 87–91. [Google Scholar] [CrossRef] [PubMed]
  14. Lim, J.H. Zinc finger and BTB domain-containing protein 3 is essential for the growth of cancer cells. BMB Rep. 2014, 47, 405. [Google Scholar] [CrossRef] [PubMed]
  15. Geyer, R.; Wee, S.; Anderson, S.; Yates, J.; Wolf, D.A. BTB/POZ domain proteins are putative substrate adaptors for cullin 3 ubiquitin ligases. Mol. Cell 2003, 12, 783–790. [Google Scholar] [CrossRef] [PubMed]
  16. Robert, H.S.; Quint, A.; Brand, D.; Vivian-Smith, A.; Offringa, R. BTB and TAZ domain scaffold proteins perform a crucial function in Arabidopsis development. Plant J. 2009, 58, 109–121. [Google Scholar] [CrossRef] [PubMed]
  17. Mandadi, K.K.; Misra, A.; Ren, S.; McKnight, T.D. BT2, a BTB protein, mediates multiple responses to nutrients, stresses, and hormones in Arabidopsis. Plant Physiol. 2009, 150, 1930–1939. [Google Scholar] [CrossRef]
  18. Zhou, Y.; Zhai, H.; He, S.; Zhu, H.; Gao, S.; Xing, S.; Wei, Z.; Zhao, N.; Liu, Q. The sweetpotato BTB-TAZ protein gene, IbBT4, enhances drought tolerance in transgenic Arabidopsis. Front. Plant Sci. 2020, 11, 877. [Google Scholar] [CrossRef] [PubMed]
  19. Wan, X.; Peng, L.; Xiong, J.; Li, X.; Wang, J.; Li, X.; Yang, Y. AtSIBP1, a novel BTB domain-containing protein, positively regulates salt signaling in Arabidopsis thaliana. Plants 2019, 8, 573. [Google Scholar] [CrossRef]
  20. Cao, H.; Li, X.; Dong, X. Generation of broad-spectrum disease resistance by overexpression of an essential regulatory gene in systemic acquired resistance. Proc. Natl. Acad. Sci. USA 1998, 95, 6531–6536. [Google Scholar] [CrossRef]
  21. Zhao, M.; Ge, Y.; Xu, Z.; Ouyang, X.; Jia, Y.; Liu, J.; Zhang, M.; An, Y. A BTB/POZ domain-containing protein negatively regulates plant immunity in Nicotiana benthamiana. Biochem. Biophys. Res. Commun. 2022, 600, 54–59. [Google Scholar] [CrossRef]
  22. Finn, R.D.; Clements, J.; Eddy, S.R. HMMER web server: Interactive sequence similarity searching. Nucleic Acids Res. 2011, 39, W29–W37. [Google Scholar] [CrossRef]
  23. Lu, S.; Wang, J.; Chitsaz, F.; Derbyshire, M.K.; Geer, R.C.; Gonzales, N.R.; Gwadz, M.; Hurwitz, D.I.; Marchler, G.H.; Song, J.S.; et al. CDD/SPARCLE: The conserved domain database in 2020. Nucleic Acids Res. 2020, 48, D265–D268. [Google Scholar] [CrossRef]
  24. Paysan-Lafosse, T.; Blum, M.; Chuguransky, S.; Grego, T.; Pinto, B.L.; Salazar, G.A.; Bileschi, M.L.; Bork, P.; Bridge, A.; Colwell, L.; et al. InterPro in 2022. Nucleic Acids Res. 2023, 51, D418–D427. [Google Scholar] [CrossRef] [PubMed]
  25. Letunic, I.; Khedkar, S.; Bork, P. SMART: Recent updates, new developments and status in 2020. Nucleic Acids Res. 2021, 49, D458–D460. [Google Scholar] [CrossRef]
  26. Gasteiger, E.; Hoogland, C.; Gattiker, A.; Duvaud, S.E.; Wilkins, M.R.; Appel, R.D.; Bairoch, A. Protein Identification and Analysis Tools on the ExPASy Server; Humana Press: Totowa, NJ, USA, 2005; pp. 571–607. [Google Scholar]
  27. Horton, P.; Park, K.J.; Obayashi, T.; Fujita, N.; Harada, H.; Adams-Collier, C.J.; Nakai, K. WoLF PSORT: Protein localization predictor. Nucleic Acids Res. 2007, 35, W585–W587. [Google Scholar] [CrossRef]
  28. Geourjon, C.; Deleage, G. SOPMA: Significant improvements in protein secondary structure prediction by consensus prediction from multiple alignments. Bioinformatics 1995, 11, 681–684. [Google Scholar] [CrossRef] [PubMed]
  29. Shumayla, S.S.; Kumar, R.; Mendu, V.; Singh, K.; Upadhyay, S.K. Genomic dissection and expression profiling revealed functional divergence in Triticum aestivum leucine rich repeat receptor like kinases (TaLRRKs). Front. Plant Sci. 2016, 7, 1374. [Google Scholar] [CrossRef]
  30. Chen, C.; Chen, H.; Zhang, Y.; Thomas, H.R.; Frank, M.H.; He, Y.; Xia, R. TBtools: An integrative toolkit developed for interactive analyses of big biological data. Mol. Plant 2020, 13, 1194–1202. [Google Scholar] [CrossRef] [PubMed]
  31. Hu, B.; Jin, J.; Guo, A.Y.; Zhang, H.; Luo, J.; Gao, G. GSDS 2.0: An upgraded gene feature visualization server. Bioinformatics 2015, 31, 1296–1297. [Google Scholar] [CrossRef]
  32. Bailey, T.L.; Johnson, J.; Grant, C.E.; Noble, W.S. The MEME suite. Nucleic Acids Res. 2015, 43, W39–W49. [Google Scholar] [CrossRef] [PubMed]
  33. Edgar, R.C. MUSCLE: Multiple sequence alignment with high accuracy and high throughput. Nucleic Acids Res. 2004, 32, 1792–1797. [Google Scholar] [CrossRef] [PubMed]
  34. Kumar, S.; Stecher, G.; Li, M.; Knyaz, C.; Tamura, K. MEGA X: Molecular evolutionary genetics analysis across computing platforms. Mol. Biol. Evol. 2018, 35, 1547. [Google Scholar] [CrossRef] [PubMed]
  35. Letunic, I.; Bork, P. Interactive Tree Of Life (iTOL) v5: An online tool for phylogenetic tree display and annotation. Nucleic Acids Res. 2021, 49, W293–W296. [Google Scholar] [CrossRef] [PubMed]
  36. Szklarczyk, D.; Kirsch, R.; Koutrouli, M.; Nastou, K.; Mehryary, F.; Hachilif, R.; Gable, A.L.; Fang, T.; Doncheva, N.T.; Pyysalo, S.; et al. The STRING database in 2023: Protein–protein association networks and functional enrichment analyses for any sequenced genome of interest. Nucleic Acids Res. 2023, 51, D638–D646. [Google Scholar] [CrossRef] [PubMed]
  37. Shannon, P.; Markiel, A.; Ozier, O.; Baliga, N.S.; Wang, J.T.; Ramage, D.; Amin, N.; Schwikowski, B.; Ideker, T. Cytoscape: A software environment for integrated models of biomolecular interaction networks. Genome Res. 2003, 13, 2498–2504. [Google Scholar] [CrossRef] [PubMed]
  38. Dai, X.; Zhao, P.X. psRNATarget: A plant small RNA target analysis server. Nucleic Acids Res. 2011, 39, W155–W159. [Google Scholar] [CrossRef] [PubMed]
  39. Li, J.; Su, X.; Wang, Y.; Yang, W.; Pan, Y.; Su, C.; Zhang, X. Genome-wide identification and expression analysis of the BTB domain-containing protein gene family in tomato. Genes Genom. 2018, 40, 1–15. [Google Scholar] [CrossRef] [PubMed]
  40. Goyal, N.; Bhuria, M.; Verma, D.; Garewal, N.; Singh, K. Genome-Wide Identification of BTB Domain-Containing Gene Family in Grapevine (Vitis vinifera L.). Agriculture 2023, 13, 252. [Google Scholar] [CrossRef]
  41. Motchoulski, A.; Liscum, E. Arabidopsis NPH3: A NPH1 photoreceptor-interacting protein essential for phototropism. Science 1999, 286, 961–964. [Google Scholar] [CrossRef]
  42. Jun, J.H.; Ha, C.M.; Fletcher, J.C. BLADE-ON-PETIOLE1 coordinates organ determinacy and axial polarity in Arabidopsis by directly activating ASYMMETRIC LEAVES2. Plant Cell 2010, 22, 62–76. [Google Scholar] [CrossRef] [PubMed]
  43. Kushwaha, H.R.; Joshi, R.; Pareek, A.; Singla-Pareek, S.L. MATH-domain family shows response toward abiotic stress in Arabidopsis and rice. Front. Plant Sci. 2016, 7, 923. [Google Scholar] [CrossRef] [PubMed]
  44. Weber, H.; Bernhardt, A.; Dieterle, M.; Hano, P.; Mutlu, A.; Estelle, M.; Genschik, P.; Hellmann, H. Arabidopsis AtCUL3a and AtCUL3b form complexes with members of the BTB/POZ-MATH protein family. Plant Physiol. 2005, 137, 83–93. [Google Scholar] [CrossRef] [PubMed]
  45. Gingerich, D.J.; Hanada, K.; Shiu, S.H.; Vierstra, R.D. Large-scale, lineage-specific expansion of a bric-à-brac/tramtrack/broad complex ubiquitin-ligase gene family in rice. Plant Cell 2007, 19, 2329–2348. [Google Scholar] [CrossRef] [PubMed]
  46. Zapata, J.M.; Martínez-García, V.; Lefebvre, S. Phylogeny of the TRAF/MATH domain. In TNF Receptor Associated Factors (TRAFs); Springer: Berlin/Heidelberg, Germany, 2007; pp. 1–24. [Google Scholar]
  47. Qi, P.; Yan, H.; PeiFen, D.; QingXuan, X.; Ying, R.; ChunLin, L. Construction of SSH library with different stages of seeds development in Brassica napus L. Acta Agron. Sin. 2009, 35, 1576–1583. [Google Scholar]
  48. Zhao, L.; Huang, Y.; Hu, Y.; He, X.; Shen, W.; Liu, C.; Ruan, Y. Phylogenetic Analysis of Brassica rapa MATH-Domain Proteins. Curr. Genom. 2013, 14, 214–223. [Google Scholar] [CrossRef] [PubMed]
  49. Kim, S.Y.; Choi, H.I.; Korea Kumho Petrochemical Co., Ltd. Nucleic Acid Molecule Encoding an Armadillo Repeat Protein, Aria and a Method Utilizing Aria to Generate Salt Tolerant Plants. U.S. Patent 7,049,482, 3 May 2006. [Google Scholar]
  50. Juranić, M.; Srilunchang, K.O.; Krohn, N.G.; Leljak-Levanić, D.; Sprunck, S.; Dresselhaus, T. Germline-specific MATH-BTB substrate adaptor MAB1 regulates spindle length and nuclei identity in maize. Plant Cell 2012, 24, 4974–4991. [Google Scholar] [CrossRef] [PubMed]
  51. Gingerich, D.J.; Gagne, J.M.; Salter, D.W.; Hellmann, H.; Estelle, M.; Ma, L.; Vierstra, R.D. Cullins 3a and 3b assemble with members of the broad complex/ tramtrack/ bric-à-brac (BTB) protein family to form essential ubiquitin-protein ligases (E3s) in Arabidopsis. J. Biol. Chem. 2005, 280, 18810–18821. [Google Scholar] [CrossRef] [PubMed]
  52. Shalmani, A.; Huang, Y.B.; Chen, Y.B.; Muhammad, I.; Li, B.B.; Ullah, U.; Jing, X.Q.; Bhanbhro, N.; Liu, W.T.; Li, W.Q.; et al. The highly interactive BTB domain targeting other functional domains to diversify the function of BTB proteins in rice growth and development. Int. J. Biol. Macromol. 2021, 192, 1311–1324. [Google Scholar] [CrossRef] [PubMed]
  53. Juranić, M.; Dresselhaus, T. Phylogenetic analysis of the expansion of the MATH-BTB gene family in the grasses. Plant Signal Behav. 2014, 9, e28242. [Google Scholar] [CrossRef]
  54. Ren, S.; Mandadi, K.K.; Boedeker, A.L.; Rathore, K.S.; McKnight, T.D. Regulation of telomerase in Arabidopsis by BT2, an apparent target of TELOMERASE ACTIVATOR1. Plant Cell 2007, 19, 23–31. [Google Scholar] [CrossRef] [PubMed]
  55. He, Y.M.; Liu, K.K.; Zhang, H.X.; Cheng, G.X.; Ali, M.; Ul Haq, S.; Wei, A.M.; Gong, Z.H. Contribution of CaBPM4, a BTB domain–containing gene, to the response of pepper to Phytophthora capsici infection and abiotic stresses. Agronomy 2019, 9, 417. [Google Scholar] [CrossRef]
  56. Zhang, C.; Gao, H.; Li, R.; Han, D.; Wang, L.; Wu, J.; Xu, P.; Zhang, S. GmBTB/POZ, a novel BTB/POZ domain-containing nuclear protein, positively regulates the response of soybean to Phytophthora sojae infection. Mol. Plant Pathol. 2019, 20, 78–91. [Google Scholar] [CrossRef] [PubMed]
  57. Ji, X.L.; Li, H.L.; Qiao, Z.W.; Zhang, J.C.; Sun, W.J.; Wang, C.K.; Yang, K.; You, C.X.; Hao, Y.J. The BTB-TAZ protein MdBT2 negatively regulates the drought stress response by interacting with the transcription factor MdNAC143 in apple. Plant Sci. 2020, 301, 110689. [Google Scholar] [CrossRef] [PubMed]
  58. Woodger, F.J.; Jacobsen, J.V.; Gubler, F. GMPOZ, a BTB/POZ domain nuclear protein, is a regulator of hormone responsive gene expression in barley aleurone. Plant Cell Physiol. 2004, 45, 945–950. [Google Scholar] [CrossRef] [PubMed]
  59. Gu, M.; Liu, W.; Meng, Q.; Zhang, W.; Chen, A.; Sun, S.; Xu, G. Identification of microRNAs in six solanaceous plants and their potential link with phosphate and mycorrhizal signaling. J. Integr. Plant Biol. 2014, 56, 1164–1178. [Google Scholar] [CrossRef] [PubMed]
  60. Martin, A.; Adam, H.; Díaz-Mendoza, M.; Zurczak, M.; Gonzalez-Schain, N.D.; Suarez-Lopez, P. Graft-transmissible induction of potato tuberization by the microRNA miR172. Development 2009, 136, 2873–2881. [Google Scholar] [CrossRef]
  61. Pei, L.L.; Zhang, L.L.; Liu, X.; Jiang, J. Role of microRNA miR171 in plant development. PeerJ 2023, 11, e15632. [Google Scholar] [CrossRef]
  62. Zhang, F.; Yang, J.; Zhang, N.; Wu, J.; Si, H. Roles of microRNAs in abiotic stress response and characteristics regulation of plant. Front. Plant Sci. 2022, 13, 919243. [Google Scholar] [CrossRef]
Figure 1. Distribution of BTB genes on potato chromosomes. Chromosome numbers are shown at the left of each bar with StBTBs on the right side represented in blue color. The vertical scale represents the size of chromosomes in megabases (Mb). The brown lines represent duplicated StBTBs.
Agriculture 14 00771 g001
Figure 2. Intron–exon structural organization of all StBTBs.
Agriculture 14 00771 g002
Figure 3. Distribution of 20 different motifs conserved across StBTB proteins.
Agriculture 14 00771 g003
Figure 4. Phylogenetic tree showing the evolutionary relationship among StBTB proteins.
Agriculture 14 00771 g004
Figure 5. Heat map showing differential expression profiles of StBTBs in different potato tissues.
Agriculture 14 00771 g005
Figure 6. Heat maps showing differential expression of StBTBs under the treatment of salt, mannitol, heat, IAA, GA3, BAP, ABA, BABA, BTH, and P. infestans. (FPKM data for same have been provided in Supplementary File S1).
Agriculture 14 00771 g006
Figure 7. Protein–protein interaction network of StBTB proteins with other potato proteins with a high confidence score of 0.700 using String database.
Agriculture 14 00771 g007
Figure 8. Interaction network of S. tuberosum miRNAs with their target StBTBs.
Agriculture 14 00771 g008
Table 1. Chromosomal location, CDS length, AA residues, and subcellular localization of BTB genes in potato.
Gene NameSpudDB Accession NumberChromosomal LocationCDS LengthAA LengthSubcellular Localization
StBTB1Soltu.DM.01G005950.1 http://spuddb.uga.edu/cgi-bin/annotation_report.cgi?orf=Soltu.DM.01G005950.1, (accessed on 12 October 2023)1:6212257–62197171218405Cytoplasm
StBTB2Soltu.DM.01G023290.1 http://spuddb.uga.edu/cgi-bin/annotation_report.cgi?orf=Soltu.DM.01G023290.1, (accessed on 12 October 2023)1:62115639–621259612598865Nucleus
StBTB3Soltu.DM.01G023810.1 http://spuddb.uga.edu/cgi-bin/annotation_report.cgi?orf=Soltu.DM.01G023290.1, (accessed on 12 October 2023)1:62789505–627988201224407Chloroplast
StBTB4Soltu.DM.01G029170.1 http://spuddb.uga.edu/cgi-bin/annotation_report.cgi?orf=Soltu.DM.01G029170.1, (accessed on 12 October 2023)1:68879361–688772841725574Chloroplast
StBTB5Soltu.DM.01G034510.1 http://spuddb.uga.edu/cgi-bin/annotation_report.cgi?orf=Soltu.DM.01G034510.1, (accessed on 12 October 2023)1:74078735–740836921659552Nucleus
StBTB6Soltu.DM.01G038390.1 http://spuddb.uga.edu/cgi-bin/annotation_report.cgi?orf=Soltu.DM.01G038390.1, (accessed on 12 October 2023)1:77301342–773034141665554Nucleus
StBTB7Soltu.DM.01G046570.1 http://spuddb.uga.edu/cgi-bin/annotation_report.cgi?orf=Soltu.DM.01G046570.1, (accessed on 12 October 2023)1:84079985–840866871881626Nucleus
StBTB8Soltu.DM.02G002620.1 http://spuddb.uga.edu/cgi-bin/annotation_report.cgi?orf=Soltu (accessed on 12 October 2023)2:11879293–118749801890629Nucleus
StBTB9Soltu.DM.02G003900.1 http://spuddb.uga.edu/cgi-bin/annotation_report.cgi?orf=Soltu.DM.02G003900.1, (accessed on 12 October 2023)2:15605796–15599933840279Peroxisome
StBTB10Soltu.DM.02G007630.1 http://spuddb.uga.edu/cgi-bin/annotation_report.cgi?orf=Soltu.DM.02G007630.1, (accessed on 12 October 2023)2:21886913–218828881275424Cytoplasm
StBTB11Soltu.DM.02G012330.1 http://spuddb.uga.edu/cgi-bin/annotation_report.cgi?orf=Soltu.DM.02G012330.1, (accessed on 12 October 2023)2:27057682–270632831746581Nucleus
StBTB12Soltu.DM.02G027710.1 http://spuddb.uga.edu/cgi-bin/annotation_report.cgi?orf=Soltu.DM.02G027710.1, (accessed on 12 October 2023)2:40452119–404486661467488Chloroplast
StBTB13Soltu.DM.02G027750.1 http://spuddb.uga.edu/cgi-bin/annotation_report.cgi?orf=Soltu.DM.02G027750.1, (accessed on 12 October 2023)2:40471945–404749251137378Nucleus
StBTB14Soltu.DM.02G027770.1 http://spuddb.uga.edu/cgi-bin/annotation_report.cgi?orf=Soltu.DM.02G027770.1, (accessed on 12 October 2023)2:40517486–405223461842613Chloroplast
StBTB15Soltu.DM.02G027830.1 http://spuddb.uga.edu/cgi-bin/annotation_report.cgi?orf=Soltu.DM.02G027830.1, (accessed on 12 October 2023)2:40600737–405969541791596Nucleus
StBTB16Soltu.DM.02G027880.1 http://spuddb.uga.edu/cgi-bin/annotation_report.cgi?orf=Soltu.DM.02G027880.1, (accessed on 12 October 2023)2:40646109–40645050501166Nucleus
StBTB17Soltu.DM.03G005510.1 http://spuddb.uga.edu/cgi-bin/annotation_report.cgi?orf=Soltu.DM.03G005510.1, (accessed on 12 October 2023)3:6670844–66764841884627Cytoplasm
StBTB18Soltu.DM.03G025100.1 http://spuddb.uga.edu/cgi-bin/annotation_report.cgi?orf=Soltu.DM.03G025100.1, (accessed on 12 October 2023)3:50328857–503316751038345Nucleus
StBTB19Soltu.DM.04G012100.1 http://spuddb.uga.edu/cgi-bin/annotation_report.cgi?orf=Soltu.DM.04G012100.1, (accessed on 12 October 2023)4:13482468–134854671386461Cytoplasm
StBTB20Soltu.DM.04G037630.1 http://spuddb.uga.edu/cgi-bin/annotation_report.cgi?orf=Soltu.DM.04G037630.1, (accessed on 12 October 2023)4:68525044–685182032415804Chloroplast
StBTB21Soltu.DM.05G021440.1 http://spuddb.uga.edu/cgi-bin/annotation_report.cgi?orf=Soltu.DM.05G021440.1, (accessed on 12 October 2023)5:49859963–498654131446481Nucleus
StBTB22Soltu.DM.05G022360.1 http://spuddb.uga.edu/cgi-bin/annotation_report.cgi?orf=Soltu.DM.05G022360.1, (accessed on 12 October 2023)5:50791378–50794505801266Cytoplasm
StBTB23Soltu.DM.05G022990.1 http://spuddb.uga.edu/cgi-bin/annotation_report.cgi?orf=Soltu.DM.05G022990.1, (accessed on 12 October 2023)5:51463053–514578321023340Nucleus
StBTB24Soltu.DM.06G002220.1 http://spuddb.uga.edu/cgi-bin/annotation_report.cgi?orf=Soltu.DM.06G002220.1, (accessed on 12 October 2023)6:2651681–26551951800599Chloroplast
StBTB25Soltu.DM.06G010640.1 http://spuddb.uga.edu/cgi-bin/annotation_report.cgi?orf=Soltu.DM.06G010640.1, (accessed on 12 October 2023)6:32043750–32040570840279Chloroplast
StBTB26Soltu.DM.06G026950.1 http://spuddb.uga.edu/cgi-bin/annotation_report.cgi?orf=Soltu.DM.06G026950.1, (accessed on 12 October 2023)6:52716023–527126881050349Nucleus
StBTB27Soltu.DM.06G026960.1 http://spuddb.uga.edu/cgi-bin/annotation_report.cgi?orf=Soltu.DM.06G026960.1, (accessed on 12 October 2023)6:52723186–527183381050349Nucleus
StBTB28Soltu.DM.06G028810.1 http://spuddb.uga.edu/cgi-bin/annotation_report.cgi?orf=Soltu.DM.06G028810.1, (accessed on 12 October 2023)6:54046853–540488111722573Chloroplast
StBTB29Soltu.DM.06G034720.1 http://spuddb.uga.edu/cgi-bin/annotation_report.cgi?orf=Soltu.DM.06G034720.1, (accessed on 12 October 2023)6:58701505–587092311617538Chloroplast
StBTB30Soltu.DM.06G034740.1 http://spuddb.uga.edu/cgi-bin/annotation_report.cgi?orf=Soltu.DM.06G034740.1, (accessed on 12 October 2023)6:58720995–58723523441146Chloroplast
StBTB31Soltu.DM.07G011890.1 http://spuddb.uga.edu/cgi-bin/annotation_report.cgi?orf=Soltu.DM.07G011890.1, (accessed on 12 October 2023)7:38290258–382739051884627Chloroplast
StBTB32Soltu.DM.07G013880.1 http://spuddb.uga.edu/cgi-bin/annotation_report.cgi?orf=Soltu.DM.07G013880.1, (accessed on 12 October 2023)7:42990889–429885091731576Plastid
StBTB33Soltu.DM.07G014680.1 http://spuddb.uga.edu/cgi-bin/annotation_report.cgi?orf=Soltu.DM.07G014680.1, (accessed on 12 October 2023)7:44408833–444042741728575Cytoplasm/Nucleus
StBTB34Soltu.DM.07G016030.1 http://spuddb.uga.edu/cgi-bin/annotation_report.cgi?orf=Soltu.DM.07G016030.1, (accessed on 12 October 2023)7:46031384–460341712064687Chloroplast
StBTB35Soltu.DM.07G016870.1 http://spuddb.uga.edu/cgi-bin/annotation_report.cgi?orf=SoltuDM.07G016870.1, (accessed on 12 October 2023)7:46995457–470026551734577Cytoplasm
StBTB36Soltu.DM.07G027790.1 http://spuddb.uga.edu/cgi-bin/annotation_report.cgi?orf=Soltu.DM.07G027790.1, (accessed on 12 October 2023)7:56826287–56828986987328Cytoplasm
StBTB37Soltu.DM.08G001470.1 http://spuddb.uga.edu/cgi-bin/annotation_report.cgi?orf=Soltu.DM.08G001470.1, (accessed on 12 October 2023)8:1948150–19416861848615Cytoplasm
StBTB38Soltu.DM.08G006060.1 http://spuddb.uga.edu/cgi-bin/annotation_report.cgi?orf=Soltu.DM.08G006060.1, (accessed on 12 October 2023)8:8434101–84288051212403Cytoplasm
StBTB39Soltu.DM.08G028580.1 http://spuddb.uga.edu/cgi-bin/annotation_report.cgi?orf=Soltu.DM.08G028580.1, (accessed on 12 October 2023)8:57912747–579177171560519Nucleus
StBTB40Soltu.DM.08G028600.1 http://spuddb.uga.edu/cgi-bin/annotation_report.cgi?orf=Soltu.DM.08G028600.1, (accessed on 12 October 2023)8:57927168–579288721380459Chloroplast
StBTB41Soltu.DM.08G028610.1 http://spuddb.uga.edu/cgi-bin/annotation_report.cgi?orf=Soltu.DM.08G028610.1, (accessed on 12 October 2023)8:57933232–579348731332443Chloroplast
StBTB42Soltu.DM.09G005820.1 http://spuddb.uga.edu/cgi-bin/annotation_report.cgi?orf=Soltu.DM.09G005820.1 (accessed on 12 October 2023)9:5410787–54076181785594Cytoplasm
StBTB43Soltu.DM.09G011290.1 http://spuddb.uga.edu/cgi-bin/annotation_report.cgi?orf=Soltu.DM.09G011290.1, (accessed on 12 October 2023)9:19305560–193086571737578Vacuole
StBTB44Soltu.DM.09G017950.1 http://spuddb.uga.edu/cgi-bin/annotation_report.cgi?orf=Soltu.DM.09G017950.1, (accessed on 12 October 2023)9:50663650–506609541824607Nucleus
StBTB45Soltu.DM.09G019780.1 http://spuddb.uga.edu/cgi-bin/annotation_report.cgi?orf=Soltu.DM.09G019780.1, (accessed on 12 October 2023)9:54297721–542894242127708Cytoplasm
StBTB46Soltu.DM.09G022320.1 http://spuddb.uga.edu/cgi-bin/annotation_report.cgi?orf=Soltu.DM.09G022320.1, (accessed on 12 October 2023)9:57831226–578250831236411Nucleus
StBTB47Soltu.DM.09G023040.1 http://spuddb.uga.edu/cgi-bin/annotation_report.cgi?orf=Soltu.DM.09G023040.1, (accessed on 12 October 2023)9:58865131–588694191890629Chloroplast
StBTB48Soltu.DM.10G000680.1 http://spuddb.uga.edu/cgi-bin/annotation_report.cgi?orf=Soltu.DM.10G000680.1, (accessed on 12 October 2023)10:619135–6093972250749Plastid
StBTB49Soltu.DM.10G005800.1 http://spuddb.uga.edu/cgi-bin/annotation_report.cgi?orf=Soltu.DM.10G005800.1, (accessed on 12 October 2023)10:5842039–58362971656551Nucleus
StBTB50Soltu.DM.10G013480.1 http://spuddb.uga.edu/cgi-bin/annotation_report.cgi?orf=Soltu.DM.10G013480.1, (accessed on 12 October 2023)10:38866471–388578052349782Cytoplasm
StBTB51Soltu.DM.10G021040.1 http://spuddb.uga.edu/cgi-bin/annotation_report.cgi?orf=Soltu.DM.10G021040.1, (accessed on 12 October 2023)10:52920912–529168541833610Nucleus
StBTB52Soltu.DM.10G027630.1 http://spuddb.uga.edu/cgi-bin/annotation_report.cgi?orf=Soltu.DM.10G027630.1, (accessed on 12 October 2023)10:58822974–588252921464487Cytoplasm
StBTB53Soltu.DM.10G027950.1 http://spuddb.uga.edu/cgi-bin/annotation_report.cgi?orf=Soltu.DM.10G027950.1, (accessed on 12 October 2023)10:59080668–590780991473490Nucleus
StBTB54Soltu.DM.11G011280.1 http://spuddb.uga.edu/cgi-bin/annotation_report.cgi?orf=Soltu.DM.11G011280.1, (accessed on 12 October 2023)11:11798335–11794985987328Cytoplasm
StBTB55Soltu.DM.11G025060.1 http://spuddb.uga.edu/cgi-bin/annotation_report.cgi?orf=Soltu.DM.11G025060.1, (accessed on 12 October 2023)11:45125219–451164161227408Nucleus
StBTB56Soltu.DM.12G008220.1 http://spuddb.uga.edu/cgi-bin/annotation_report.cgi?orf=Soltu.DM.12G008220.1, (accessed on 12 October 2023)12:7252303–72570561668555Nucleus
StBTB57Soltu.DM.12G019670.1 http://spuddb.uga.edu/cgi-bin/annotation_report.cgi?orf=Soltu.DM.12G019670.1, (accessed on 12 October 2023)12:46941436–46943083795264Cytoplasm
Table 2. Sequence of conserved motifs present across StBTB proteins.
Motif No.Motif NameSequence of Motifs
Motif 1NPH3IPGGAEAFELAAKFCYGVNFEJTAYNVAALRCAAEYLEMTEEYSKGNLISKTEVFLNSVV
Motif 2NPH3VPDYARPVHDGLYRAIDIYLKAHPGLSDSERKRLCKLMDCQKLSQEACTHAAQNERLPLRVIVQVLFFEQL
Motif 3N.A.YVERAYKYRPVKVLEFELPHQQCVVYLDLKRDECANLFPAGRVYSQAFHLGGQGFFLSAHCNMDQQSAFHCFGLFLGMQEKGSVSFAVDYEFAVRTKPGEEYVSKYKGNYTFTGGKAVGYRNLFGIPWTPFLAEDSLYFINGILHLRAELTI
Motif 4BTBSELASDVTINVGGRSFHLHKFILAARSGVFRKLFSNGNE
Motif 5BACKIHASEEAALMDLLKFMYSNTLSTKTPPGLLDVLMAADKFEVASCMRYCSRELQNLPMTSESALLYLDLPSSVLMADAVRPLADAAKQFLAARFKDITKFQEEVLSLPLAGIEAVLSSDDLQIASEDAVYDFVLKWARTHYPKJEERREILTSRLCRLIRFPFMTCRKLRKVLTCNDFDHELASKFVLEALFYKAEAPHRQ
Motif 6MATHTSSRSVTETVNGSHRFVINGYSLAKGMGIGKYITSDTFTVGGHQWAIYFYPDGKNPEDNSTYVSLFIALASEGTDVRALFELTLIDQSGKGKHKVHSHFDRALESGPYTLKYRGSMWGYKRFFRRALLETSDYLKDDCLKIHCTVGVVRST
Motif 7NPH3SVPCSFLLKLLRSAIMLDASPSCRSELERRIGLQLDQATLBDLLIPA
Motif 8NPH3DWWVEDLSVLSIDLYKRVIVAMKARGVK
Motif 9NPH3SWKDSIIVLQTCENLLPLAEELKJVSRCIDSIASKACVD
Motif 10NPH3PGSPSLSSLVKVAKLVDGYLAEIAPDPNLKLSKFISLAE
Motif 11N.A.HALDLLAAADKYGVEQLKRLCEKALAEDLSIENVLDVLQ
Motif 12BTBIKINDVPYEAFKAMLRFLYSGKLKEEPM
Motif 13TAZPCSKFDTCQGLQLLIRHFATCKRRVPGGCJRCKRMWQILRLHSSICDQPDDCKVPLCRQFKZK
Motif 14TAZNFKKIEETEGWKFLQHHDPVLELEILQFMDEADJRKKRRRRHKREQNLYLQLSEAMDCLEHICREGCTSVGPHDKEP
Motif 15NPR5/6SHHHHEHDLSSADELEDKKIRRIRRALDSDDVELVKLLLMGEGLNLDEAIALHYAVEYCSREVVKELLELG
Motif 16NPR5/6VVNPAGPRGKTPLHIAAERKEPDIIAVLLDKGADPNVRTLDGITPLDILRTLTR
Motif 17ARMHYEAVGVIGNLVHSSPNIKKEVLLAGALQPVIGLLSSSCPESQREAALLLGQFAATDSDCKIHIVQRGAVPPLIEMLQSPDAQLREMSAFALGRLAQDTHNQAGIAHCGGIIPLLKLLDSKNGSLQHNAAFALYGLADNEDNVADLIKVGGVQKLQDGEFIVQPTRDCVAKTLKRLEEKIHGRILGHLLYLMRIGEKVIQ
Motif 18NPH3YAGETLYDVDTVQRILENFL
Motif 19N.A.ASLRRENRELKLELEKMRMRVADLEKEHVSMKQEIQK
Motif 20NPH3SEKKQRVILETIVSLLPKEKG
Disclaimer/Publisher’s Note: The statements, opinions and data contained in all publications are solely those of the individual author(s) and contributor(s) and not of MDPI and/or the editor(s). MDPI and/or the editor(s) disclaim responsibility for any injury to people or property resulting from any ideas, methods, instructions or products referred to in the content.

