Article

Simulation of a Radio-Frequency Wave Based Bacterial Biofilm Detection Method in Dairy Processing Facilities

1
Department of Electrical and Computer Engineering, Boise State University, Boise, ID 83725, USA
2
Department of Chemistry and Biochemistry, Boise State University, Boise, ID 83725, USA
*
Author to whom correspondence should be addressed.
Appl. Sci. 2024, 14(11), 4342; https://doi.org/10.3390/app14114342
Submission received: 29 April 2024 / Revised: 18 May 2024 / Accepted: 20 May 2024 / Published: 21 May 2024

Abstract

:
This paper describes the principles behind the radio-frequency (RF) sensing of bacterial biofilms in pipes and heat exchangers in a dairy processing plant using an electromagnetic simulation. Biofilm formation in dairy processing plants is a common issue where the absence of timely detection and subsequent cleaning can cause serious illness. Biofilms are known for causing health issues and cleaning requires a large volume of water and harsh chemicals. In this work, milk transportation pipes are considered circular waveguides, and pasteurizers/heat exchangers are considered resonant cavities. Simulations were carried out using the CST studio suite high-frequency solver to determine the effectiveness of the real-time RF sensing. The respective dielectric constants and loss tangents were applied to milk and biofilm. In our simulation, it was observed that a 1 µm thick layer of biofilm in a milk-filled pipe shifted the reflection coefficient of a 10.16 cm diameter stainless steel circular waveguide from 0.229 GHz to 0.19 GHz. Further sensitivity analysis revealed a shift in frequency from 0.8 GHz to 1.2 GHz for a film thickness of 5 µm to 10 µm with the highest wave reflection (S11) peak of ≈−120 dB for a 6 µm thick biofilm. A dielectric patch antenna to launch the waves into the waveguide through a dielectric window was also designed and simulated. Simulation using the antenna demonstrated a similar S11 response, where a shift in reflection coefficient from 0.229 GHz to 0.19 GHz was observed for a 1 µm thick biofilm. For the case of the resonant cavity, the same antenna approach was used to excite the modes in a 0.751 m × 0.321 m × 170 m rectangular cavity with heat exchange fins and filled with milk and biofilm. The simulated resonance frequency shifted from 1.52 GHz to 1.54 GHz, for a film thickness varying from 1 µm to 10 µm. This result demonstrated the sensitivity of the microwave detection method. Overall, these results suggest that microwave sensing has promise in the rapid, non-invasive, and real-time detection of biofilm formation in dairy processing plants.

1. Introduction

Dairy processing plants are susceptible to a variety of biofilm-forming microbes, posing a threat to product quality and safety. Common culprits include bacteria like Listeria monocytogenes, known for causing serious foodborne illness, as well as psychrotrophic bacteria that thrive in refrigerated environments and can contribute to spoilage [1]. Traditional methods for detecting biofilm in dairy processing plants rely on culturing techniques like plate counts and adenosine triphosphate (ATP) bioluminescence. However, these methods can be time consuming, require disposable equipment surfaces, and may not accurately reflect viable biofilm populations [2,3]. Modern methods like Congo red agar (CRA) staining [4] offer a faster qualitative assessment of biofilm formation, but they still require sample collection and lack the sensitivity to detect early biofilm stages. While promising, the application of techniques like mass spectrometry for biofilm characterization in dairy settings still requires a lot more research [5]. Real-time non-invasive microwave sensing is a developing technology, which has been successfully used in various industrial applications including biofilm detection in the food processing industry [6], environmental monitoring of water pollutant concentrations and treated wastewater quality monitoring [7], water level measurements [8], measurement of the material moisture content [9], sensing the carbon emissions for continuous process monitoring of biogas plants [10], and in the healthcare industry. The healthcare applications include non-invasive real-time monitoring of glucose in diabetic patients [11,12] and assessing the lipid concentration of biological cells as a means of detecting malignant neoplasmic growth [13]. Moreover, microwave-assisted heavy oil production is also a developing area [13]. The principle of real-time monitoring using microwaves is based on the interaction of the electromagnetic waves with the material under test. The electromagnetic properties of the material, such as permittivity, can change the RF wave velocity, attenuation, or reflection.
Microwave sensing could offer a revolutionary approach for biofilm detection in dairy plants. This rapid, non-invasive technique provides real-time monitoring, and thus it may enable early intervention before biofilms compromise product safety. By preventing contamination and costly shutdowns, microwave sensing could become a viable alternative for both food safety and production efficiency.
Exploiting the transmitted (S21) and reflected (S11) microwave waves at discrete frequencies, biofilm sensors can leverage the sensitivity of conductive waveguide structures containing a material such as milk. Similarly, biofilm sensors can leverage the sensitivity of resonance frequencies in cavities as a result of changes in material permittivity. These cavity resonators exhibit a characteristic frequency heavily dependent on their geometric dimensions, conductivity, and the dielectric properties of the material within the cavity.
This work proposes the use of RF waves for the real-time detection of bacterial biofilms in pipes and heat exchangers carrying milk. First, a brief background on the RF wave properties in waveguides and cavities is presented along with a discussion of the various proposed measurement (diagnostic) approaches. Then, the simulation and results are described in the context of a milk-filled cylindrical waveguide (pipe) and a rectangular cavity (pasteurizer).

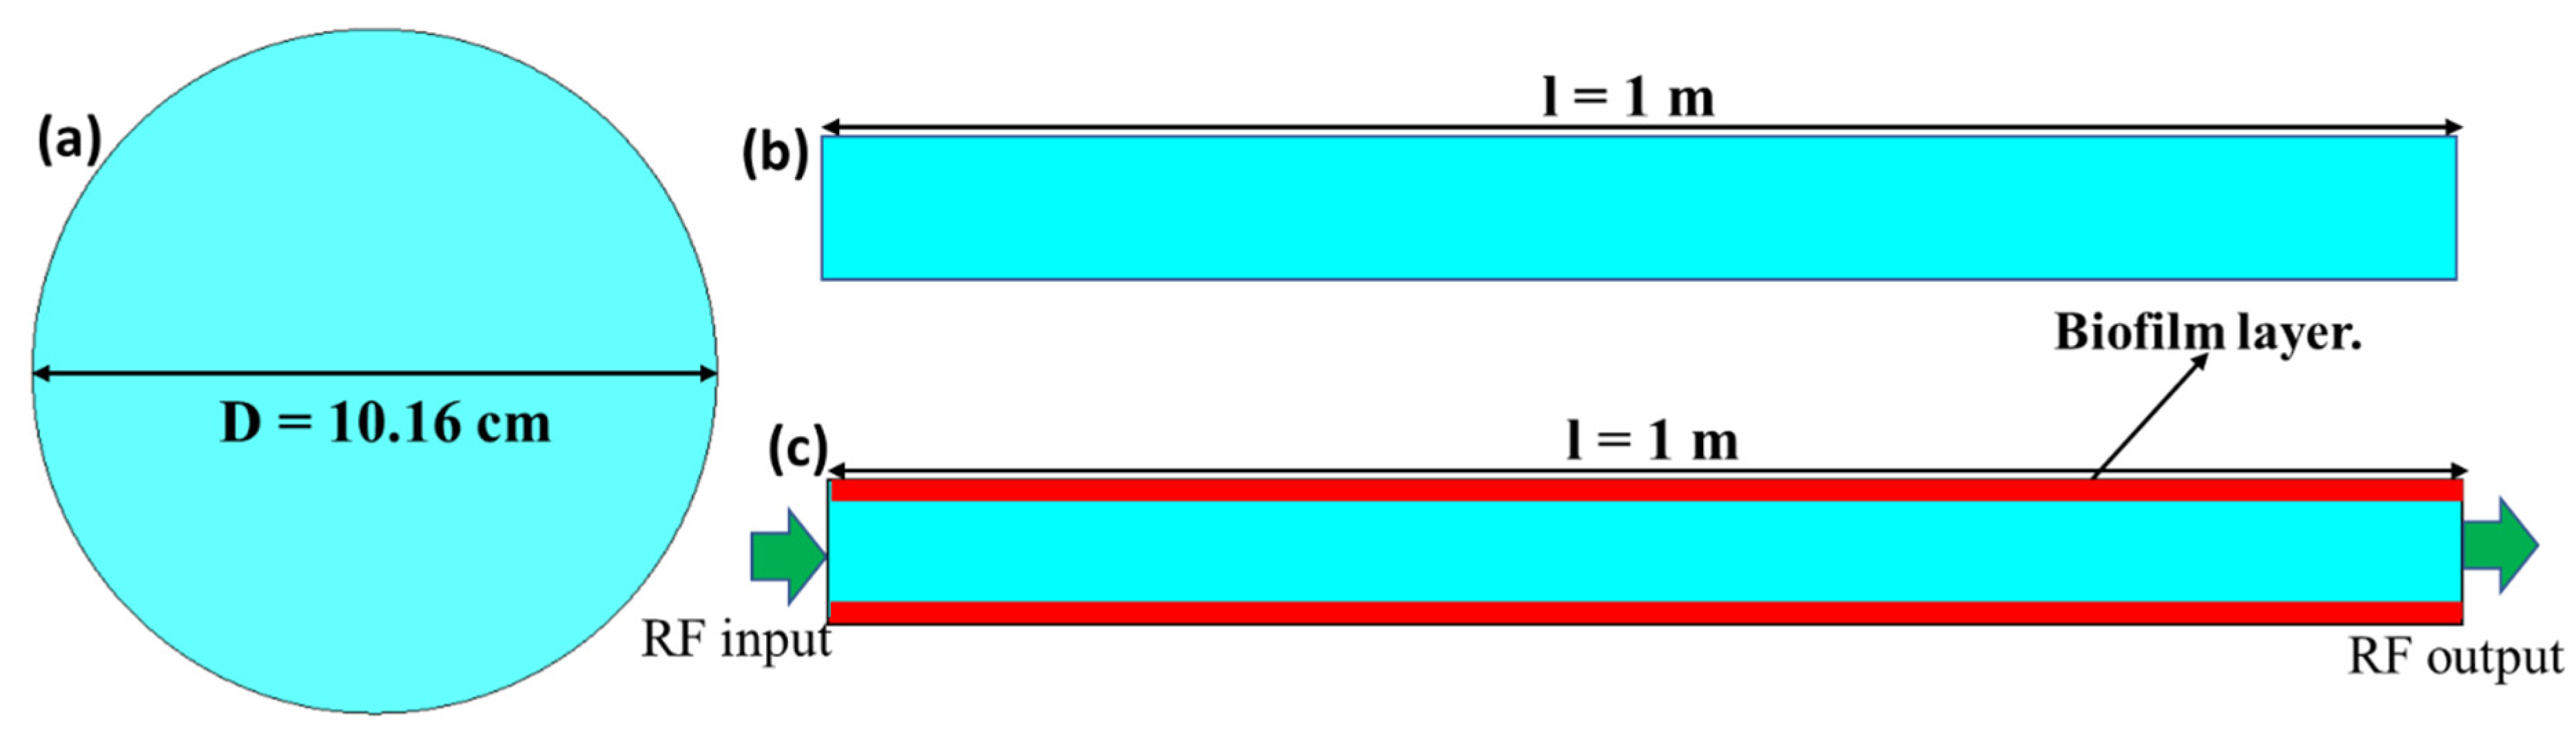
2. Materials and Methods: RF Waveguides and Cavities

Waveguides and cavities excel in material characterization due to their inherent sensitivity [14], manifested in S11 for the waveguide and precise resonance signatures for cavities. These parameters depend on the permittivity (εr) and loss tangent (tan δ) of the dielectric and the conductivity of the conductor. The key lies in changing the dielectric medium (grown biofilm will change the εr and tan δ), inducing a “perturbation” in the electromagnetic field distribution. This translates as a measurable shift in the S11 (waveguide) and resonance frequency (resonator). By meticulously analyzing these alterations, we can glean crucial information about the material’s presence and physical properties, paving the way for accurate and non-destructive characterization of biofilm growth. Waveguides and cavity resonators are theoretically based on Maxwell’s equations of the electromagnetic field [15].
Waveguides are conductive structures (rectangular or cylindrical) in which the RF wave is confined within the structure and propagates inside from end to end. Generally, the waves are described as either transverse electric (TE) or transverse magnetic (TM) for the purposes of studying the wave propagation [1]. In some cases, the entire hollow space or the inner wall of the waveguide can be filled with a dielectric material. This can affect the propagation characteristics of the wave in several ways such as a change in propagation constant (S11) by means of a shift in frequency and/or a shift in amplitude. The presence of a dielectric results in reduced phase velocity and increased attenuation or loss of the wave as the permittivity (εr) and loss tangent (tan δ) change. This shift in frequency and amplitude can be used to determine the presence of biofilm on the surface of the inner wall of the waveguide.
Cavities, conversely, are fully enclosed and can essentially trap the RF field within the structure. Idealized cavities, devoid of sources and losses, resonate at specific frequencies, creating strong electromagnetic (EM) fields that build up in the cavity. However, dielectric media inside the cavity and losses inherent on the walls dampen and/or change these resonance frequencies.

3. Simulation Setup

Simulations were carried out using the commercially available electromagnetic solver CST studio suite [16] (high-frequency module). Three different models were studied: (a) a simple milk-filled pipe, (b) a milk-filled zigzag holding tube, and (c) a milk-filled heat exchanger/pasteurizer. These were simulated using the electromagnetic material properties of milk, and then the biofilms were added to the walls to determine whether the presence of bacterial biofilms on the structural wall surfaces could be measured. For the milk-filled pipe and the zigzag model, a simple cylindrical waveguide model was created, and the reflection coefficient, S11, was calculated with and without different film thicknesses on the conductive surface. For the milk-filled heat exchanger model, the CST eigenmode solver was used, where the heat exchanger was assumed to be a resonant cavity, and the resonance frequency was calculated with different biofilm film thicknesses.

4. Results and Discussion

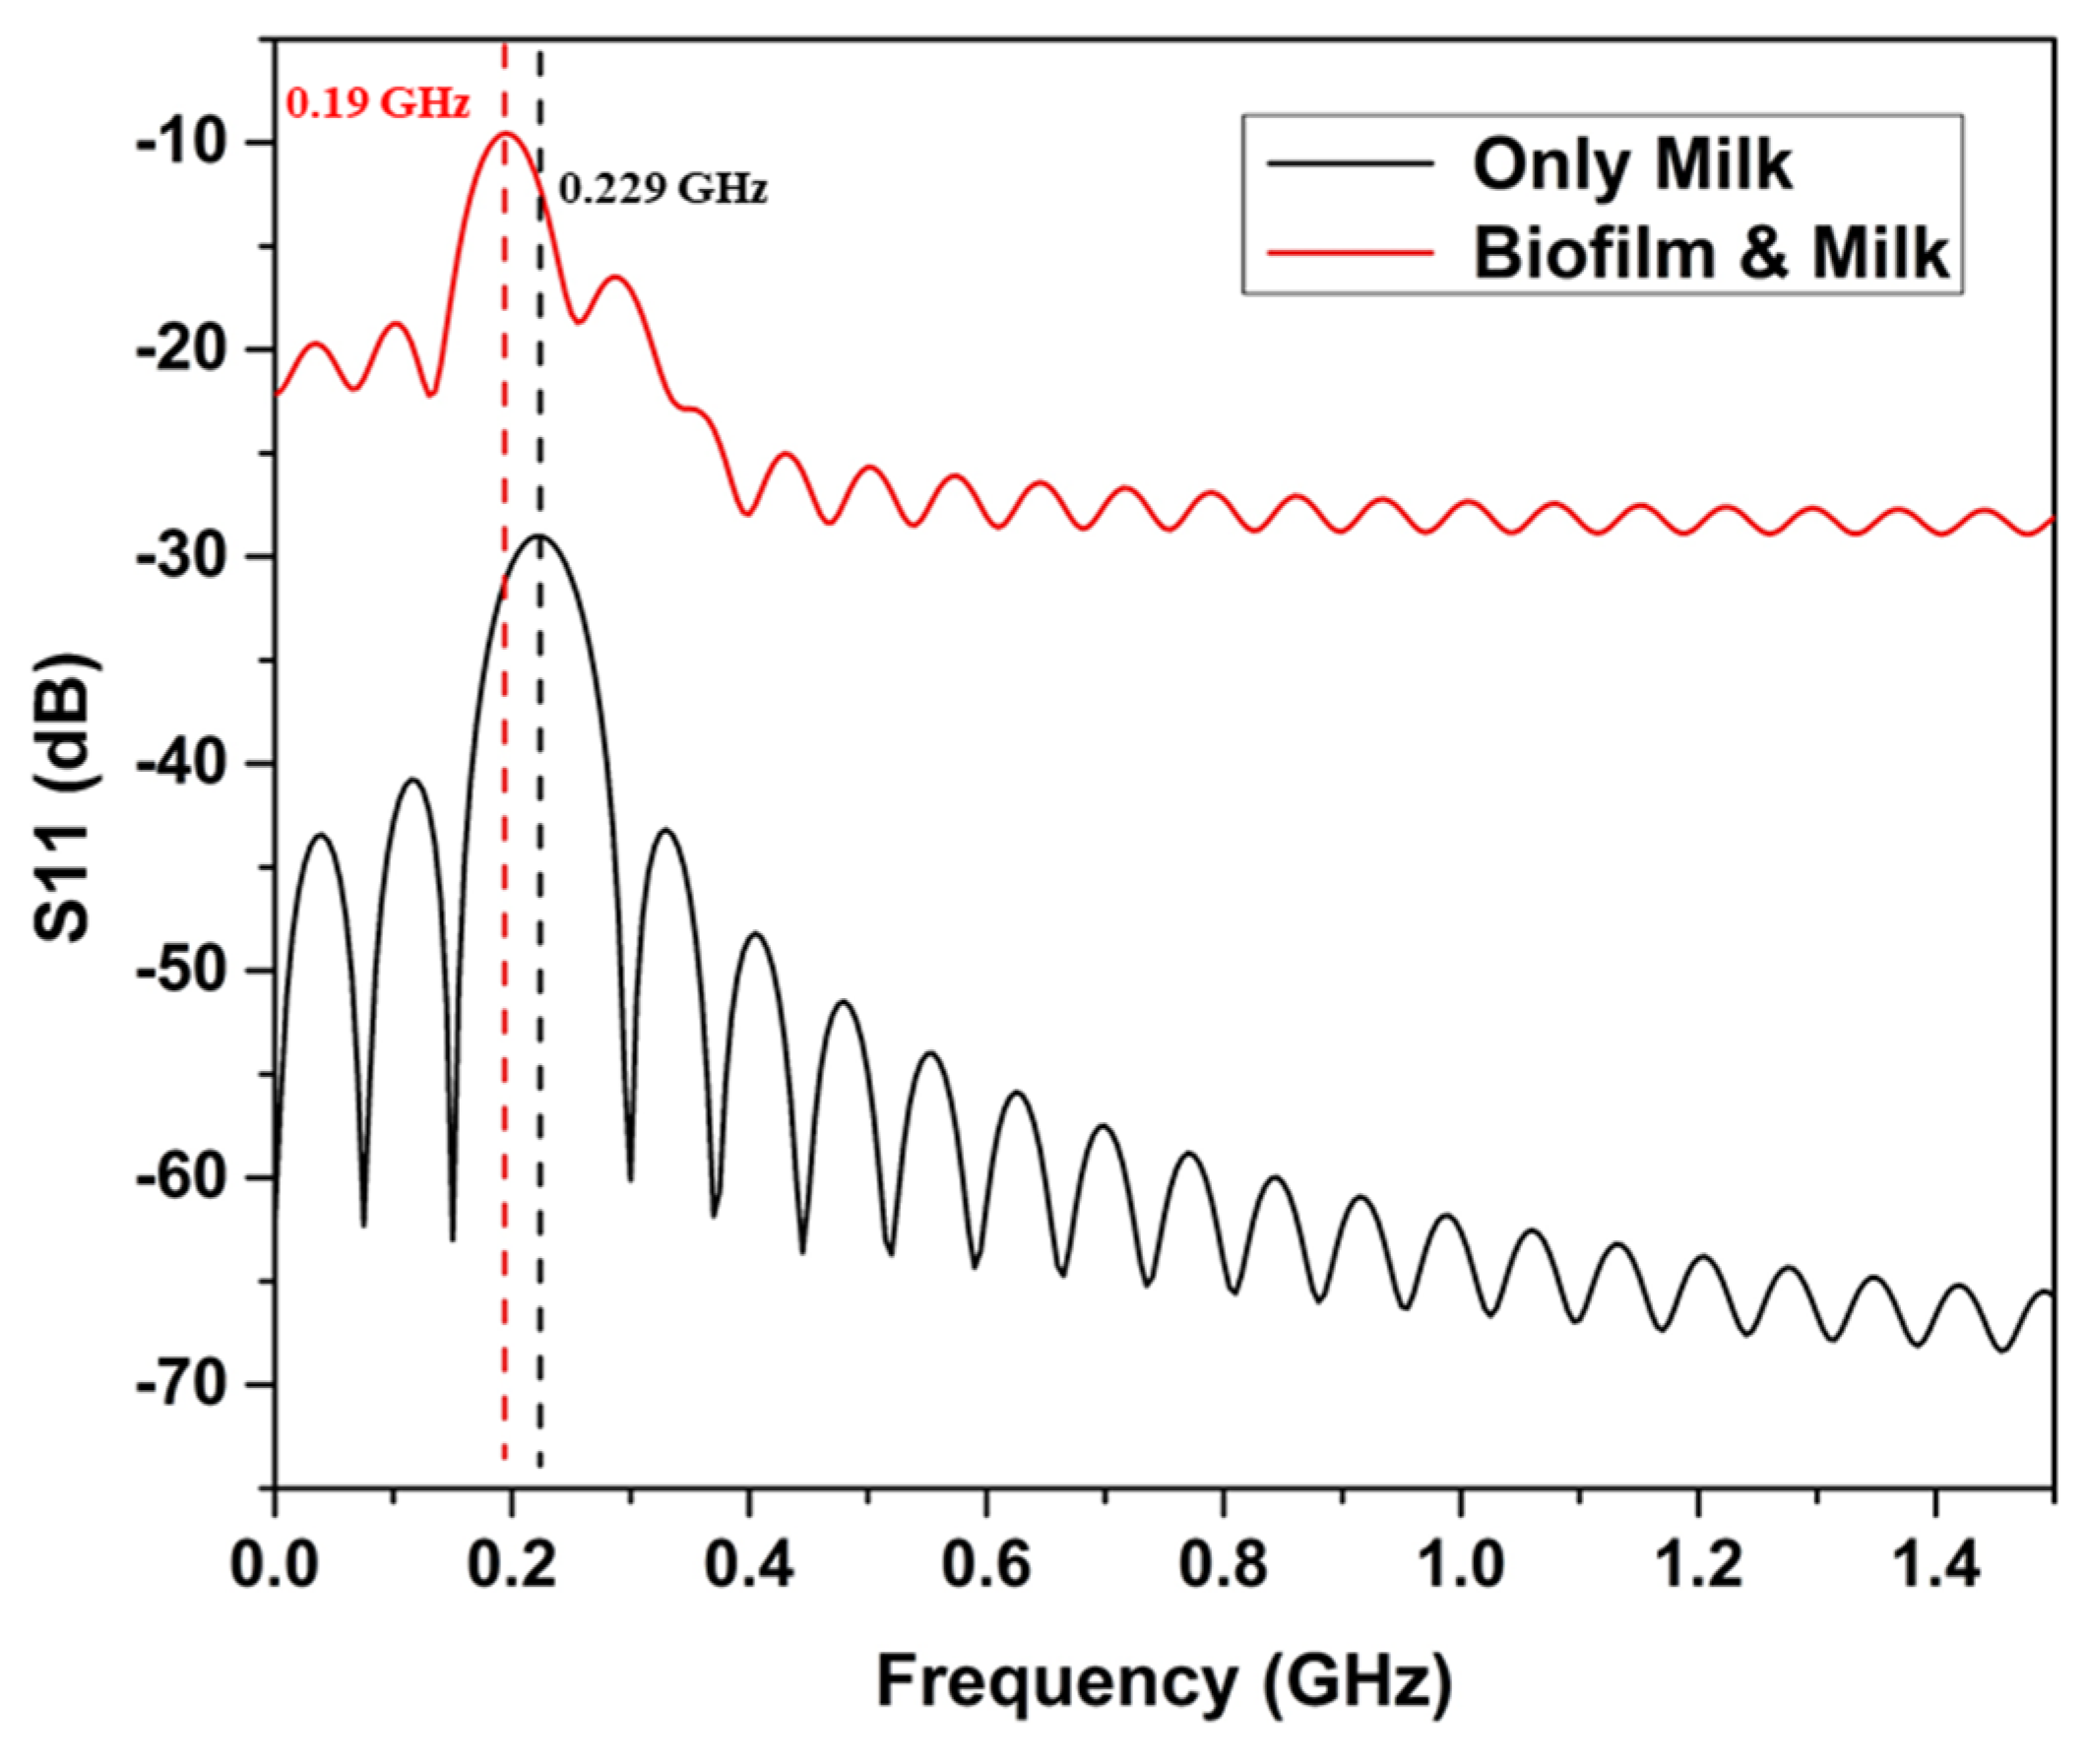
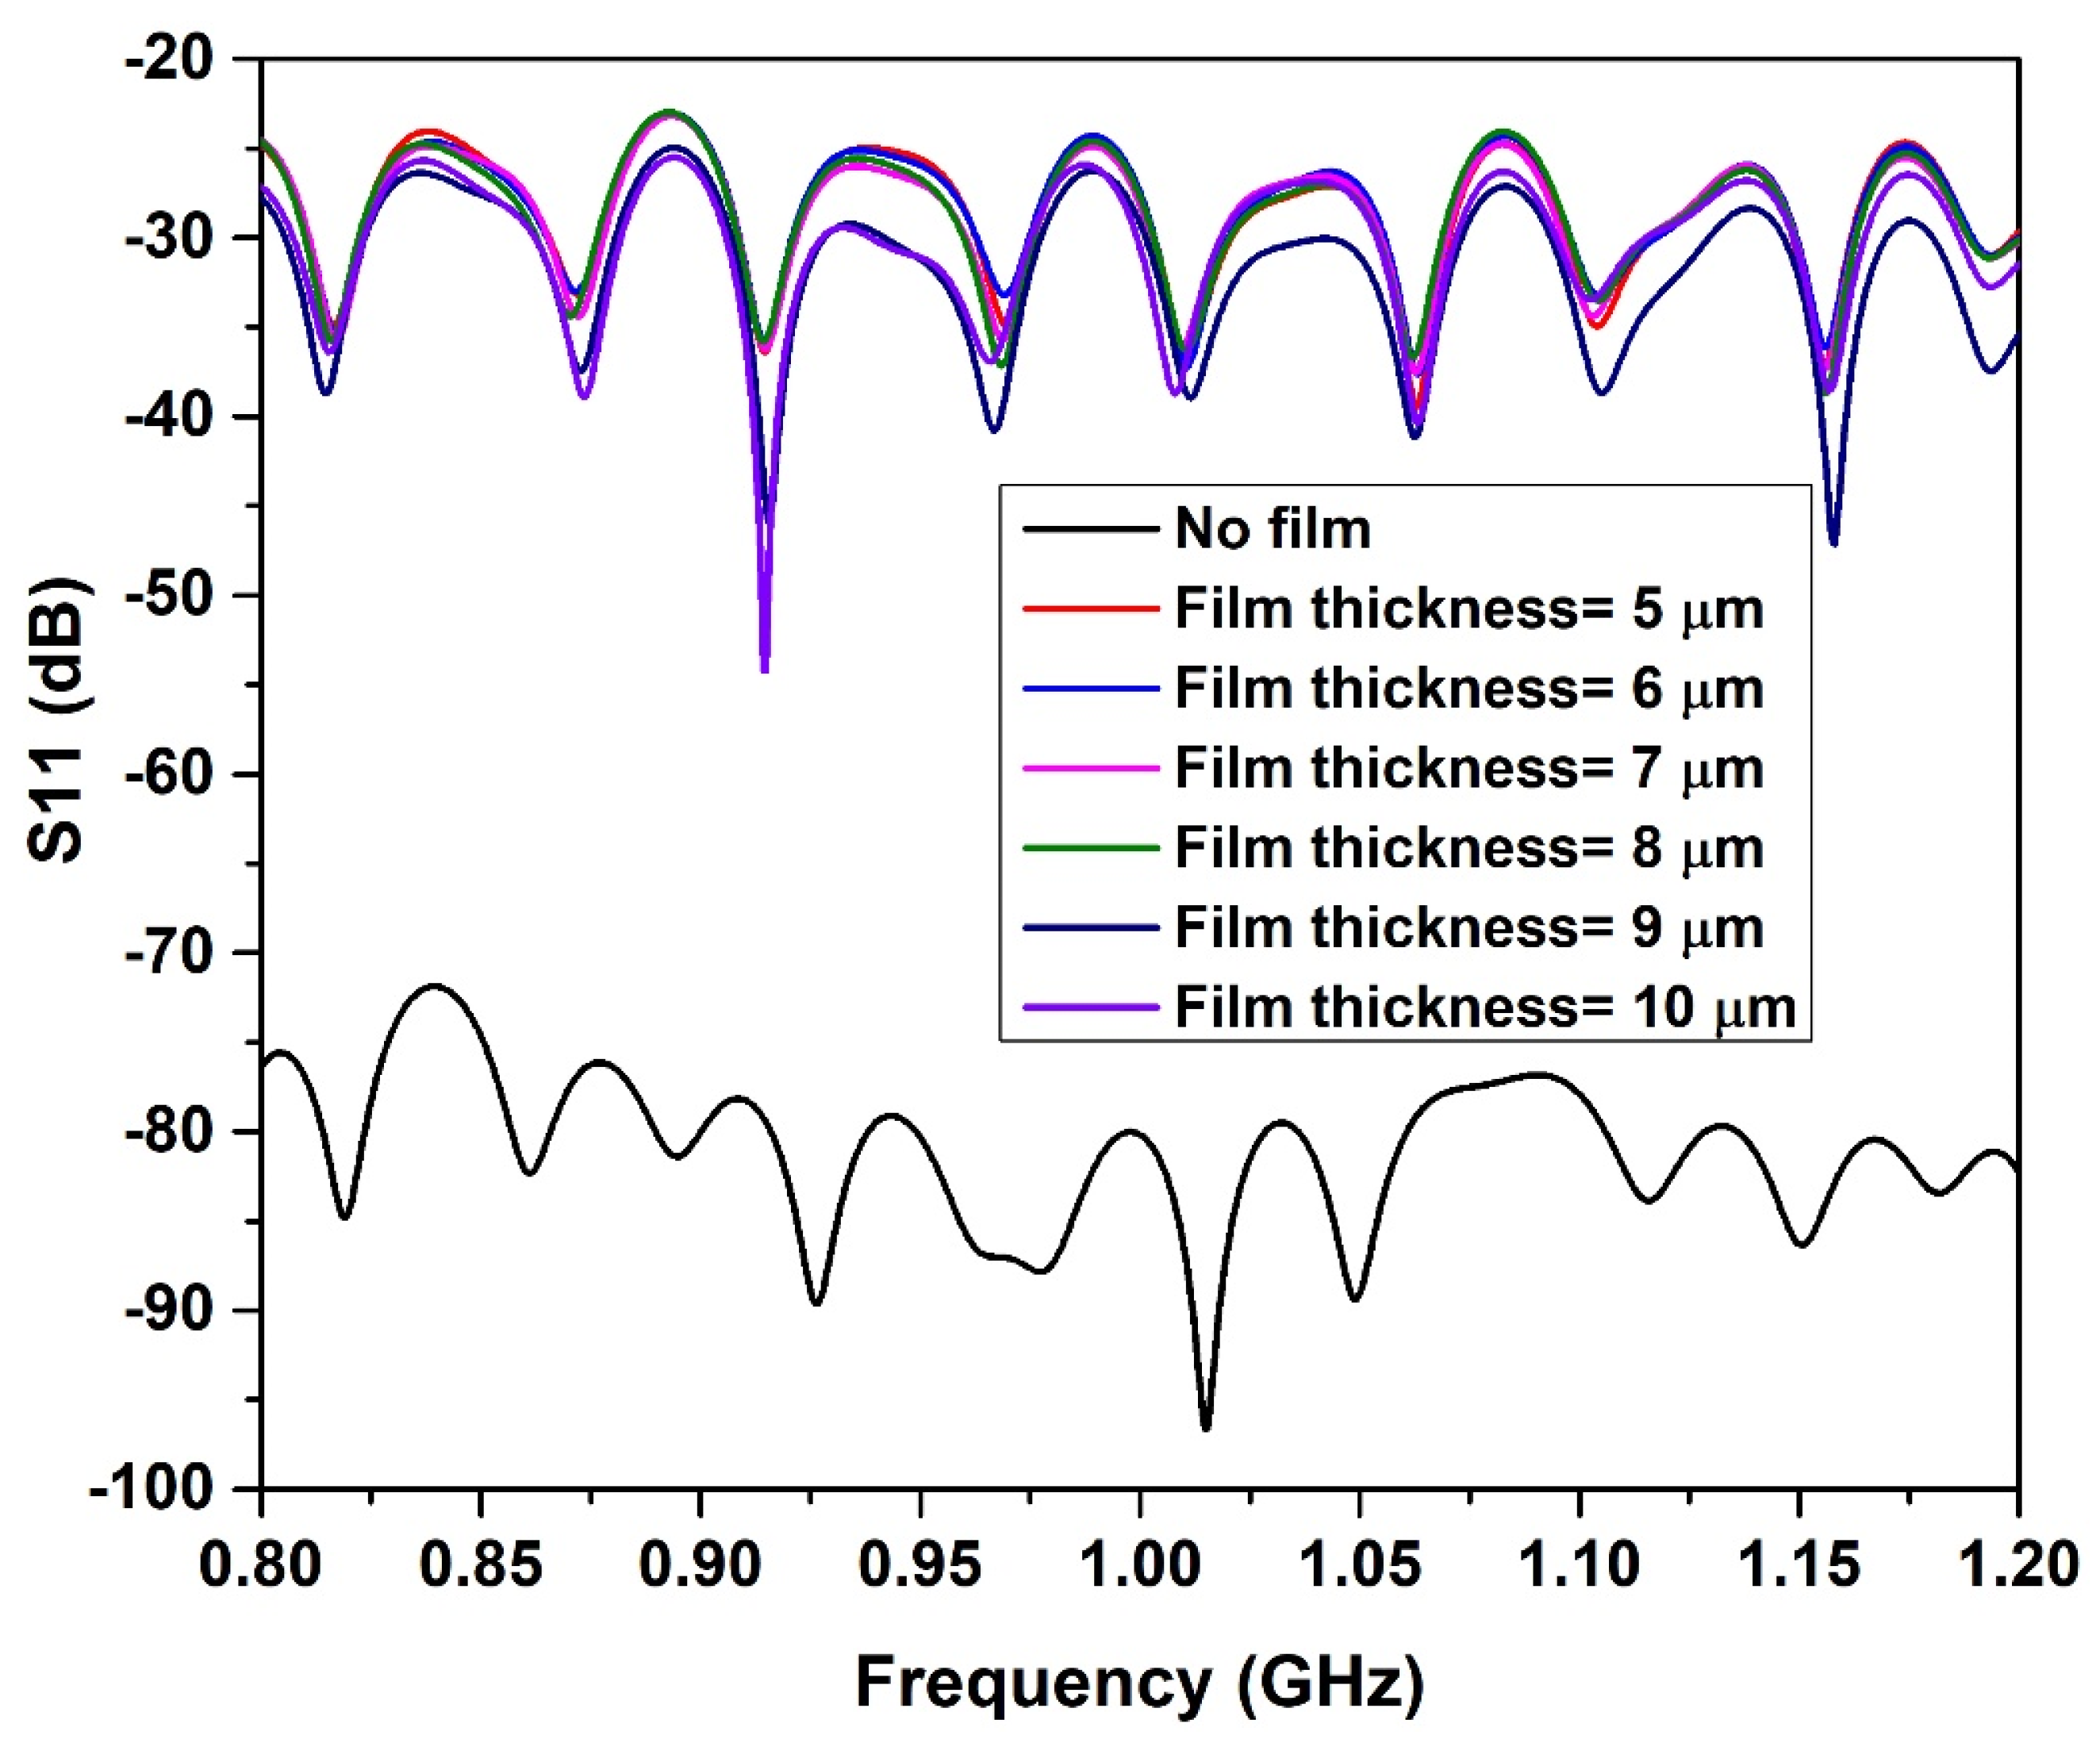
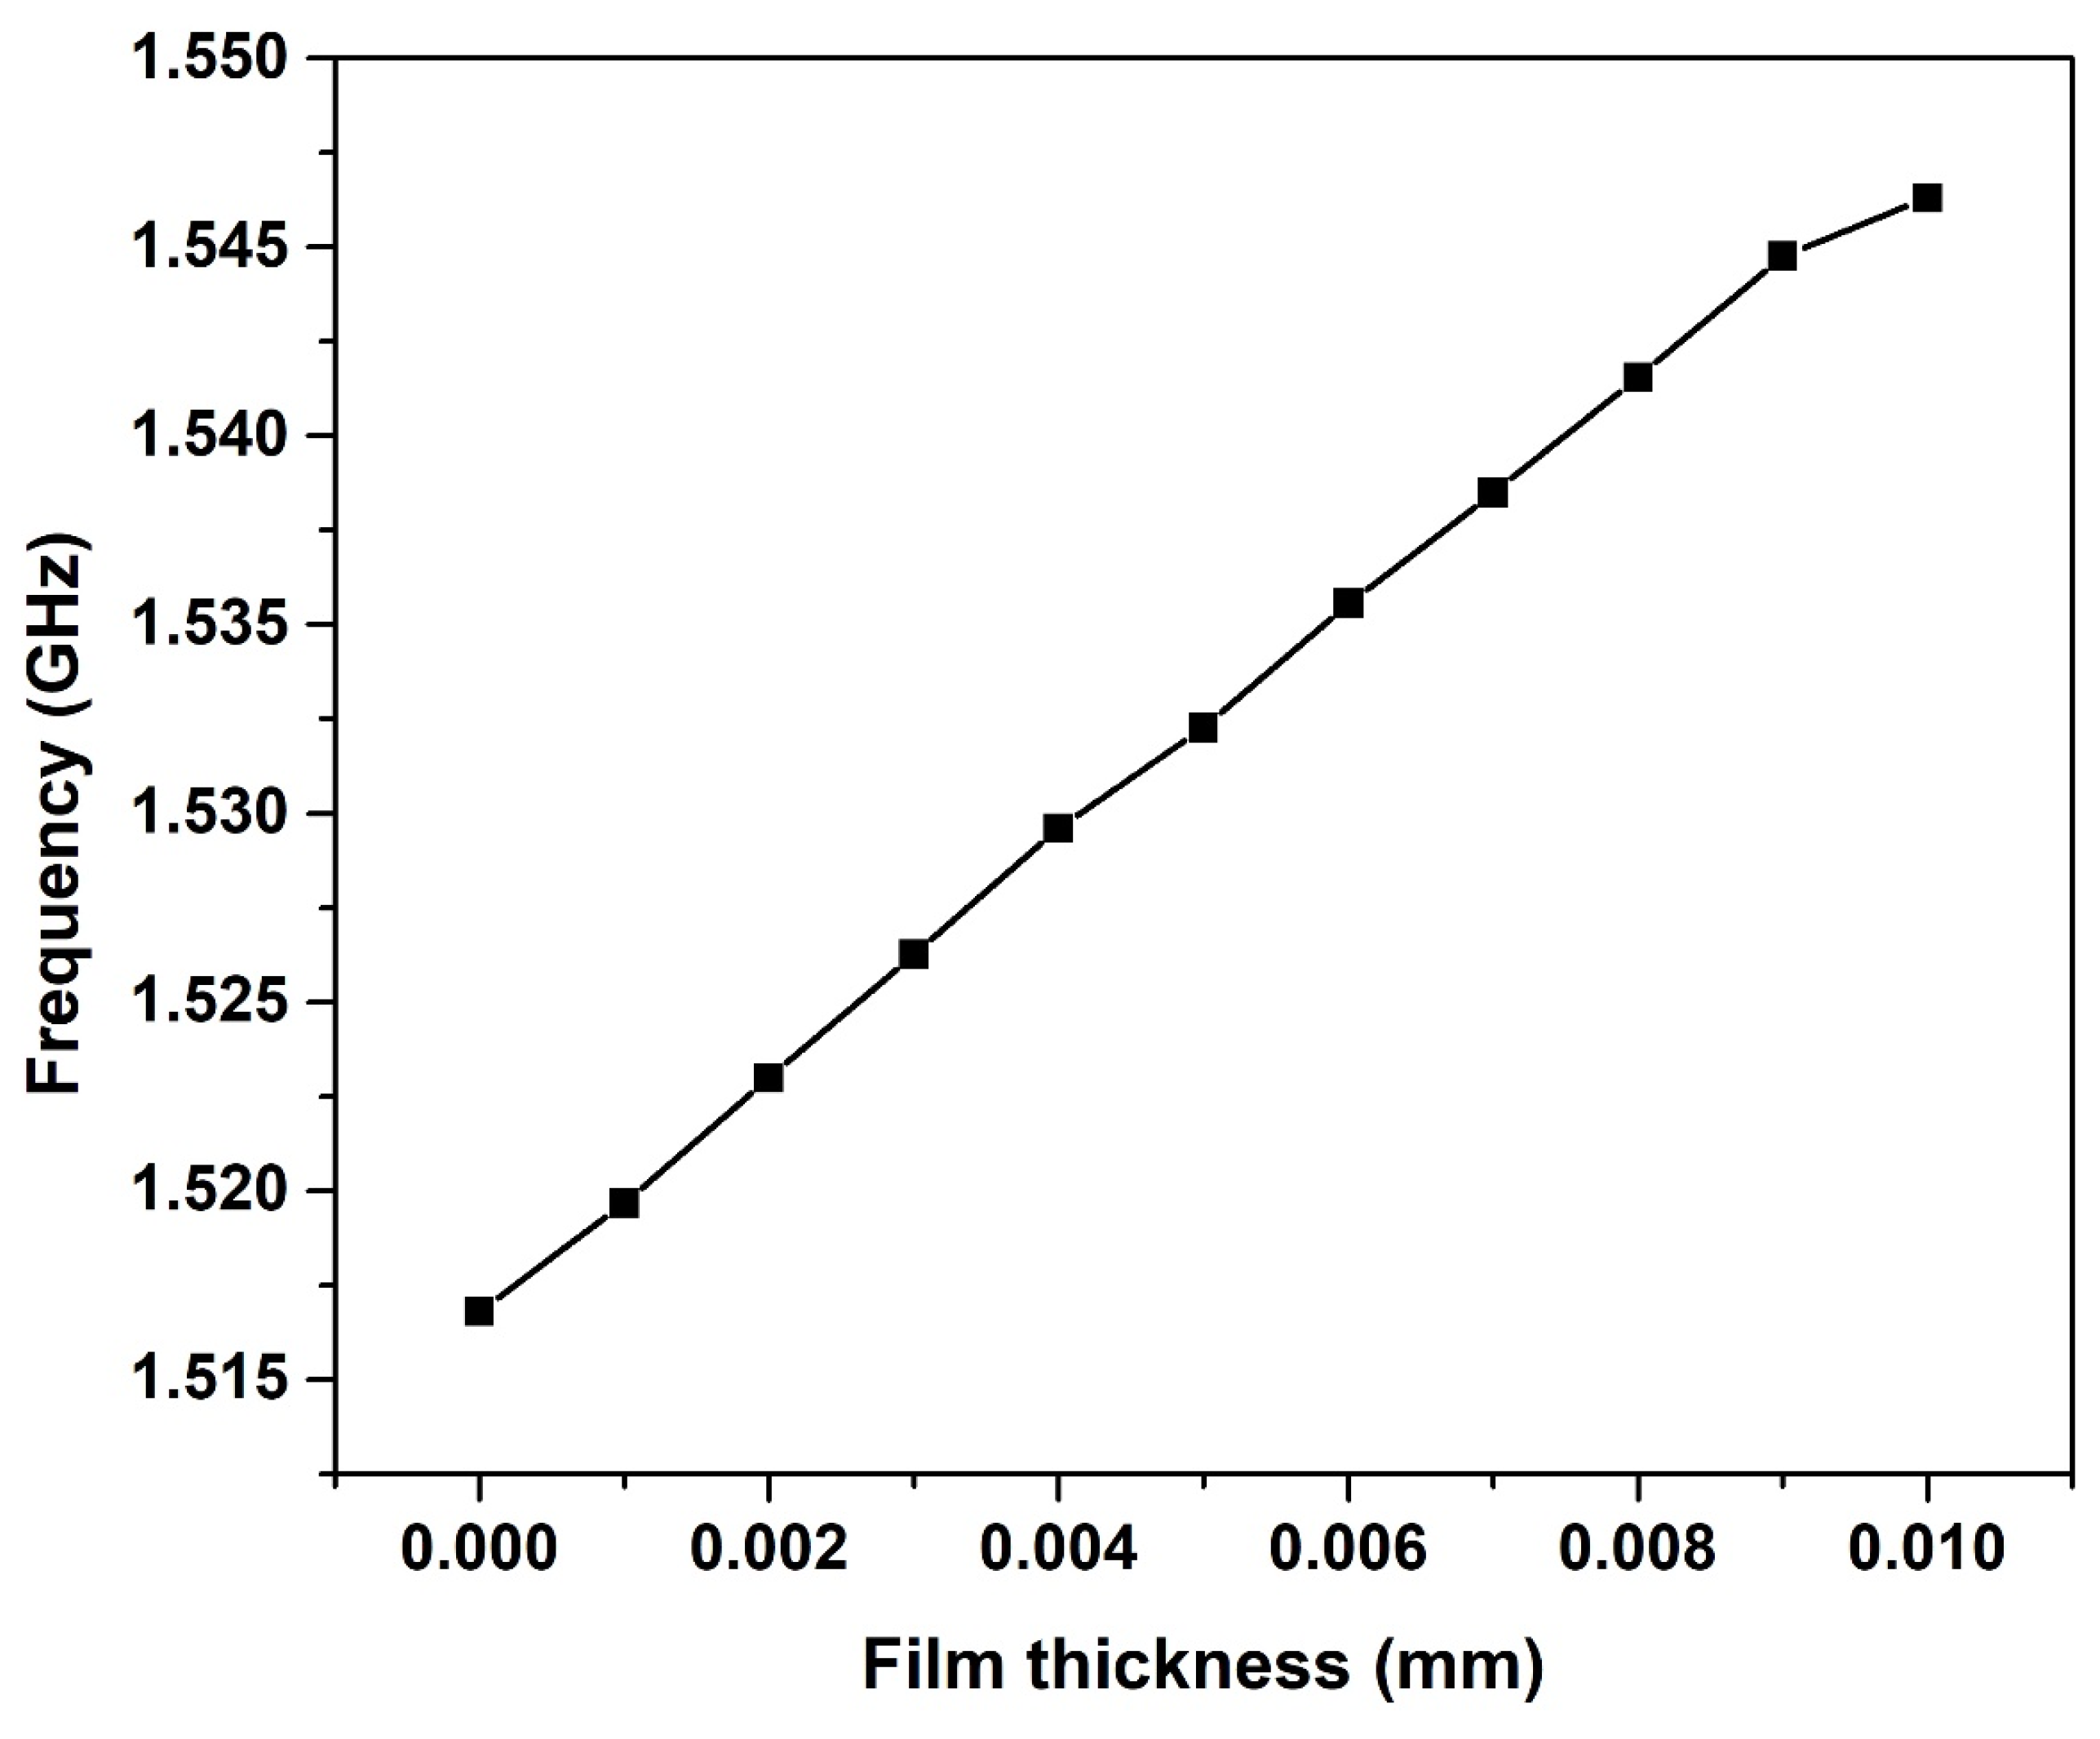
4.1. Milk-Filled Pipe

The simulation model is shown in Figure 1. Moreover, the material properties are provided in Table 1 for milk and the bacterial biofilm. For the simulations, the relative permittivity levels of milk and biofilms were assumed to be 67.5 and 4, respectively [17,18]. For the milk tube model, the inner radius of the tube was 10.16 mm (Figure 1a), and the tube length was 1 m (Figure 1b). For the initial simulation, milk only was modeled; then, the simulation was repeated for a pipe wall biofilm thickness of 1 µm, as shown in Figure 1c. Please note that these simulations were carried out using a CST high-frequency solver with two simple RF input and output ports, as can be seen in Figure 1c. A mesh optimization study was carried out, and mesh cells of ≈550,000 were used to achieve the converged result.
Figure 2 shows the S11 for milk only and for milk and biofilm, where the black line shows the S11 without the biofilm and the red line shows the S11 with the biofilm. In Figure 2, the response of the S11 reflection coefficient to the presence of biofilms can be seen. The reflection coefficient changed substantially due to the presence of the biofilm on the pipe wall. The frequency for the minimum S11 shifted from 0.19 to 0.229 GHz, and the S11 amplitude decreased from −30 dB to −10 dB, which equates to a 100-fold change. This large change was due to the introduction of the biofilm, which changed the permittivity of the waveguide (in this case, the milk transportation tube). This result demonstrates the sensitivity of the reflection coefficient to biofilm formation. Further simulation work was also carried out, and the results demonstrated the sensitivity levels for different biofilm thicknesses. Figure 3 shows the S11 response for a biofilm thickness variation from 5 µm to 10 µm. From Figure 3, it can clearly be seen that the S11 frequency along with the amplitude change significantly with a variation from 0.82 GHz to 1.18 GHz in frequency and −78 dB to −105 dB in amplitude.
Figure 1. Milk transport pipe model. (a) cross-section. (b) Milk (blue)-filled pipe without biofilm. (c) Milk-filled pipe with layers of biofilm modeled (red) on the inside wall.
Applsci 14 04342 g001
Figure 2. Simulated reflection coefficient for a 0–1.5 GHz sweep frequency through a milk-filled pipe (black, bottom trace) or through a milk-filled pipe with a 1 µm thick biofilm along the entire inner wall (red, top trace). dB = decibels.
Applsci 14 04342 g002
Figure 3. Reflection coefficient responses of the simulated pipe model for various biofilm thicknesses. Only milk and biofilm thickness variations of 5 µm to 10 µm (noted as (1) to (5)) with a step value of 1 µm were simulated. A clearance difference in S11 was observed.
Applsci 14 04342 g003
Furthermore, to produce a more practical model, two dielectric patch antennas were designed and used for the simulation. Figure 4 shows the pipe model with the antenna. Two dielectric patch antennas were placed on the surface of the pipe at the two ends of the tube. Please note that zirconia material was used as the dielectric material, with a dielectric constant (εr) and loss tangent (tan δ) of 37 and 0.035, respectively.
Zirconia is known to have low interaction with bacterial biofilms [26,27]. One patch antenna was used as a transmitter and the other as a receiver. The simulation results when using the antennas showed a similar sensitivity to biofilms as the simple model described previously. From Figure 5, it can clearly be seen that the S11 frequency along with the amplitude change significantly, where a variation from 0.82 GHz to 1.18 GHz in frequency and −78 dB to −108 dB in amplitude can be observed. This slight change in the frequency can be attributed to the positions of the RF input and output ports and the electrical properties of the patch antenna. However, the sensitivity remains similar to the model with a simple port.

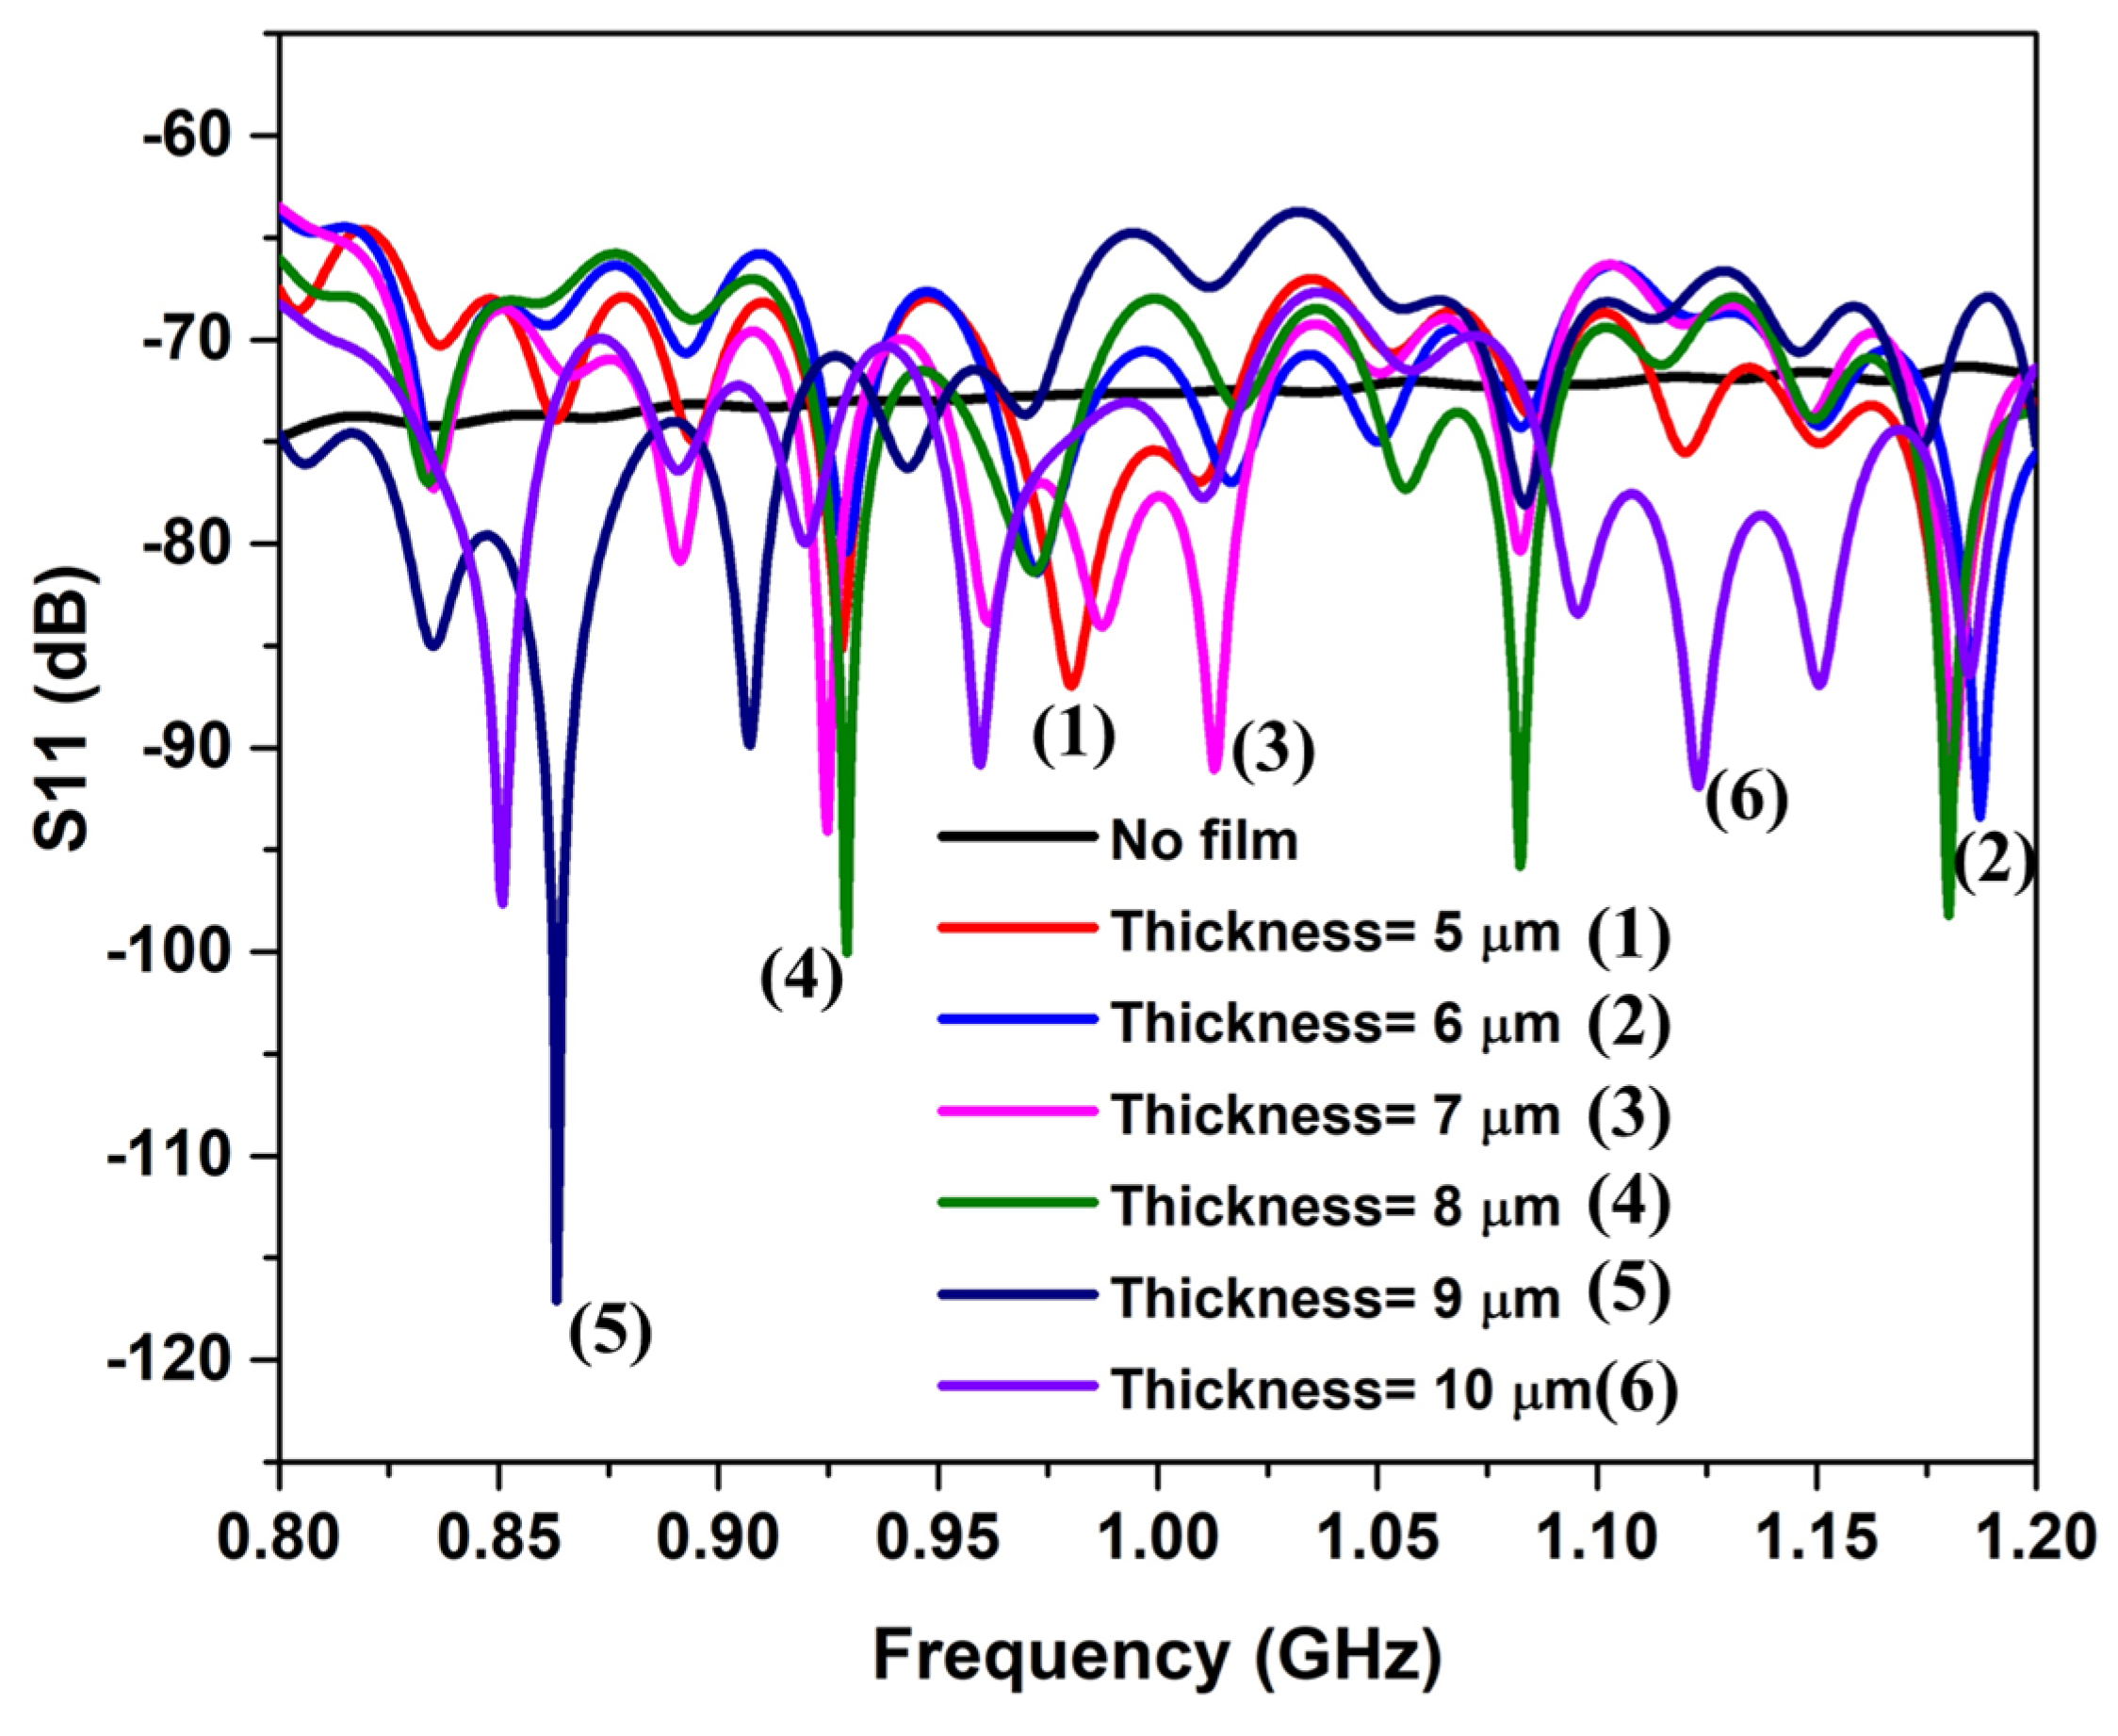
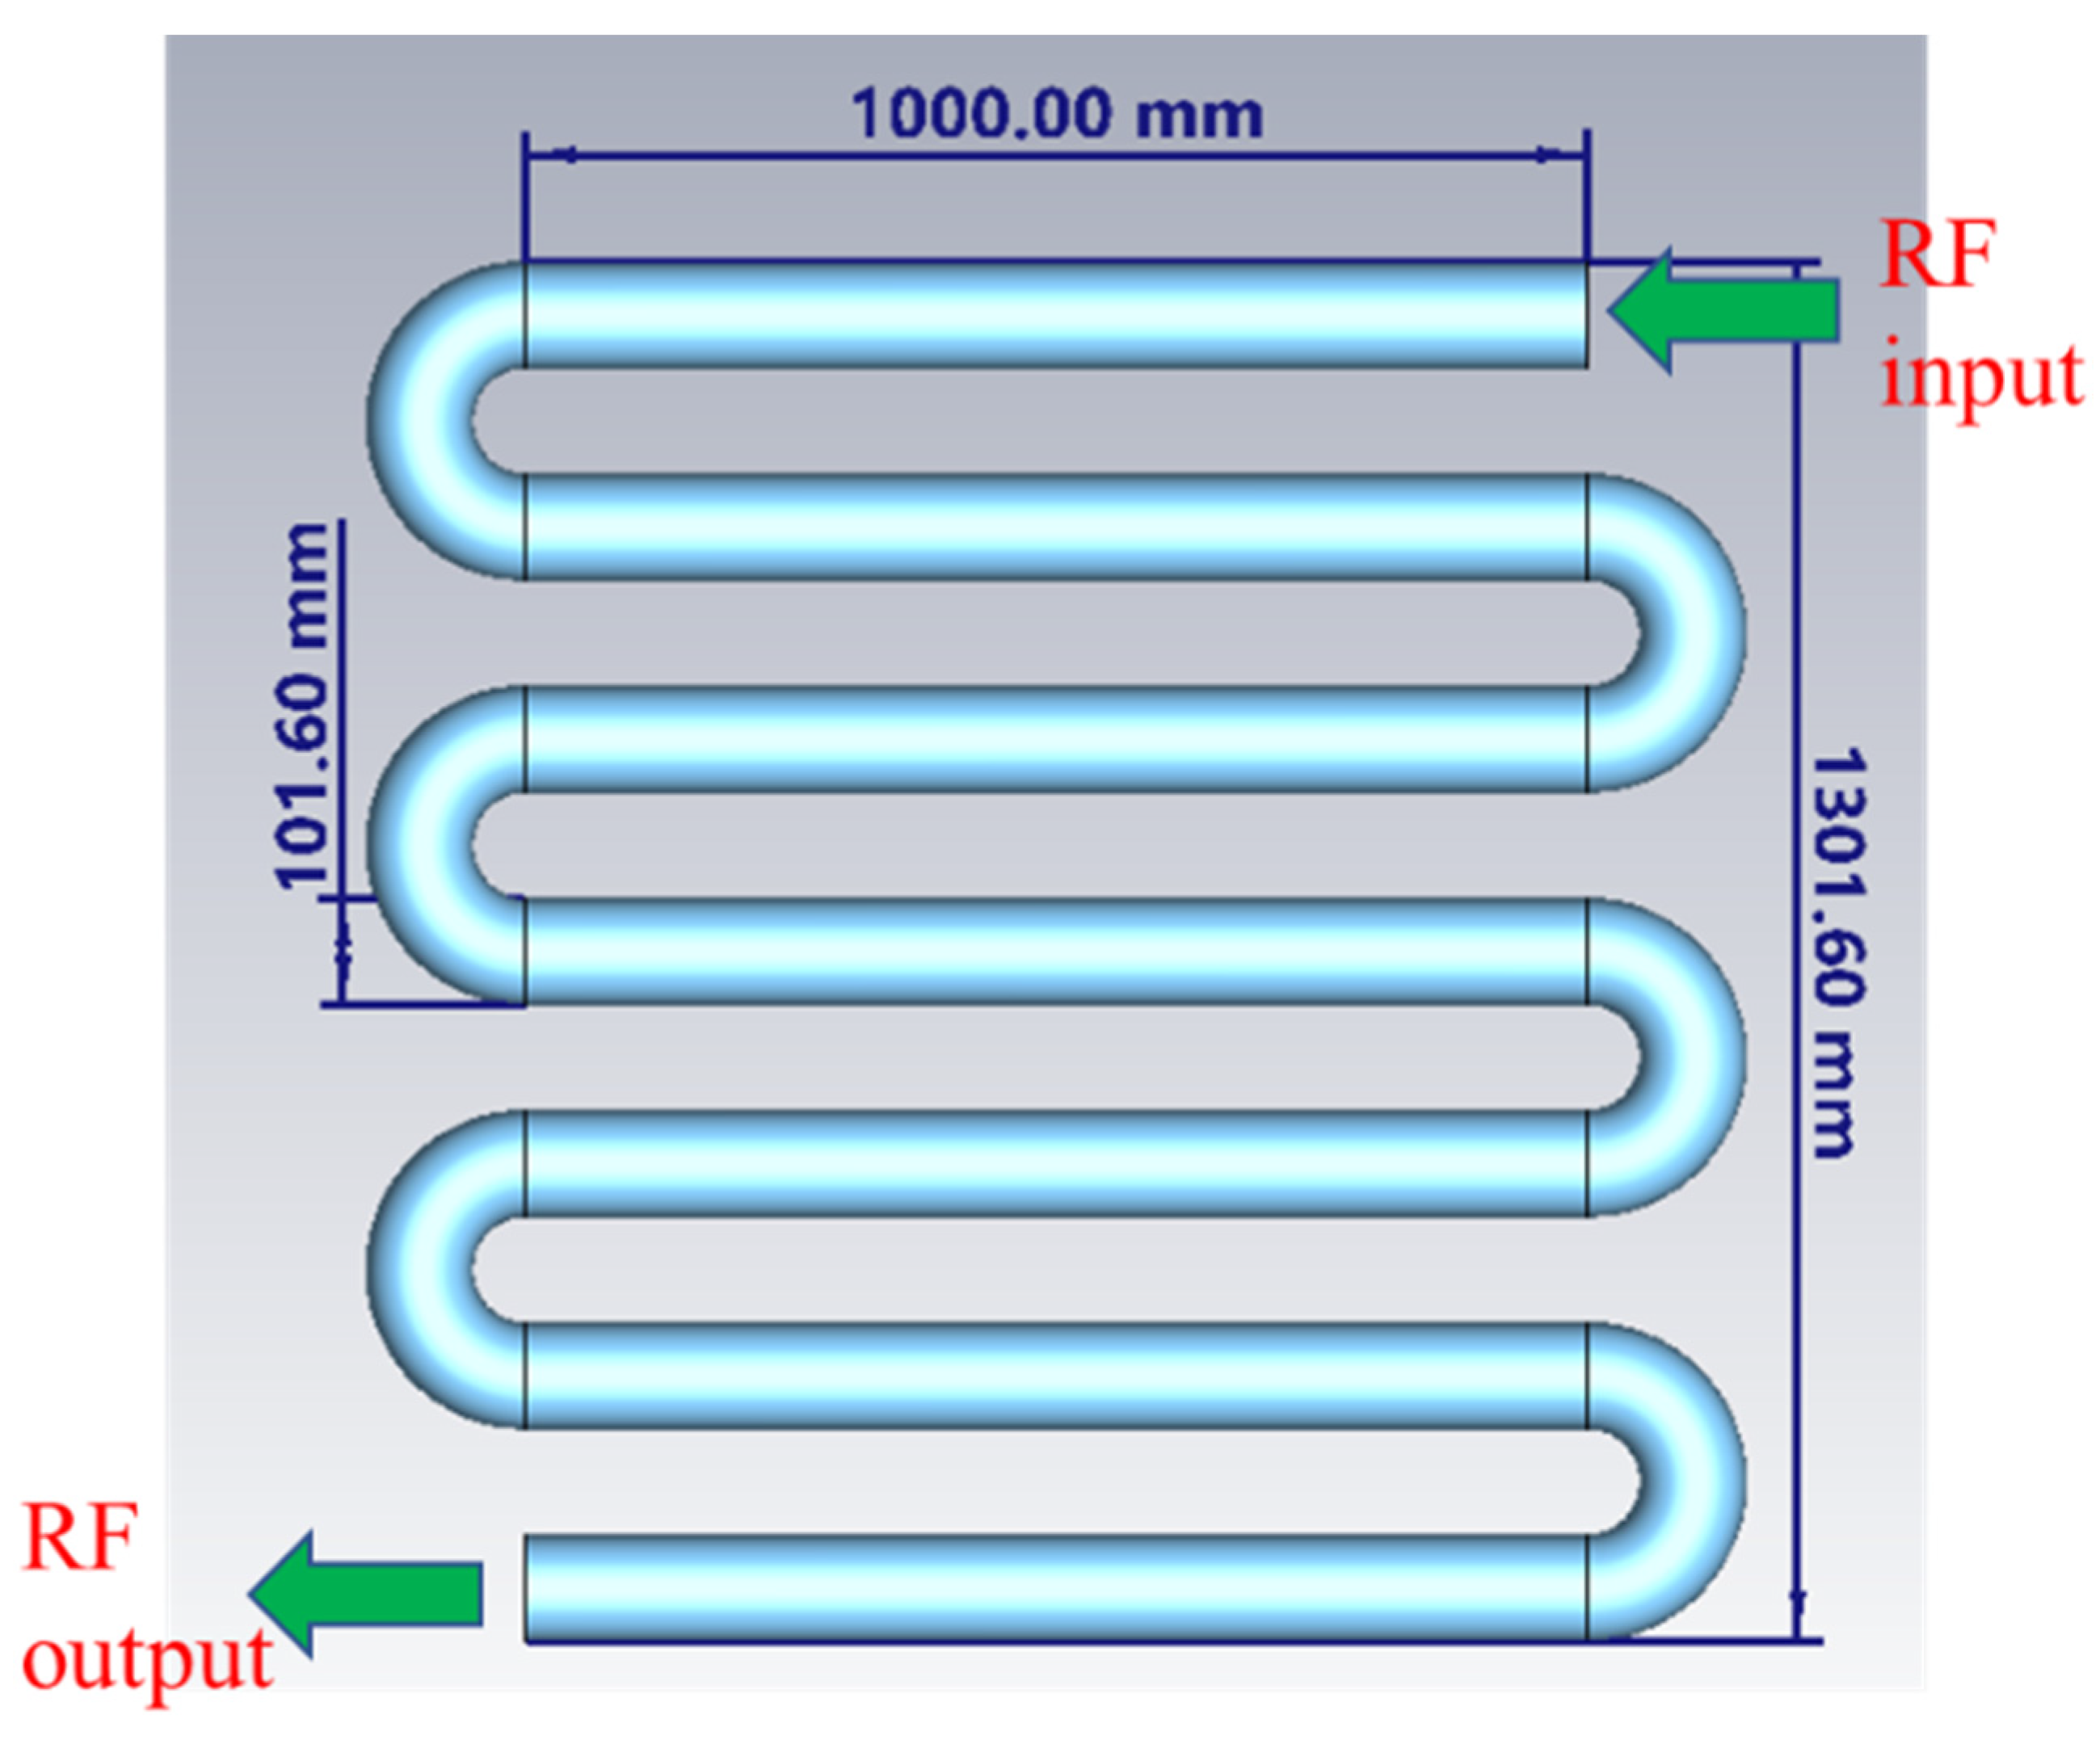
4.2. Milk-Filled Zigzag Holding Tube

Heat exchanger holding tubes provide a fixed volume of tubing to hold a product for a set period of time at a given flow rate. A holding tube simulation model was developed and simulated. The model can be seen in Figure 6.
The pipe diameter is 10.16 cm, and the total section is 1.3 m in length. A total of ≈3 million mesh cells were used for the simulation. Only milk and then biofilm thickness variations from 5 µm to 10 µm were used to determine the sensitivity. Figure 7 shows the S11 response of the model, and from the graph, it can clearly be seen that the S11 frequency changes from 0.85 GHz to 1.1 GHz and that the amplitude changes from −85 dB for only milk to −25 dB for different biofilm thicknesses.

4.3. Cavity Resonator

To model the milk pasteurizer, an eigenmode solver in CST was used, where the pasteurizer was assumed to be a cavity resonator with an oscillation frequency that varied with different biofilm thicknesses. Hence, the measurable variation in the resonance frequency indicated sensitivity to biofilm buildup. For the simulations, the relative permittivity levels of milk and biofilms were assumed to be 67.5 and 4, respectively, and the lost tangents were assumed to be 0.15 and 0.1, respectively (Table 1). These were used to determine the power dissipation along with conductivity. The data showed two important properties: (1) the permittivity of milk was >15 times higher than for typical biofilms and (2) the loss tangent was >1.33 times higher than for typical biofilms.
Figure 8 shows the 0.750 m × 0.17 m × 0.32 m rectangular pasteurizer model, where 50 compact fins can be seen inside the casing (Figure 8a). Figure 8b,c show the front view and dimensions of a single fin. The biofilms were modeled on the fin surfaces and inner walls of the case (total surface area ≈ 12.5 m2). Figure 8d,e show the case and an expanded view of the fins, respectively. Fins are 1 mm thick and the fin-to-fin gap is 1.5 mm.
Figure 9 shows the change in resonance frequencies, as calculated by the simulation for different biofilm thicknesses covering the walls and fins. From Figure 9, it can clearly be seen that when there is no biofilm and only milk is present, the resonance frequency is ~1.517 GHz. As the biofilm is introduced, the resonant cavity mode is affected, and the frequency shifts from 1.52 GHz to 1.545 GHz as the biofilm thickness on the walls and fins is increased from 1 to 10 µm at a step size of 1 µm.
The frequency shift is 24.5 MHz, which is easily measurable. Hence, the resonance frequency shift will provide a diagnostic for biofilm growth in a pasteurizer.

5. Conclusions

This paper has illustrated the potential of microwave sensing as a monitoring platform for a broad spectrum of commercial applications, with a focus on the system developed by the authors, namely, the real-time monitoring of bacterial biofilm growth in milk processing plants. While this paper has discussed the simulated performance of microwave sensors in milk processing plants, it is also important to remember the wide spread of application domains that may be covered. Furthermore, the microwave sensors demonstrated by the authors can be operated without the need for chemical reagents. Our simulations demonstrated that even a 1 µm thin biofilm shifted the frequency response of the milk transportation pipe, holding tubes, and pasteurizer. It is suggested that a novel approach to biofilm monitoring, namely using specially designed microwave cavity sensors, could lead to success in the development of an advanced platform capable of the real-time detection of a biofilm presence with superior sensitivity. The multipurpose nature of microwave sensors means that they lend themselves to many other future applications, not least those within emerging areas of interest.

Author Contributions

Methodology, R.B.; Validation, K.C. and J.B.; Formal analysis, R.B.; Investigation, R.B.; Writing—original draft, R.B.; Writing—review & editing, K.C. and J.B.; Supervision, K.C.; Funding acquisition, J.B. All authors have read and agreed to the published version of the manuscript.

Funding

This work was supported by IGEM HERC, “Food and Dairy Innovation Center at Boise State University” (2021–2024). This work was also supported by Centers of Biomedical Research Excellence (COBRE)—P20GM148321.

Data Availability Statement

The original contributions presented in the study are included in the article, further inquiries can be directed to the corresponding author.

Conflicts of Interest

The authors declare no conflict of interest.

References

  1. Champagne, C.P.; Laing, R.R.; Roy, D.; Mafu, A.A.; Griffiths, M.W.; White, C. Psychrotrophs in Dairy Products: Their Effects and Their Control. Crit. Rev. Food Sci. Nutr. 1994, 34, 1–30. [Google Scholar] [CrossRef] [PubMed]
  2. Flint, S.; Bremer, P.; Brooks, J. Biofilms in Dairy Manufacturing Plant-description, Current Concerns and Methods of Control. Biofouling 1997, 11, 81–97. [Google Scholar] [CrossRef]
  3. Bremer, P.; Seale, B.; Flint, S.; Palmer, J. Biofilms in Dairy Processing. Biofilms Food Beverage Ind. 2009, 396–431. [Google Scholar] [CrossRef]
  4. Fabres-Klein, M.H.; Caizer Santos, M.J.; Contelli Klein, R.; Nunes de Souza, G.; de Oliveira Barros Ribon, A. An Association between Milk and Slime Increases Biofilm Production by Bovine Staphylococcus aureus. BMC Vet. Res. 2015, 11, 3. [Google Scholar] [CrossRef]
  5. Bhosale, S.; Brahmane, P.; Kubade, A.; Desale, R. Biofilm in the Dairy Industry: Detection and Common Process for Control Biofilms. Pharma Innov. J. 2021, SP-10, 809–817. [Google Scholar]
  6. Nyfors, E.; Vainikainen, P. Industrial Microwave Sensors; Artech House Microwave Library: Sacramento, CA, USA, 1989; ISBN 0-89006-397-4. [Google Scholar]
  7. Korostynska, O.; Mason, A.; Al-Shamma, A. Monitoring of Nitrates and Phosphates in Wastewater: Current Technologies and Further Challenges. Int. J. Smart Sens. Intell. Syst. 2012, 5, 149. [Google Scholar] [CrossRef]
  8. Boon, J.D.; Brubaker, J.M. Acoustic-Microwave Water Level Sensor Comparisons in an Estuarine Environment; IEEE: Quebec City, QC, Canada, 2008; pp. 1–5. [Google Scholar]
  9. Bernou, C.; Rebière, D.; Pistré, J. Microwave Sensors: A New Sensing Principle. Application to Humidity Detection. Sens. Actuators B Chem. 2000, 68, 88–93. [Google Scholar] [CrossRef]
  10. Nacke, T.; Barthel, A.; Pflieger, C.; Pliquett, U.; Beckmann, D.; Göller, A. Continuous Process Monitoring for Biogas Plants Using Microwave Sensors; IEEE: Tallinn, Estonia, 2010; pp. 239–242. [Google Scholar]
  11. Bej, A.K.; McCarty, S.C.; Atlas, R. Detection of Coliform Bacteria and Escherichia Coli by Multiplex Polymerase Chain Reaction: Comparison with Defined Substrate and Plating Methods for Water Quality Monitoring. Appl. Environ. Microbiol. 1991, 57, 2429–2432. [Google Scholar] [CrossRef] [PubMed]
  12. Mason, A.; Wylie, S.; Thomas, A.; Keele, H.; Shaw, A.; Al-Shammaa, A. Hepa Filter Material Load Detection Using a Microwave Cavity Sensor. Int. J. Smart Sens. Intell. Syst. 2010, 3, 322–337. [Google Scholar] [CrossRef]
  13. Hascakir, B.; Acar, C.; Akin, S. Microwave-Assisted Heavy Oil Production: An Experimental Approach. Energy Fuels 2009, 23, 6033–6039. [Google Scholar] [CrossRef]
  14. Saeed, K.; Pollard, R.D.; Hunter, I.C. Substrate Integrated Waveguide Cavity Resonators for Complex Permittivity Characterization of Materials. IEEE Trans. Microw. Theory Tech. 2008, 56, 2340–2347. [Google Scholar] [CrossRef]
  15. Bossavit, A. Solving Maxwell Equations in a Closed Cavity, and the Question of ‘spurious Modes’. IEEE Trans. Magn. 1990, 26, 702–705. [Google Scholar] [CrossRef]
  16. CST Studio Suite 2020. Available online: https://www.3ds.com/products/simulia/cst-studio-suite (accessed on 19 May 2024).
  17. Nunes, A.; Bohigas, X.; Tejada, J. Dielectric Study of Milk for Frequencies between 1 and 20 GHz. J. Food Eng. 2006, 76, 250–255. [Google Scholar] [CrossRef]
  18. Muñoz, I.; Gou, P.; Picouet, P.A.; Barlabé, A.; Felipe, X. Dielectric Properties of Milk during Ultra-Heat Treatment. J. Food Eng. 2018, 219, 137–146. [Google Scholar] [CrossRef]
  19. Nielen, M.; Deluyker, H.; Schukken, Y.; Brand, A. Electrical Conductivity of Milk: Measurement, Modifiers, and Meta Analysis of Mastitis Detection Performance. J. Dairy Sci. 1992, 75, 606–614. [Google Scholar] [CrossRef]
  20. Norberg, E.; Hogeveen, H.; Korsgaard, I.; Friggens, N.; Sloth, K.; Løvendahl, P. Electrical Conductivity of Milk: Ability to Predict Mastitis Status. J. Dairy Sci. 2004, 87, 1099–1107. [Google Scholar] [CrossRef]
  21. Cho, H.-M.; Yoo, W.; Yoo, B. Steady and Dynamic Rheological Properties of Thickened Beverages Used for Dysphagia Diets. Food Sci. Biotechnol. 2012, 21, 1775–1779. [Google Scholar] [CrossRef]
  22. Zhu, X.; Guo, W.; Liang, Z. Determination of the Fat Content in Cow’s Milk Based on Dielectric Properties. Food Bioprocess Technol. 2015, 8, 1485–1494. [Google Scholar] [CrossRef]
  23. Dhar, B.R.; Sim, J.; Ryu, H.; Ren, H.; Santo Domingo, J.W.; Chae, J.; Lee, H.-S. Microbial Activity Influences Electrical Conductivity of Biofilm Anode. Water Res. 2017, 127, 230–238. [Google Scholar] [CrossRef]
  24. Checa, M.; Millan-Solsona, R.; Blanco, N.; Torrents, E.; Fabregas, R.; Gomila, G. Mapping the Dielectric Constant of a Single Bacterial Cell at the Nanoscale with Scanning Dielectric Force Volume Microscopy. Nanoscale 2019, 11, 20809–20819. [Google Scholar] [CrossRef]
  25. Boda, S.K.; Bajpai, I.; Basu, B. Inhibitory Effect of Direct Electric Field and HA-Z n O Composites on S. aureus Biofilm Formation. J. Biomed. Mater. Res. Part B Appl. Biomater. 2016, 104, 1064–1075. [Google Scholar] [CrossRef]
  26. Jaeggi, M.; Gyr, S.; Astasov-Frauenhoffer, M.; Zitzmann, N.U.; Fischer, J.; Rohr, N. Influence of Different Zirconia Surface Treatments on Biofilm Formation in Vitro and in Situ. Clin. Oral Implant. Res. 2022, 33, 424–432. [Google Scholar] [CrossRef]
  27. Pilz, M.; Staats, K.; Tobudic, S.; Assadian, O.; Presterl, E.; Windhager, R.; Holinka, J. Zirconium Nitride Coating Reduced Staphylococcus epidermidis Biofilm Formation on Orthopaedic Implant Surfaces: An in Vitro Study. Clin. Orthop. Relat. Res. 2019, 477, 461. [Google Scholar] [CrossRef]
Figure 4. Simulation model for pipe with dielectric patch antennas. Arrows represent in and out.
Applsci 14 04342 g004
Figure 5. Reflection coefficient responses of the simulation pipe model with patch antenna for various biofilm thicknesses. Only milk and biofilm thickness variations of 5 µm to 10 µm (noted as (1) to (5)) with a step value of 1 µm were simulated. A clearance difference in S11 was observed.
Applsci 14 04342 g005
Figure 6. Holding tube model. Biofilm layer is modeled on the inner wall of the pipe.
Applsci 14 04342 g006
Figure 7. S11 response of holding tube simulation model for various biofilm thicknesses. Only milk and biofilm thickness variations of 5 µm to 10 µm with a step value of 1 µm were simulated. A clearance difference in S11 was observed.
Applsci 14 04342 g007
Figure 8. Simulation model of pasteurizer modeled as a resonant cavity. (a) Side view of the rectangular pasteurizer with 50 heating fins in a milk-filled enclosure. (b) Front view of 315 mm wide pasteurizer. (c) Single fin with dimensions ~732 mm × 2 mm thick. (d) Fins are hidden inside the casing, and (e) an exfoliated view of the fins.
Applsci 14 04342 g008
Figure 9. Variation in resonance frequency of the pasteurizer model with biofilm thicknesses of 1 to 10 µm. Only milk and biofilm thickness variation of 1 µm to 10 µm with a step value of 1 µm was simulated. A clearance difference in resonance frequencies was observed.
Applsci 14 04342 g009
Table 1. Electrical property values of milk and biofilm used in the simulation.
MaterialElectrical Properties
Conductivity (S/m)Relative Permittivity (εr)Loss Tangent (tan δ)
Milk0.40~0.55 [19,20]67.5 [17,18]0.15~0.2 [21,22]
Biofilm0.09~0.1 [23]2~4 [24]0.1~0.15 [25]
Disclaimer/Publisher’s Note: The statements, opinions and data contained in all publications are solely those of the individual author(s) and contributor(s) and not of MDPI and/or the editor(s). MDPI and/or the editor(s) disclaim responsibility for any injury to people or property resulting from any ideas, methods, instructions or products referred to in the content.

