Abstract
Accurate control of the shield attitude can ensure precise tunnel excavation and minimize impact on the surrounding areas. However, neglecting the total thrust force may cause excessive disturbance to the strata, leading to collapse. This study proposes a Bayesian optimization-based temporal attention long short-term memory model (BOTA-LSTM) for multi-objective prediction and control of shield tunneling, including shield attitude and total thrust. The model can achieve multi-ring predictions of shield attitude and total thrust by allocating larger weights to significant moments through a temporal attention mechanism. The hyperparameters of the proposed model are automatically selected through Bayesian hyperparameter optimization, which can effectively address the issue of complex parameter selection and optimization difficulties in multi-ring, multi-objective tasks. Based on the predictive results of the optimal model, an intelligent control method that considers both shield attitude and total thrust is proposed. Compared to a method that solely predicts and corrects for the next ring, the proposed multi-ring correction method provides the opportunity for further adjustments, if the initial correction falls short of expectations. A shield tunneling project in Hangzhou is used to demonstrate the effectiveness of the proposed model. The results show that the BOTA-LSTM model outperforms the models without the integration of a temporal attention mechanism and Bayesian hyperparameter optimization. The proposed multi-ring intelligent correction method can adjust the shield attitude and total thrust to a reasonable range, providing references for practical engineering applications.
1. Introduction
Shield tunneling is widely used in subway tunnel construction as an efficient and convenient method for use in urban areas [1,2]. However, poor shield movement performance can result in ground settlements, decreased tunnel construction quality, and deviations in shield attitude. To minimize risks during the shield tunneling process, accurately predicting shield movement performance, such as shield attitude and total thrust, is extremely crucial [3].
It is important for a shield machine to proceed along the designed axis. However, due to the complex geological conditions, such as the variation of rock hardness within a tunnel section, the shield machine may be subjected to uneven forces. These uneven forces can cause the shield machine to deviate from the designed axis. Currently, the control of shield attitude mainly relies on manual operation, which can result in snake tracking and deviations due to delayed adjustments [4]. Therefore, it is necessary to develop a method that not only accurately predicts the deviations in shield attitude but also intelligently adjusts the attitude based on these predictions.
Data-driven machine learning has attracted attention in geotechnical engineering due to its powerful data processing ability [5,6,7,8,9,10]. Among various machine learning algorithms, recurrent neural networks (RNNs) are generally proven to be the most effective method for time-series problems like shield movement performance prediction [11,12,13,14,15,16]. For the shield attitude prediction, Zhou et al. [17] proved the accuracy of an LSTM-based model in predicting the attitude and position of the shield machine. Xiao et al. [18] introduced an innovative approach for predicting the shield attitude. Their method employs a combination of a gated recursive unit (GRU) algorithm and adaptive boosting, utilizing data gathered from five earth pressure balance shield machines. Shen et al. [19] used wavelet transform to reduce the data noise and employed the Adam-optimized LSTM for real-time prediction of shield attitude. Fu et al. [20] developed a deep learning model that integrates the graph convolutional network and LSTM model to predict deviations in the tail section of shield machines. Although existing research has already successfully predicted shield attitudes for the next 1 to 10 s, the operation and adjustment of shield machines typically require a longer timeframe [21,22]. Predictions made within 10 s or less may not provide operators with sufficient reaction time for effective adjustments. In addition, few existing studies consider the multi-ring shield attitude prediction, but it is crucial and useful in engineering practice because multi-ring shield attitude prediction can help operators develop a reasonable long-term plan and prevent frequent corrective interventions. Kang et al. [23] proposed an LSTM-attention model to predict shield attitude. They proved that the attention mechanism can enhance the accuracy of LSTM in predicting the shield attitude of the next ring. Inspired by the method, this study constructs a temporal attention-LSTM model to achieve multi-ring shield attitude prediction.
The total thrust is another key indicator that directly reflects the shield movement performance [24,25,26,27,28,29]. Gao et al. [30] used LSTM and GRU to predict six parameters of tunnel boring machines, including torque, thrust, etc. Lin et al. [31,32] developed hybrid models based on particle swarm optimization (PSO) and RNNs to predict the torque and thrust. During the shield tunneling process, the shield attitude and total thrust are interdependent, and an inappropriate total thrust can potentially result in deviations in shield attitude [33]. More seriously, neglecting control of the total thrust during the shield attitude adjustment process may lead to the collapse of soft rock ahead of the shield advancement. Therefore, in order to control the shield attitude within a reasonable range under complex geological conditions, it is necessary to predict both the shield attitude and total thrust. In addition, for the temporal attention-LSTM model, the selection of hyperparameters is particularly challenging due to the numerous hyperparameters involved and the increased complexity in multi-ring prediction scenarios. The manual tuning process lacks rigor and does not guarantee that the model achieves optimal performance. Therefore, Bayesian optimization is chosen to optimize the model because it can reach the optimal solution more quickly by automatically selecting the hyperparameter combinations and considering the loss values from previous steps [34,35,36].
This paper proposes a Bayesian optimization-based temporal attention-LSTM model (BOTA-LSTM) to predict the multi-ring shield attitude and total thrust. The main contributions of this study in shield attitude prediction and correction are as follows. First, the model achieves the multi-ring shield attitude and total thrust prediction by incorporating the temporal attention mechanism, which provides sufficient time for decision makers to draw up a reasonable attitude correction plan. Second, based on the multi-ring prediction results, an intelligent correction method is developed, considering both the shield attitude and total thrust. This method enables more effective control of the shield attitude and prevents excessive thrust that could lead to tunnel collapse. The proposed multi-ring correction method also allows for further adjustments, if the initial correction does not meet expectations. Moreover, the hyperparameters of the proposed model are automatically selected through Bayesian hyperparameter optimization, which can effectively address the issue of complex parameter selection and optimization in multi-ring and multi-objective tasks.
2. Methodology
This section first introduces two commonly used recurrent neural networks for shield tunneling, LSTM, and GRU, and briefly explains the differences between them. The one that exhibits the best performance for the studied problem will serve as a benchmark model for developing and evaluating a new model. After choosing the benchmark model (i.e., LSTM), an attention-LSTM model is then constructed by integrating the temporal attention mechanism into the LSTM model. The hyperparameter tuning, based on the Bayesian optimization, is described in detail. Finally, the overall flowchart of the proposed method is presented.
2.1. Benchmark Model
The LSTM model and the GRU model are both variants of RNN, which both excel in handling time series problems, and therefore, are considered the benchmark models for this study. LSTM addresses the issues of vanishing and exploding gradients in RNN by selectively remembering information through input gates, output gates, forget gates, and memory cells [37,38], as shown in Figure 1a. Specifically, when data enters an LSTM unit, it first encounters the input gate it and the forget gate ft. The input gate decides how much new input information should be incorporated into the cell state ct, while the forget gate determines how much of the old information should be retained or discarded. The operations of these gates are based on the current input xt, the previous hidden state ht−1, and the previous cell state ct−1. Then, the cell state ct is updated, combining new information and forgotten old information, as determined by the input and forget gates. Finally, the output gate ot, based on the updated cell state and the previous hidden state, decides the final output ht, which is used for the next time step or LSTM unit.
where σ denotes the sigmoid function and tanh represents the hyperbolic tangent function; xt, ht, and Ct represent the current input, hidden state, and cell state, respectively; represents the Hadamard product; Wxi, Wxf, Wxc, Wxo, Wci, Wcf, Wco, Whi, Whf, Whc, and Who represent the weight matrices; and bi, bf, bc, and bo denote the bias terms. Based on LSTM, GRU simplifies the forget gate and output gate into an update gate zt, and combines the cell state with the hidden layer into a reset gate rt [39], as shown in Figure 1b, where represents the candidate vector, and “1–” signifies the operation of subtracting the output of the update gate zt from 1, which is used to calculate the proportion of old information in the new hidden state.
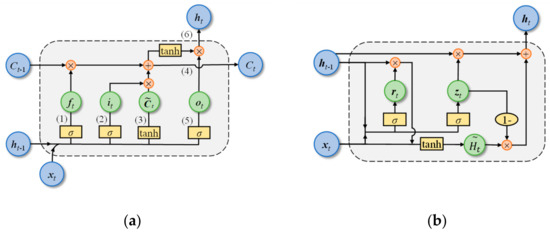
Figure 1.
Model structure of (a) LSTM, (b) GRU.
2.2. Temporal Attention-LSTM Model
The temporal attention mechanism [40] can improve the model performance in multi-step forecasting by identifying the more critical time points in the input sequence and assigning larger weights to these more critical points [41]. A temporal attention-LSTM model is developed in this study to achieve multi-ring shield attitude predictions. Figure 2 depicts the temporal attention-LSTM structure. Specifically, the data stream of shield construction parameters for different rings is fed into the input layer as the input sequence xt. The data of each ring is processed through the LSTM layer, which captures the long-term dependencies in the time series and outputs a series of hidden states ht. Then, the temporal attention layer assesses the hidden state of each ring and calculates its attention score st, which is normalized to weights between 0 and 1 by the softmax function, leading to the temporal weight wt. The weights are then multiplied by the hidden states to obtain the context vectors ct. All context vectors are combined into a global context vector call, which is processed through a dense layer to produce the final prediction Y. Through this process, the temporal attention-LSTM model can dynamically focus on the ring in the sequence which contributes more significnatly to the final prediction, leading to a reasonable multi-ring shield attitude prediction.
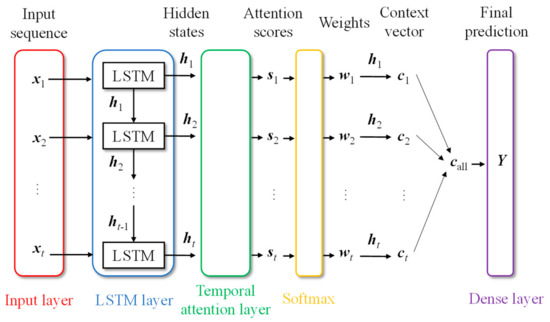
Figure 2.
Temporal attention-LSTM model.
2.3. Bayesian Optimization-Based Temporal Attention-LSTM Model
The training of a temporal attention-LSTM model involves a variety of hyperparameters. An appropriate tuning of hyperparameters is crucial for achieving the optimal predictive performance of the model [42]. Current hyperparameter optimization algorithms include grid search (GS), random search (RS) [43], genetic algorithm (GA) [44], particle swarm optimization (PSO) [45], and Bayesian optimization (BO) [46]. Among them, GA, PSO, and GS are inefficient for the hyperparameter tuning of neural network models due to the vast number of hyperparameters involved [47]. RS randomly selects hyperparameter combinations in the hyperparameter space, but due to its random nature, it may not always find the most optimal hyperparameter settings, potentially missing better solutions. Unlike other methods, Bayesian hyperparameter optimization adjusts and guides the search for hyperparameters based on the results of the previous performance of the loss function. It predicts which hyperparameter combinations might yield better results by analyzing the performance of existing trials, making the search process for the global optimum more efficient [48,49]. As shown in Figure 3, the Bayesian hyperparameter optimization process for a temporal attention-LSTM model begins with the initialization of the hyperparameter space, where the range of possible values for each hyperparameter is defined. Hyperparameter space includes the number of LSTM units, learning rate, batch size, and attention units. After the temporal attention-LSTM model is trained and evaluated with these hyperparameters, it generates a series of results that reflect the model performance. Then, the tree-structured Parzen estimator (TPE) method is applied to optimize and select a new set of hyperparameters for further training and evaluation. The training results are used to build two probability models that estimate the probability of attaining either better or worse predictive results with a new hyperparameter set. The calculated probability ratio, derived from dividing the probability of achieving better predictive performance by the probability of worse predictive performance, guides the selection of hyperparameters. Hyperparameter combinations with a higher probability ratio are prioritized for the next iterative training and evaluation of the model. This iterative process continues until a preset maximum number of iterations is reached and the optimal hyperparameter combination is obtained.
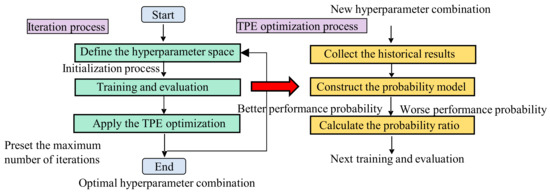
Figure 3.
Bayesian optimization-based temporal attention-LSTM model.
2.4. Flowchart of the Proposed Method
The proposed method for predicting and adjusting shield movement performance mainly consists of four steps: data preparation, model construction, model evaluation, and shield attitude correction, as shown in Figure 4. During the data preparation process, the shield construction parameters can be categorized into operational parameters and standardized stratum parameters. Operational parameters are sourced from sensors installed on the shield machine equipment, and the typical shield operational parameters include the shield attitude, total thrust, and torque. Standardized stratum parameters are determined from in situ tests and laboratory experiments. Based on engineering experience and the existing literature, the parameters that have a significant influence on the total thrust and shield attitude are selected. Following this, box analysis is used to identify outliers, Daubechies wavelet transform is applied for data noise reduction, and Pearson correlation analysis is employed to explore the interrelationships between each parameter and its impact on both shield attitude and total thrust. During the model construction process, the data is split into a training set and a testing set in a 7:3 ratio for the training and testing of the BOTA-LSTM model. The BOTA-LSTM model, utilizing a temporal attention mechanism, achieves multi-ring predictions for shield attitude and total thrust, and employs Bayesian hyperparameter optimization to obtain the optimal predictive model. In the model evaluation phase, the effectiveness of the BOTA-LSTM model and the effect of Bayesian hyperparameter optimization is evaluated using the coefficient of determination (R2) and root mean square error (RMSE). Additionally, the performance of GRU and LSTM models is compared to determine which is more suitable as the benchmark model for this study. Finally, based on the multi-ring predictions of shield attitude and total thrust, an intelligent method for shield attitude correction is proposed.
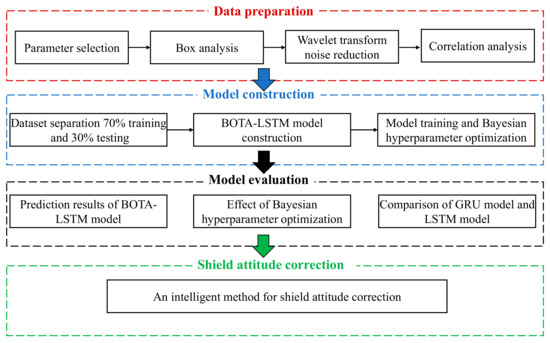
Figure 4.
Flowchart of the proposed method.
3. Case Study
3.1. Project Overview
The proposed prediction model is illustrated and validated using a shield tunneling project in Hangzhou. Figure 5 depicts the project layout. The total length of the twin tunnels is about 2.65 km, using a large diameter mud–water balance shield machine for construction. The shield segment is divided into north and south lines, with the south line shield starting from the 2# working shaft and ending at the 3# working shaft. The starting mileage is K1+544, and the ending mileage is K2+776, with a single-line tunnel length of 1232 m and a total of 617 rings. The tunnel has an excavation diameter D of 15.0 m. The outer diameter douter, inner diameter dinner, and thickness of the tunnel lining segments are 14.5 m, 13.3 m, and 0.6 m, respectively. The maximum overburden is 21.9 m. There are six zones in total, labeled as zone A# to zone F#.
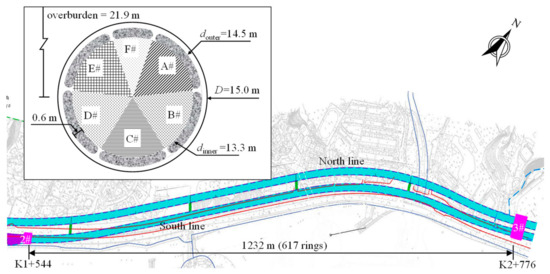
Figure 5.
Project layout.
3.2. Parameter Selection
The output and input parameters are summarized in Table 1 and Table 2, respectively. The selection of input parameters is based on engineering experience and previous studies on shield tunneling [5]. The key concerns for operators include the cutter rotational speed and the advance rate. The cutter rotational speed refers to the number of revolutions the cutterhead completes per unit of time. This should be set within a suitable range to ensure that the shield machine can effectively cut the palm surface. If not, the shield machine may fall into an unstable condition. The advance rate is the distance that the shield machine tunnels per unit of time, with excessively fast advance rates potentially resulting in a loss of control over the shield attitude. The total thrust refers to the force used by the shield machine to overcome various resistances along the moving path. The torque is the rotational force generated by the cutterhead of the shield machine. An inappropriate total thrust and torque may result in deviations of the shield attitude. The oil pressure is the hydraulic pressure, which is directly used to control the shield attitude. In addition, the jack stroke, grouting quantity, and slurry inlet flow may also affect the shield attitude. Hence, the above influential factors are chosen as input parameters.

Table 1.
Output parameters.

Table 2.
Operational parameters.
3.3. Data Standardization and Preprocessing
3.3.1. Standardization of Stratum Parameters
The stratum parameters reflect the physical and mechanical properties of soil or rock. Therefore, these parameters must be considered [50,51]. As shown in Figure 6, the shield machine traversed various strata. The values of stratum parameters vary across different soil strata. In machine learning models, the ideal scenario is that the input for each ring involves parameters from only a single stratum. However, the reality is more complex. During the shield tunneling process, each ring segment may encounter varying amounts and thicknesses of soil layers. For example, ring 303 might traverse two layers of soil with different thicknesses, while ring 253 may pass through just one layer. Such variability results in dimensional inconsistencies in the input data. To solve this problem, the weighted average of the main stratum parameter values is used to define the stratum parameters input to the model [35], with the following equation.
where k is the number of layers, ti represents the thickness of the ith soil layer, θ denotes the stratum parameters, and β denotes the weighted average of the stratum parameter values, as shown in Table 3.
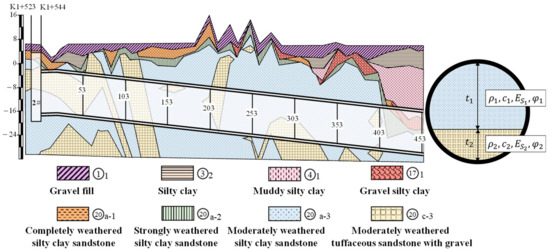
Figure 6.
Geological profiles of the studied project.

Table 3.
Standardized stratum parameters.
3.3.2. Data Preprocessing
Effective data preprocessing is important to ensure data quality and model performance [52]. The data preprocessing in this study includes box plot analysis and data denoising. The outliers in shield attitude and total thrust obtained using the box analysis method are shown in Figure 7. The solid line in the center of the box plot represents the median of the measurements. The bottom and top of the box correspond to the lower quartile (one-fourth of the measurements are smaller than these) and upper quartile (one-fourth of the measurements are larger than these), respectively. The upper and lower bounds indicate the maximum and minimal values. The box plot analysis results for shield attitudes in HDSH, HDST, VDSH, and VDST are displayed in Figure 7a. The result for total thrust is presented in Figure 7b. Specifically, the data for HDSH and HDST are mostly concentrated around 0 mm, and the majority of VDSH data is located around –50 mm, which is the warning value for shield attitude deviation. The outliers for HDSH and HDST are significantly more than for VDSH and VDST, and most of these outliers far exceed the warning range of ±50. Therefore, some corrective measures should be employed to adjust these attitudes to bring them within a reasonable range.

Figure 7.
Output parameter processing based on the box analysis method: (a) shield attitude; (b) total thrust.
Since the data recorded by the shield machine is affected by interference from surrounding construction activities and noise due to mechanical vibrations, the Daubechies wavelet [53] is used for denoising the raw data [17]. The main parameters that influence the effect of wavelet denoising include the wavelet basis function and the number of decomposition layers. Specifically, the number of decomposition layers is generally set to 5–8 because too few layers may not effectively eliminate the noise, while too many layers may lose information. In this study, the number of wavelet layers is set to 6. The Daubechies wavelet family consists of 10 wavelet basis functions, i.e., from Daubechies 1 (db1) to Daubechies 10 (db10). As shown in Figure 8a, this study uses the mean square error (MSE) to evaluate the denoising effect of each wavelet basis function and selects the optimal wavelet basis function (taking advance rate as an example). The MSE equation is defined as:
where yi is the value of raw data, is the value of denoised data, and n is the number of data points. The MSE indicator represents the error between the raw data and the denoised data. When the db7 wavelet basis function is used, the denoised data exhibits the smallest discrepancy with the raw data [Figure 8a]. The denoised data is smoother than the raw data [Figure 8b]. These results show that the db7 wavelet-based function can remove the noise, while maximizing the retention of the raw data information. Finally, to accelerate model convergence and to constrain the range of each feature value within [−1, 1], the min-max normalization method is used.
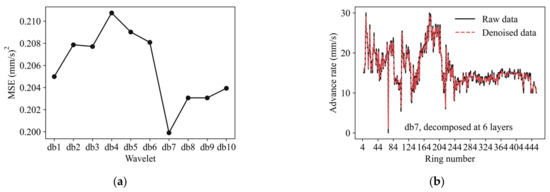
Figure 8.
Denoising of advance rate. (a) MSE (mm/s)2 of different db wavelet-based functions for advance rate and (b) comparison of raw data and denoised data.
3.4. Data Standardization and Preprocessing
The Pearson correlation coefficient is used to analyze the correlation between the shield tunneling construction parameters, as shown in Figure 9. According to the classification provided by Evans [54], correlations are categorized as very weak (0 to 0.2), weak (0.2 to 0.4), moderate (0.4 to 0.6), and strong (0.6 to 0.8). Notably, there is a strong correlation between HDST and HDSH (0.75) and a very weak correlation between HDSH and VDSH (0.04), indicating that shield attitude correlations are stronger within the same category of horizontal shield attitude. The correlation between vertical shield attitude parameters (VDST and VDSH) is weak (0.35), which is lower than that of the horizontal shield attitude parameters (HDST and HDSH). The possible reason for this is that the shield machine traverses a soft upper and hard lower stratum, resulting in more complexity in the vertical attitude compared to the horizontal attitude. In addition, it is noted that the total thrust shows a moderate correlation with the oil pressure in all six divisions (A#, B#, C#, D#, E#, F#), with similar correlation values ranging from 0.48 to 0.53. This is because the total thrust is provided by the total oil pressure in each division.
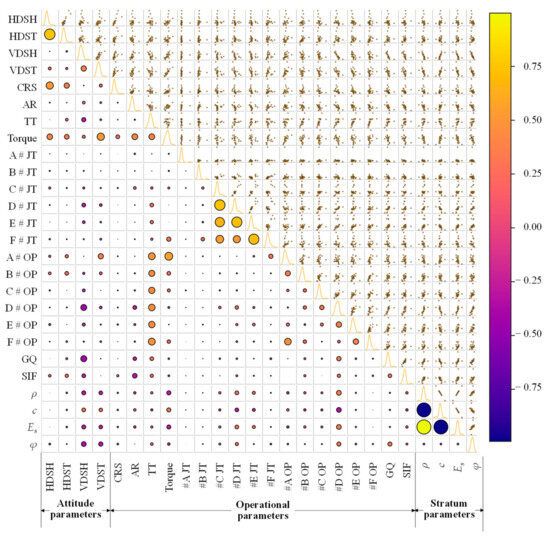
Figure 9.
Correlation coefficient of shield tunneling construction parameters.
3.5. Bayesian Hyperparameter Optimization for Temporal Attention-LSTM Model
The dataset selected for this paper is from ring 4 to ring 453 of the south line of the shield tunneling project. The first 70% of the dataset is the training set, and the last 30% is the testing set. The last 20% of the training set is used as the validation set for hyperparameter tuning. Bayesian optimization is used to automatically select hyperparameters for the temporal attention-LSTM model. As shown in Table 4, the hyperparameters include “LSTM unit”, “dropout”, “learning rate”, “batch size”, and “attention unit”. Specifically, the “LSTM unit” represents the hidden units in the LSTM network, which are the core components of the LSTM, and they are used to process, memorize, and transfer information. Dropout randomly turns off some units of the LSTM model with a certain probability p (usually between 0.1 and 0.5) to prevent the overfitting of the model. The learning rate controls the update rate of the model weights during the training process. If the learning rate is set too high, the model may hover around the optimal solution and fail to converge, while if the learning rate is set too low, the training process may be very slow and may fall into a local optimum. The “batch size” refers to the number of samples processed together during one training. A total of 500 epochs are used for each optimization search. One epoch means that the entire training dataset is trained once. The “input sequence length” refers to the number of historical data points utilized in predicting future values. The “attention unit” represents the number of neurons in the attention layer. These units are used for computing the attention weights, which help the model focus on the most relevant parts of the input data. The “patience” is set to 40, which means that if the model loss does not decrease for 40 epochs, then the training stops. The MSE (mean squared error) is selected as the Bayesian optimization evaluation metric, and the best score is 0.00416.

Table 4.
Bayesian hyperparameter optimization results for temporal attention-LSTM.
The root mean square error (RMSE) and the coefficient of determination (R2) are used to evaluate the model prediction results. The RMSE measures the errors between the predictions and measurements, which are on the same scale as the measurements. If there are several points with large errors, the value of RMSE tends to be higher. The R2 is mainly used to evaluate the degree of fit between the predicted values and measurements. The value of R2 usually ranges from 0 to 1. A value equal to 1 indicates that all predicted values exactly match the measurements, while a value equal to 0 indicates that the performance of the model is equivalent to simply using the mean of the measurements as the predicted values.
where m is the total number of samples, yi denotes the measurements, is the model prediction, and denotes the mean of the measurements.
4. Results
This section aims to validate the effectiveness of the proposed BOTA-LSTM model by comparing it with a manually tuned temporal attention-LSTM (TA-LSTM) model and a Bayesian optimization-based LSTM (BO-LSTM) model. The prediction results of the BOTA-LSTM model for single and multiple rings are presented first. The effect of the temporal attention mechanism is studied by comparing the performance of the BOTA-LSTM model and the BO-LSTM model. After that, the impact of Bayesian hyperparameter optimization on the performance of the temporal attention-LSTM model is explored. Moreover, a quantitative comparison between two commonly used recurrent neural networks for shield tunneling, LSTM and GRU, is also presented to explain why LSTM is selected as the basic model for developing the multi-ring prediction model in this study.
4.1. Prediction Results of BOTA-LSTM Model
Figure 10 shows the predictive performance of the proposed BOTA-LSTM model on a single ring. The model exhibits high consistency between predicted and monitored values during the training phase, which indicates that the model can capture the characteristics well. In the testing phase, the model shows a better fit for horizontal attitudes than vertical attitudes, with a noticeable decline in vertical attitude prediction accuracy between rings 400 and 453. This decline, as illustrated in Figure 5, is attributed to the shield machine encountering a complex stratum, which complicates the prediction of vertical attitude. Table 5 displays the high R2 values for the training set, indicating high predictive accuracy for HDSH, HDST, VDSH, VDST, and total thrust. Moreover, the RMSE values are also relatively low, which further confirms the good performance of the model on the training set. Table 6 presents the testing set results. For HDSH, HDST, VDST, and total thrust, the R2 values are still high at 0.94, 0.93, 0.85, and 0.83, respectively. However, for VDSH, the R2 value drops significantly to 0.76. The reason is that VDSH exhibits more frequent fluctuations compared to the other three types of attitudes, making it more challenging to predict. However, it is noted that the RMSE for VDSH on the testing set is still relatively low, indicating that the prediction of vertical attitude is still acceptable.
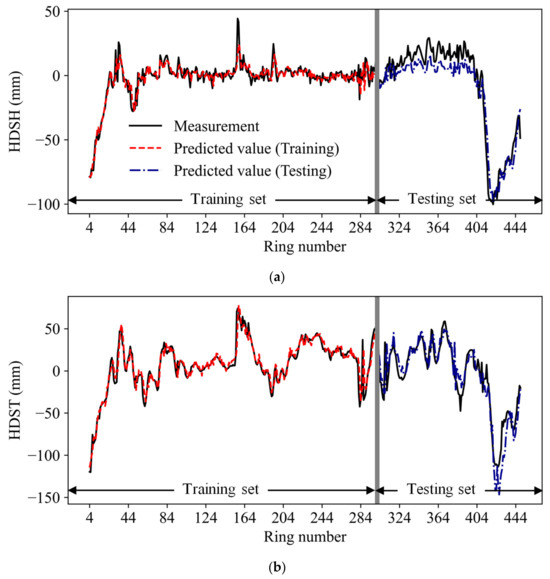
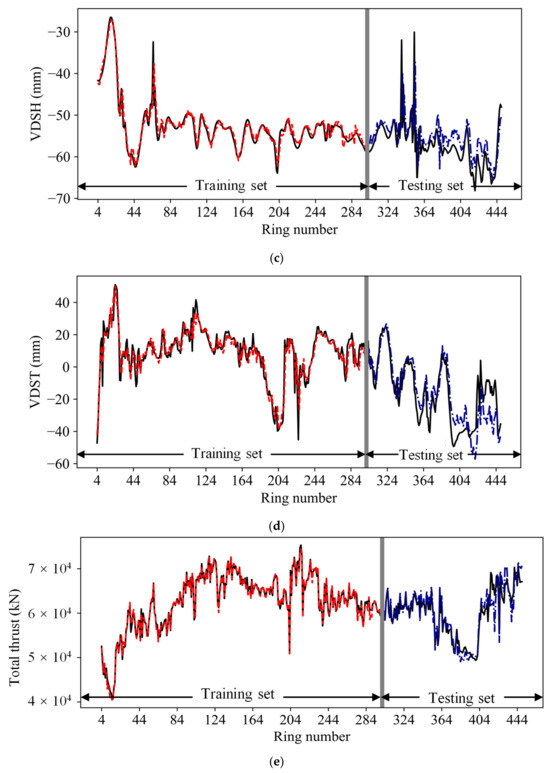
Figure 10.
Prediction results of BOTA-LSTM model. (a) HDSH, (b) HDST, (c) VDSH, (d) VDST, and (e) total thrust.

Table 5.
Prediction results of BOTA-LSTM model (training set).

Table 6.
Prediction results of BOTA-LSTM model (testing set).
The multi-ring prediction of shield attitude can provide decision makers with sufficient time to develop a reasonable plan. Figure 11 shows the multi-ring shield attitude prediction of the BOTA-LSTM model. In terms of R2 and RMSE, the prediction accuracy of the model shows a gradual decline in the first five rings, followed by a more rapid decrease. The prediction accuracy of the fifth ring can still be considered to reach a satisfactory level, which can provide some reference for engineering decision making. Therefore, the outputs within five rings are selected as the final prediction results. In Section 5, the multi-ring prediction model is applied to achieve shield attitude correction. To demonstrate the multi-ring prediction accuracy of the proposed BOTA-LSTM model, the Bayesian optimization-based LSTM model (BO-LSTM) is introduced for comparison, with results shown in Table 7 and Table 8. The hyperparameter settings of the BO-LSTM model, except for the absence of an attention unit, possess the same domain as the BOTA-LSTM for the other hyperparameters, as shown in Table 3. Specifically, the LSTM unit is 191, the dropout is 0.23, the learning rate is 0.013, and the batch size is 209. The comparison results show that the proposed BOTA-LSTM model outperforms the BO-LSTM model in terms of R2 across different tasks and rings. This demonstrates that the BOTA-LSTM mode can identify more critical moments in the time series and allocate more weight to these moments, thereby achieving more accurate predictions of multi-ring shield attitudes.
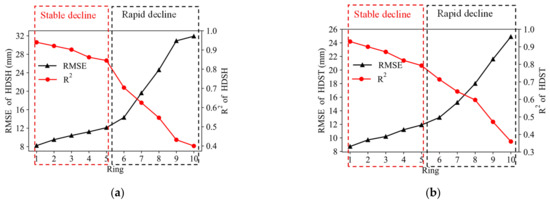
Figure 11.
Multi-ring prediction of the BOTA-LSTM model: (a) HDSH and (b) HDST.

Table 7.
Comparison of multi-ring HDSH predictions between BOTA-LSTM and BO-LSTM models in terms of R2.

Table 8.
Comparison of multi-ring HDST predictions between BOTA-LSTM and BO-LSTM models in terms of R2.
4.2. Effect of Bayesian Hyperparameter Optimization
The effect of Bayesian hyperparameter optimization is demonstrated through a comparison between a manually tuned temporal attention-LSTM (TA-LSTM) model and a model tuned by Bayesian optimization. Table 9 and Table 10 show the effectiveness of Bayesian hyperparameter optimization on the R2 and RMSE metrics. Overall, the BOTA-LSTM model outperforms the manually tuned model in predicting all five shield construction parameters, which indicates that the BOTA-LSTM model can achieve optimal prediction results in all five shield construction parameters. Specifically, in terms of the R2 evaluation metric (Table 8), the BOTA-LSTM model shows a modest improvement in prediction performance for HDSH (from 0.84 to 0.94) and total thrust (from 0.76 to 0.83), and a significant improvement for VDSH (from 0.53 to 0.76). This variation indicates that Bayesian optimization has varying effects on different tasks, but it always improves the prediction performance. In addition, compared to manual tuning, Bayesian hyperparameter optimization tends to be more efficient in finding good hyperparameter combinations, thus saving time and resources. Manual tuning usually takes a lot of time and relies heavily on the experience and intuition of the researcher. Although experienced researchers may obtain acceptable prediction results in a relatively short time, this method usually possesses large uncertainties and may only find locally optimal solutions.

Table 9.
Comparing manual tuning and Bayesian optimization based on R2.

Table 10.
Comparing manual tuning and Bayesian optimization based on RMSE.
4.3. Effect Comparison of LSTM and GRU Model Results
Existing research has proven that RNN models excel in time series forecasting tasks [55,56,57]. As the two main variants of RNN, LSTM and GRU each excel at different tasks. Therefore, the focus of this section is to compare the results of LSTM and GRU and to explain the reason that LSTM is selected as the benchmark for developing the multi-ring prediction model in this study.
Figure 12 shows ten prediction results from the LSTM and GRU models. The results show some randomness, which is likely due to the use of dropout hyperparameters and the random initialization of the model weights. In general, the LSTM model produces higher R2 and lower RMSE results compared to the GRU model. It is evident that the overall predictive performance of the LSTM model is better than that of the GRU model. Both RMSE and R2 metrics are employed for evaluating model performance because a model may perform well on one metric but not as well on the other. For instance, in the prediction of HDSH at step 6, the GRU model (0.783) slightly outperforms the LSTM model (0.780) when evaluated using R2. However, under the RMSE metric at the same step, the LSTM model (19.5 mm) performs better than the GRU model (20 mm).
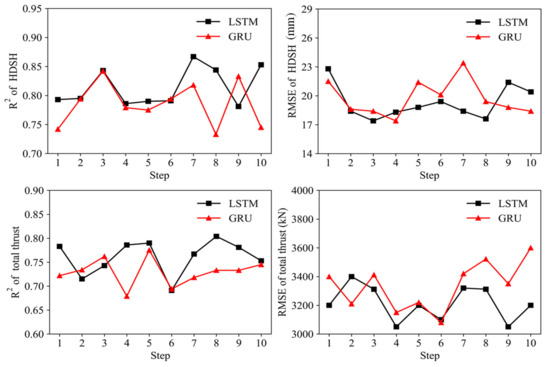
Figure 12.
Comparison of ten results of LSTM and GRU models.
The loss distribution for Bayesian hyperparameter optimization is illustrated in Figure 13a. The optimization paths of the LSTM and GRU models are shown in Figure 13b. Overall, the distribution of loss values for the LSTM is lower than that for the GRU [Figure 13a], indicating that the LSTM model is more effective at extracting temporal information in the task of predicting shield movement performance. Specifically, while the initial loss of the LSTM and GRU models is similar, the LSTM is able to achieve a lower loss more quickly [Figure 13b]. Therefore, the LSTM model is more suitable for shield construction parameter prediction tasks due to its higher prediction accuracy and better hyperparameter tuning effectiveness.
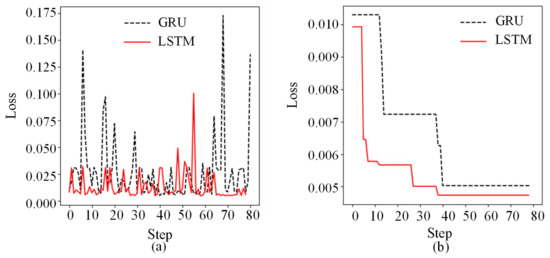
Figure 13.
Comparison of Bayesian hyperparameter optimization for GRU and LSTM models. (a) loss distribution and (b) optimization path.
5. An Intelligent Shield Attitude Correction Method
As the BOTA-LSTM model can reasonably predict the multi-ring shield attitudes, an intelligent shield attitude correction method is then proposed based on the BOTA-LSTM model. The monitoring data from rings 413 to 453 in Figure 10 shows that the actual shield attitude deviation exceeds the range of ±50 mm required by the code for construction and acceptance of metro engineering, indicating a need for correction of the shield attitude. The horizontal deviation of shield attitude is defined as negative for left and positive for right attitudes. The detailed process of the shield attitude correction method is shown in Figure 14.
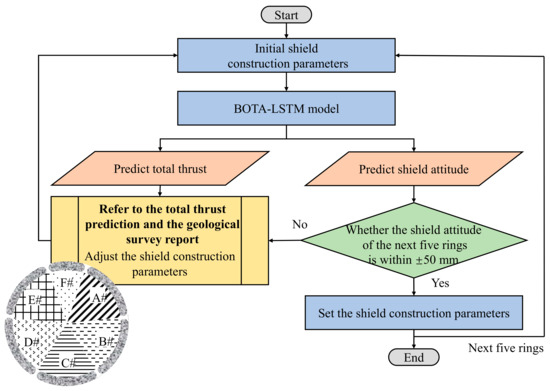
Figure 14.
Process of parameter tuning for shield attitude correction.
First, the proposed BOTA-LSTM model is applied to predict the attitude and total thrust for the next five rings (rings 1 to 5). The model predictions are analyzed to check if the shield attitude deviates beyond the ±50 mm range. If any of the five rings express an attitude deviation exceeding 50 mm, it requires an adjustment in the shield construction parameters. The adjustment range of the shield construction parameters is shown in Table 11. It is noted that shield construction parameter adjustments should consider a comprehensive analysis of the total thrust predictions and geological survey reports.

Table 11.
Adjustment ranges of the shield construction parameters.
Using the adjustment of oil pressure as an example, if the shield machine transitions from hard rock to soft soil and the predicted values of total thrust show an unreasonable increase in the predicted values of total thrust, and subsequently, the shield machine deviates towards the right, the oil pressure in zones A# and B# should be reduced accordingly. Conversely, when moving from soft soil to hard rock with a decreased total thrust prediction, if the shield machine still deviates towards the right, the oil pressure in A# and B# should be increased. If the predicted attitude for all five rings is within the ±50 mm range, the focus is then placed solely on the total thrust. If the total thrust is excessively high, a reduction in oil pressure in zones A#, B#, D#, and E# should be implemented. When it is found that the predicted shield attitudes for rings 1 to 5 are all within a range of ±50 mm, and the total thrust has been adjusted appropriately, the shield machine can move one ring forward, and then the attitudes and total thrusts of next five rings (rings 2 to 6) can be predicted.
Figure 15 shows the comparison before and after the correction of the shield attitude. Specifically, the HDSH of the shield machine is 4 mm, with a total thrust of 60,739 kN at ring 412. The predicted HDSH for ring 417 is –61 mm, indicating a leftward deviation of the shield attitude, and the shield machine is transitioning from a harder rock to a softer soil layer, with an increasing total thrust. At this time, the changes in total thrust do not match with the changes in the geological strata. Therefore, it is necessary to adjust the shield attitude in advance and reduce the total thrust. The results of the corrections are shown in Figure 15, and the shield construction parameters before and after the correction are listed in Table 12. The corrected shield attitude meets the project requirement of a shield attitude deviation within ±50 mm, which indicates that such an operation can effectively control the shield attitude within the allowable range. Compared to methods that only predict and correct the shield movement performance for the next moment, the proposed multi-ring prediction and correction method offers a significant advantage. Even if an initial correction does not achieve the expected effect, adjustments can still be made before shield attitude reaches the warning deviation of ±50 mm. Additionally, the control process for shield attitude incorporates total thrust, ensuring that adjustments in total thrust align with changes in geological strata properties. For instance, as excavation moves from harder to softer rock layers, the total thrust is reduced to avoid the risk of tunnel collapse. Therefore, the proposed model can lead to less downtime, reduced construction expenses, and improved excavation efficiency in practical engineering.
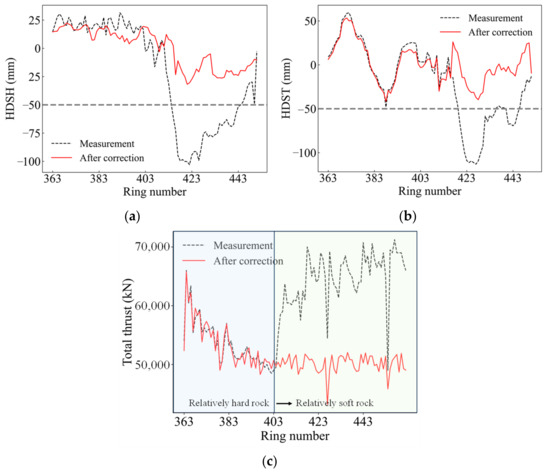
Figure 15.
Comparison before and after deviation correction. (a) HDSH; (b) HDST; (c) total thrust.

Table 12.
Comparison of shield construction parameters before and after deviation correction.
6. Limitations and Challenges
This section discusses the limitations of the proposed BOTA-LSTM model and its potential challenges:
- (1)
- The proposed model uses historical data for training, which makes it effective for predicting known patterns. However, the predictive capability of the model may be limited when it is faced with new or anomalous situations that significantly deviate from the training data. This limitation also exists in current machine-learning models.
- (2)
- The proposed model is a data-driven model. Therefore, it relies heavily on the quality of the monitoring data from sensors and the geological data from experimental tests.
- (3)
- In this study, the shield machine tunnels through the soft top and hard bottom strata. A standardization method for stratum parameters is used, which helps the machine learning model handle and integrate data from different strata. However, more advanced methods, such as physics-informed neural networks, may be necessary to more accurately reflect the specific characteristics of soft top and hard bottom strata.
7. Conclusions
This paper proposes a Bayesian optimization-based temporal attention-LSTM model (BOTA-LSTM) to predict the shield attitude and total thrust. The model achieves multi-ring predictions of shield attitude and total thrust by using a temporal attention mechanism. The optimal predictive model is determined through Bayesian hyperparameter optimization. Based on the multi-ring prediction results, the shield attitude is adjusted to a reasonable range through an intelligent correction method. The following are the main conclusions of this study:
- The temporal attention mechanism effectively improves the predictive performance of multiple rings. Specifically, the BOTA-LSTM model has the highest accuracy for the first ring, with a gradual decrease over the subsequent four rings and a more rapid decline thereafter.
- The proposed multi-ring intelligent correction method can integrate the multi-ring shield attitude and total thrust data with geological survey reports to control the shield attitude and total thrust within a reasonable range. Compared to a method that solely predicts and corrects for the next ring, the proposed multi-ring prediction and correction method provides the opportunity for further adjustments, if the initial correction falls short of expectations. Considering the control of total thrust can effectively avoid the risk of tunnel collapse caused by excessive thrust during shield tunneling.
- Compared to manual tuning, which is limited by personal experience and prone to getting stuck in local optima, Bayesian hyperparameter optimization can efficiently achieve the optimal predictive model in a shorter timeframe. It enhances the predictive accuracy of the model regarding various tasks, such as HDSH (from 0.84 to 0.94) and total thrust (from 0.76 to 0.83).
- The LSTM model, instead of the GRU model, is selected as the benchmark model for developing the multi-ring prediction model (i.e., BOTA-LSTM model) because LSTM outperforms GRU in terms of predictive accuracy and hyperparameter tunning efficiency.
Author Contributions
Conceptualization, S.Z.; methodology, S.Z. and M.Y.; software, S.Z.; validation, S.C. and M.S.; resources, S.C. and M.S.; data curation, S.C. and M.S.; writing—original draft preparation, S.Z.; writing—review and editing, S.C. and M.S.; visualization, M.Y.; supervision, S.C. and M.S.; project administration, M.S. All authors have read and agreed to the published version of the manuscript.
Funding
This study is supported by the Zhejiang Provincial Natural Science Foundation (Grant No. LY24D020001).
Institutional Review Board Statement
Not applicable.
Informed Consent Statement
Not applicable.
Data Availability Statement
The data presented in this study are available on request from the corresponding author.
Conflicts of Interest
Author Mengfen Shen was employed by the company Zhejiang University of Technology Engineering Design Group Co., Ltd. The remaining authors declare that the research was conducted in the absence of any commercial or financial relationships that could be construed as a potential conflict of interest.
References
- Koyama, Y. Present status and technology of shield tunneling method in Japan. Tunn. Undergr. Space Technol. 2003, 18, 145–159. [Google Scholar] [CrossRef]
- Huang, Q.; Zou, J.; Qian, Z. Face stability analysis for a longitudinally inclined tunnel in anisotropic cohesive soils. J. Cent. South Univ. 2019, 26, 1780–1793. [Google Scholar] [CrossRef]
- Shen, X.; Chen, X.; Bao, X.; Zhou, R.; Zhang, G. Real-time prediction of attitude and moving trajectory in shield tunneling based optimal input parameter combination using random forest deep learning method. Acta Geotech. 2023, 18, 6687–6707. [Google Scholar] [CrossRef]
- Liu, Y.; Cao, Y.; Wang, L.; Chen, Z.; Qin, Y. Prediction of the durability of high-performance concrete using an integrated RF-LSSVM model. Constr. Build. Mater. 2022, 356, 129232. [Google Scholar] [CrossRef]
- Huang, H.; Chang, J.; Zhang, D.; Zhang, J.; Wu, H.; Li, G. Machine learning-based automatic control of tunneling posture of shield machine. J. Rock Mech. Geotech. Eng. 2022, 14, 1153–1164. [Google Scholar] [CrossRef]
- Phoon, K.K.; Zhang, W. Future of machine learning in geotechnics. Georisk 2023, 17, 7–22. [Google Scholar] [CrossRef]
- Tao, Y.; Sun, H.; Cai, Y. Predictions of deep excavation responses considering model uncertainty: Integrating BiLSTM neural networks with Bayesian updating. Int. J. Geomech. 2022, 22, 04021250. [Google Scholar] [CrossRef]
- Shan, F.; He, X.; Armaghani, D.J.; Zhang, P.; Sheng, D. Success and challenges in predicting TBM penetration rate using recurrent neural networks. Tunn. Undergr. Space Technol. 2022, 130, 104728. [Google Scholar] [CrossRef]
- Zhang, W.; Li, H.; Li, Y.; Liu, H.; Chen, Y.; Ding, X. Application of deep learning algorithms in geotechnical engineering: A short critical review. Artif. Intell. Rev. 2021, 54, 5633–5673. [Google Scholar] [CrossRef]
- Baghbani, A.; Choudhury, T.; Costa, S.; Reiner, J. Application of artificial intelligence in geotechnical engineering: A state-of-the-art review. Earth-Sci. Rev. 2022, 228, 103991. [Google Scholar] [CrossRef]
- Zhang, N.; Zhang, N.; Zheng, Q.; Xu, Y. Real-time prediction of shield moving trajectory during tunnelling using GRU deep neural network. Acta Geotech. 2022, 17, 1167–1182. [Google Scholar] [CrossRef]
- Nguyen-Le, D.H.; Tao, Q.B.; Nguyen, V.H.; Abdel-Wahab, M.; Nguyen-Xuan, H. A data-driven approach based on long short-term memory and hidden Markov model for crack propagation prediction. Eng. Fract. Mech. 2020, 235, 107085. [Google Scholar] [CrossRef]
- Shan, F.; He, X.-z.; Armaghani, D.J.; Sheng, D. Effects of data smoothing and recurrent neural network (RNN) algorithms for real-time forecasting of tunnel boring machine (TBM) performance. J. Rock Mech. Geotech. Eng. 2023. Online. [Google Scholar] [CrossRef]
- Wang, R.-h.; Li, D.; Chen, E.J.; Liu, Y. Dynamic prediction of mechanized shield tunneling performance. Autom. Constr. 2021, 132, 103958. [Google Scholar] [CrossRef]
- Xu, J.; Zhang, Z.; Zhang, L.; Liu, D. Predicting shield position deviation based on double-path hybrid deep neural networks. Autom. Constr. 2023, 148, 104775. [Google Scholar] [CrossRef]
- Wang, K.; Wu, X.; Zhang, L.; Song, X. Data-driven multi-step robust prediction of TBM attitude using a hybrid deep learning approach. Adv. Eng. Inform. 2023, 55, 101854. [Google Scholar] [CrossRef]
- Zhou, C.; Xu, H.; Ding, L.; Wei, L.; Zhou, Y. Dynamic prediction for attitude and position in shield tunneling: A deep learning method. Autom. Constr. 2019, 105, 102840. [Google Scholar] [CrossRef]
- Xiao, H.; Chen, Z.; Cao, R.; Cao, Y.; Zhao, L.; Zhao, Y. Prediction of shield machine posture using the GRU algorithm with adaptive boosting: A case study of Chengdu Subway project. Transp. Geotech. 2022, 37, 100837. [Google Scholar] [CrossRef]
- Shen, S.; Elbaz, K.; Shaban, W. Real-time prediction of shield moving trajectory during tunnelling. Acta Geotech. 2022, 17, 1533–1549. [Google Scholar] [CrossRef]
- Fu, X.; Wu, M.; Ponnarasu, S.; Zhang, L. A hybrid deep learning approach for dynamic attitude and position prediction in tunnel construction considering spatio-temporal patterns. Expert Syst. Appl. 2023, 212, 118721. [Google Scholar] [CrossRef]
- Chen, H.; Li, X.; Feng, Z.; Wang, L.; Qin, Y. Shield attitude prediction based on Bayesian-LGBM machine learning. Inform. Sci. 2023, 632, 105–129. [Google Scholar] [CrossRef]
- Kubota, Y.; Yabuki, N.; Fukuda, T. Autopilot model for shield tunneling machines using support vector regression and its application to previously constructed tunnels. Comput.-Aided Civ. Infrastruct. Eng. 2023, 39, 46–62. [Google Scholar] [CrossRef]
- Kang, Q.; Chen, E.J.; Li, Z.; Luo, H.; Liu, Y. Attention-based LSTM predictive model for the attitude and position of shield machine in tunneling. Undergr. Space 2023, 13, 335–350. [Google Scholar] [CrossRef]
- Li, J.-B.; Chen, Z.-Y.; Li, X.; Jing, L.-J.; Zhang, Y.-P.; Xiao, H.-H.; Wang, S.-J.; Yang, W.-K.; Wu, L.-J.; Li, P.-Y.; et al. Feedback on a shared big dataset for intelligent TBM Part I: Feature extraction and machine learning methods. Undergr. Space 2023, 11, 1–25. [Google Scholar] [CrossRef]
- Li, J.-B.; Chen, Z.-Y.; Li, X.; Jing, L.-J.; Zhang, Y.-P.; Xiao, H.-H.; Wang, S.-J.; Yang, W.-K.; Wu, L.-J.; Li, P.-Y.; et al. Feedback on a shared big dataset for intelligent TBM, Part II: Application and forward look. Undergr. Space 2023, 11, 26–45. [Google Scholar] [CrossRef]
- Qin, C.; Shi, G.; Tao, J.; Yu, H.; Jin, Y.; Lei, J.; Liu, C. Precise cutterhead torque prediction for shield tunneling machines using a novel hybrid deep neural network. Mech. Syst. Signal Process. 2021, 151, 107386. [Google Scholar] [CrossRef]
- Zhang, Q.; Su, C.-X.; Qin, Q.-H.; Cai, Z.; Hou, Z.; Kang, Y. Modeling and prediction for the thrust on EPB TBMs under different geological conditions by considering mechanical decoupling. Sci. China Technol. Sci. 2016, 59, 1428–1434. [Google Scholar] [CrossRef]
- Yu, H.; Qin, C.; Tao, J.; Liu, C.; Liu, Q. A multi-channel decoupled deep neural network for tunnel boring machine torque and thrust prediction. Tunn. Undergr. Space Technol. 2023, 133, 104949. [Google Scholar] [CrossRef]
- Acaroglu, O. Prediction of thrust and torque requirements of TBMs with fuzzy logic models. Tunn. Undergr. Space Technol. 2011, 26, 267–275. [Google Scholar] [CrossRef]
- Gao, X.; Shi, M.; Song, X.; Zhang, C.; Zhang, H. Recurrent neural networks for real-time prediction of TBM operating parameters. Autom. Constr. 2019, 98, 225–235. [Google Scholar] [CrossRef]
- Lin, S.; Shen, S.; Zhou, A. Real-time analysis and prediction of shield cutterhead torque using optimized gated recurrent unit neural network. J. Rock Mech. Geotech. Eng. 2022, 14, 1232–1240. [Google Scholar] [CrossRef]
- Lin, S.; Zhang, N.; Zhou, A.; Shen, S.L. Time-series prediction of shield movement performance during tunneling based on hybrid model. Tunn. Undergr. Space Technol. 2022, 119, 104245. [Google Scholar] [CrossRef]
- Wang, L.; Gong, G.; Shi, H.; Yang, H. Modeling and analysis of thrust force for EPB shield tunneling machine. Autom. Constr. 2012, 27, 138–146. [Google Scholar] [CrossRef]
- Chen, Y.; Huang, W. Constructing a stock-price forecast CNN model with gold and crude oil indicators. Appl. Soft Comput. 2021, 112, 107760. [Google Scholar] [CrossRef]
- Shi, R.; Xu, X.; Li, J.; Li, Y. Prediction and analysis of train arrival delay based on XGBoost and Bayesian optimization. Appl. Soft Comput. 2021, 109, 107538. [Google Scholar] [CrossRef]
- Liu, J.; Qi, T.; Wu, Z. Analysis of ground movement due to metro station driven with enlarging shield tunnels under building and its parameter sensitivity analysis. Tunn. Undergr. Space Technol. 2012, 28, 287–296. [Google Scholar] [CrossRef]
- Hochreiter, S.; Schmidhuber, J. Long short-term memory. Neural Comput. 1997, 9, 1735–1780. [Google Scholar] [CrossRef]
- Gers, F.A.; Schmidhuber, J.; Cummins, F. Learning to forget: Continual prediction with LSTM. Neural Comput. 2000, 12, 2451–2471. [Google Scholar] [CrossRef] [PubMed]
- Cho, K.; Van Merriënboer, B.; Gulcehre, C.; Bahdanau, D.; Bougares, F.; Schwenk, H.; Bengio, Y. Learning phrase representations using RNN encoder-decoder for statistical machine translation. arXiv 2014, arXiv:1406.1078. [Google Scholar]
- Mnih, V.; Heess, N.; Graves, A.; Kavukcuoglu, K. Recurrent models of visual attention. In Proceedings of the NIPS 2014, Montreal, QC, Canada, 8–13 December 2014. [Google Scholar]
- Qin, Y.; Song, D.; Chen, H.; Cheng, W.; Jiang, G.; Cottrell, G. A dual-stage attention-based recurrent neural network for time series prediction. arXiv 2017, arXiv:1704.02971. [Google Scholar]
- Laubscher, R. Time-series forecasting of coal-fired power plant reheater metal temperatures using encoder-decoder recurrent neural networks. Energy 2019, 189, 116187. [Google Scholar] [CrossRef]
- Bergstra, J.; Bengio, Y. Random search for hyper-parameter optimization. J. Mach. Learn. Res. 2012, 13, 281–305. [Google Scholar]
- Holland, J.H. Genetic algorithms. Sci. Am. 1992, 267, 66–73. [Google Scholar] [CrossRef]
- Kennedy, J.; Eberhart, R. Particle swarm optimization. In Proceedings of the International Conference on Neural Networks (ICNN’95), Perth, WA, Australia, 27 November–1 December 1995; IEEE: Piscataway, NJ, USA, 1995; Volume 4, pp. 1942–1948. [Google Scholar]
- Snoek, J.; Larochelle, H.; Adams, R.P. Practical bayesian optimization of machine learning algorithms. In NIPS’12 Proceedings of the 25th International Conference on Neural Information Processing Systems; Curran Associates Inc.: New York, NY, USA, 2012. [Google Scholar]
- Li, Y.; Liu, G.; Lu, G.; Jiao, L.; Marturi, N.; Shang, R. Hyper-parameter optimization using MARS surrogate for machine-learning algorithms. IEEE Trans. Emerg. Top. Comput. Intell. 2019, 4, 287–297. [Google Scholar] [CrossRef]
- Wu, J.; Chen, X.-Y.; Zhang, H.; Jiao, L.; Marturi, N.; Shang, R. Hyperparameter optimization for machine learning models based on Bayesian optimization. J. Electron. Sci. Technol. 2019, 17, 26–40. [Google Scholar]
- Yang, L.; Shami, A. On hyperparameter optimization of machine learning algorithms: Theory and practice. Neurocomputing 2020, 415, 295–316. [Google Scholar] [CrossRef]
- Tao, Y.; Phoon, K.K.; Sun, H.; Cai, Y. Hierarchical Bayesian model for predicting small-strain stiffness of sand. Can. Geotech. J. 2023. Online. [Google Scholar] [CrossRef]
- Tao, Y.; Phoon, K.K.; Sun, H.; Cai, Y. Variance reduction function for a potential inclined slip line in a spatially variable soil. Struct. Saf. 2024, 106, 102395. [Google Scholar] [CrossRef]
- Liu, B.; Wang, R.; Guan, Z.; Li, J.; Xu, Z.; Guo, X.; Wang, Y. Improved support vector regression models for predicting rock mass parameters using tunnel boring machine driving data. Tunn. Undergr. Space Technol. 2019, 91, 102958. [Google Scholar] [CrossRef]
- Daubechies, I. The wavelet transform, time-frequency localization and signal analysis. IEEE Trans. Inf. Theory 1990, 36, 961–1005. [Google Scholar] [CrossRef]
- Evans, J.D. Straightforward Statistics for the Behavioral Sciences; Thomson Brooks/Cole Publishing Co.: Pacific Grove, CA, USA, 1996. [Google Scholar]
- Zhang, W.; Gu, X.; Tang, L.; Yin, Y.; Liu, D.; Zhang, Y. Application of machine learning, deep learning and optimization algorithms in geoengineering and geoscience: Comprehensive review and future challenge. Gondwana Res. 2022, 109, 1–17. [Google Scholar] [CrossRef]
- Zhang, P.; Yin, Z.; Jin, Y. State-of-the-art review of machine learning applications in constitutive modeling of soils. Arch. Comput. Methods Eng. 2021, 28, 3661–3686. [Google Scholar] [CrossRef]
- Tao, Y.; Zeng, S.; Sun, H.; Cai, Y.; Zhang, J.; Pan, X. A spatiotemporal deep learning method for excavation-induced wall deflections. J. Rock Mech. Geotech. Eng. 2024. Online. [Google Scholar] [CrossRef]
Disclaimer/Publisher’s Note: The statements, opinions and data contained in all publications are solely those of the individual author(s) and contributor(s) and not of MDPI and/or the editor(s). MDPI and/or the editor(s) disclaim responsibility for any injury to people or property resulting from any ideas, methods, instructions or products referred to in the content. |
© 2024 by the authors. Licensee MDPI, Basel, Switzerland. This article is an open access article distributed under the terms and conditions of the Creative Commons Attribution (CC BY) license (https://creativecommons.org/licenses/by/4.0/).