
Influence of the Parameters of an Agricultural Biogas Plant on the Amount of Power Generated

 ,
,  ,
,  ,
, 
Abstract
Featured Application
Abstract
1. Introduction
2. Materials and Methods
3. Results
3.1. Recorded Parameters for the Biogas Plant under Study
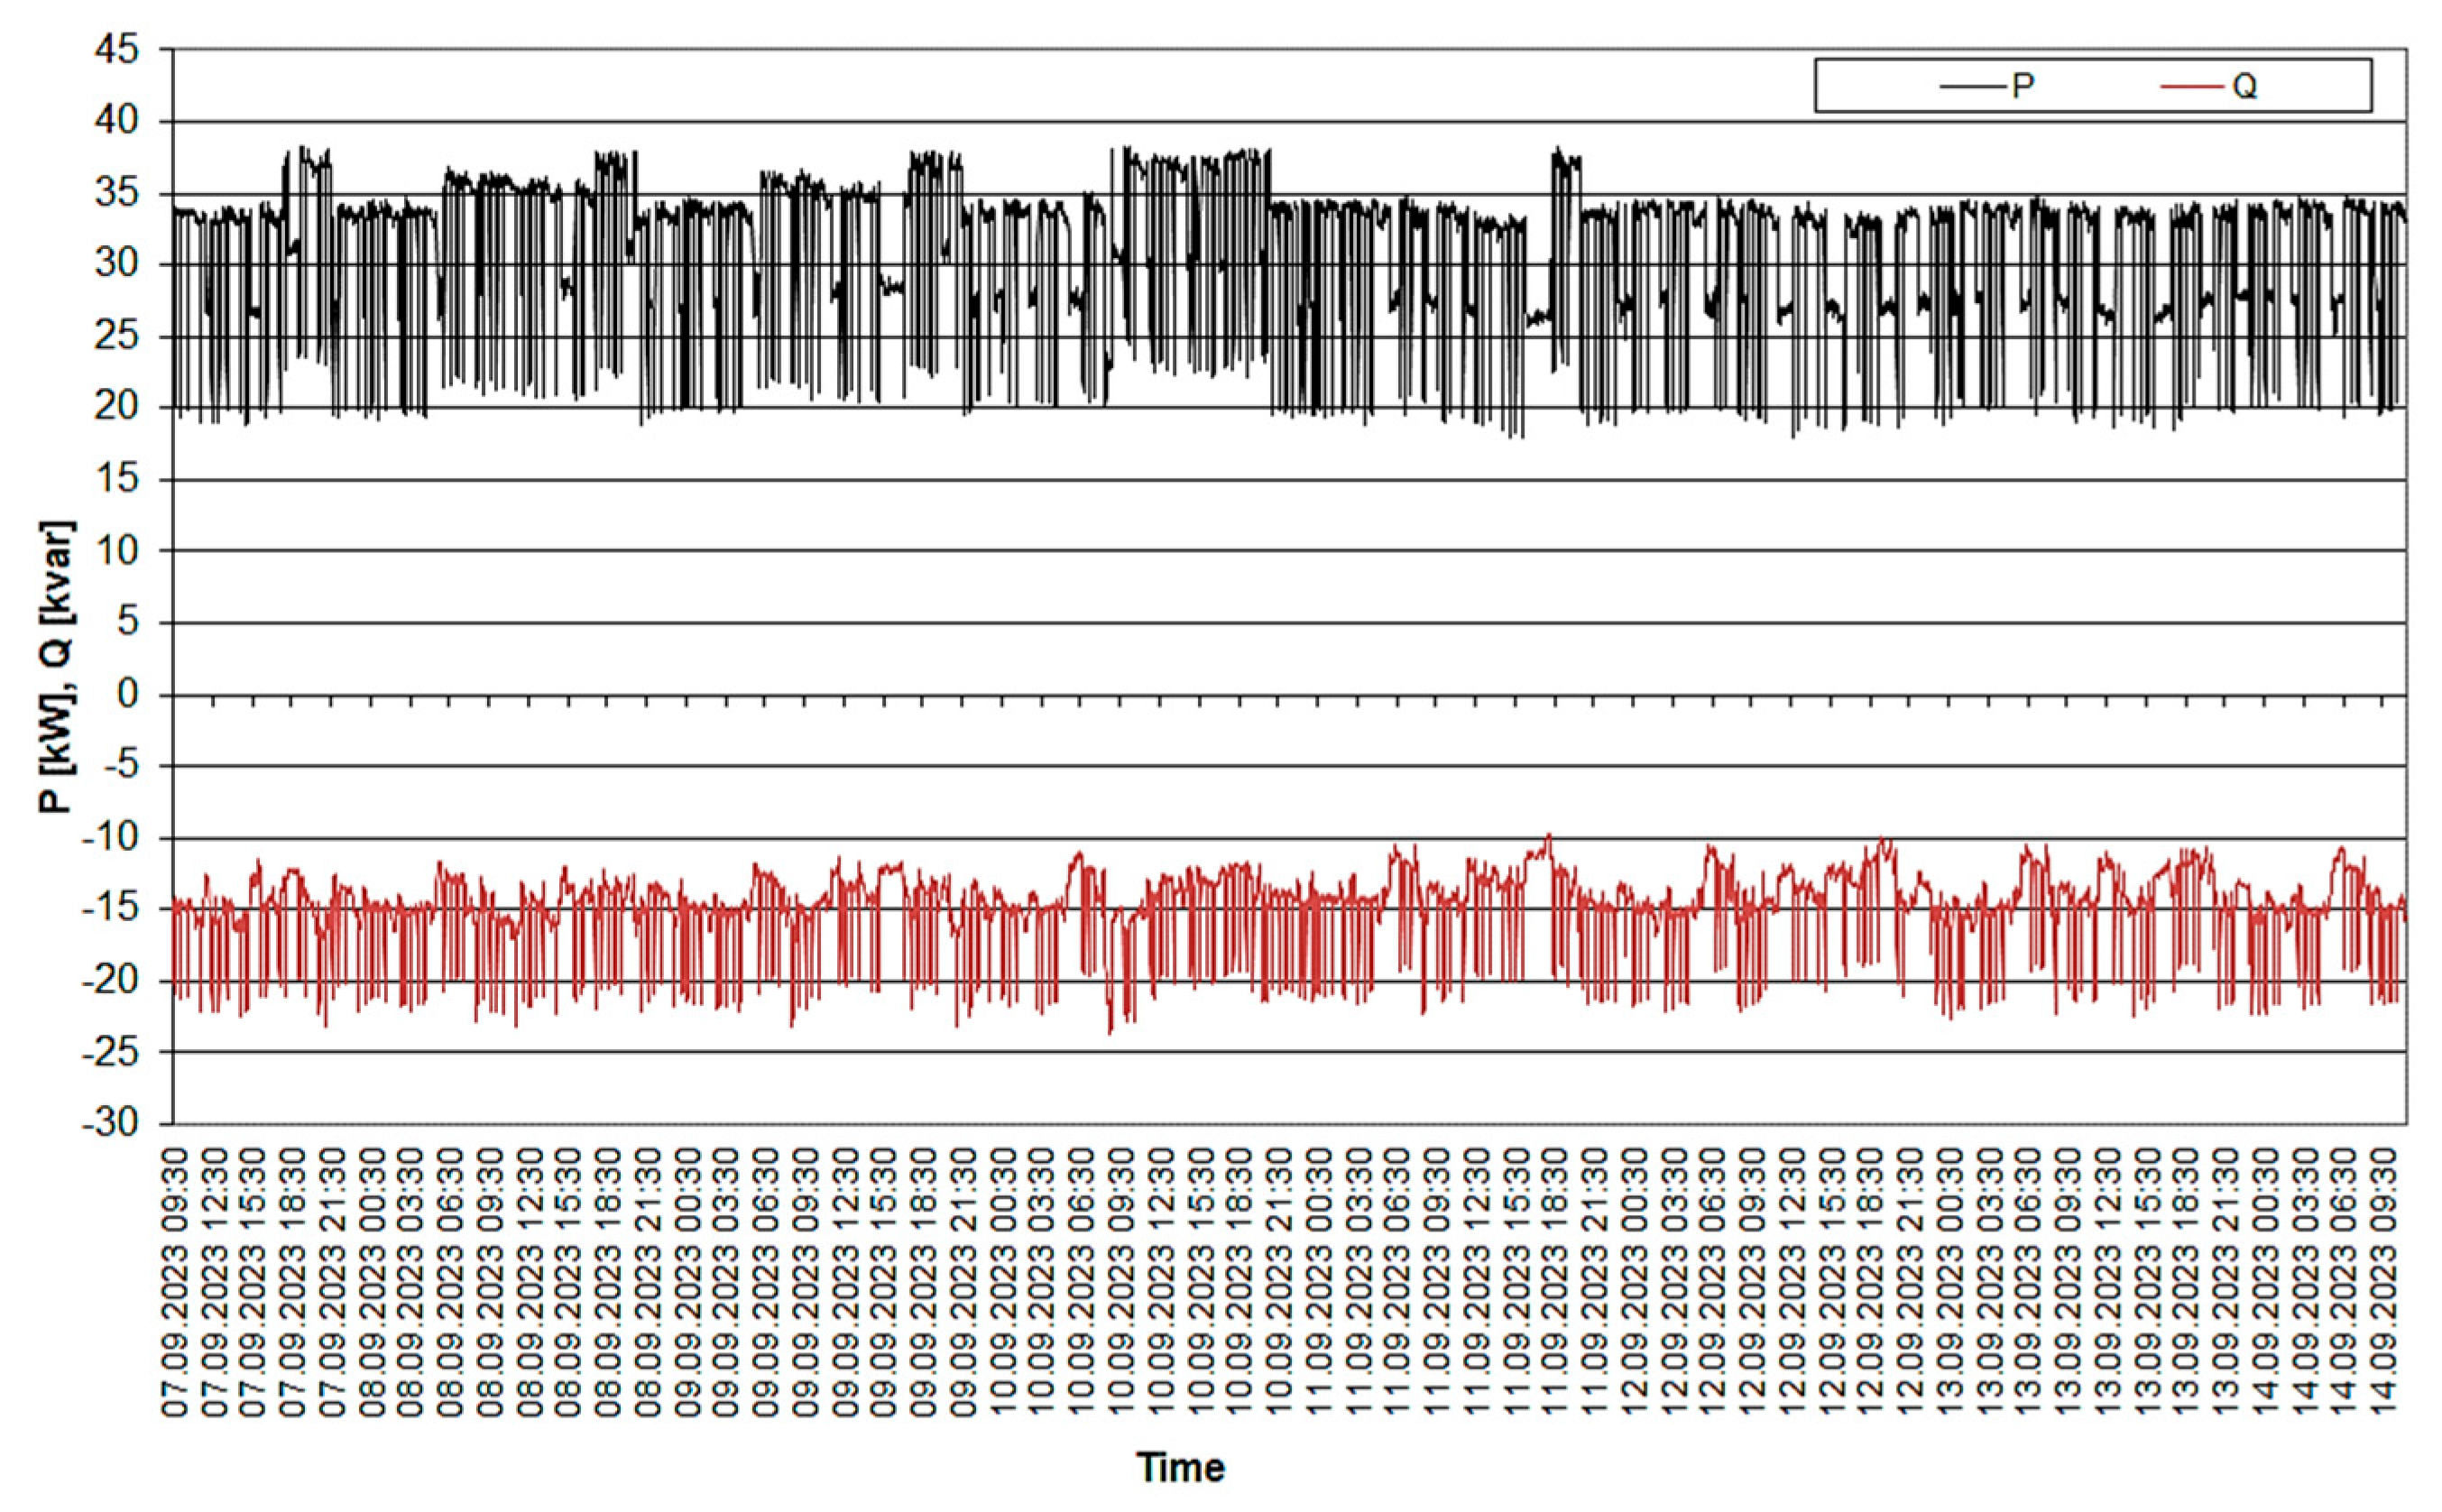
- The agricultural biogas plant studied never reached its rated output (40 kW); the highest recorded active power value was 38.3 kW, 96% of the rated power; this was most likely due to the energy consumption of the individual electrical appliances of the biogas plant (the plant’s own needs) and the power losses occurring in their current paths;
- The minimum active power value recorded during the tests was only 17.8 kW, resulting from the operation of the mixers (rated at 2 × 9 kW) installed in the digester; the actual power consumed by the substrate mixers was lower, at around 14.2 kW;
- The reactive power produced in the biogas plant was inductive and took values of 9.8 kvar to 23.6 kvar; during regular system operation, the reactive power took on lower values, while switching on the substrate mixers increased it by an average of 6.6 kvar.
3.2. Statistical Analysis of the Results Obtained
4. Discussion
5. Conclusions
Author Contributions
Funding
Institutional Review Board Statement
Informed Consent Statement
Data Availability Statement
Conflicts of Interest
References
- Hołdyński, G.; Skibko, Z. Analysis of Currents and Voltages Deformations in Rural Medium Voltage Electric Power Networks. Przegląd Elektrotechniczny 2011, 7, 130–135. Available online: https://www.sigma-not.pl/publikacja-60808-analiza-odkszta%C5%82ce%C5%84-prad%C3%B3w-i-napi%C4%99%C4%87-w-tereno-wych-sieciach-elektroenergetycznych-%C5%9Bredniego-napi%C4%99cia-przeglad-elektrotechniczny-2011-7.htmlprad%C3%B3w-i-napi%C4%99%C4%87-w-terenowych-sieciach-elektroenergetycznych-%C5%9Bredniego-napi%C4%99cia-przeglad-elektrotechniczny-2011-7.html (accessed on 1 April 2024). (In Polish).
- Igliński, B.; Kiełkowska, U.; Pietrzak, M.B.; Skrzatek, M.; Kumar, G.; Piechota, G. The regional energy transformation in the context of renewable energy sources potential. Renew. Energy 2023, 218, 119246. [Google Scholar] [CrossRef]
- Pilarski, K.; Pilarska, A.A.; Boniecki, P.; Niedbała, G.; Durczak, K.; Witaszek, K.; Mioduszewska, N.; Kowalik, I. The efficiency of industrial and laboratory anaerobic digesters of organic substrates: Using the Biochemical Methane Potential Correction Coefficient. Energies 2020, 13, 1280. [Google Scholar] [CrossRef]
- Tymińska, M.; Skibko, Z.; Borusiewicz, A. The Effect of Agricultural Biogas Plants on the Quality of Farm Energy Supply. Energies 2023, 16, 4600. [Google Scholar] [CrossRef]
- Kuboń, M.; Skibko, Z.; Tabor, S.; Malaga-Toboła, U.; Borusiewicz, A.; Romaniuk, W.; Zarajczyk, J.; Neuberger, P. Analysis of Voltage Distortions in the Power Grid Arising from Agricultural Biogas Plant Operation. Energies 2023, 16, 6189. [Google Scholar] [CrossRef]
- Hołdyński, G.; Skibko, Z.; Borusiewicz, A. Analysis of the Influence of Load on the Value of Zero-Voltage Asymmetry in Medium-Voltage Networks Operating with Renewable Energy Sources. Energies 2023, 16, 580. [Google Scholar] [CrossRef]
- Garrison, M.V.; Richard, T.L. Methane and Manure: Feasibility Analysis of Price and Policy Alternatives. Trans. ASAE 2005, 48, 1287–1294. [Google Scholar] [CrossRef]
- Lansing, S.; Martin, J.F.; Botero, R.B.; da Silva, T.N.; da Silva, E.D. Wastewater transformations and fertilizer value when co-digesting differing ratios of swine manure and used cooking grease in low-cost digesters. Biomass Bioenergy 2010, 34, 1711–1720. [Google Scholar] [CrossRef]
- Rao, P.V.; Baral, S.S.; Dey, R.; Mutnuri, S. Biogas generation potential by anaerobic digestion for sustainable energy development in India. Renew. Sustain. Energy Rev. 2010, 14, 2086–2094. [Google Scholar] [CrossRef]
- Chen, Y.; Yang, G.; Sweeney, S.; Feng, Y. Household biogas use in rural China: A study of opportunities and constraints. Renew. Sustain. Energy Rev. 2010, 14, 545–549. [Google Scholar] [CrossRef]
- Saracevic, E.; Frühauf, S.; Miltner, A.; Karnpakdee, K.; Munk, B.; Lebuhn, M.; Wlcek, B.; Leber, J.; Lizasoain, J.; Friedl, A.; et al. Utilisation of food and agricultural residues for flexible biogas production: Process stability and effects on needed biogas storage capacities. Energies 2019, 12, 2678. [Google Scholar] [CrossRef]
- Friedlingstein, P.; O’Sullivan, M.; Jones, M.W.; Andrew, R.M.; Hauck, J.; Olsen, A.; Peters, G.P.; Peters, W.; Pongratz, J.; Sitch, S.; et al. Global carbon budget. Earth Syst. Sci. Data 2020, 12, 3269–3340. [Google Scholar] [CrossRef]
- Korberg, A.D.; Skov, I.R.; Mathiesen, B.V. The role of biogas and biogas-derived fuels in a 100% renewable energy system. Energy 2020, 199, 117426. [Google Scholar] [CrossRef]
- Ardolino, F.; Parrillo, F.; Arena, U. Biowaste-to-biomethane or biowaste-to-energy? An LCA study on anaerobic digestion of organic waste. J. Clean. Prod. 2018, 174, 462–476. [Google Scholar] [CrossRef]
- Hagos, K.; Zong, J.; Li, D.; Liu, C.; Lu, X. Anaerobic co-digestion process for biogas production: Progress, challenges and perspectives. Renew. Sustain. Energy Rev. 2017, 76, 1485–1496. [Google Scholar] [CrossRef]
- Pilarska, A.A.; Wolna-Maruwka, A.; Pilarski, K. Kraft Lignin Grafted with Polyvinylpyrrolidone as a Novel Microbial Carrier in Biogas Production. Energies 2018, 11, 3246. [Google Scholar] [CrossRef]
- Piechocki, J.; Solowiej, P.; Neugebauer, M. The use of biomass for electric power production in polish power plants. Hung. Agric. Eng. 2015, 28, 19–22. [Google Scholar] [CrossRef]
- Amani, T.; Nosrati, M.; Sreekrishnan, T.R. Anaerobic digestion from the viewpoint of microbiological, chemical, and operational aspects—A review. Environ. Rev. 2010, 18, 255–278. [Google Scholar] [CrossRef]
- Khalid, A.; Arshad, M.; Anjum, M.; Mahmood, T.; Dawson, L. The anaerobic digestion of solid organic waste. Waste Manag. 2011, 31, 1737–1744. [Google Scholar] [CrossRef]
- Nie, H.; Jacobi, H.F.; Strach, K.; Xu, C.; Zhou, H.; Liebetrau, J. Mono-fermentation of chicken manure: Ammonia inhibition and recirculation of the digestate. Bioresour. Technol. 2015, 178, 238–246. [Google Scholar] [CrossRef]
- Bousek, J.; Scroccaro, D.; Sima, J.; Weissenbacher, N.; Fuchs, W. Influence of the gas composition on the efficiency of ammonia stripping of biogas digestate. Bioresour. Technol. 2016, 203, 259–266. [Google Scholar] [CrossRef]
- Pilarska, A.A.; Pilarski, K.; Waliszewska, B.; Zborowska, M.; Witaszek, K.; Waliszewska, H.; Kolasinski, M.; Szwarc-Rzepka, K. Evaluation of bio-methane yields for high-energy organic waste and sewage sludge: Apilot-scale study for a wastewater treatment plant. Environ. Eng. Manag. J. 2019, 18, 2023–2034. [Google Scholar] [CrossRef]
- Moset, V.; Poulsen, M.; Wahid, R.; Højberg, O.; Møller, H.B. Mesophilic versus thermophilic anaerobic digestion of cattle manure: Methane productivity and microbial ecology. Microb. Biotechnol. 2015, 8, 787–800. [Google Scholar] [CrossRef]
- Kreuger, E.; Nges, I.; Björnsson, L. Ensiling of crops for biogas production: Effects on methane yield and total solids determination. Biotechnol. Biofuels 2011, 4, 44. [Google Scholar] [CrossRef]
- Yamaji, D.M.; Amâncio-Vieira, S.F.; Fidelis, R.; Contani, E.A.D.R. Proposal of Multicriteria Decision-Making Models for Biogas Production. Energies 2024, 17, 806. [Google Scholar] [CrossRef]
- Mazurkiewicz, J. Analysis of the Energy and Material Use of Manure as a Fertilizer or Substrate for Biogas Production during the Energy Crisis. Energies 2022, 15, 8867. [Google Scholar] [CrossRef]
- Hamzehkolaei, F.T.; Amjady, N. A Techno-Economic Assessment for Replacement of Conventional Fossil Fuel Based Technologies in Animal Farms with Biogas Fueled CHP Units. Renew. Renew. Energy 2018, 118, 602–614. [Google Scholar] [CrossRef]
- Aguirre-Villegas, H.A.; Larson, R.A. Evaluating Greenhouse Gas Emissions from Dairy Manure Management Practices Using Survey Data and Lifecycle Tools. J. Clean. Prod. 2017, 143, 169–179. [Google Scholar] [CrossRef]
- Czekała, W.; Nowak, M.; Bojarski, W. Anaerobic Digestion and Composting as Methods of Bio-Waste Management. Agric. Eng. 2023, 27, 173–186. [Google Scholar] [CrossRef]
- Larina, Y.; Galchynska, J.; Kucheruk, P.; Zghurska, O.; Ortina, G.; Al-Nadzhar, F.; Marusei, T.; Kuboń, M.; Dzieniszewski, U. Estimation of the Domestic Agricultural Sector Potential for the Growth of Energy Cultures for Bioenergy Fuel Production. Agric. Eng. 2021, 25, 73–82. [Google Scholar] [CrossRef]
- Piwowar, A. Farming Practices for Reducing Ammonia Emissions in Polish Agriculture. Atmosphere 2020, 11, 1353. [Google Scholar] [CrossRef]
- Roubik, H.; Mazancova, J. Suitability of Small-Scale Biogas Systems Based on Livestock Manure for the Rural Areas of Sumatra. Environ. Dev. 2020, 33, 100505. [Google Scholar] [CrossRef]
- Eisen, M.B.; Brown, P.O. Rapid Global Phaseout of Animal Agriculture Has the Potential to Stabilise Greenhouse Gas Levels for 30 Years and Offset 68 Percent of CO2 Emissions This Century. PLoS Clim. 2022, 1, e0000010. [Google Scholar] [CrossRef]
- Hayek, M.N.; Harwatt, H.; Ripple, W.J.; Mueller, N.D. The Carbon Opportunity Cost of Animal-Sourced Food Production on Land. Nat. Sustain. 2021, 4, 21–24. [Google Scholar] [CrossRef]
- Díaz-Vázquez, D.; Alvarado-Cummings, S.C.; Meza-Rodríguez, D.; Senés-Guerrero, C.; de Anda, J.; Gradilla-Hernández, M.S. Evaluation of Biogas Potential from Livestock Manures and Multicriteria Site Selection for Centralized Anaerobic Digester Systems: The Case of Jalisco, México. Sustainability 2020, 12, 3527. [Google Scholar] [CrossRef]
- Achinas, S.; Euverink, G.J.W. Rambling Facets of Manure-Based Biogas Production in Europe: A Briefing. Renew. Sustain. Energy Rev. 2019, 119, 109566. [Google Scholar] [CrossRef]
- Kegl, T.; Kegl, B.; Kegl, M. Improvement of Biogas Production Utilising a Complex Anaerobic Digestion Model and Gradient-Based Optimization. Energies 2024, 17, 1279. [Google Scholar] [CrossRef]
- Skibko, Z.; Romaniuk, W.; Borusiewicz, A.; Porwisiak, H.; Lisowski, J. Use of pellets from agricultural biogas plants in fertilisation of oxytrees in Podlasie, Poland. J. Water Land Dev. 2021, 51, 124–128. [Google Scholar] [CrossRef]
- Zhang, X.; Lassaletta, L. Manure management benefits climate with limits. Nat. Food 2022, 3, 312–313. [Google Scholar] [CrossRef]
- Köninger, J.; Lugato, E.; Panagos, P.; Kochupillai, M.; Orgiazzi, A.; Briones, M.J. Manure Management and Soil Biodiversity: Towards More Sustainable Food Systems in the EU. Agric. Syst. 2021, 194, 103251. [Google Scholar] [CrossRef]
- Shan, N.; Li, H.; Li, J.-Z.; Ng, E.L.; Ma, Y.; Wang, L.-G.; Chen, Q. A Major Pathway for Carbon and Nitrogen Losses-Gas Emissions during Storage of Solid Pig Manure in China. J. Integr. Agric. 2019, 18, 190–200. [Google Scholar] [CrossRef]
- Hristov, A.N.; Hanigan, M.; Cole, A.; Todd, R.; McAllister, T.A.; Ndegwa, P.M.; Rotz, A. Ammonia emissions from dairy farms and beef feedlots. Can. J. Anim. Sci. 2011, 91, 1–35. [Google Scholar] [CrossRef]
- González, J.F.; Álvez-Medina, C.M.; Nogales-Delgado, S. Biogas Steam Reforming in Wastewater Treatment Plants: Opportunities and Challenges. Energies 2023, 16, 6343. [Google Scholar] [CrossRef]
- Giesy, R.; Wilkie, A.C.; De Vries, A.; Nordstedt, R.A. Economic Feasibility of Anaerobic Digestion To Produce Electricity on Florida Dairy Farms. EDIS 2006, 2006, 1–8. [Google Scholar] [CrossRef]
- Gloy, B.A.; Dressler, J.B. Financial barriers to the adoption of anaerobic digestion on US livestock operations. Agric. Financ. Rev. 2010, 70, 157–168. [Google Scholar] [CrossRef]
- Sołjan, Z.; Hołdyński, G.; Zajkowski, M. Balancing reactive compensation at three-phase four-wire systems with a sinusoidal and asymmetrical voltage source. Bull. Pol. Acad. Sci. Tech. Sci. 2020, 68, 71–79. [Google Scholar] [CrossRef]
- Soljan, Z.; Holdynski, G.; Zajkowski, M. Decomposition of the load’s current supplied from a sinusoidal and asymmetrical voltage source in accordance with the Currents’ Physical Components (CPC) Theory. In Proceedings of the 2019 20th International Scientific Conference on Electric Power Engineering (EPE), Kouty nad Desnou, Czech Republic, 15–17 May 2019; Rusek, S., Goňo, R., Eds.; pp. 389–394. [Google Scholar]
- Lansing, S.; Botero, R.B.; Martin, J.F. Waste treatment and biogas quality in small-scale agricultural digesters. Bioresour. Technol. 2008, 99, 5881–5890. [Google Scholar] [CrossRef] [PubMed]
- Bórawski, P.; Bełdycka-Bórawska, A.; Kapsdorferová, Z.; Rokicki, T.; Parzonko, A.; Holden, L. Perspectives of Electricity Production from Biogas in the European Union. Energies 2024, 17, 1169. [Google Scholar] [CrossRef]
- Ankathi, S.K.; Chaudhari, U.S.; Handler, R.M.; Shonnard, D.R. Sustainability of Biogas Production from Anaerobic Digestion of Food Waste and Animal Manure. Appl. Microbiol. 2024, 4, 418–438. [Google Scholar] [CrossRef]
- Dach, J.; Boniecki, P.; Przybył, J.; Janczak, D.; Lewicki, A.; Czekała, W.; Witaszek, K.; Carmona, P.C.R.; Cieślik, M. Energetic efficiency analysis of the agricultural biogas plant in 250 kWe experimental installation. Energy 2014, 69, 34–38. [Google Scholar] [CrossRef]
- Mazurkiewicz, J. The Impact of Manure Use for Energy Purposes on the Economic Balance of a Dairy Farm. Energies 2023, 16, 6735. [Google Scholar] [CrossRef]
- United States Environmental Protection Agency. Practices to Reduce Methane Emissions from Livestock Manure Management. Available online: https://www.epa.gov/agstar/practices-reduce-methane-emissions-livestock-manure-management (accessed on 23 October 2023).
- Energy Market, U.R. Energy Market: Average Electricity Price from Generator Settlements within Groups in Q2 2023. Available online: https://www.ure.gov.pl/pl/urzad/informacje-ogolne/aktualnosci/11215,Rynek-energii-srednia-cena-energii-elektrycznej-z-rozliczen-wytworcow-w-ramach-g.html (accessed on 23 October 2023).
- Bôas, T.F.V.; Barros, R.M.; Pinto, J.A.; dos Santos, I.F.S.; Lora, E.E.S.; Andrade, R.V.; Filho, G.L.T.; Almeida, K.A.; Machado, G.d.O. Energy Potential from the Generation of Biogas from Anaerobic Digestion of Olive Oil Extraction Wastes in Brazil. Clean. Waste Syst. 2023, 4, 100083. [Google Scholar] [CrossRef]
- Tan, V.W.G.; Chan, Y.J.; Arumugasamy, S.K.; Lim, J.W. Optimising Biogas Production from Palm Oil Mill Effluent Utilising Integrated Machine Learning and Response Surface Methodology Framework. J. Clean. Prod. 2023, 414, 137575. [Google Scholar] [CrossRef]
- Furtado, L.A.; Ribeiro, S.G.; Pradelle, F.; Parise, J.A.R. Modeling and Techno-Economic Analysis of a Hybrid Sugar-cane Plant Fed by Vinasse Biogas and Bagasse Surplus for Electricity Generation. J. Clean. Prod. 2023, 413, 137511. [Google Scholar] [CrossRef]
- Wind, Solar Payback Times under a Year in Some Parts of World, Says Rystad. Available online: https://www.pv-magazine.com/2022/10/14/wind-solar-payback-times-under-a-year-in-some-parts-of-world-says-rystad/ (accessed on 23 October 2023).
- Ciuła, J.; Kowalski, S.; Generowicz, A.; Barbusiński, K.; Matuszak, Z.; Gaska, K. Analysis of Energy Generation Efficiency and Reliability of a Cogeneration Unit Powered by Biogas. Energies 2023, 16, 2180. [Google Scholar] [CrossRef]
- Battini, F.; Agostini, A.; Boulamanti, A.; Giuntoli, J.; Amaducci, S. Mitigating the environmental impacts of milk production via anaerobic digestion of manure: Case study of a dairy farm in the Po Valley. Sci. Total Environ. 2014, 481, 196–208. [Google Scholar] [CrossRef]
- Launay, C.; Houot, S.; Frédéric, S.; Girault, R.; Levavasseur, F.; Marsac, S.; Constantin, J. Incorporating energy cover crops for biogas production into agricultural systems: Benefits and environmental impacts. A review. Agron. Sustain. Dev. 2022, 42, 57. [Google Scholar] [CrossRef]
- Ufitikirezi, J.d.D.M.; Filip, M.; Ghorbani, M.; Zoubek, T.; Olšan, P.; Bumbálek, R.; Strob, M.; Bartoš, P.; Umurungi, S.N.; Murindangabo, Y.T.; et al. Agricultural Waste Valorization: Exploring Environmentally Friendly Approaches to Bioenergy Conversion. Sustainability 2024, 16, 3617. [Google Scholar] [CrossRef]
- Regueiro, L.; Carballa, M.; Álvarez, J.A.; Lema, J.M. Enhanced methane production from pig manure anaerobic digestion using fish and biodiesel wastes as co-substrates. Bioresour. Technol. 2012, 123, 507–513. [Google Scholar] [CrossRef]
- Rodriguez-Verde, I.; Regueiro, L.; Carballa, M.; Hospido, A.; Lema, J.M. Assessing anaerobic co-digestion of pig manure with agroindustrial wastes: The link between environmental impacts and operational parameters. Sci. Total Environ. 2014, 497–498, 475–483. [Google Scholar] [CrossRef]
- Gadirli, G.; Pilarska, A.A.; Dach, J.; Pilarski, K.; Kolasa-Więcek, A.; Borowiak, K. Fundamentals, Operation and Global Prospects for the Development of Biogas Plants—A Review. Energies 2024, 17, 568. [Google Scholar] [CrossRef]
- Esteves, E.M.M.; Herrera, A.M.N.; Esteves, V.P.P.; Morgado, C.D.R.V. Life cycle assessment of manure biogas production: A review. J. Clean. Prod. 2019, 219, 411–423. [Google Scholar] [CrossRef]
- Lijó, L.; Lorenzo-Toja, Y.; González-García, S.; Bacenetti, J.; Negri, M.; Moreira, M.T. Eco-efficiency assessment of farm-scaled biogas plants. Bioresour. Technol. 2017, 237, 146–155. [Google Scholar] [CrossRef]
- Fantin, V.; Giuliano, A.; Manfredi, M.; Ottaviano, G.; Stefanova, M.; Masoni, P. Environmental assessment of electricity generation from an Italian anaerobic digestion plant. Biomass Bioenergy 2015, 83, 422–435. [Google Scholar] [CrossRef]
- Sommer, S.; Petersen, S.; Møller, H. Algorithms for calculating methane and nitrous oxide emission from manure management. Nutr. Cycl. Agroecosystems 2004, 69, 143–154. [Google Scholar] [CrossRef]
- Wojcieszak, D.; Pawłowski, A.; Dammer, K.-H.; Przybył, J. Chemical and Energetical Properties in Methane Fermentation of Morphological Parts of Corn with Different Variety Earliness Standard FAO. Agric. Eng. 2023, 27, 273–287. [Google Scholar] [CrossRef]
- Derehajło, S.; Tymińska, M.; Skibko, Z.; Borusiewicz, A.; Romaniuk, W.; Kuboń, M.; Olech, E.; Koszel, M. Heavy Metal Content in Substrates in Agricultural Biogas Plants. Agric. Eng. 2023, 27, 315–329. [Google Scholar] [CrossRef]
- Minott, S.J.; Scott, N.R. Feasibility of Fuel Cells for Energy Conversion on Dairy Farms. In Proceedings of the 2001 ASAE Annual Meeting, California, CA, USA, 30 July–1 August 2001. [Google Scholar] [CrossRef]
- Wu, B.; Bibeau, E.L.; Gebremedhin, K.G. Three-Dimensional Numerical Simulation Model of Biogas Production for Anaerobic Digesters. In Proceedings of the 2006 ASABE Annual International Meeting, Portland, OR, USA, 9–12 July 2006; p. 51. [Google Scholar]
- Mulka, R.; Szlachta, J. State of knowledge concerning modelling anaerobic fermentation processes. Agric. Eng. 2013, 1, 281–290. Available online: https://yadda.icm.edu.pl/yadda/element/bwmeta1.element.ekon-element-000171339087 (accessed on 4 April 2024).
- Buivydas, E.; Navickas, K.; Venslauskas, K. A Life Cycle Assessment of Methane Slip in Biogas Upgrading Based on Permeable Membrane Technology with Variable Methane Concentration in Raw Biogas. Sustainability 2024, 16, 3323. [Google Scholar] [CrossRef]
- Eljamal, R.; Maamoun, I.; Bensaida, K.; Yilmaz, G.; Sugihara, Y.; Eljamal, O. A Novel Method to Improve Methane Generation from Waste Sludge Using Iron Nanoparticles Coated with Magnesium Hydroxide. Renew. Sustain. Energy Rev. 2022, 158, 112192. [Google Scholar] [CrossRef]


| Internal Combustion Engine | |
|---|---|
| Type | WG1605 |
| Cycle | Otto |
| Number of cylinders | 4 |
| Displacement capacity | 1537 L |
| Rated speed | 2700 rpm |
| Rated active power | 20 kW |
| Rated apparent power | 26 kVA |
| Primary energy consumption | 62.5 kW |
| Thermal power | 40.9 kW |
| Flue gas temperature | max 110 °C |
| Coolant temperature | max 95 °C |
| Generator | |
| Type | Asynchronous 4P/IE2 |
| Rated speed | 1500 rpm |
| Rated frequency | 50 Hz |
| Rated voltage | 3 × 400 V |
| Winding connection | triangle |
| Characteristics of the engine–generator group | |
| Electrical efficiency | 32% |
| Total efficiency | 97% |
| Rated voltage | 400 V |
| Rated current | 29 A |
| Rated power factor (cos ϕ) | 0.97 |
| Variable | Average | Standard Deviation | Correlations | ||||
|---|---|---|---|---|---|---|---|
| h | d | t | b | P | |||
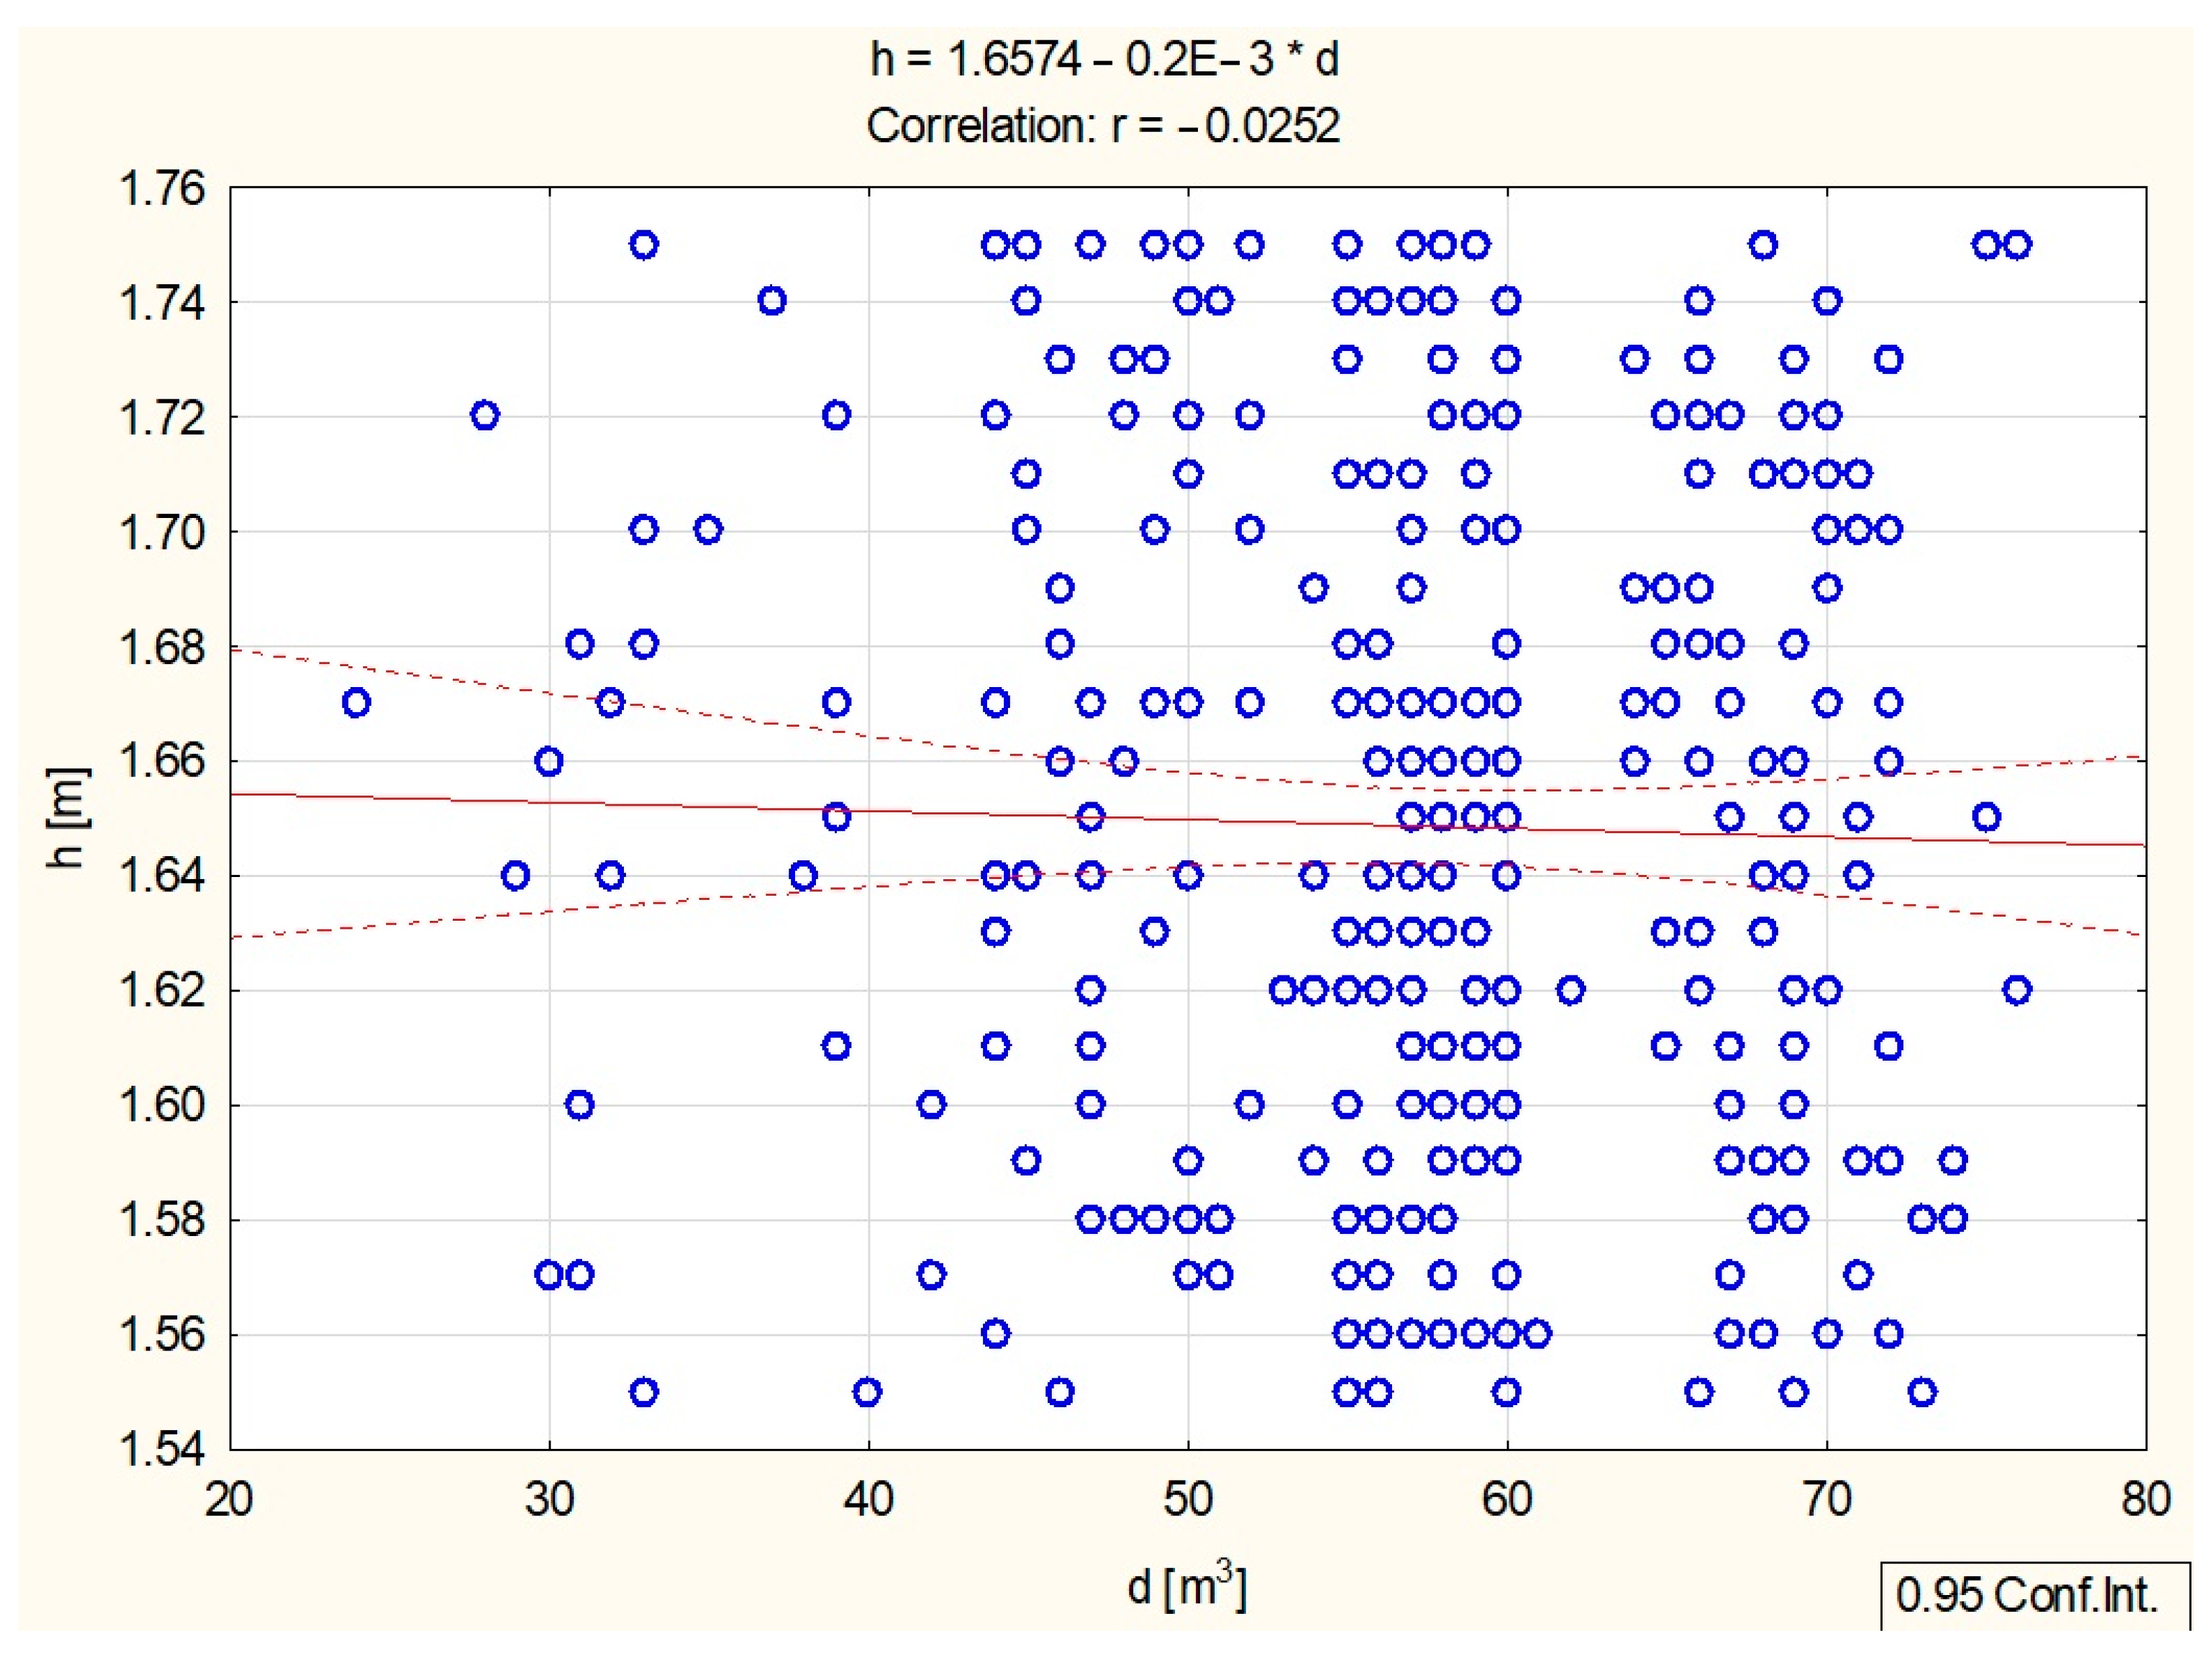
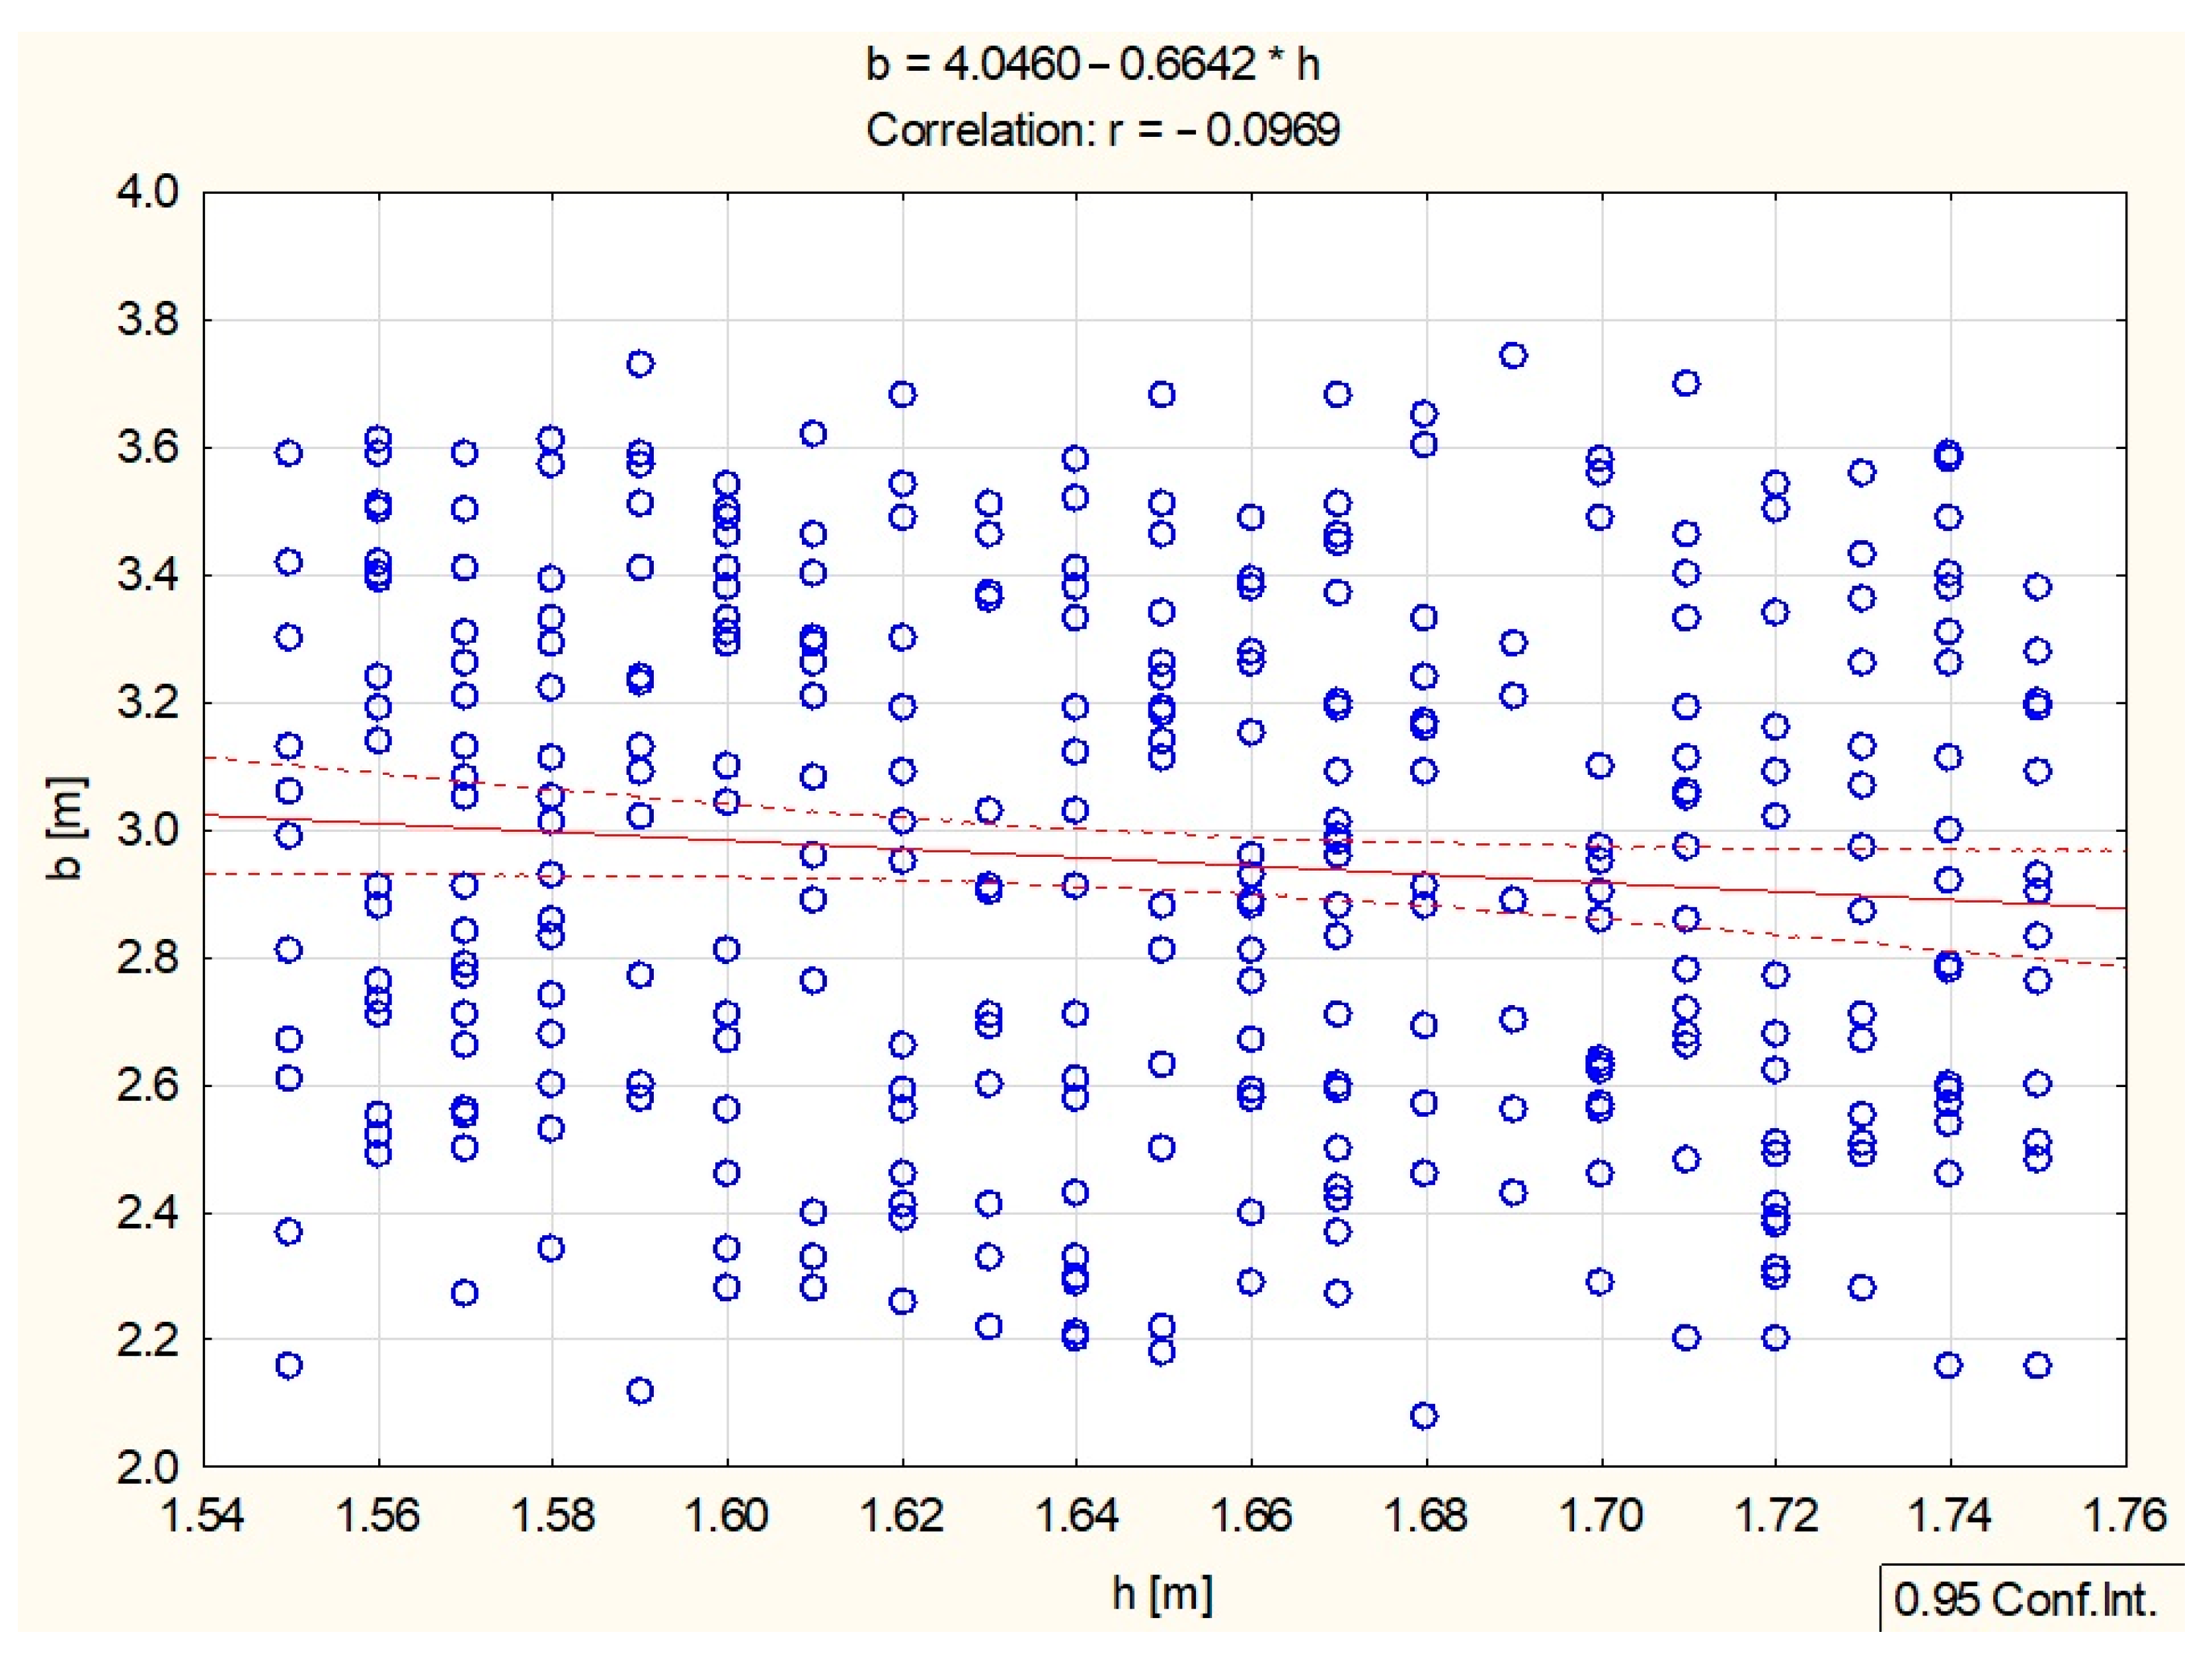
| h [m] | 1.6487 | 0.06039 | 1 | –0.025200 | –0.049520 | –0.096868 | –0.024616 |
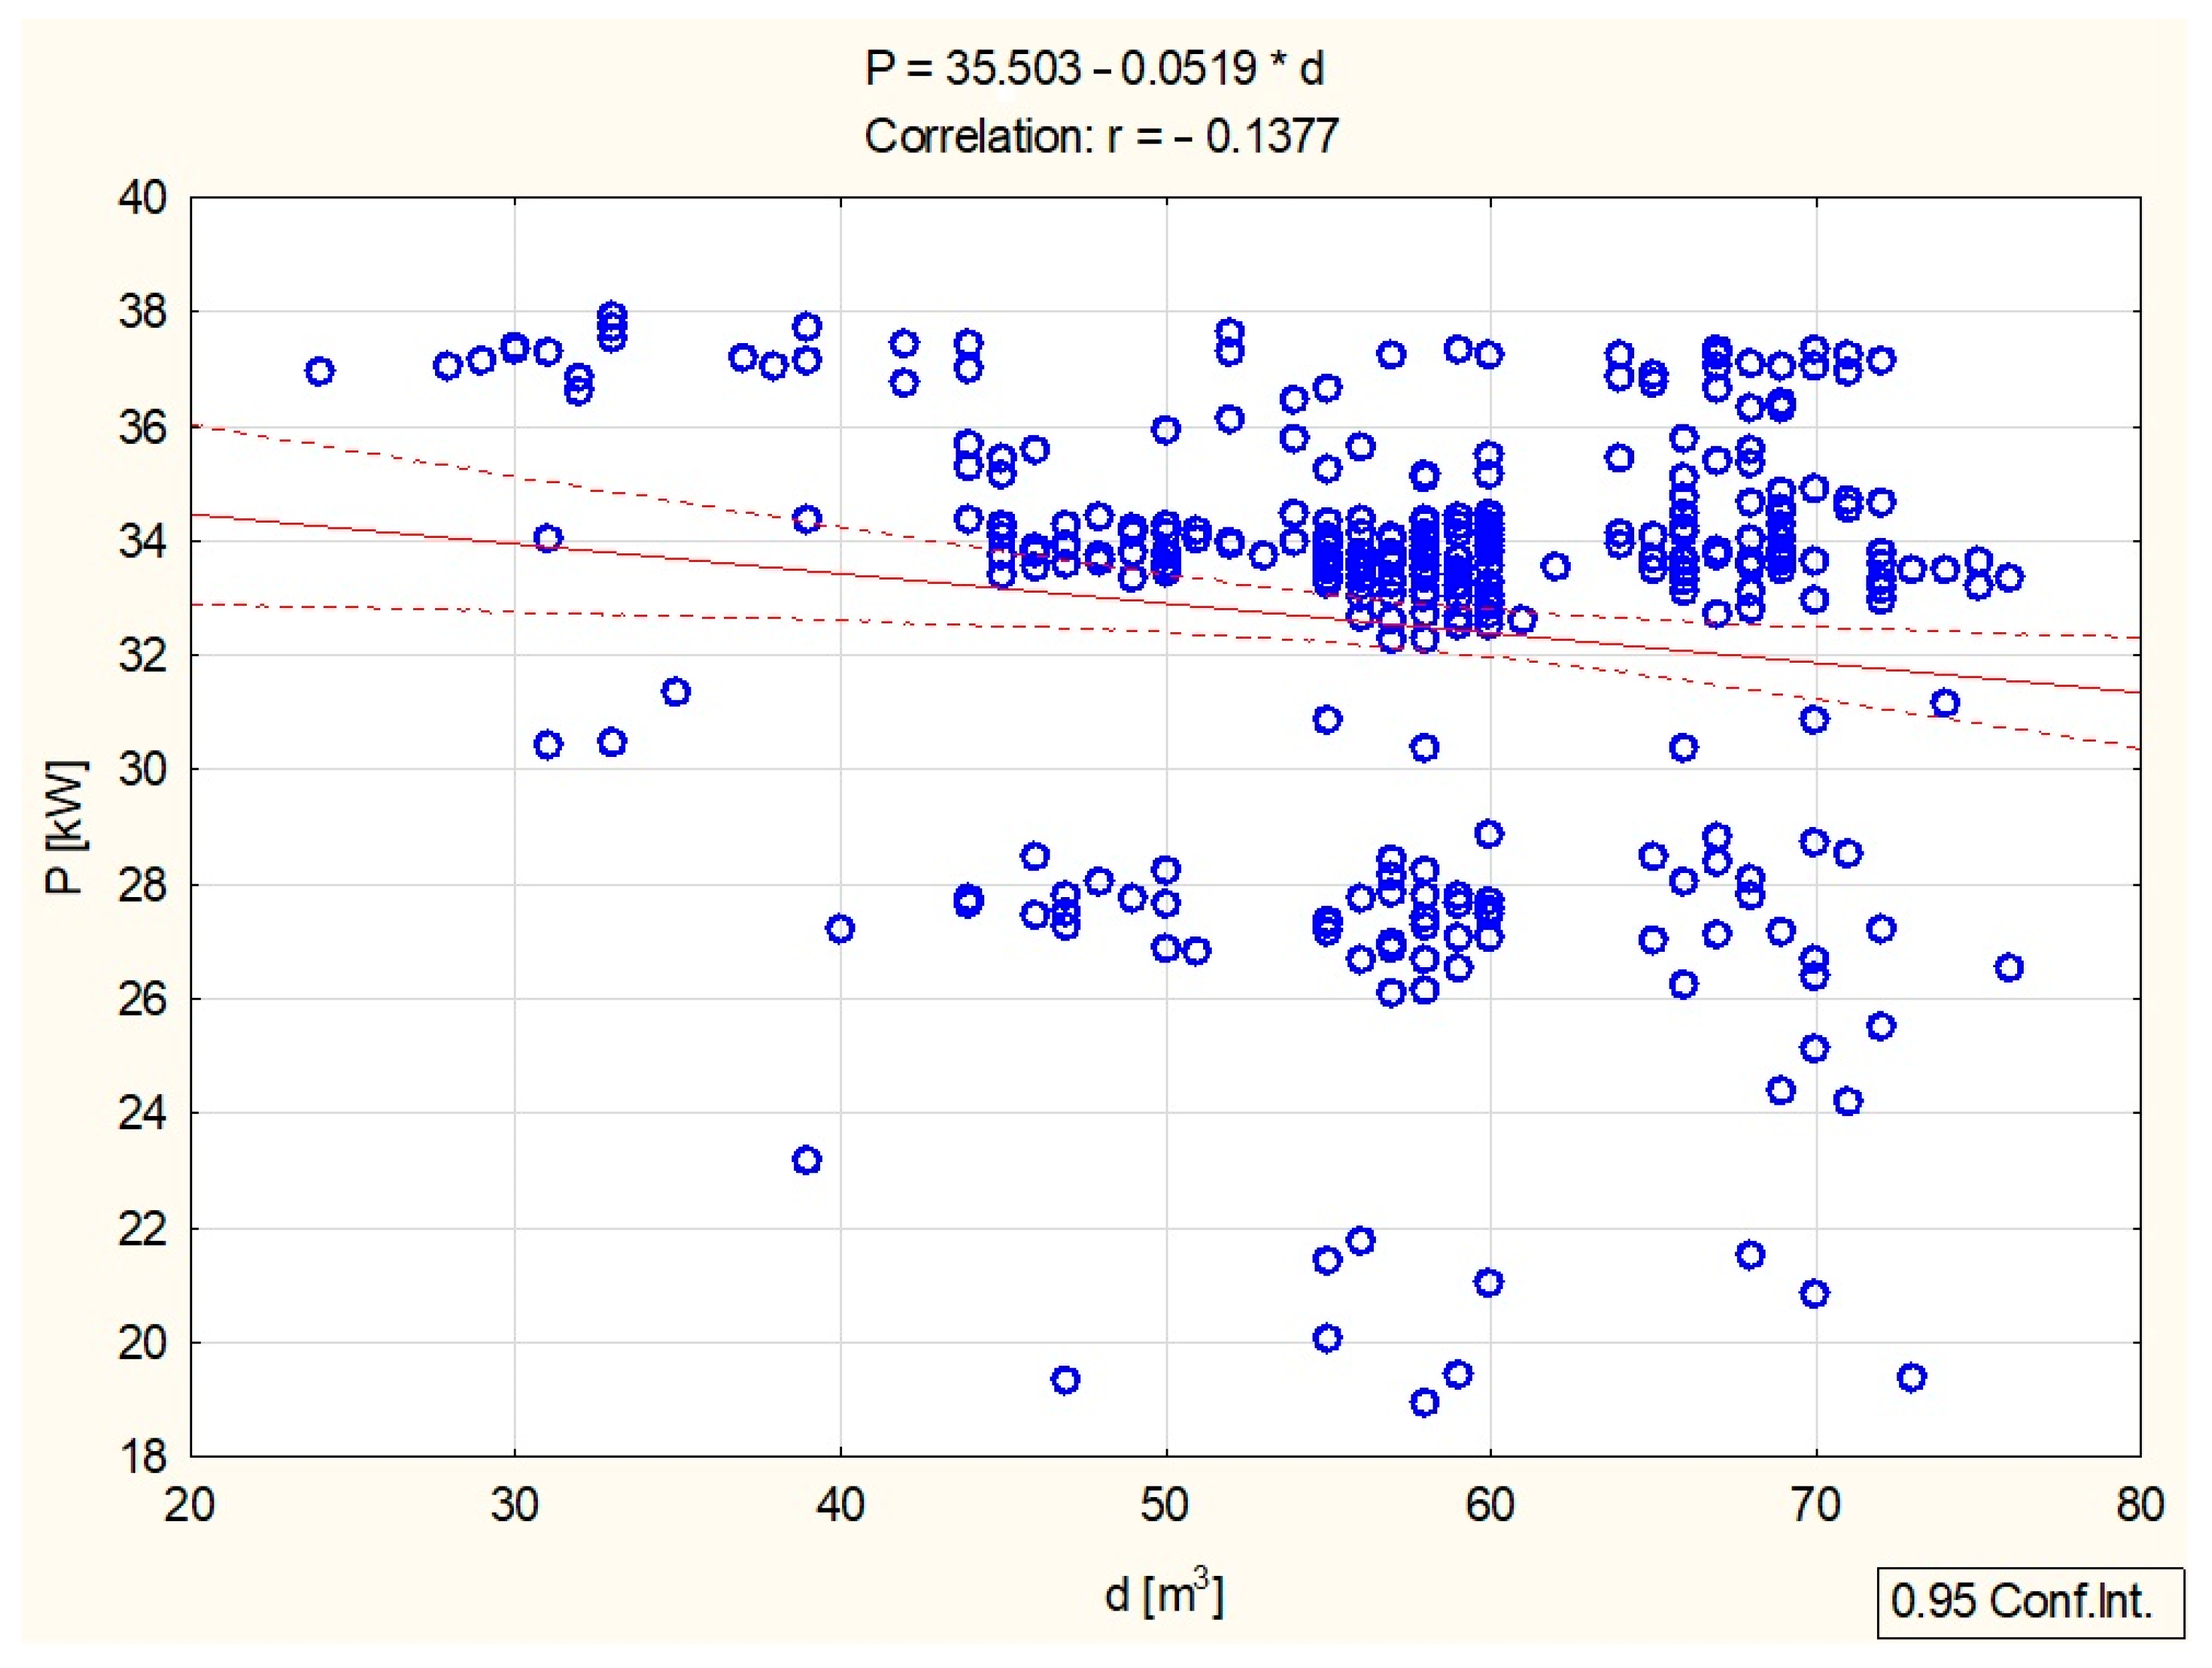
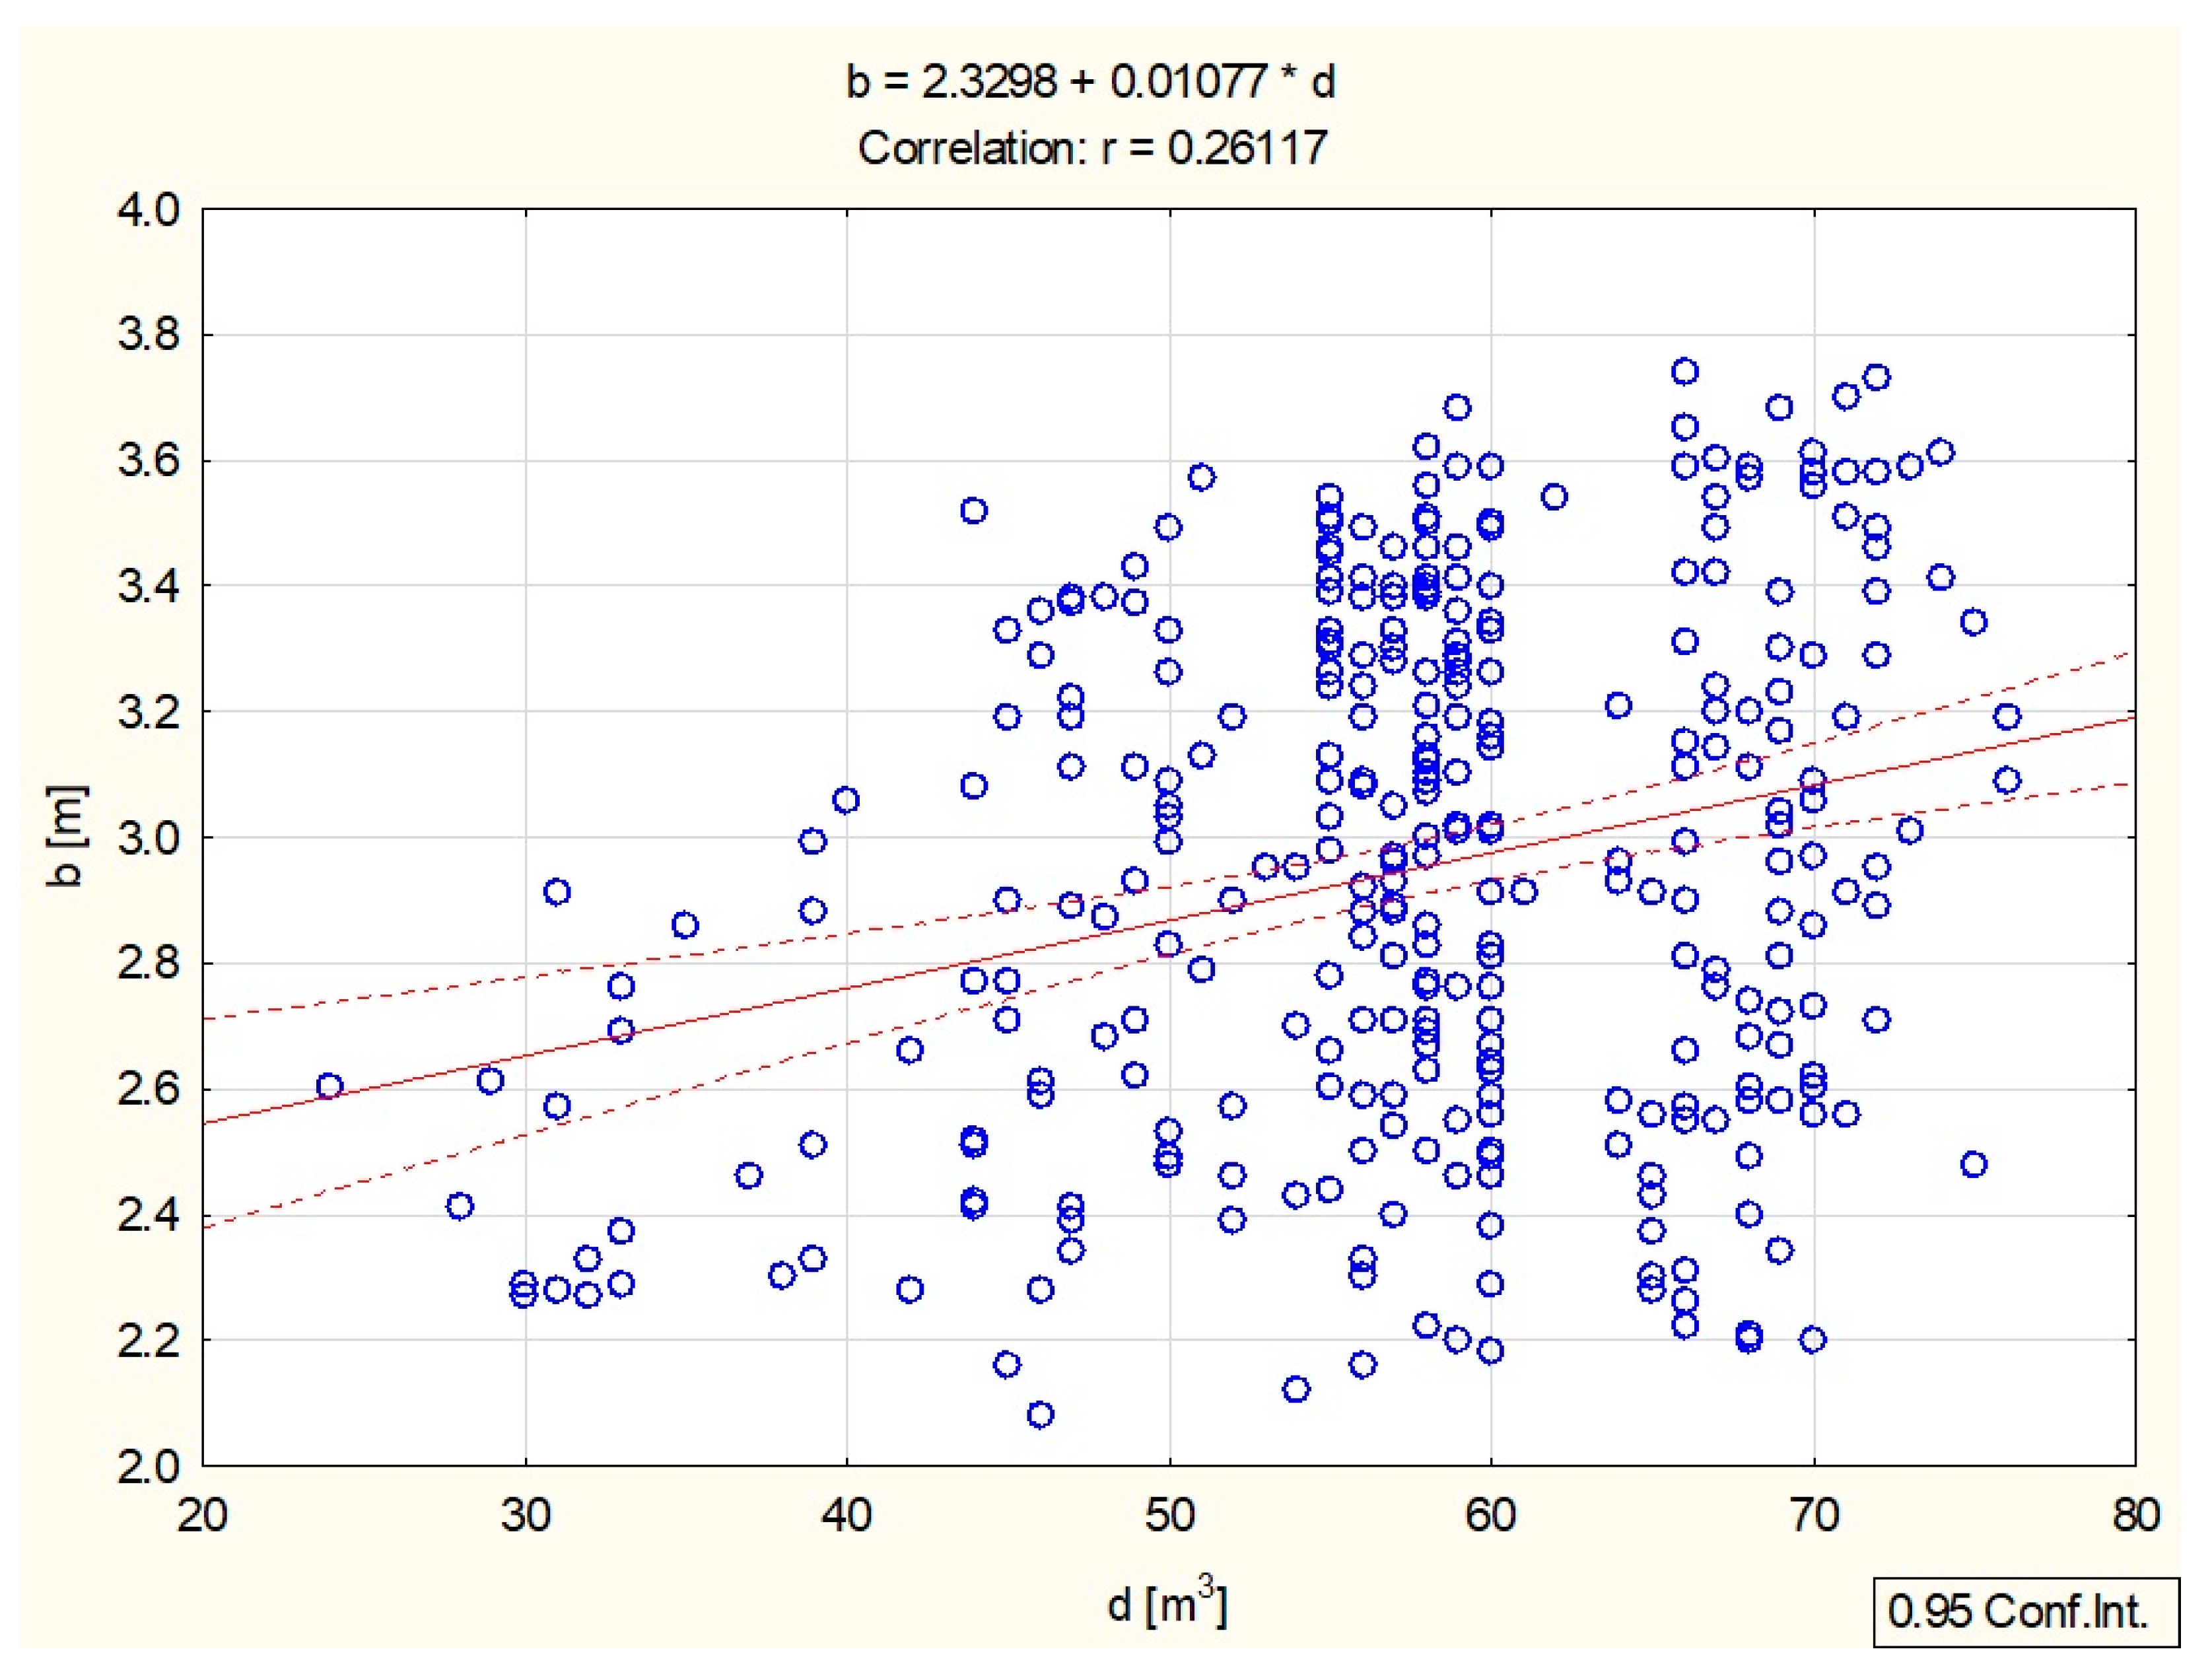
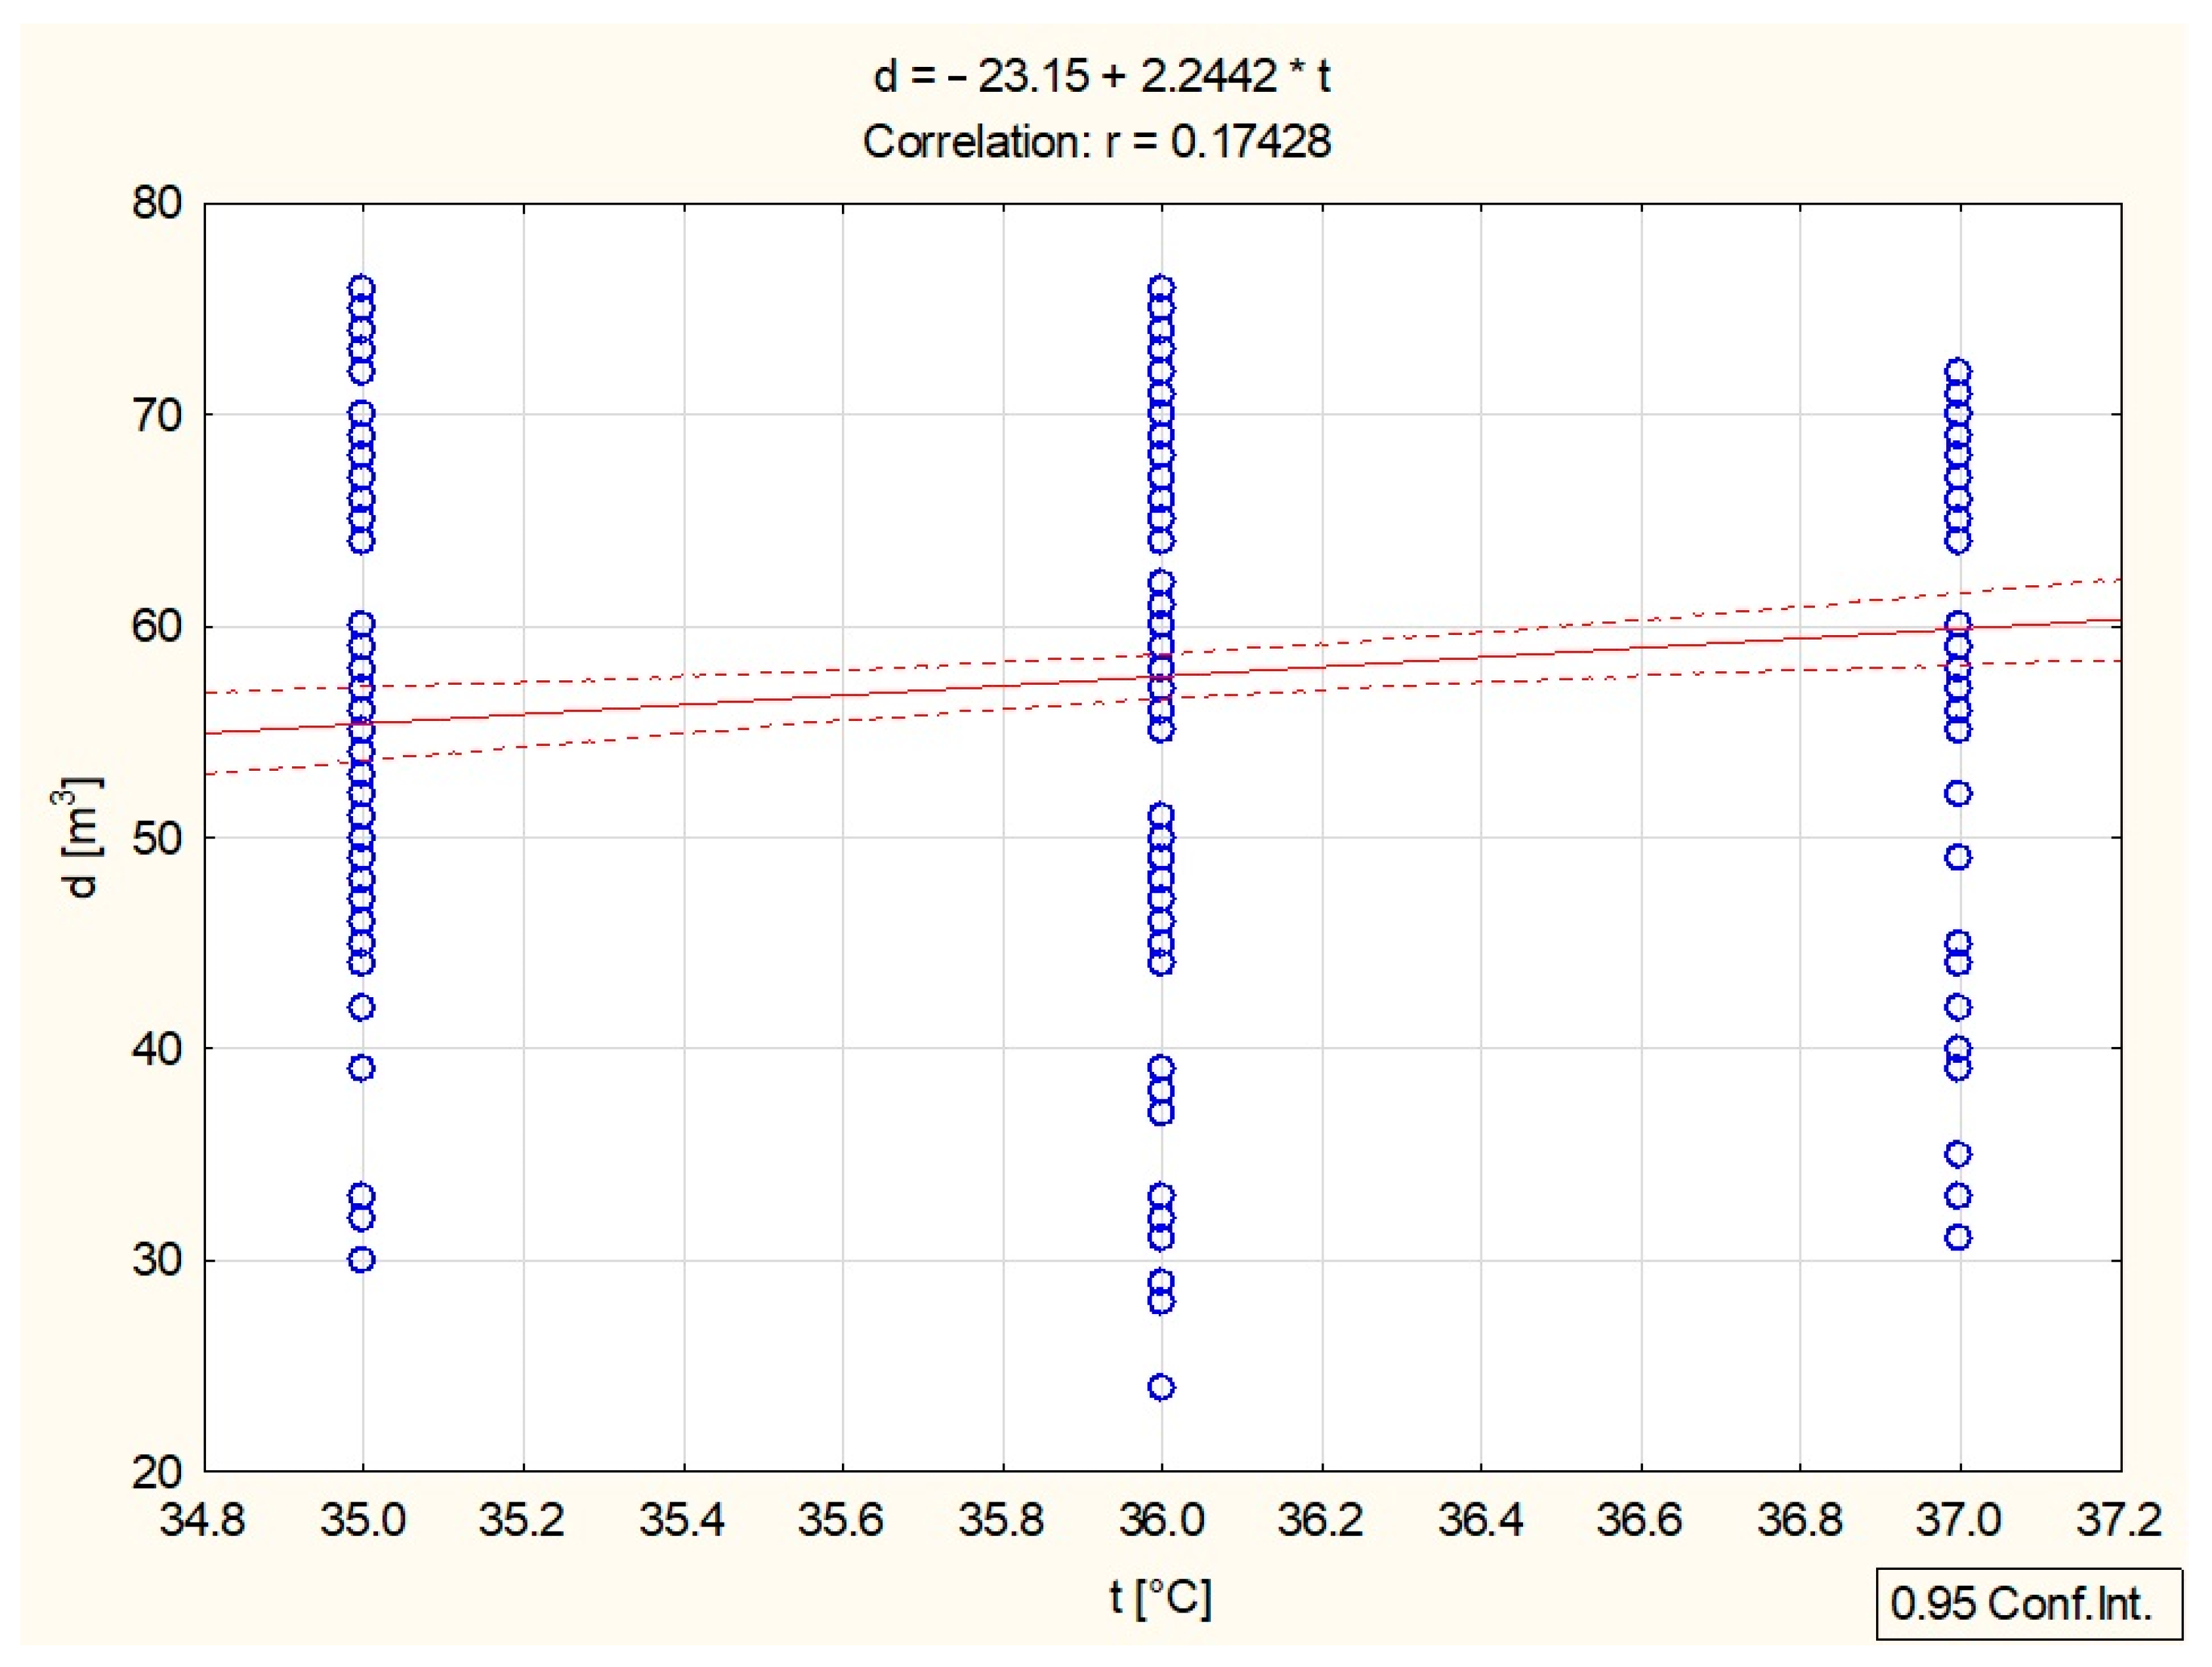
| d [m3] | 57.6657 | 10.04252 | –0.025200 | 1 | 0.174283 | 0.261175 | –0.137680 |
| t [°C] | 36.0089 | 0.77989 | –0.049520 | 0.174283 | 1 | 0.113722 | 0.003637 |
| b [m] | 2.9509 | 0.41412 | –0.096868 | 0.261175 | 0.113722 | 1 | –0.118963 |
| P [kW] | 32.5084 | 3.78794 | –0.024616 | –0.137680 | 0.003637 | –0.118963 | 1 |
Disclaimer/Publisher’s Note: The statements, opinions and data contained in all publications are solely those of the individual author(s) and contributor(s) and not of MDPI and/or the editor(s). MDPI and/or the editor(s) disclaim responsibility for any injury to people or property resulting from any ideas, methods, instructions or products referred to in the content. |
© 2024 by the authors. Licensee MDPI, Basel, Switzerland. This article is an open access article distributed under the terms and conditions of the Creative Commons Attribution (CC BY) license (https://creativecommons.org/licenses/by/4.0/).
Share and Cite
Kuboń, M.; Skibko, Z.; Borusiewicz, A.; Romaniuk, W.; Gajda, J.S.; Kłosowska, O.; Wasąg, Z. Influence of the Parameters of an Agricultural Biogas Plant on the Amount of Power Generated. Appl. Sci. 2024, 14, 4200. https://doi.org/10.3390/app14104200
Kuboń M, Skibko Z, Borusiewicz A, Romaniuk W, Gajda JS, Kłosowska O, Wasąg Z. Influence of the Parameters of an Agricultural Biogas Plant on the Amount of Power Generated. Applied Sciences. 2024; 14(10):4200. https://doi.org/10.3390/app14104200
Chicago/Turabian StyleKuboń, Maciej, Zbigniew Skibko, Andrzej Borusiewicz, Wacław Romaniuk, Jakub St. Gajda, Olivia Kłosowska, and Zbigniew Wasąg. 2024. "Influence of the Parameters of an Agricultural Biogas Plant on the Amount of Power Generated" Applied Sciences 14, no. 10: 4200. https://doi.org/10.3390/app14104200
APA StyleKuboń, M., Skibko, Z., Borusiewicz, A., Romaniuk, W., Gajda, J. S., Kłosowska, O., & Wasąg, Z. (2024). Influence of the Parameters of an Agricultural Biogas Plant on the Amount of Power Generated. Applied Sciences, 14(10), 4200. https://doi.org/10.3390/app14104200