
Features of the Stress–Strain State of 3D Metal Objects Produced by Additive Microplasma Deposition of the Powder of a Fe–Cr–Ni–B–Si System

 , ,
, ,  , , and
Abstract
:1. Introduction
- Investigations of the regularities of the influence of the technological procedures of layer–by–layer deposition on the peculiarities of the formation of the structure and properties of 3D metal objects were performed;
- The prediction of the stress–strain state of the produced 3D metal objects was carried out;
- The development of basic technological procedures of additive microplasma deposition, aimed at minimizing the stress–strain state of the produced 3D objects, was carried out.
2. Materials and Methods
- selection of the technological diagram of the process of additive powder microplasma deposition, filler materials, and tentative mode parameters;
- selection of spatial geometrical prototypes of the main basic shapes of the deposited 3D products and finite element modeling of their stress–strain state;
- correction of the selected tentative parameters of the technological mode of microplasma deposition, taking into account the possibilities for minimizing the residual stressed state of a 3D product, produced by additive deposition;
- development of an experimental stand for technological studies with a plasmatron of an original design, which ensures a stable laminar mode of compressed plasma generation;
- conducting experiments on the deposition of spatial geometric primitives via the microplasma method;
- metallographic studies of the deposited samples, determination of the presence of the characteristic defects and ways to eliminate them, and making the necessary corrections at selection of the deposition modes;
- analysis of the results of powder microplasma deposition, and determination of the technological potential of the process.
3. Results and Discussion
3.1. Technological Studies of the Formation of Spatial Primitives Using Additive Deposition Processes
- (1)
- The plate on which the product was deposited was significantly deformed along the vertical axis. To avoid such an effect, it was decided to use deposition fixtures, which would contain and preserve the plane geometry of the plate;
- (2)
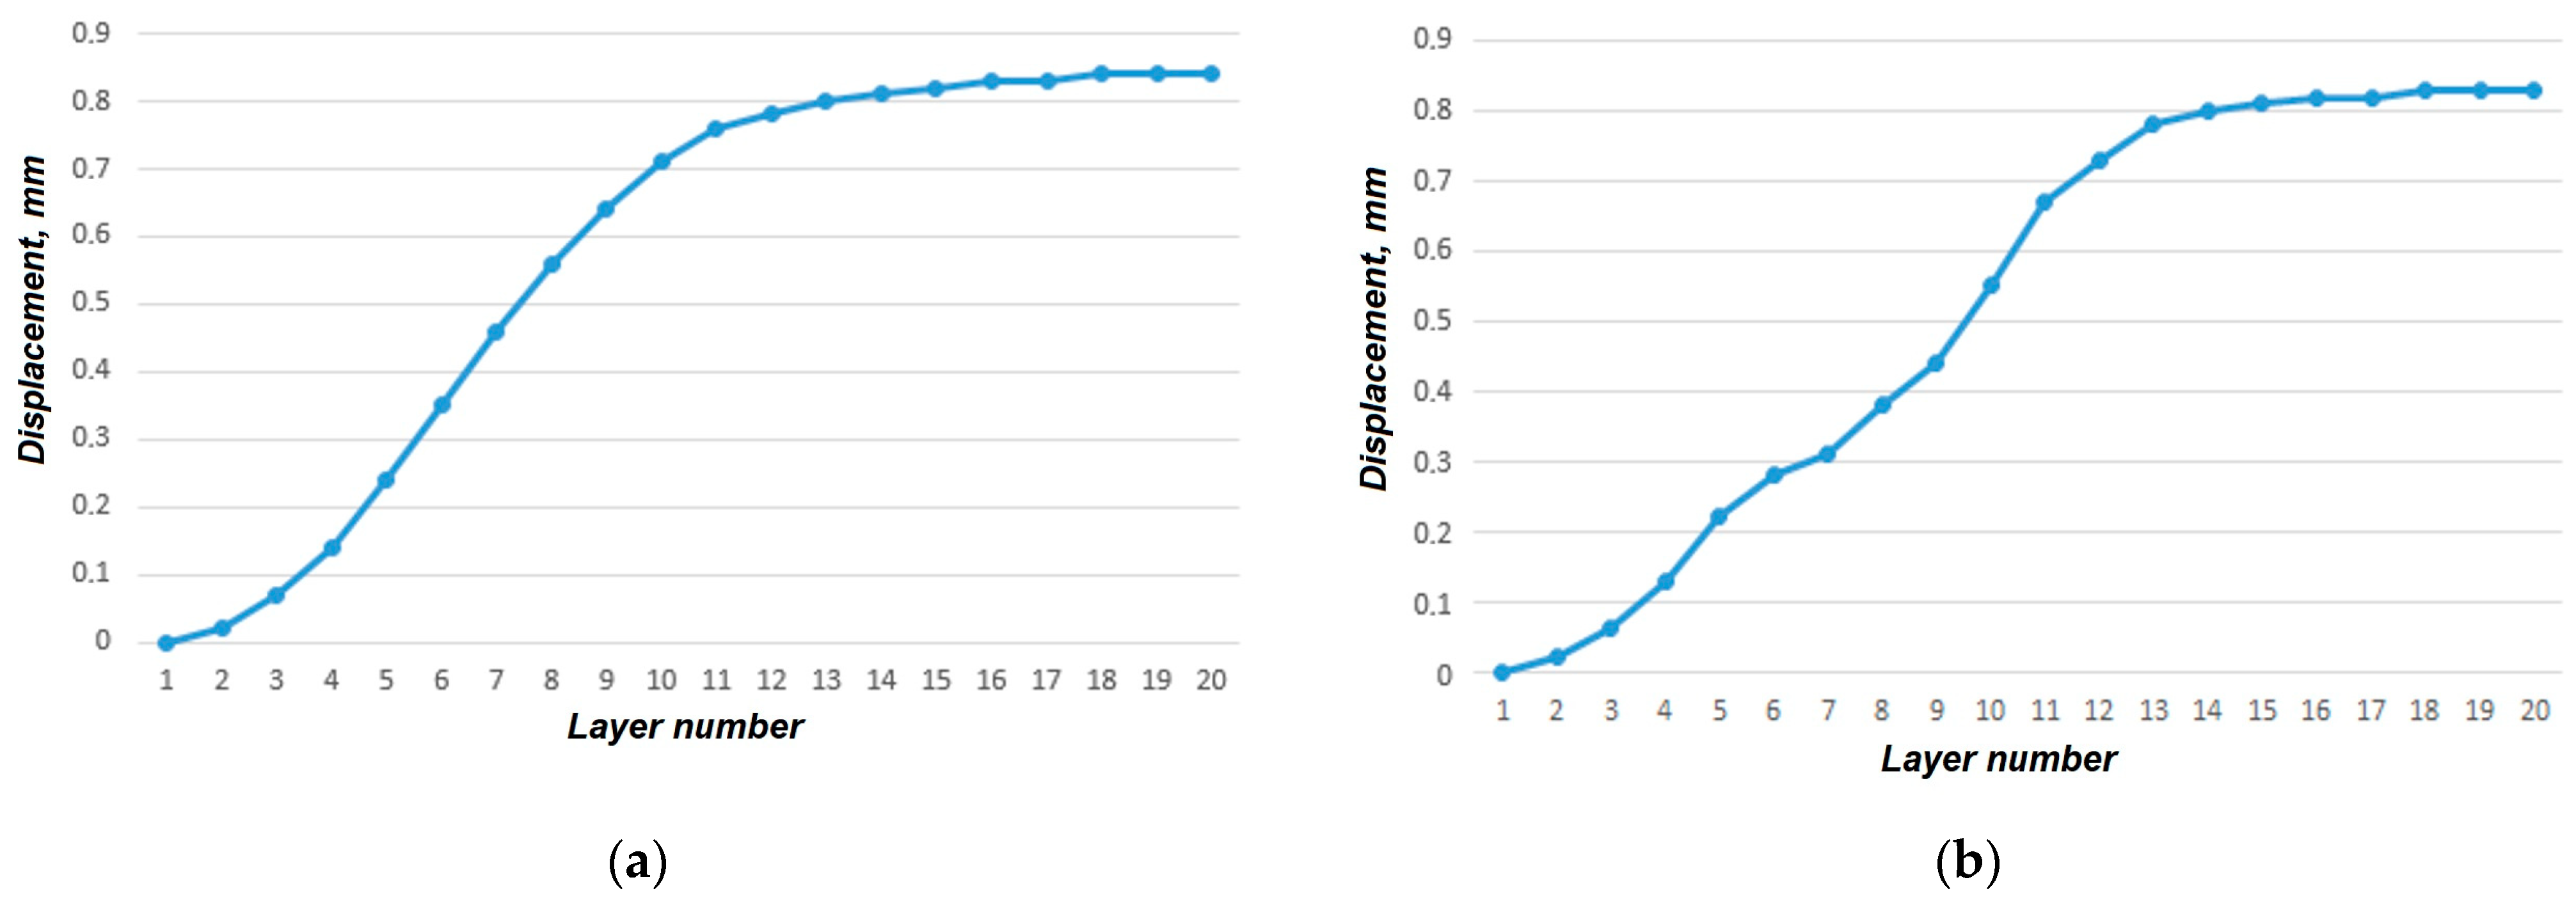
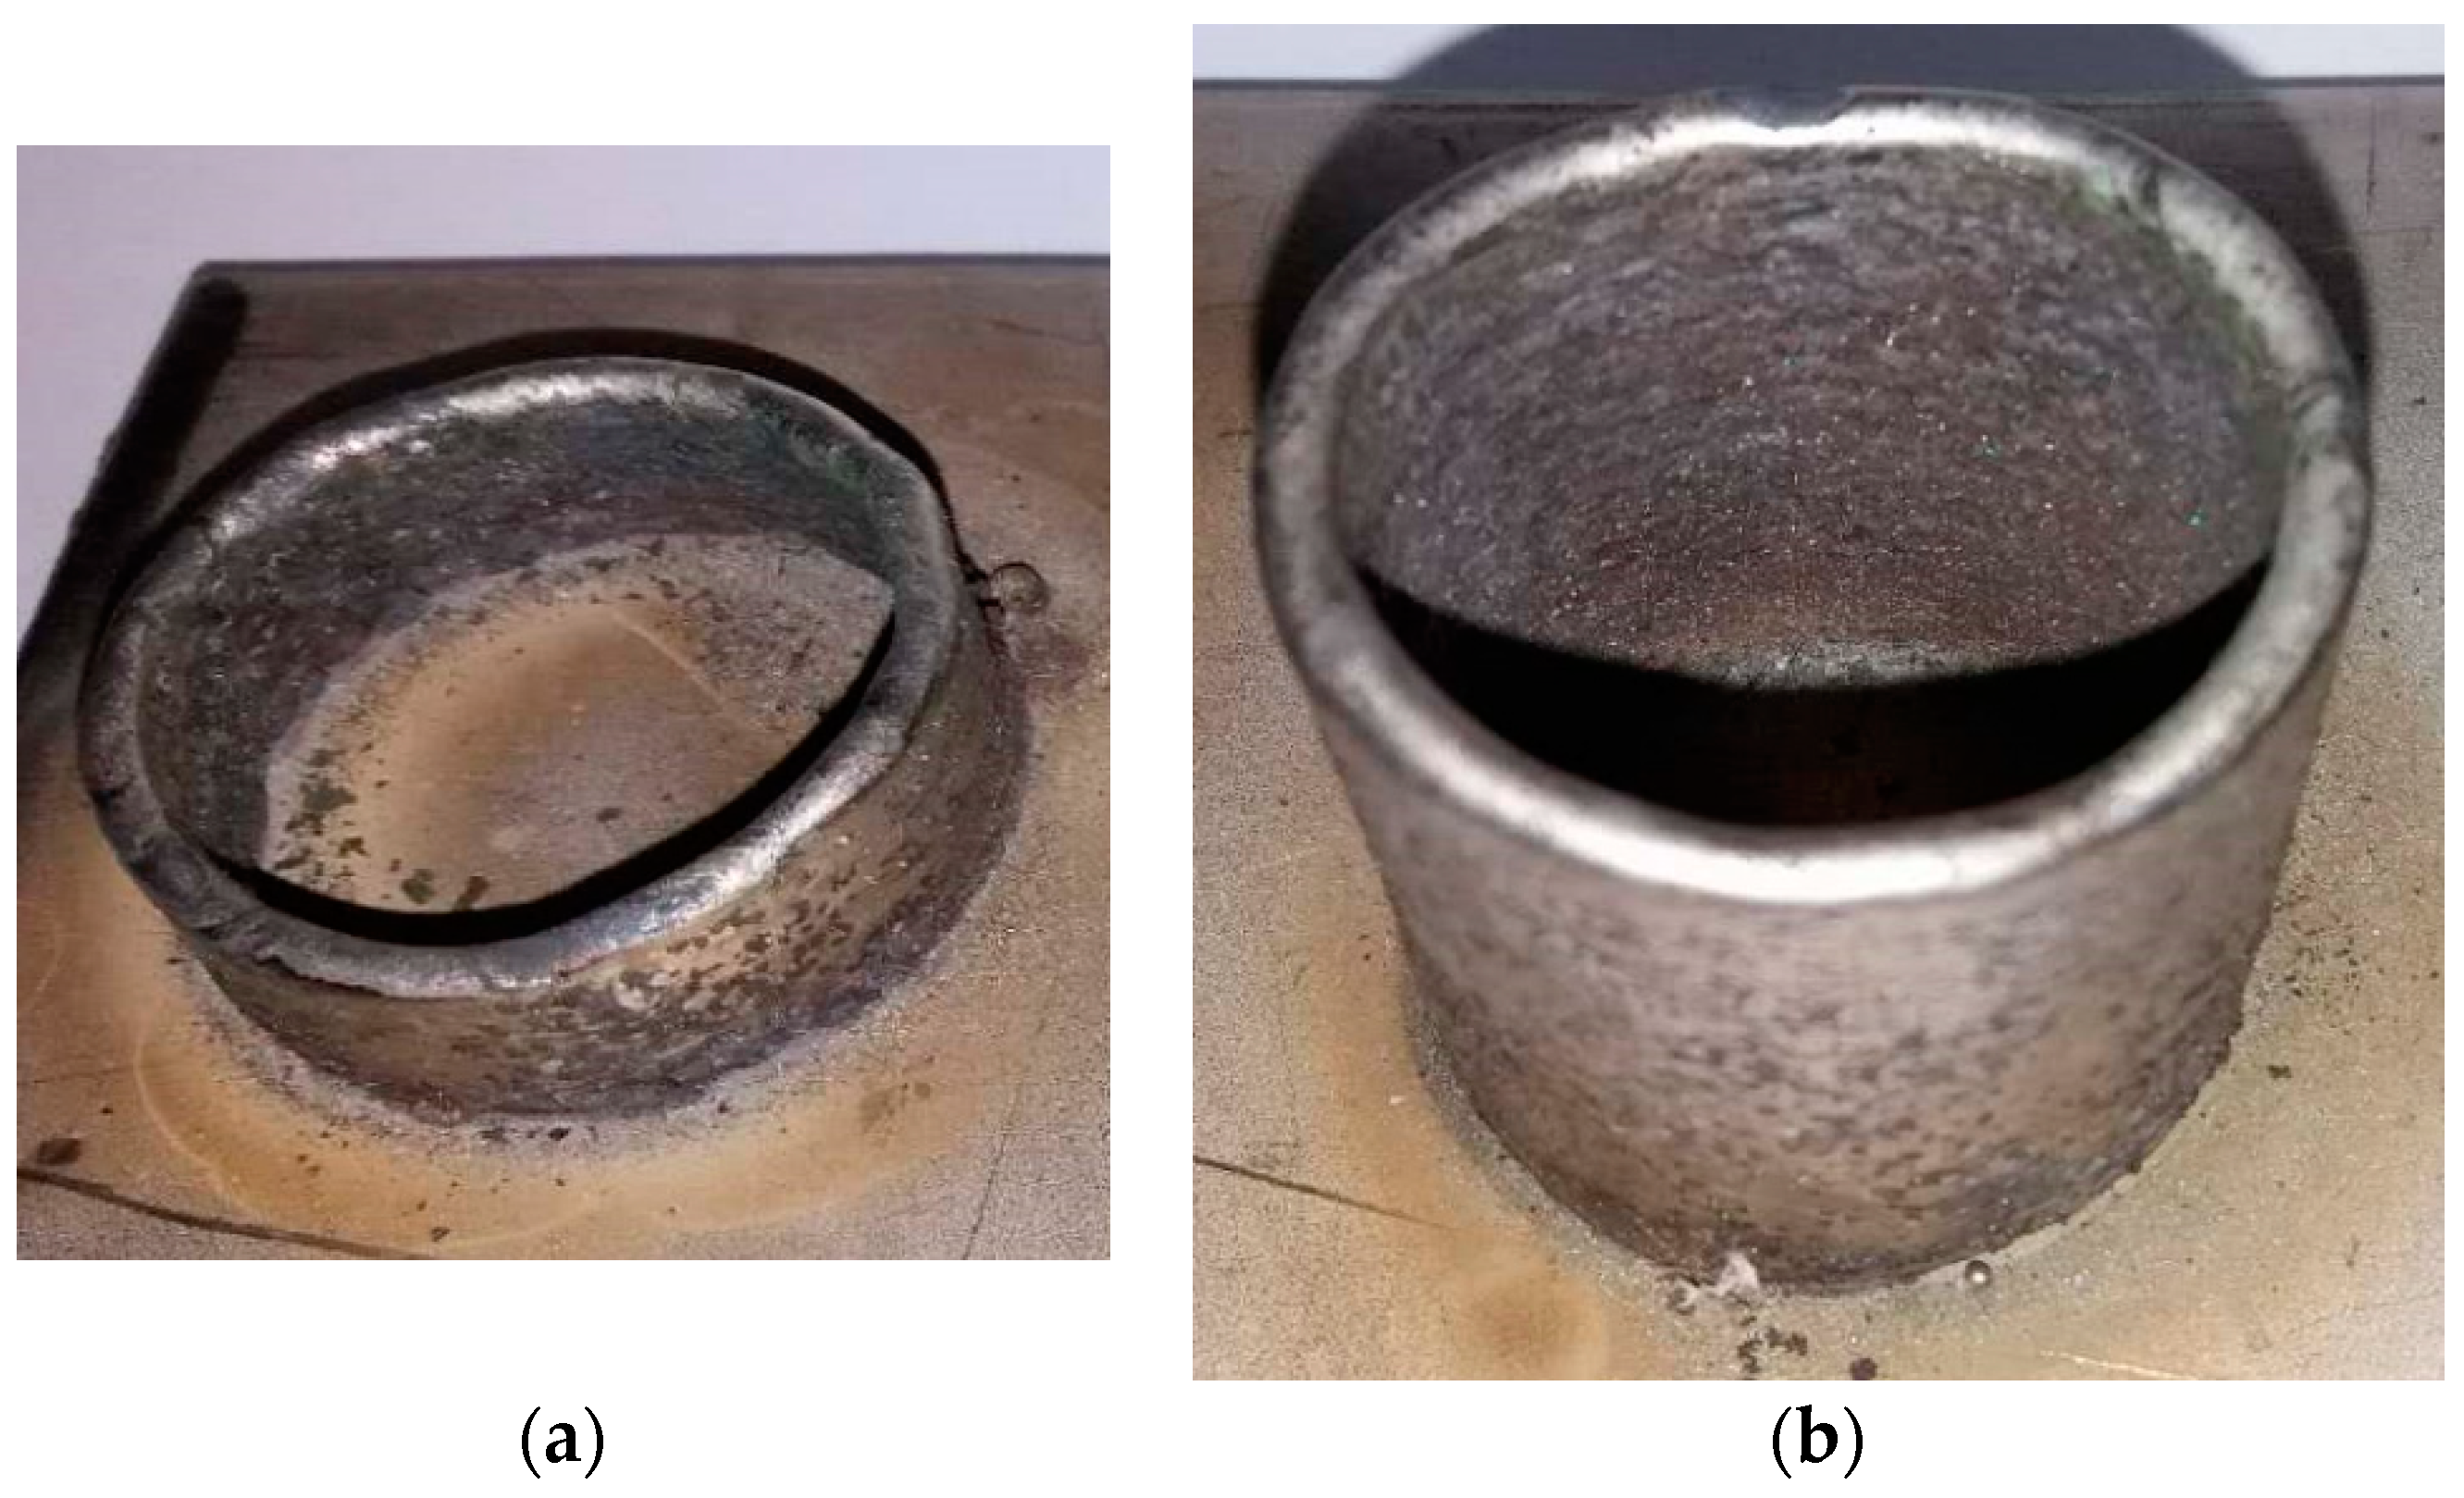
- A product of a cylindrical shape was prone to radial displacement; after 20 deposited layers, the product diameter was reduced by almost 1 mm. To prevent such deformation, a conclusion was made about the need to compensate for the deformation by means of a gradual increase in the diameter during part deposition.
3.2. Metallographic Investigations of the Results of Manufacturing Metal Spatial Primitives via the Additive Deposition Method
3.3. Prediction of the Stress–Strain State of the Produced Metal 3D-Objects
- -
- movements or pinching (in at least one point on the body’s surface):where is the surface (or surface point), on which movement is assigned;
- -
- symmetrywhere n = ni is the vector of the normal to the surface; is the surface of symmetry of the body;
- -
- from the action of an external forcewhere p = pi is the vector of external force, acting on surface ;
- -
- from the action of an external pressurewhere p is the external pressure assigned on the surface , Pa [30].
- Cylindrical prototype (X;Y;Z): −0.22–0.22; −0.17–0.21; −0.17–0.13;
- Prototype of the hollow triangular prism (X;Y;Z): −0.24–0.20; −0.25–0.2; −0.14–0.12;
- Prototype of the hollow square prism (X;Y;Z): −0.24–0.25; −0.23–0.23; −0.14–0.10;
- Prototype of the reverse cone (X;Y;Z): −0.25–0.25; −0.23–0.25; −0.12–0.12;
- Prototype of the straight cone (X;Y;Z): −0.12–0.13; −0.11–0.13; −0.20–0.13.
3.4. Development of the Basic Techniques of Additive Manufacturing
4. Discussion of the Research Results
4.1. Analysis of the Influence of the Main Parameters of Microplasma Arc and the Two–Phase Flow of “Microplasma–Filler Powder” on the Dimensions of the Deposited Layer
4.2. Prediction of the Stress–Strain State of the Deposited Products, Allowing for the Statistical Data on the Change in Their Geometry
5. Conclusions
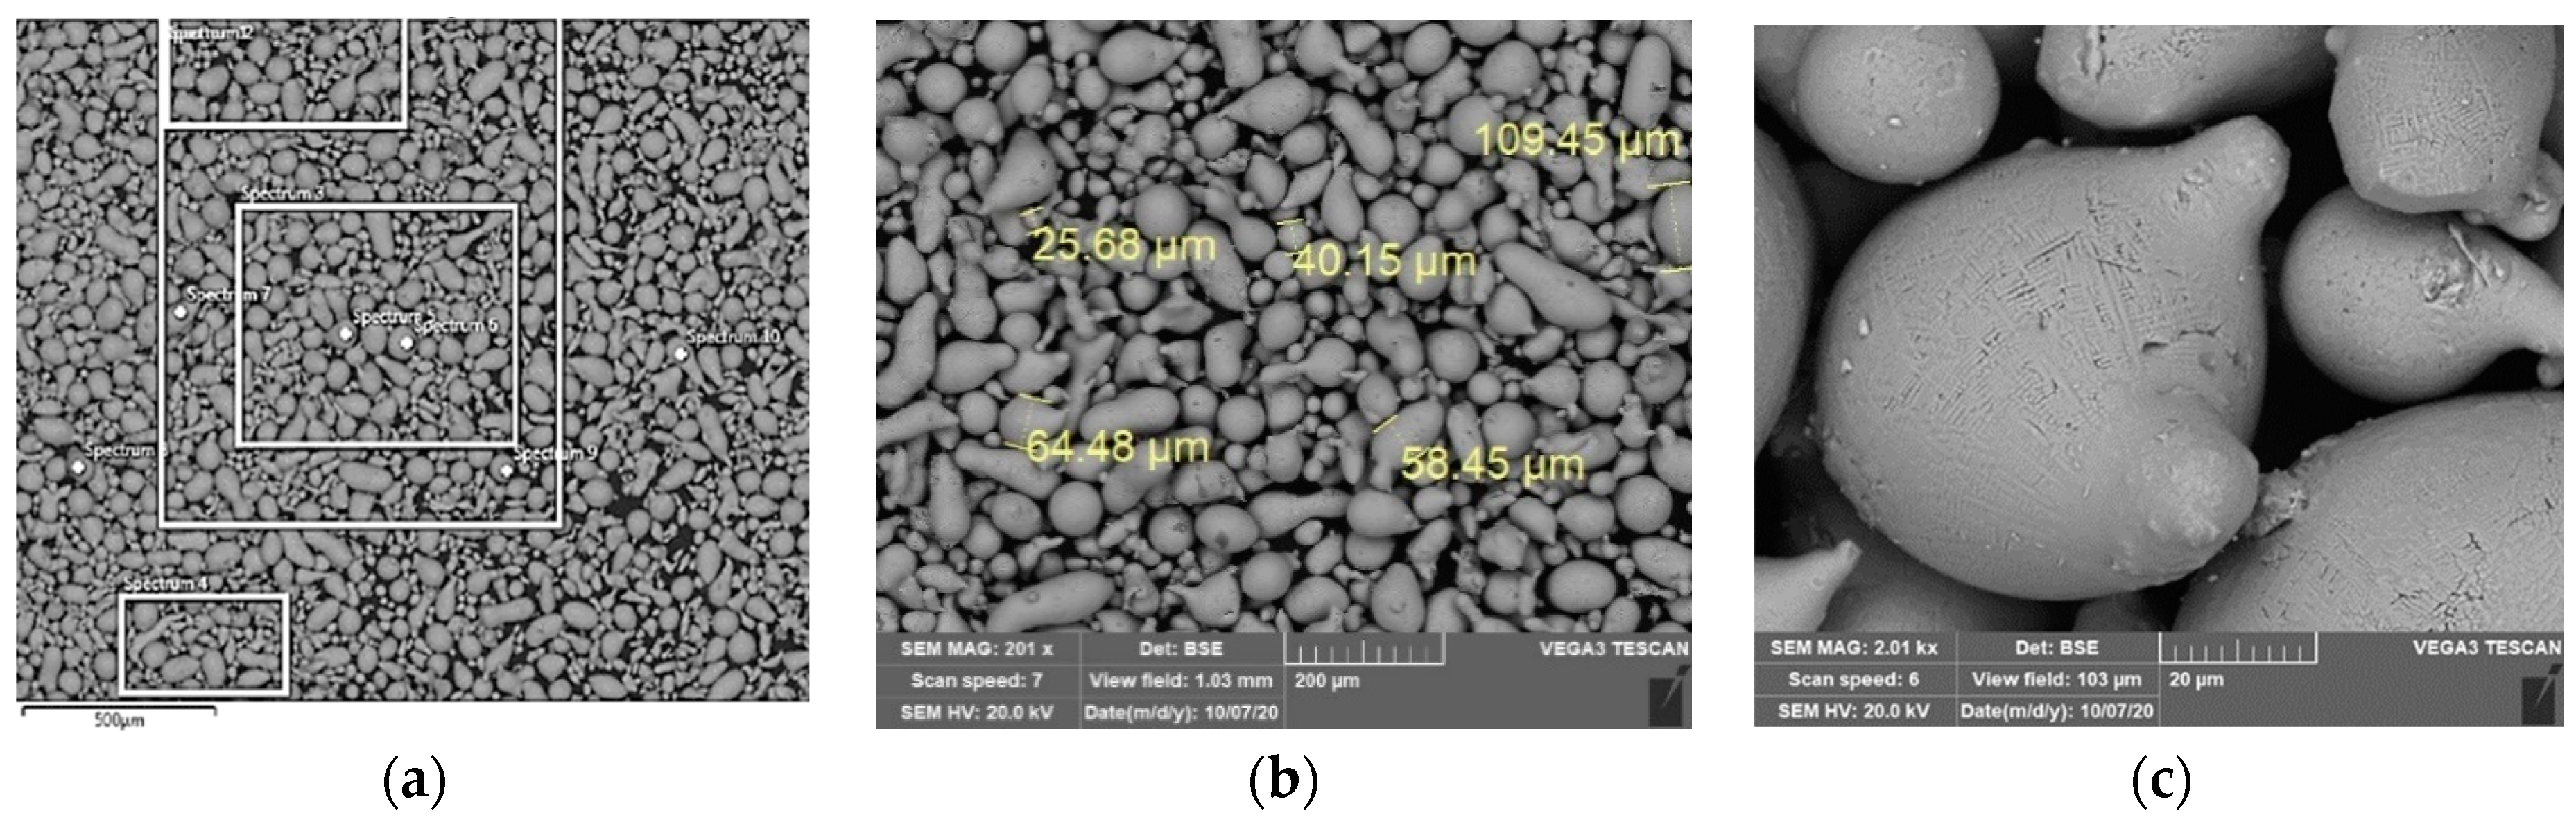
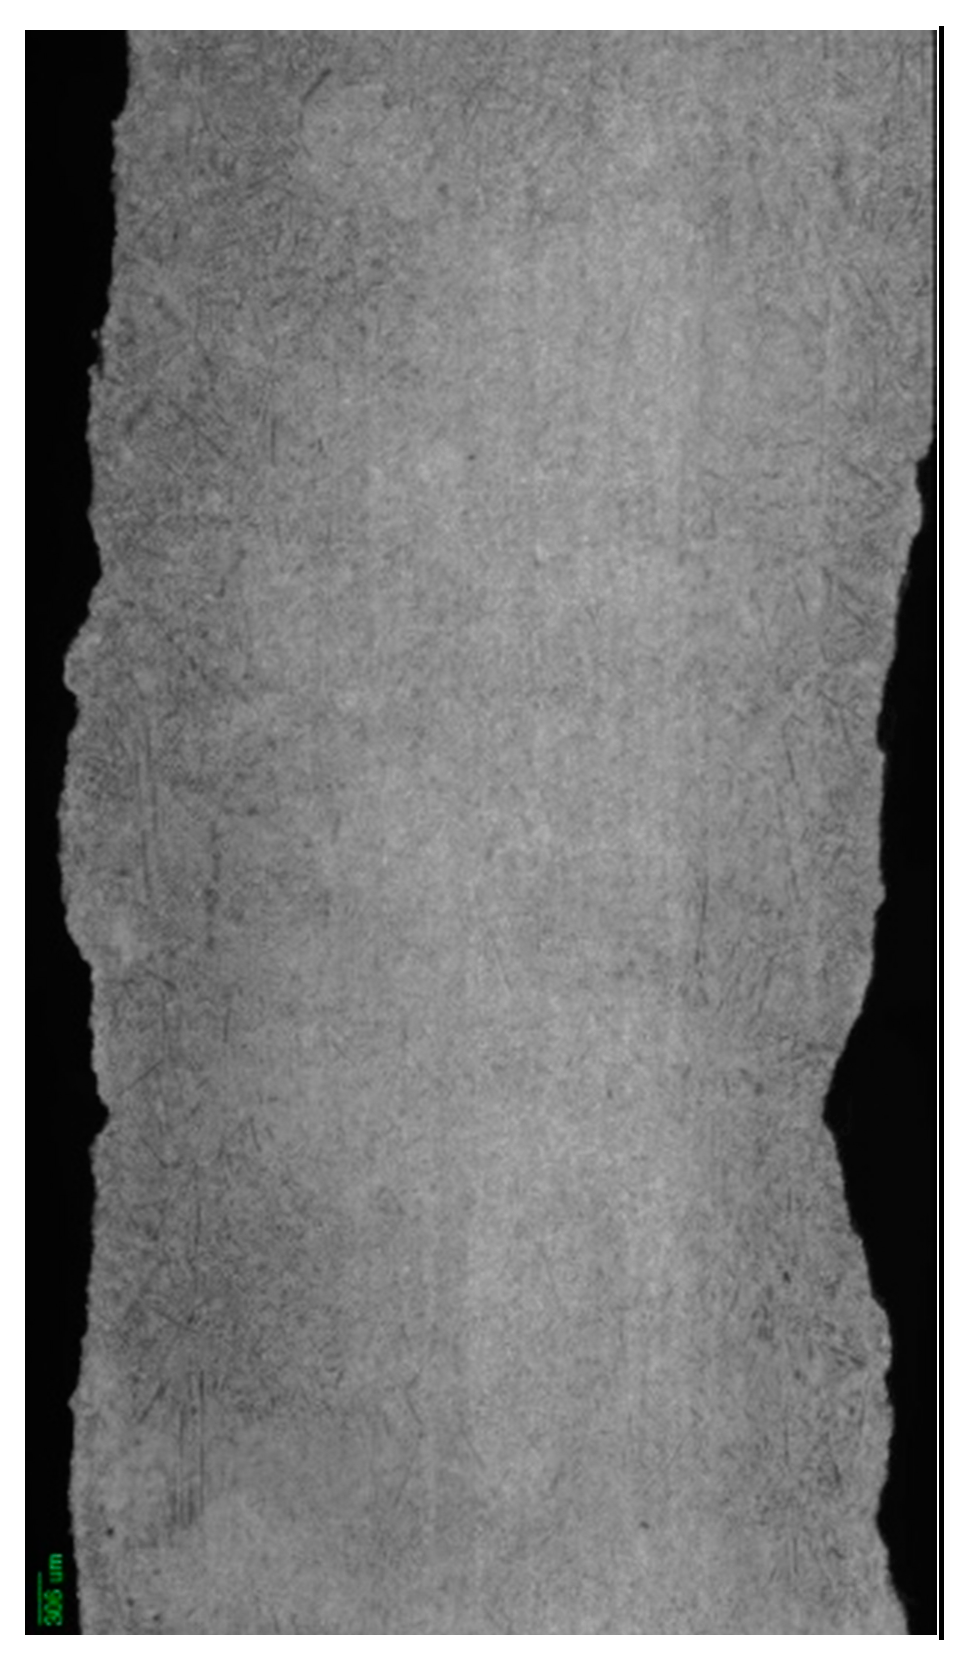
- It was established that additive microplasma deposition of powder of Fe–Cr–Ni–B–Si system (40–60 µm particle size) results in the formation of a layered metal structure with the deposited layer height of the order of 650 µm and wall thickness of 3.0–3.5 mm. Metal distribution by the sample height is uniform. Additive formation of a sample by powder deposition results in the appearance of colonies of coarse and fine dendrites, the size and orientation of which change along the wall height. The deposited metal has a presumably austenitic structure with (40–100) × (200–600) µm grain size and 15–30 µm substrain size (lower and middle part) with its refinement in the upper part and reduction of grain shape coefficient ᴔ by 1.3 times on average. The subgrain structure of the deposited metal is of a cellular type, and it provides a certain effect of metal strengthening. Deposited metal ensures a high ultimate strength (more than 600 MPa). Susceptibility to porosity or cracking is absent;
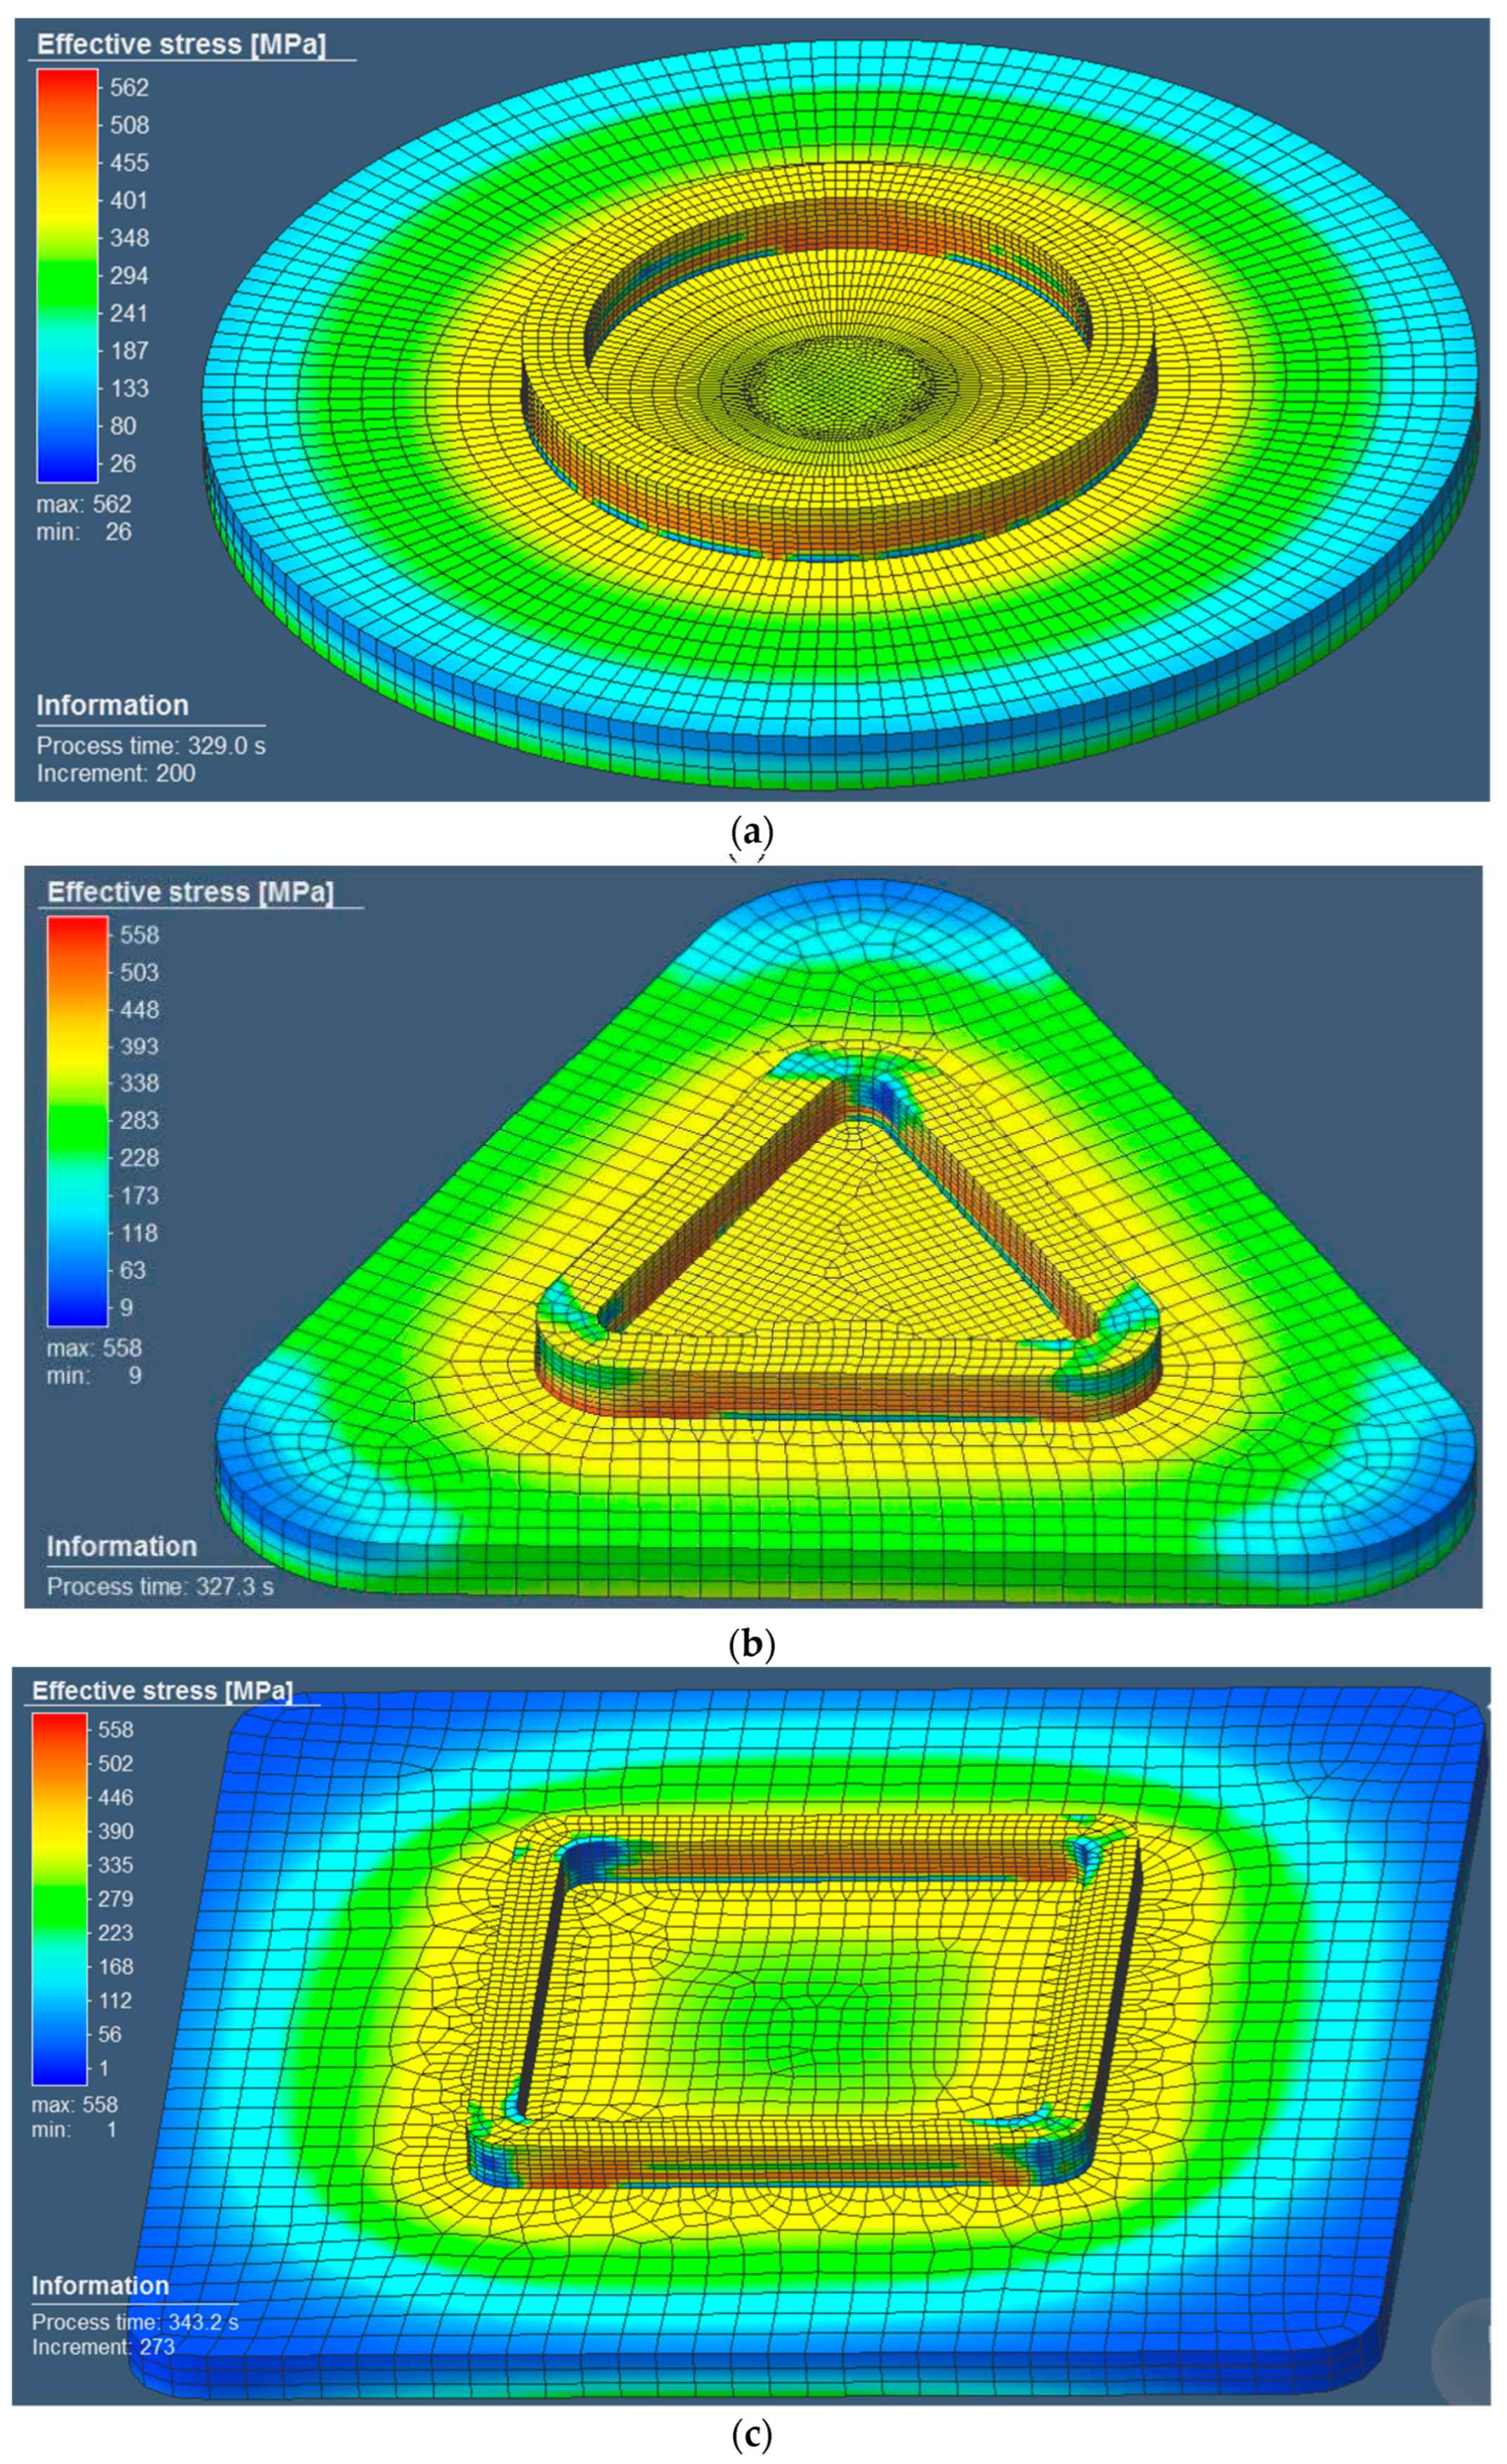
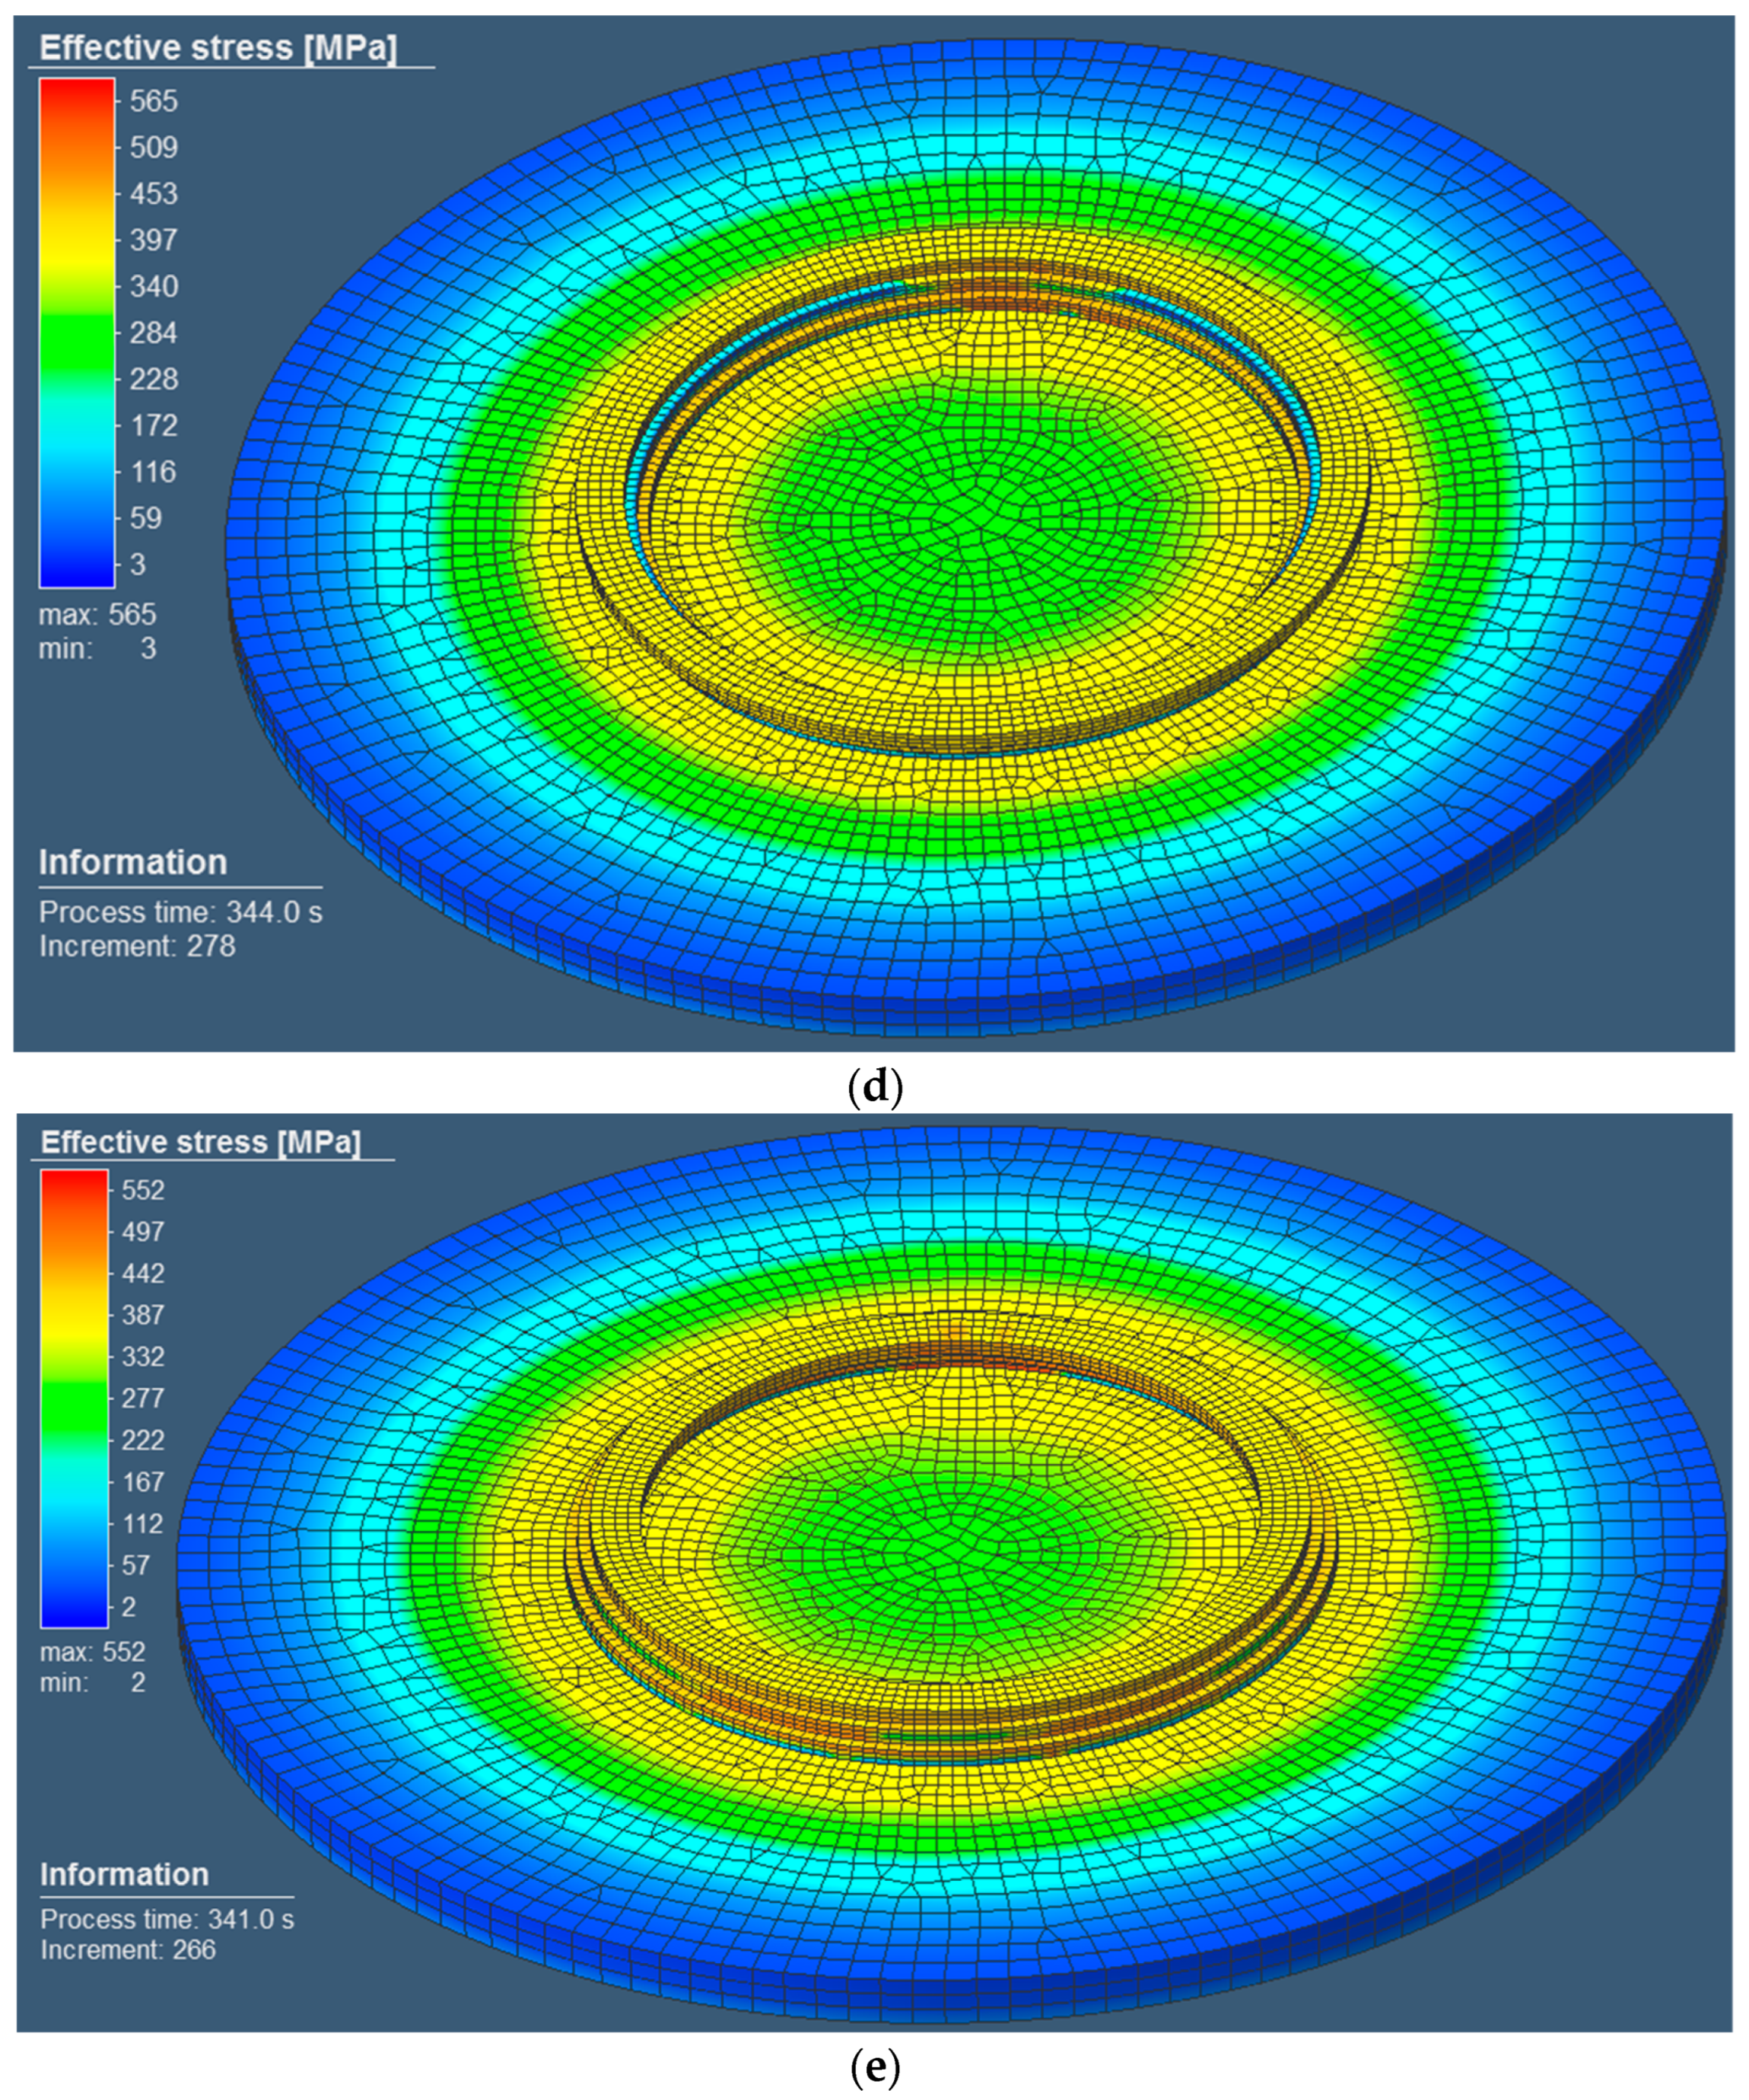
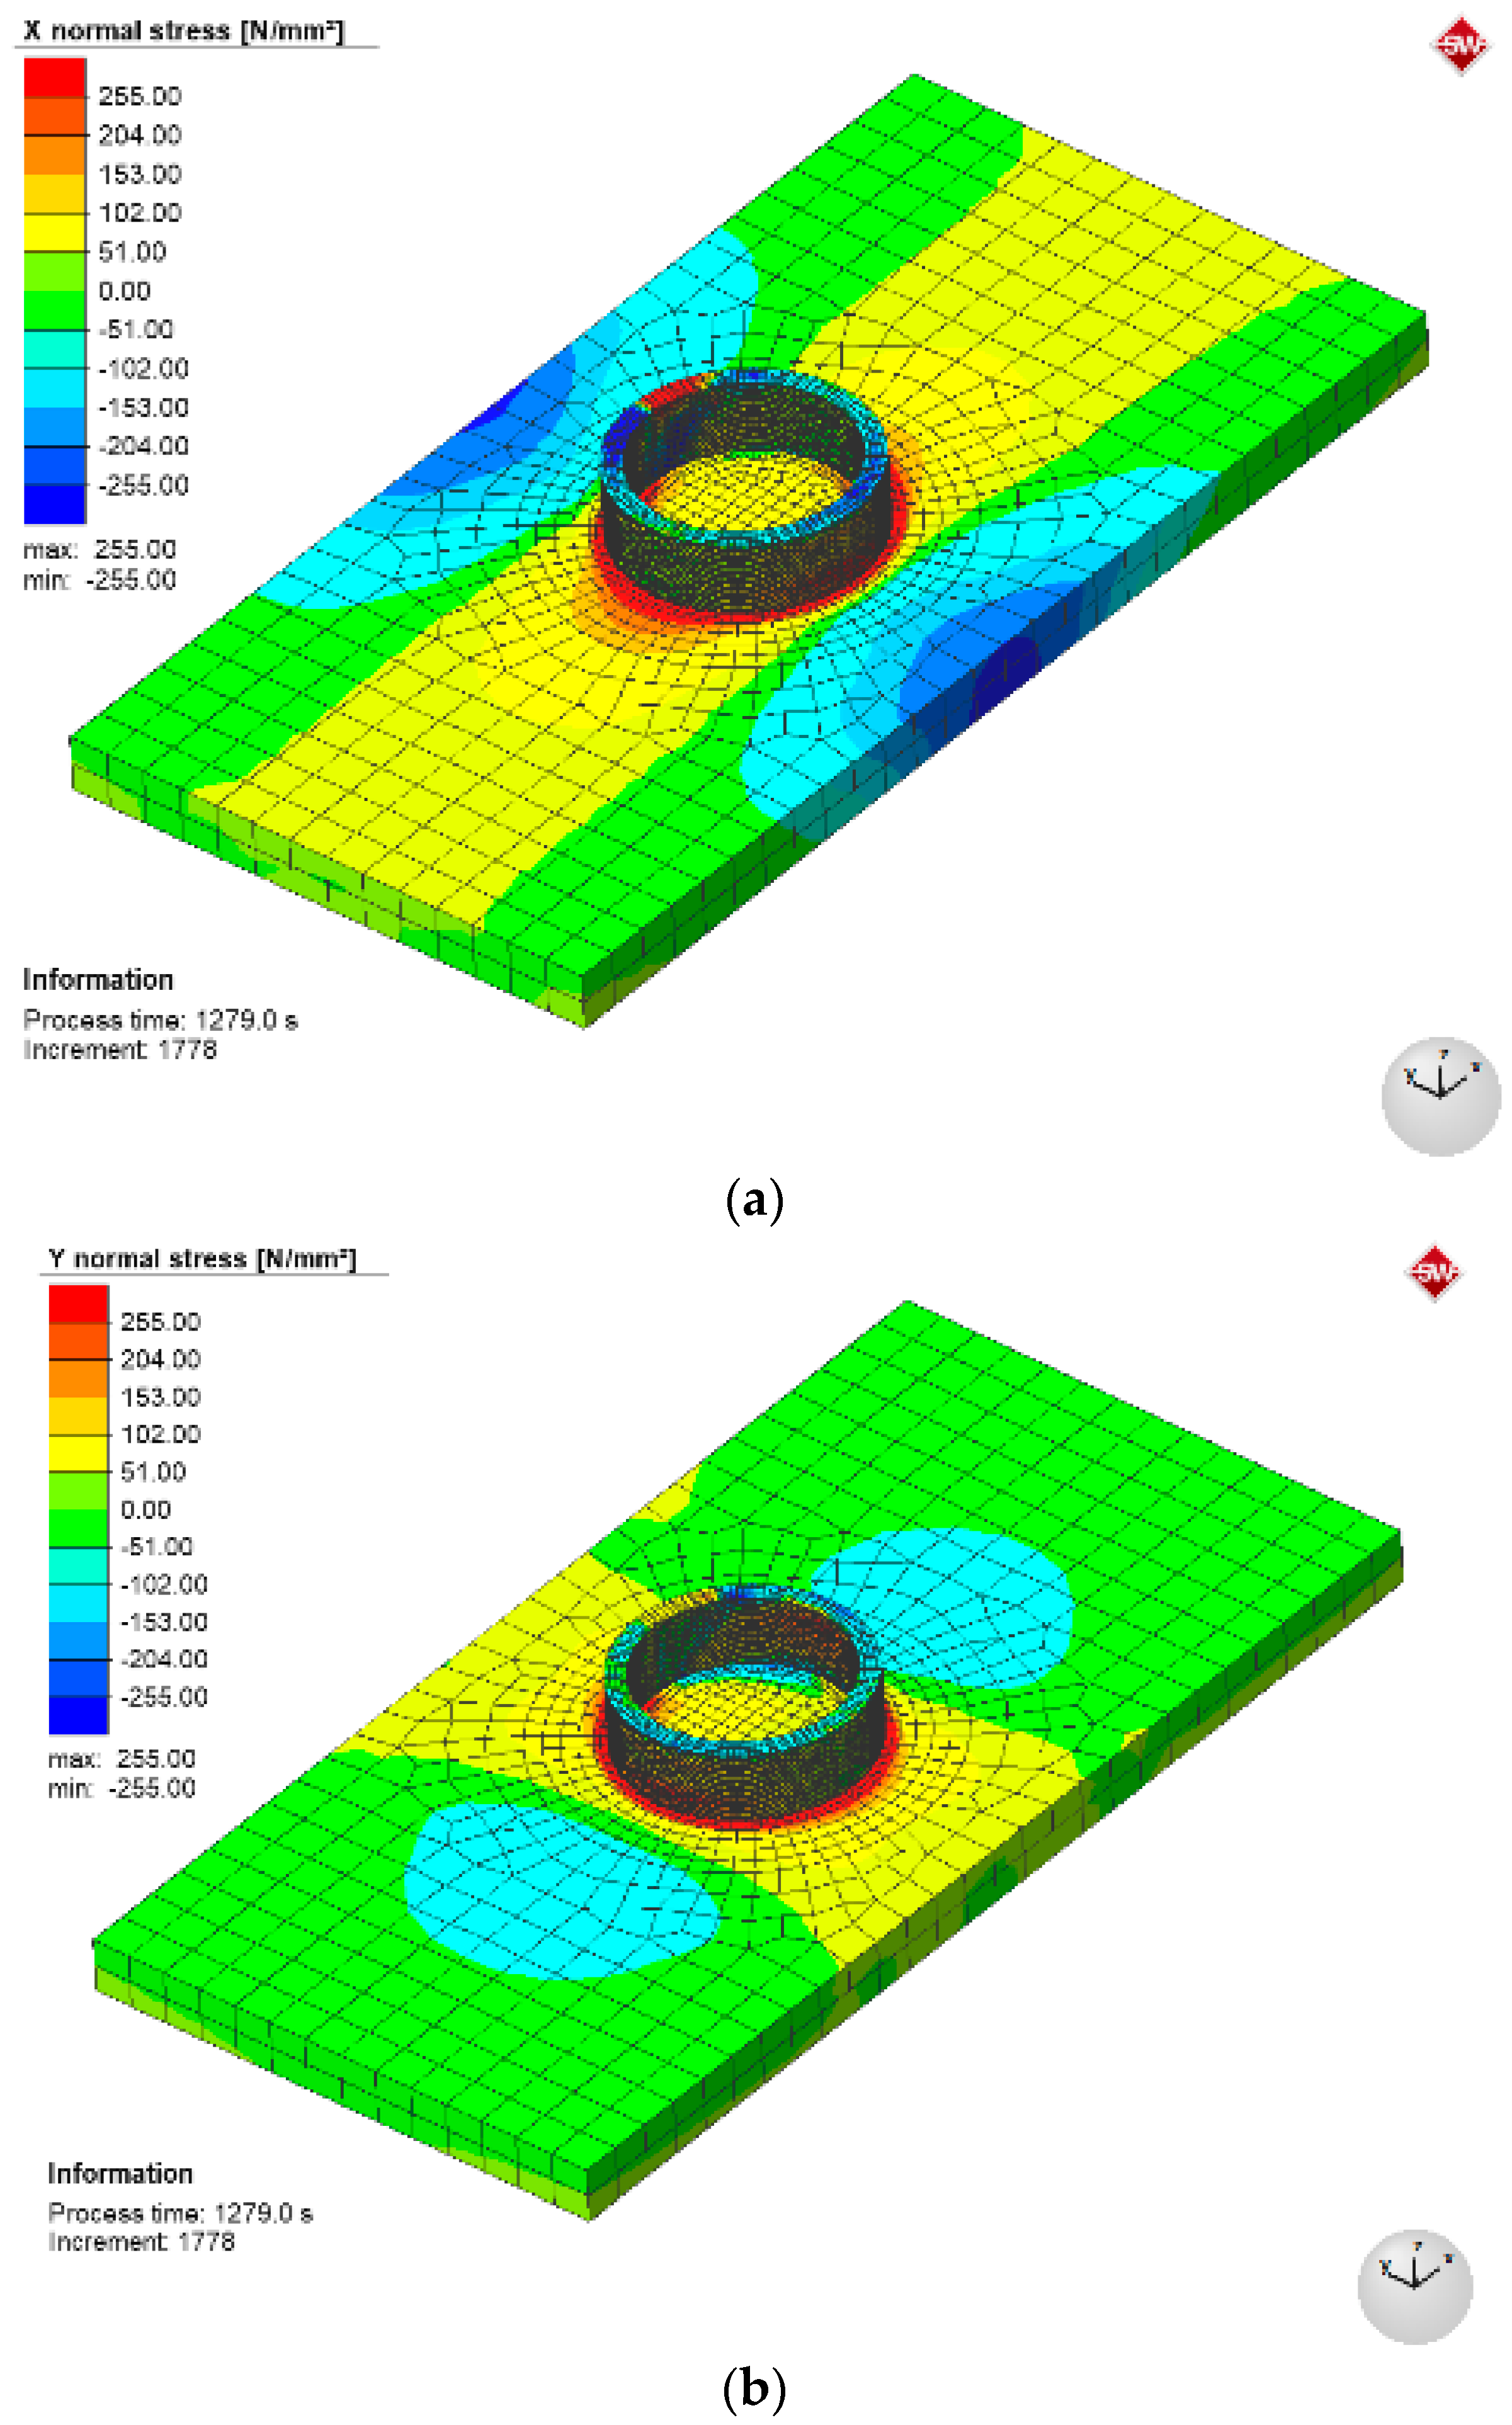
- The finite element method was used to derive a solution to the thermomechanical problem of additive deposition with HYF–103 powder of the Fe–Cr–Ni–B–Si system for five selected hollow spatial prototypes («cylinder», «triangular prism», «square prism», «reverse cone», and «straight cone»). It was found that in all the cases in the first bead of the modeled samples, there was a high level of residual equivalent stresses (~500 MPa) due to the substrate rigidity. In each subsequent deposited bead, the residual equivalent stresses decreased by 7–20%, which corresponds to the level of 390 MPa in the third pass. Equivalent stresses of the greatest magnitude (565 MPa) are predicted in the model sample of the «reverse cone» type, and the smallest ones (552 MPa) in the sample of the «straight cone» type. The maximal values of radial movements corresponded to the range of 0.22–0.28 mm for all the models. Experimental studies of residual deformations of the deposited products showed an up to 20% deviation from the modeled values, which is acceptable;
- To minimize the stress–strain state of the manufactured 3D objects, basic techniques of the process of additive microplasma deposition were developed, including the process starting at a higher current (~35 A) with a rapid transition (~1 s) to a stable mode (~25 A); reduction in the filler powder flow rate (to 6 g/min); lowering of the plasma–forming gas flow rate from 0.4 to 0.2 L/min; stabilization of the process energy input at the level of 85–90 J/mm; and minimization of the arc length (to 5 mm). The application of a system of automatic regulation of arc voltage was proposed for the stabilization of the energy input and the arc length.
Author Contributions
Funding
Data Availability Statement
Conflicts of Interest
References
- Rautio, S.; Valtonen, I. Supporting military maintenance and repair with additive manufacturing. J. Mil. Stud. 2022, 11, 23–36. [Google Scholar] [CrossRef]
- Kim, M.; Kim, S.; Ahn, N. Study of Rifle Maintenance and Parts Supply via 3D Printing Technology during Wartime. Procedia Manuf. 2019, 39, 1510–1516. [Google Scholar] [CrossRef]
- Kvasnytskyi, V.; Korzhyk, V.; Lahodzinkyi, I.; Illiashenko, Y.; Peleshenko, S.; Voitenko, O. Creation of Volumetric Products Using Additive Arc Cladding with Compact and Powder Filler Materials. In Proceedings of the 2020 IEEE 10th International Conference Nanomaterials: Applications & Properties (NAP), Sumy, Ukraine, 9–13 November 2020; pp. 02SAMA16-1–02SAMA16-5. [Google Scholar] [CrossRef]
- Martina, F.; Colegrove, P.A.; Williams, S.W.; Meyer, J. Microstructure of interpass rolled wire + arc additive manufacturing Ti–6Al–4V components. Metall. Mater. Trans. A-Phys. Metall. Mater. Sci. 2015, 46, 6103–6118. [Google Scholar] [CrossRef]
- Colegrove, P.A.; Martina, F.; Roy, M.J.; Szost, B.A.; Terzi, S.; Williams, S.W.; Withers, P.J.; Jarvis, D. High pressure interpass rolling of Wire + Arc additively manufactured titanium components. Jarvis Adv. Mater. Res. 2014, 996, 694–700. [Google Scholar] [CrossRef]
- Colegrove, P.; Williams, S. High Deposition Rate High Quality Metal Additive Manufacture Using Wire + Arc Technology. Cranfield University. 2013. Available online: https://www.xyzist.com/wp-content/uploads/2013/12/Paul-Colegrove-Cranfield-Additive-manufacturing.pdf (accessed on 1 December 2013).
- Donoghue, J.; Antonymy, A.A.; Martina, F.; Colegrove, P.A.; Williams, S.W.; Prangnell, P.B. The effectiveness of combining rolling deformation with wire–arc additive manufacture on β–Grain refinement and texture modification in Ti–6Al–4V. Mater. Charact. 2016, 114, 103–114. [Google Scholar] [CrossRef]
- Gu, J.; Ding, J.; Williams, S.; Gu, H.; Bai, J.; Zhai, Y.; Ma, P. The strengthening effect of inter–layer cold working and post–deposition heat treatment on the additively manufactured Al–6.3Cu alloy. Mater. Sci. Eng. Struct. Mater. Prop. Microstruct. Process. 2016, 651, 18–26. [Google Scholar] [CrossRef]
- Alhuzaim, A.F. Investigation in the Use of Plasma Arc Welding and Alternative Feedstock Delivery Method in Additive Manufacture. Master’s Thesis, Montana Tech of the University of Montana, Butte, MT, USA, 2014; 228p. [Google Scholar]
- Jhavara, S.; Jain, N.K.; Paul, C.P. Development of micro–plasma transferred arc (–PTA) wire deposition process for additive layer manufacturing applications. J. Mater. Process. Technol. 2014, 214, 1102–1110. [Google Scholar] [CrossRef]
- Jhavar, S.; Jain, N. Development of Micro–Plasma Wire Deposition Process for Layered Manufacturing. In DAAAM International Scientific Book; DAAAM International: Vienna, Austria, 2014; Chapter 20; pp. 239–256. [Google Scholar] [CrossRef]
- Wang, H.; Jiang, W.; Valant, M.; Kovacevic, R. Microplasma powder deposition as a new solid freeform fabrication process. Proceedings of the Institution of Mechanical Engineers, Part B. J. Eng. Manuf. 2003, 217, 1641–1650. [Google Scholar] [CrossRef]
- Wang, H.; Jiang, W.; Valant, M.; Kovacevic, R. Solid Freeform Fabrication Based on Micro–Plasma Powder Deposition. In Proceedings of the 2003 International Solid Freeform Fabrication Symposium, Austin, TX, USA, 4–6 August 2003; pp. 301–312. [Google Scholar] [CrossRef]
- Adams, R. Ion Fusion Formation. US Patent 6,680,456 B2, 20 January 2004. [Google Scholar]
- Kovacevic, R. Development of MultiFab Machine For Rapid Manufacturing/Repair. In Proceedings of the 2003 CTMA Symposium, Salt Lake City, UT, USA, 31 March–3 April 2003. [Google Scholar]
- Kumar, P.; Sawant, M.S.; Jain, N.K. Optimization of process parameters in micro–plasma transferred arc deposition process for cobalt–based alloy. Mater. Today Proc. 2021, 44, 1681–1686. [Google Scholar] [CrossRef]
- Semikolenov, A.; Kuznetsov, P.; Bobkova, T.; Shalnova, S.; Klimova–Korsmik, O.; Klinkov, V.; Kobykhno, I.; Larionova, T.; Tolochko, O. Microstructure Evolution of FeNiCoCrAl1.3Mo0.5 High Entropy Alloy during Powder Preparation, Laser Powder Bed Fusion, and Microplasma Spraying. Materials 2021, 14, 7870. [Google Scholar] [CrossRef]
- Laue, R.; Colditz, P.; Möckel, M.; Awiszus, B. Study on the Milling of Additive Manufactured Components. Metals 2022, 12, 1167. [Google Scholar] [CrossRef]
- Korzhyk, V.; Khaskin, V.; Voitenko, O.; Sydorets, V.; Dolianovskaia, O. Welding Technology in Additive Manufacturing Processes of 3D Objects. Mater. Sci. Forum 2017, 906, 121–130. [Google Scholar] [CrossRef]
- Pashechko, M.; Dziedzic, K.; Mendyk, E.; Jozwik, J. Chemical and Phase Composition of the Friction Surfaces Fe–Mn–C–B–Si–Ni–Cr Hardfacing Coatings. J. Tribol. 2018, 140, 021302. [Google Scholar] [CrossRef]
- Pashechko, M.; Dziedzic, K.; Barszcz, M. Study of coatings obtained from alloy Fe–Mn–C–B–Si–Ni–Cr. Adv. Sci. Technol.-Res. J. 2016, 10, 194–198. [Google Scholar] [CrossRef] [PubMed]
- Markashova, L.; Tyurin, Y.; Berdnikova, O.; Kolisnichenko, O.; Polovetskyi, I.; Titkov, Y. Effect of nano–structured factors on the properties of the coatings produced by detonation spraying method. In Advances in Thin Films, Nanostructured Materials, and Coatings; Pogrebnjak, A.D., Novosad, V., Eds.; Springer: Singapore, 2019; pp. 109–118. [Google Scholar] [CrossRef]
- Berdnikova, O.; Kushnarova, O.; Bernatskyi, A.; Alekseienko, T. Structure Peculiarities of the Surface Layers of Structural Steel under Laser Alloying. In Proceedings of the 2020 IEEE 10th International Conference Nanomaterials: Applications & Properties (NAP), Sumy, Ukraine, 9–13 November 2020; pp. 02IT01-1–02IT01-4. [Google Scholar] [CrossRef]
- Buytoz, S.; Orhan, A.; Gür, A.K.; Caligulu, U. Microstructural Development of Fe–Cr–C and B4C Powder Alloy Coating on Stainless Steel by Plasma–Transferred Arc Weld Surfacing. Arab. J. Sci. Eng. 2013, 38, 2197–2204. [Google Scholar] [CrossRef]
- Grabin, V.F. Metal Science of Fusion Welding; Naukova Dumka: Kiev, Ukraine, 1982; 415p. [Google Scholar]
- Korzhyk, V.M.; Strohonov, D.V.; Burlachenko, O.M.; Voitenko, O.M.; Kunitskyi, D.V. Development of plasma–arc technologies of spherical granule production for additive manufacturing and granule metallurgy. Paton Weld. J. 2023, 12, 3–18. [Google Scholar] [CrossRef]
- Khoshnaw, F.; Krivtsun, I.; Korzhyk, V. Arc welding methods. In Welding of Metallic Materials: Methods, Metallurgy and Performance; Elsevier: Amsterdam, The Netherlands, 2023; Volume 2, pp. 37–71. [Google Scholar] [CrossRef]
- DSTU ISO 6892–1:2019 Metallic Materials. Tensile Test. Part 1: Test Method at Room Temperature (ISO 6892-1:2016, IDT). Available online: https://online.budstandart.com/ua/catalog/doc-page.html?id_doc=82697 (accessed on 1 December 2013).
- Dhatt, G.; Touzot, G.; Lefrançois, E. Finite Element Method; ISTE Ltd.: Arlington, VA, USA, 2012; 600p. [Google Scholar] [CrossRef]
- Zienkiewicz, O.C.; Taylor, R.L.; Fox, D. The Finite Element Method: Its Basis and Fundamentals, 7th ed.; Elsevier: Amsterdam, The Netherlands, 2014; 624p. [Google Scholar] [CrossRef]
- Goldak, J.A.; Akhlaghi, M. Computational Welding Mechanics; Springer: New York, NY, USA, 2005; 325p. [Google Scholar] [CrossRef]
- Anca, A.; Cardona, A.; Risso, J.; Fachinotti, V.D. Finite element modeling of welding processes. Appl. Math. Model. 2011, 35, 688–707. [Google Scholar] [CrossRef]
- Kah, P.; Suoranta, R.; Pirinen, M. Usability of arc types in industrial welding. Int. J. Mech. Mater. Eng. 2014, 9, 15. [Google Scholar] [CrossRef]
- Yarovitsyn, A.V.; Yushchenko, K.A.; Nakonechny, A.A.; Petrik, L.A. Peculiarities of low–amperage argon–arc and microplasma powder cladding on narrow substrate. Paton Weld. J. 2009, 6, 31–35. [Google Scholar]
- Zhemanyuk, P.D.; Petrik, I.A.; Chigilejchik, S.L. Experience of introduction of the technology of reconditioning microplasma powder surfacing at repair of high–pressure turbine blades in batch production. Paton Weld. J. 2015, 8, 39–42. [Google Scholar] [CrossRef]
- Fauchais, P.L.; Heberlein, J.V.R.; Boulos, M.I. Overview of Thermal Spray. In Thermal Spray Fundamentals; Springer: Boston, MA, USA, 2014; pp. 17–72. [Google Scholar] [CrossRef]
- Gladky, P.V.; Pereplyotchikov, E.F.; Ryabtsev, I.A. Plasma Surfacing; Ecotechnology: Kiev, Ukraine, 2007; 292p. [Google Scholar]
- Korzhyk, V.M.; Khaskin, V.Y.; Peleshenko, S.I.; Grynyuk, A.A.; Dong, C.; Illyashenko, E.V.; Yao, Y. Selection of parameters of laser welding of thin–walled items from light alloys with nonthrough thickness penetration. Paton Weld. J. 2022, 5, 16–25. [Google Scholar] [CrossRef]
- Peleshenko, S.; Korzhyk, V.; Voitenko, O.; Khaskin, V.; Tkachuk, V. Analysis of the current state of additive welding technologies for manufacturing volume metallic products (review). East. Eur. J. Enterp. Technol. 2017, 3, 42–52. [Google Scholar] [CrossRef]


| Material | Element Content, wt. % | ||||||||||
|---|---|---|---|---|---|---|---|---|---|---|---|
| Fe | B | C | Si | Mn | Ni | Cr | Cu | P | S | Other | |
| Substrate metal | |||||||||||
| AISI 304 steel | Base | – | <0.8 | <0.8 | <0.2 | 9–11 | 17–19 | <0.3 | <0.035 | <0.02 | Ti < 0.5 |
| Filler (deposition) materials | |||||||||||
| HYF–103 powder (40–60 µm size) | Base | 1.15 | – | 0.75 | 0.6 | 7.85 | 15.55 | – | <0.02 | <0.01 | – |
| Spectrum | Element Content, wt. % | ||||||
|---|---|---|---|---|---|---|---|
| B | O | Si | Cr | Mn | Fe | Ni | |
| 1 | 5.57 | 2.79 | 1.51 | 17.33 | 0.28 | 65.21 | 7 |
| 2 | 6.19 | 2.68 | 1.41 | 17.34 | 0.37 | 64.8 | 7.08 |
| 3 | 6 | 2.98 | 1.47 | 17.48 | 0.23 | 65.06 | 6.61 |
| 4 | 6.69 | 2.65 | 1.42 | 17.81 | 0.45 | 64.88 | 6.11 |
| 5 | 3.6 | 1.83 | 1.46 | 17 | 0.38 | 67.2 | 8.53 |
| 6 | 4.43 | 2.94 | 1.17 | 15.6 | 0.2 | 66.79 | 8.86 |
| 7 | 2.65 | 3.97 | 2.04 | 15.68 | 0.3 | 67.07 | 8.29 |
| 8 | 5.97 | – | 1.16 | 17.05 | 0.15 | 66.75 | 8.92 |
| 9 | 3.33 | 1.43 | 1.25 | 17.41 | 0.24 | 71.81 | 4.29 |
| 10 | 2 | 1.98 | 1.55 | 17.09 | 0.33 | 68.07 | 8.85 |
| Composition and Flow Rate of Plasma–Forming/Shielding Gas, L/min | Current, A | Voltage, V | Speed of Torch Movement Relative to Deposition Surface, m/min | Filler Powder | Powder Flow Rate, g/min | Minimal Thickness of the Deposited Wall, mm |
|---|---|---|---|---|---|---|
| Ar/Ar. 0.8–1.5/5–12 | 25 | 30 | 0.5–0.6 | HYF–103 | 2.0–7.0 | 3.0–3.5 |
| Sample №1 | Sample №2 | Sample №3 | Averaged Value | |
|---|---|---|---|---|
| Tensile strength, MPa | 606 | 627 | 618 | 617 |
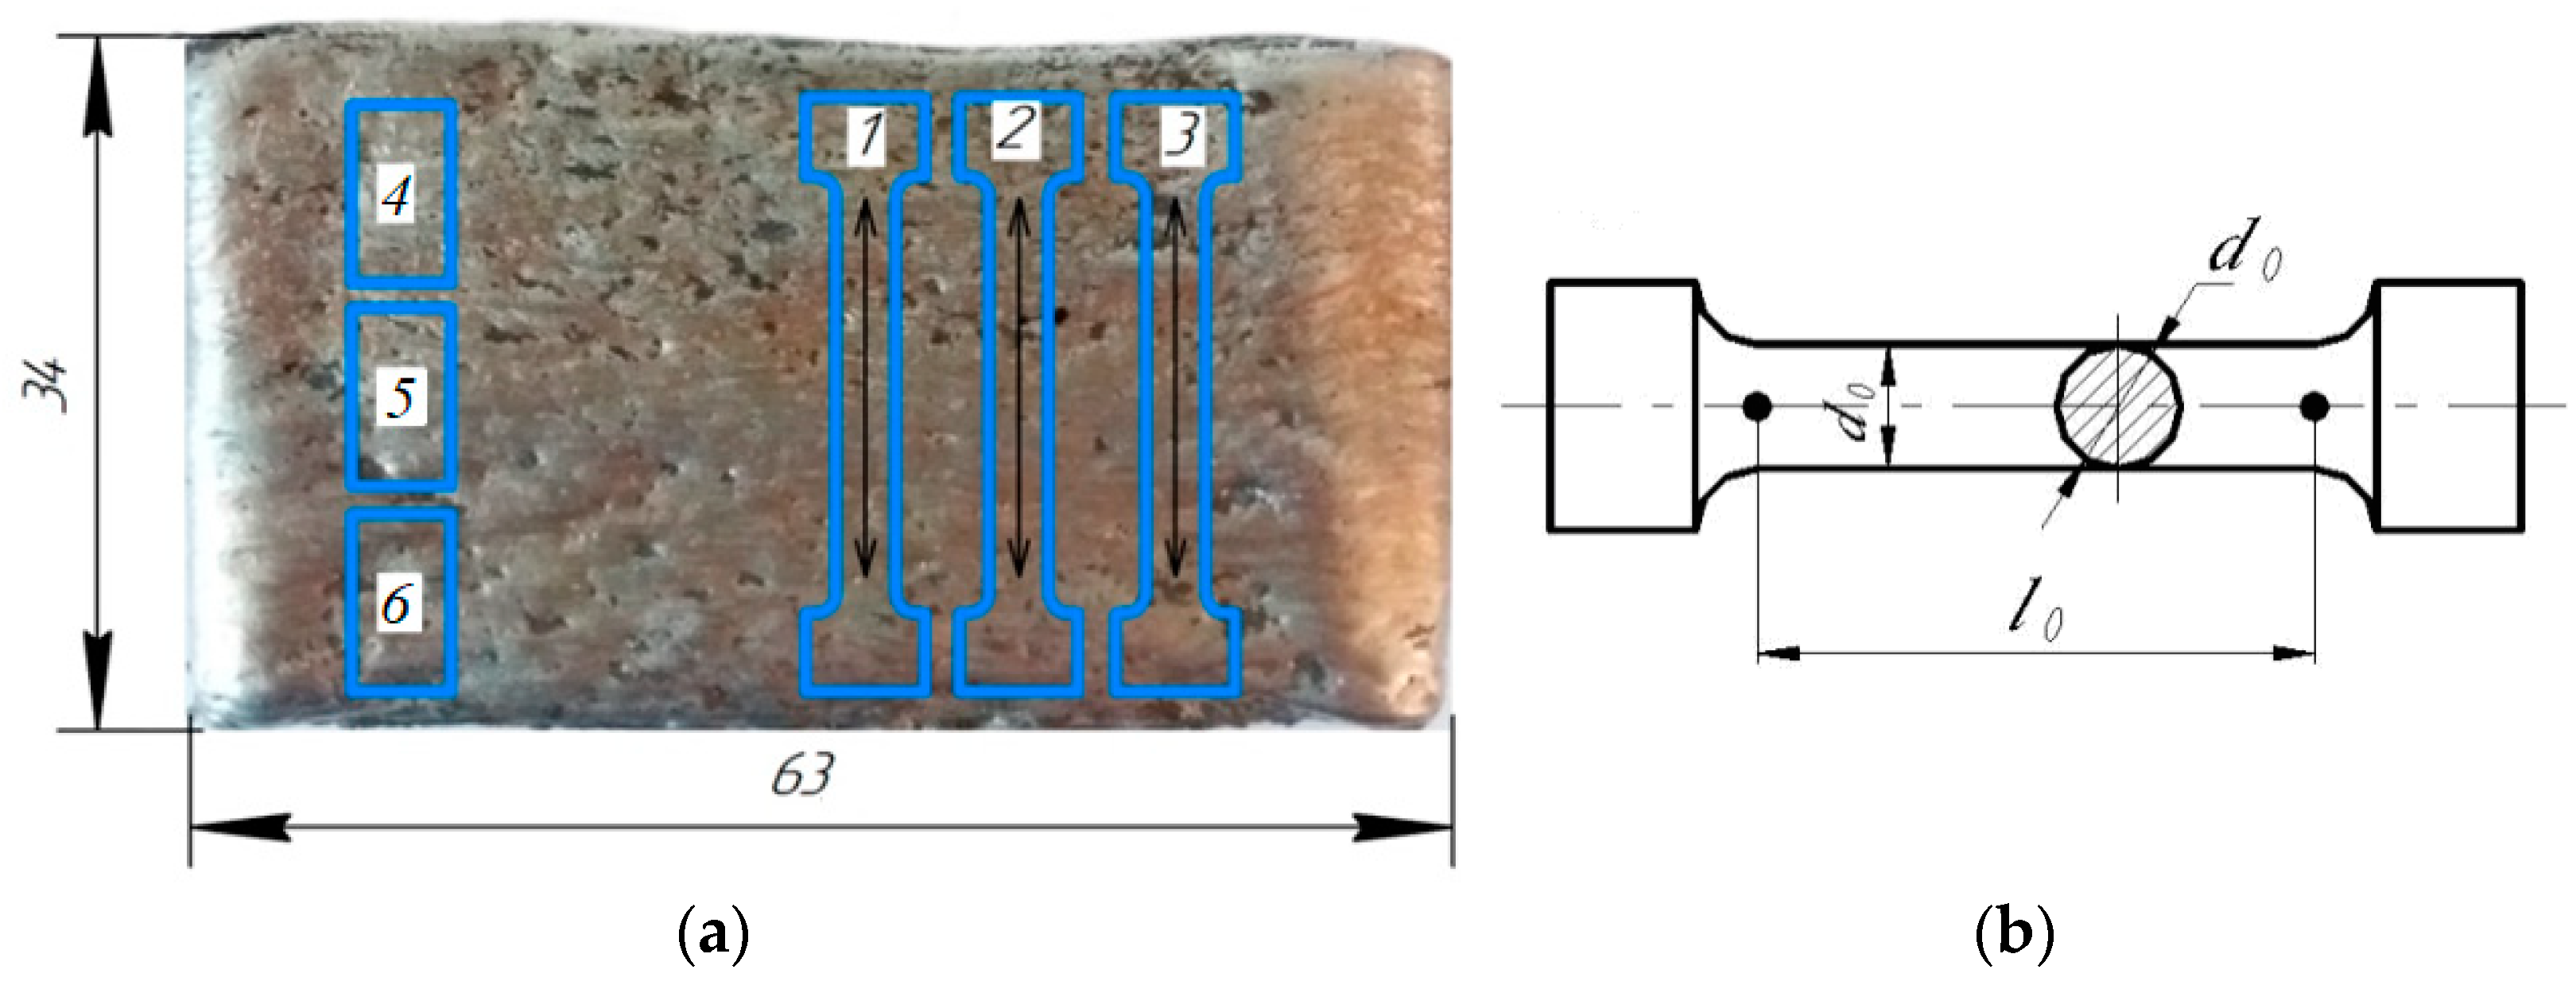
| Sample Number | Fo, mm2 | Lo, mm | Le, mm | σT, MPa | ΣY, MPa | δ, % |
|---|---|---|---|---|---|---|
| 1 | 7.15 | 20.02 | 20.49 | 606 | 474 | 3.164856 |
| 2 | 7.16 | 19.78 | 20.78 | 627 | 510 | 5.055612 |
| 3 | 7.15 | 22.14 | 22.94 | 618 | 462 | 3.613369 |
| Name | Ring (Cylinder) | Triangle | Square | Reverse Cone | Straight Cone |
|---|---|---|---|---|---|
| Model sample | 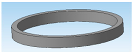 |  | 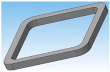 |  |  |
| Characteristic size | Ø | Side length | Side length | Øbot/Øtop | Øbot/Øtop |
| Value, mm | 40 | 50 | 50 | 60/64 | 60/56 |
| Model | 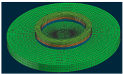 |  |  |  | 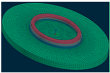 |
| Deposited sample |  |  |  |  | 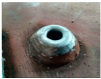 |
| Model Sample |  |  | 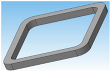 | 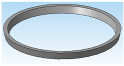 |  | |||||
|---|---|---|---|---|---|---|---|---|---|---|
| Residual equivalent stresses, MPa | ||||||||||
| Bead № | Max | Min | Max | Min | Max | Min | Max | Min | Max | Min |
| 1 | 520 | 400 | 500 | 170 | 510 | 50 | 500 | 400 | 500 | 400 |
| 2 | 490 | 190 | 480 | 50 | 500 | 50 | 400 | 280 | 500 | 280 |
| 3 | 400 | 390 | 390 | 40 | 400 | 30 | 400 | 390 | 400 | 390 |
| Model | 562 | 26 | 558 | 9 | 558 | 1 | 565 | 3 | 552 | 2 |
| Residual equivalent plastic deformations, ×10−2, % | ||||||||||
| Model | 17.4 | 0 | 15.6 | 0 | 16.4 | 0 | 17.4 | 0 | 14.6 | 0 |
| Movements, mm | ||||||||||
| Total | 0.23 | 0.25 | 0.28 | 0.25 | 0.22 | |||||
| Mode № | Technological Mode Parameters | Energy Input E. J/m | Result/Residual Movements after 5 Passes, mm | |||||||
|---|---|---|---|---|---|---|---|---|---|---|
| IPA. A | QPA. L/min | IMA. A | QPA. L/min | QSH. L/min | U. V | QF. g/min | QTG. g/min | |||
| 1. | 25 | 2.5 | 30 | 0.3 | 25 | 27 | 6.5 | 3 | 71 | After the 10th pass, there was a considerable difference in the height of bead formation/0.20–0.23 |
| 2. | 25 | 2.5 | 30 | 0.3 | 25 | 33 | 9 | 3 | 86 | After the 20th pass, there was a considerable difference in the height of bead formation/0.25–0.28 |
| 3. | 25 | 2.5 | 30 | 0.3 | 25 | 33 | 9 | 3 | 86 | After the 20th pass, there was a considerable difference in the height of bead formation/0.25–0.28 |
| 4. | 20 | 4 | 25 | 0.2 | 25 | 42 | 6 | 4 | 92 | Good bead formation/0.24–0.27 |
| 5. | 30 ignition, 20 working h. | 4 | 35 ignition, 25 working h. | 0.2 | 25 | 40 | 6 | 4 | 87 | Good bead formation/0.20–0.23 |
| DT. mm | I. A | B. mm | MD. g/min | PUC |
|---|---|---|---|---|
| 4.5 | 25 | 2.5 | 4.7 | 0.72 |
| 30 | 4.0 | 4.5 | 0.69 | |
| 35 | 5.0 | 4.6 | 0.70 | |
| 3.5 | 25 | 2.5 | 5.3 | 0.82 |
| 30 | 3.5 | 5.2 | 0.80 | |
| 35 | 4.5 | 5.4 | 0.83 | |
| 2.5 | 25 | 2.5 | 5.6 | 0.86 |
| 30 | 3.0 | 5.7 | 0.88 | |
| 35 | 3.5 | 5.8 | 0.89 |
| DT. mm | Def. mm | Sef. mm2 | r0. mm | B. mm | PUF |
|---|---|---|---|---|---|
| 4.5 | 7.0 | 38.5 | 2.5 | 5.0 | 0.72 |
| 3.5 | 5.5 | 23.8 | 2.25 | 4.5 | 0.82 |
| 2.5 | 4.0 | 12.6 | 1.75 | 3.5 | 0.88 |
Disclaimer/Publisher’s Note: The statements, opinions and data contained in all publications are solely those of the individual author(s) and contributor(s) and not of MDPI and/or the editor(s). MDPI and/or the editor(s) disclaim responsibility for any injury to people or property resulting from any ideas, methods, instructions or products referred to in the content. |
© 2024 by the authors. Licensee MDPI, Basel, Switzerland. This article is an open access article distributed under the terms and conditions of the Creative Commons Attribution (CC BY) license (https://creativecommons.org/licenses/by/4.0/).
Share and Cite
Korzhyk, V.; Gao, S.; Khaskin, V.; Voitenko, O.; Konoreva, O.; Kvasnytskyi, V.; Perepichay, A. Features of the Stress–Strain State of 3D Metal Objects Produced by Additive Microplasma Deposition of the Powder of a Fe–Cr–Ni–B–Si System. Appl. Sci. 2024, 14, 4159. https://doi.org/10.3390/app14104159
Korzhyk V, Gao S, Khaskin V, Voitenko O, Konoreva O, Kvasnytskyi V, Perepichay A. Features of the Stress–Strain State of 3D Metal Objects Produced by Additive Microplasma Deposition of the Powder of a Fe–Cr–Ni–B–Si System. Applied Sciences. 2024; 14(10):4159. https://doi.org/10.3390/app14104159
Chicago/Turabian StyleKorzhyk, Volodymyr, Shiyi Gao, Vladyslav Khaskin, Oleksandr Voitenko, Oksana Konoreva, Viktor Kvasnytskyi, and Andrii Perepichay. 2024. "Features of the Stress–Strain State of 3D Metal Objects Produced by Additive Microplasma Deposition of the Powder of a Fe–Cr–Ni–B–Si System" Applied Sciences 14, no. 10: 4159. https://doi.org/10.3390/app14104159