Article

Prediction of Kiwifruit Sweetness with Vis/NIR Spectroscopy Based on Scatter Correction and Feature Selection Techniques

College of Natural Resources and Environment, Northwest A&F University, Xianyang 712100, China
*
Author to whom correspondence should be addressed.
Appl. Sci. 2024, 14(10), 4145; https://doi.org/10.3390/app14104145
Submission received: 1 April 2024 / Revised: 7 May 2024 / Accepted: 9 May 2024 / Published: 14 May 2024

Abstract

:
The sweetness is an important parameter for the quality of Cuixiang kiwifruit. The quick and accurate assessment of sweetness is necessary for farmers to make timely orchard management and for consumers to make purchasing choices. The objective of the study was to propose an effective physical method for determining the sweetness of fresh kiwifruit based on fruit hyperspectral reflectance in 400–2500 nm. In this study, the visible and near-infrared spectral (Vis/NIR) reflectance and sweetness values of kiwifruit were measured at different time periods after the fruit matured in 2021 and 2022. The multiplicative scatter correction (MSC) and standard normal variable (SNV) transformation were used for spectral denoising. The successive projections algorithm (SPA) and competitive adaptive reweighted sampling (CARS) methods were employed to select the most effective features for sweetness, and then the features were used as the inputs of partial least squares (PLS), least squares support vector machine (LSSVM), back propagation neural network (BP), and multiple linear regression (MLR) models to explore the best way of sweetness predicting. The study indicated that the most sensitive features were in the blue and red regions and the 970, 1200, and 1400 nm. The sweetness estimation model constructed by using the data of the whole harvest period from August to October performed better than the models constructed by each harvest period. Overall results indicated that hyperspectral reflectance incorporated with MSC-SPA-LSSVM could explain up to 79% of the variability in kiwifruit sweetness, which could be applied as an alternative fast and accurate method for the non-destructive determination of the sweetness of kiwifruit. This research could partially provide a theoretical basis for the development of nondestructive instrumentation for the detection of kiwifruit sweetness.

1. Introduction

Kiwifruit (Actinidia deliciosa) has garnered widespread consumer appeal due to its distinct flavor and exceptional nutritional value [1]. Zhouzhi County, located in Xi’an City, Shaanxi Province, China, has earned global recognition as the premier habitat for kiwifruit cultivation and serves as the largest kiwifruit production hub [2]. Among the distinctive varieties cultivated in Zhouzhi County, Cuixiang kiwifruit stands as a prominent representative, which boasts a higher nutritional value of vitamin C compared to other kiwifruits. Sweetness content plays a pivotal role as a quality indicator for this variety, directly influencing the flavor and consumer preference [3,4]. Traditional methods for assessing fruit sweetness content by crushing and juicing kiwifruit and measuring the juice by dripping it onto a sweetness tester is often time-consuming and destructive, failing to provide timely insights into the sweetness during the harvest season both for farmers and consumers. Consequently, there is a pressing need to explore rapid and non-destructive approaches for detecting kiwifruit sweetness levels.
Visible and near-infrared spectroscopy (Vis/NIR) records detailed information on fruits with wide and continuous electromagnetic radiation in the form of reflectance and absorptions. The distinct and narrow absorption properties are strong information to identify the internal quality of fruits in a non-destructive and effective way [5]. Vis/NIR has progressively been employed for assessing the internal quality of various fruits, including apricot [6], apple [7,8,9], strawberry [10], citrus [11], etc. For kiwifruit, Vis/NIR was widely used to detect the physicochemical characteristics, including soluble solids content (SSC) [12,13,14], dry matter [15], pH [16], and firmness [17]. Additionally, Vis/NIR has been instrumental in tasks such as freshness identification of kiwifruit [18], evaluation of kiwifruit quality at different maturity stages [19], and discrimination of varietal flesh color [20]. In summary, Vis/NIR data has exhibited the potential to identify the internal quality of fruits in a non-destructive and fast way. However, the non-destructive detecting method of kiwifruit sweetness using Vis/NIR data is still lacking, and the accuracy of the sweetness estimation model needs to be improved.
For the kiwifruit, solid samples often feature non-uniform surfaces, resulting in noise and scattering effects during the collection of hyperspectral signals, which can weaken the spectral signal and reduce the performance of quality prediction models [21]. To address the issue of light scattering in spectral data, a series of pre-processing steps, such as multiplicative scatter correction (MSC) and standard normal variable (SNV) were suggested to compensate for additive and/or multiplicative effects in spectral data [22,23,24]. The results consistently demonstrated improved model accuracy when working with pre-processed spectra compared to original spectra, with the most effective combination being the convolutional smoothing method coupled with MSC and SNV [25].
In addition, different feature selection methods were used to reduce the data volume and dimensionality in the hyperspectral reflectance to simplify the estimation models. Methods such as successive projections algorithm (SPA) and competitive adaptive reweighted sampling (CARS) were often deployed in the realm of fruit quality assessment [26]. Liu et al. (2012) applied the SPA algorithm to downscale the spectral data of navel oranges [27]. The result indicated that the accuracy of the models built with the features after the SPA reached 100% for both calibration and prediction datasets. Zhan et al. (2014) found that using CARS algorithm to select the features from hyperspectral data could obtain the best results for predicting the SSC of Korla fragrant pear [28], with R2 and RMSE being 0.85 and 0.29, respectively. It was proven that the use of feature selection methods was very helpful for the establishment of calibration models with higher accuracy and fewer variables than a full spectrum model [29,30]. But it is difficult in finding the appropriate hyperparameter combinations. It remains uncertain which approach is more effective for the sweetness estimation of kiwifruit.
Moreover, modeling methods are also important for quality prediction. For instance, multiple linear regression (MLR) was used to analyze the contents of flavonoids and saponins in soybean powder based on hyperspectral reflectance at 900 ~1700 nm [31]. Zhang et al. (2019) compared the use of partial least squares (PLS) and least squared support vector regression (LSSVR) to predict apple’s SSC [32]. The results showed that both methods had high accuracy, and the accuracy of the LSSVR method was slightly higher than that of the PLS. The MLR and error back propagation (BP) network methods were compared in the determining of the SSC in plums [25]. The result indicated the advantages of the MLR method. The CARS combined with the MLR method could obtain the best SSC estimation model with the R2 greater than 0.9. So far, MLR, PLS, LSSVM, BP, and other methods have been applied to predict the internal qualities of fruits. However, there is no conclusion which one is necessarily the best for internal quality predicting. For different fruit objects and internal quality characteristics, the applicability of these methods requires comparison and screening. In addition, different fruit surface characteristics cause complicated scattering effects on reflection spectrum. Which combination of spectral noise removing methods and modeling methods is best for sweetness estimation need to be discussed.
Overall, there were less researches on predicting kiwifruit sweetness, especially the Cuixiang cultivar famous for its sweetness. Previous studies have focused on the spectra of 400–1000 nm in the selection of sensitive waveband for kiwifruit sweetness. With the development of hyperspectral technology, 1000–2500 nm has attracted wide attention. Therefore, based on the hyperspectral reflectance of kiwifruit spanning the range of 400~2500 nm, the objectives of this study are to (1) explore the optimal sensitive bands of sweetness in each harvest period and the whole harvest period. (2) analyze the responsiveness of spectral processing and feature selection methods to sweetness. (3) develop the best sweetness estimation model for kiwifruit. The research results will provide a technical basis for the potential application of Vis/NIR technology in the sweetness prediction of different fruits.
The rest of this paper is organized as follows: Section 2 introduces the geographic location of the study area, measures the Vis/NIR spectra, and determines kiwifruit sweetness. Section 3 establishes the estimation model of spectrum and sweetness and verifies the accuracy of the model. Section 4 discusses the relationship between this study and other studies. Section 5 presents the conclusions.

2. Materials and Methods

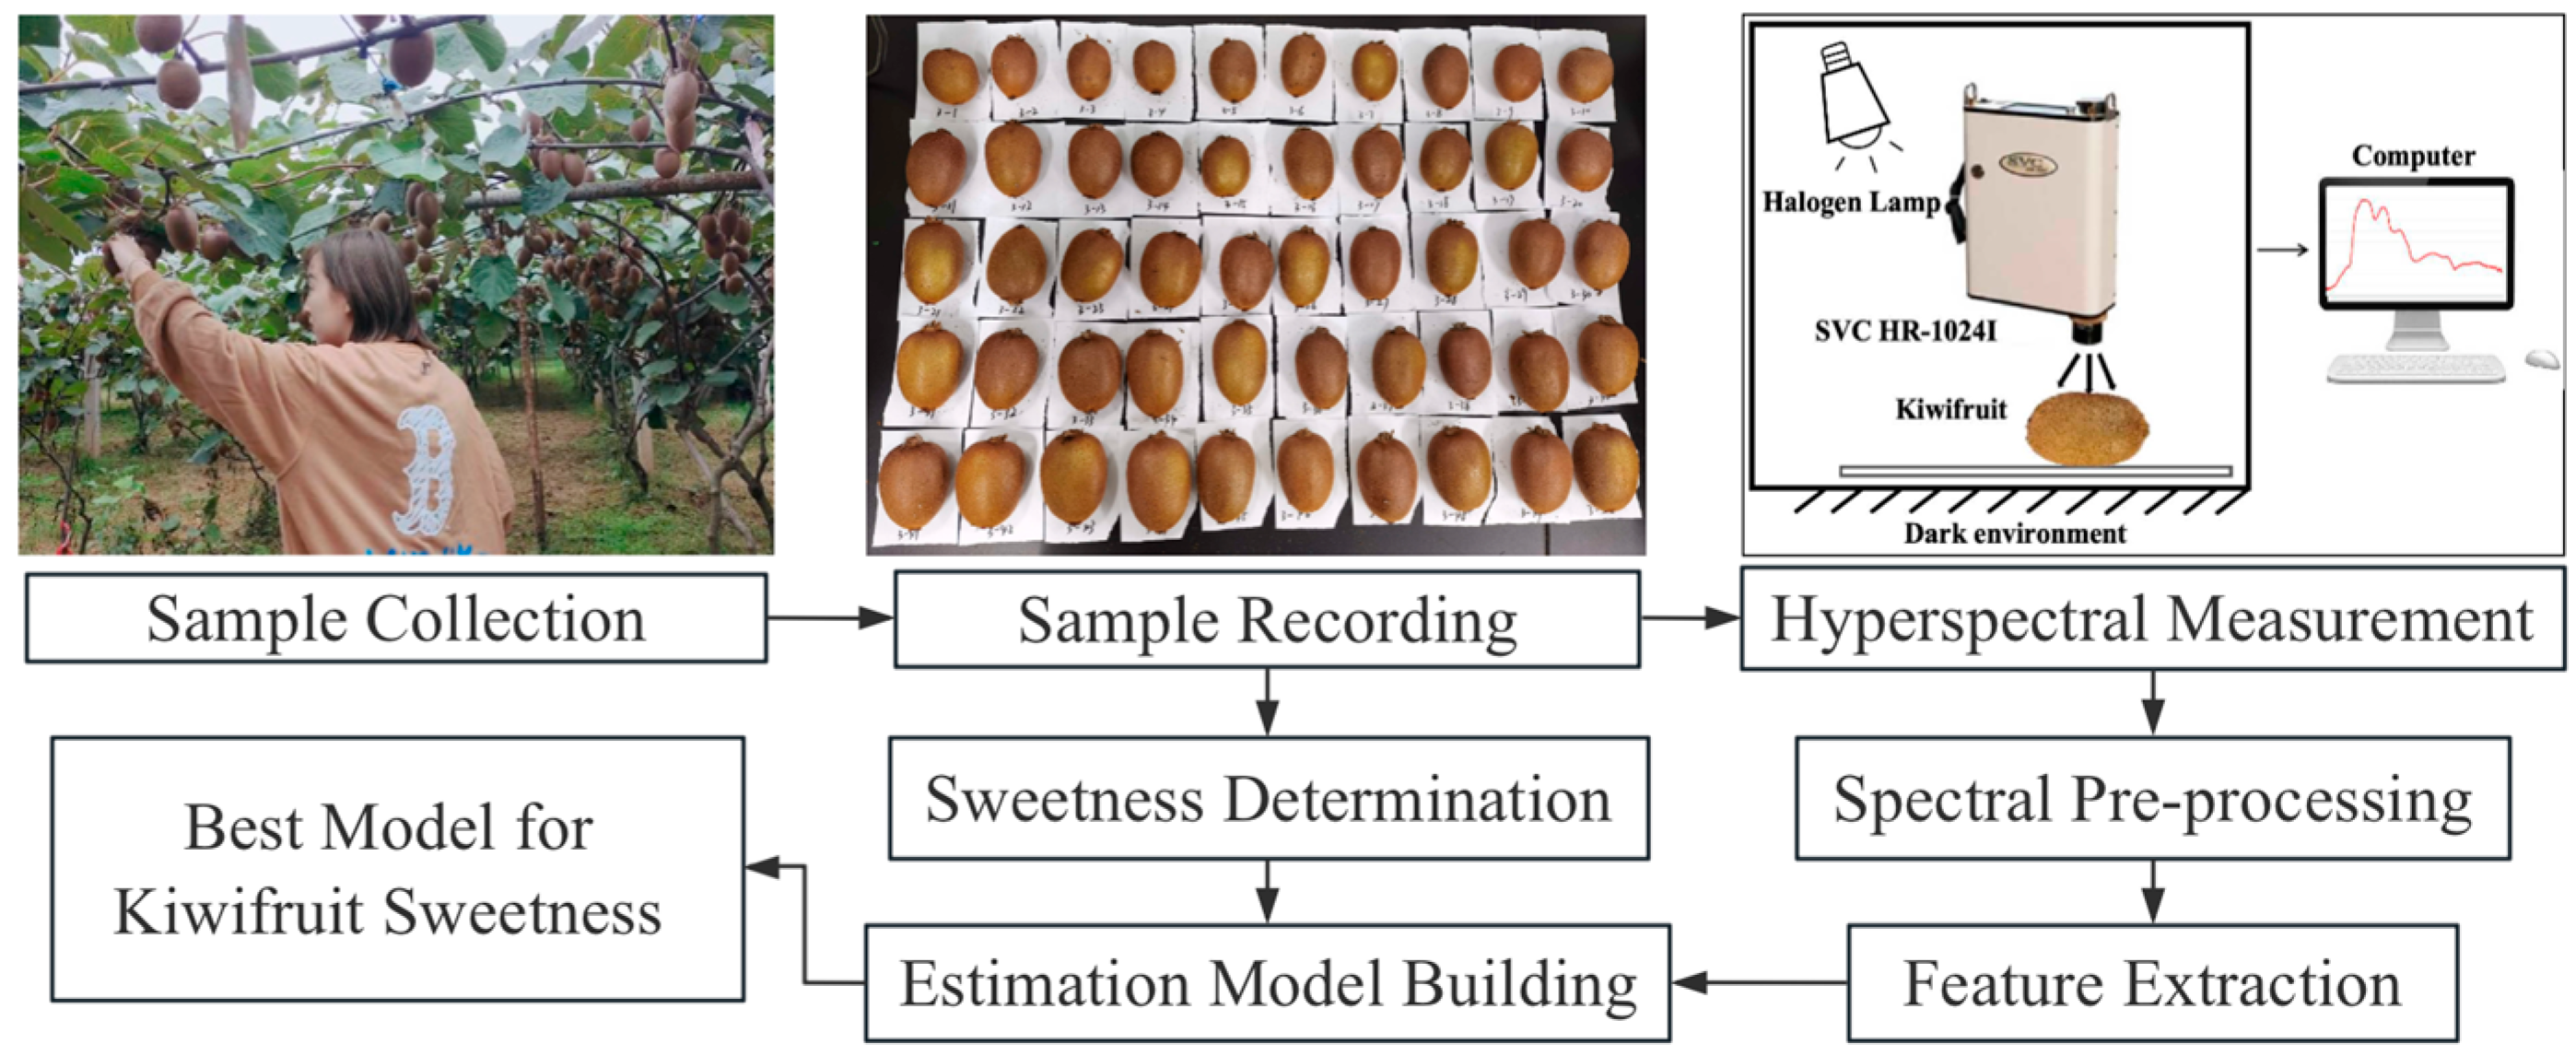
2.1. Kiwifruit Sample Collection

Zhouzhi County is located in Shaanxi province between the Qinling Mountains to the south and the Wei River to the north. It is one of the prime regions for kiwifruit plantation in China due to the mild climate, abundant rainfall, and fertile soil, with the annual total radiation of 109.68 kcal/cm sq, the sunshine time of 2138 h, the average annual temperature of 13.2 °C, and the average annual precipitation of 674.3 mm. In this study, five Cuixiang kiwifruit orchards within this dominant kiwifruit region were selected as sample regions (Figure 1). The area of each orchard was about 0.25 to 0.40 ha, with planting density of 1400 to 1500 trees per ha. The trees were 6–8 years old. At each harvest period, 50 trees were randomly selected in each orchard, and one non-destructive kiwi fruit was randomly picked from each tree.
During the kiwifruit harvesting seasons of 2021 and 2022, a total of 707 fresh kiwifruits were collected and transported to the laboratory with a cooler for further spectroscopic and physicochemical analysis (Table 1). The study categorized the 2-year kiwifruit samples into four groups based on their collection dates. The early harvest stage in late August and early September (T1) includes 26 August, 2021, 4 September, 2021, and 2 September, 2022. The mid-harvest stage at the end of September (T2) includes 29 September, 2021, and 25 September, 2022. The end stage of kiwifruit harvest (T3) includes 25 October, 2022. T1, T2, and T3 was marked as the individual harvest period, respectively. The whole harvest period (T4) includes all the individual harvest data from both years for analysis. Each group was divided into prediction set samples and validation set samples using stratified sampling method in a 2:1 ratio. All the calibration and validation dataset satisfied the normal distribution. The research process of this paper was shown in Figure 2.

2.2. Kiwifruit Spectra and Sweetness Determination

The spectral information of kiwifruit was collected using the field-portable spectroradiometer SVC HR-1024I indoors. This instrument covered the spectral range from 400 to 2500 nm. The spectral resolution is 3.5 nm at 400~1000 nm, 9.5 nm at 1100~1850 nm, and 6.5 nm at 1850~2526 nm. All the measurements were conducted in a dark room environment with halogen lamps to minimize the influence of the surrounding environment on kiwifruit spectral data. The spectroradiometer was placed vertically 10 cm above the sample surface with a field-of-view angle of 4°. Prior to each measurement, the radiometer was calibrated using a whiteboard. To ensure measurement accuracy, ten replicates were recorded for each kiwifruit sample, and the average spectra were utilized for subsequent spectral analysis. All measurements were completed within 12 h after the samples arriving indoors.
Following the spectral data collection, sweetness determination for the kiwifruit samples was carried out. The equatorial region of each kiwifruit was peeled to access the fruit’s pulp. A suitable amount of pulp was extracted and juiced, and the resulting juice was dispensed into the detection tank of the ATAGO PAL-BX/ACID5 Sugar and Acid All-in-One machine. The Brix value of sweetness for each sample was then read from the machine. The mean of two parallel measurements was used as the sweetness content of each sample to reduce the measurement error.

2.3. Spectral Processing

In this study, the spectral reflectance curves in the range of 400~2500 nm were first resampled to the interval of 1 nm. The Savitzky-Golay (SG) technique was employed to perform spectral smoothing and noise reduction on the original spectra with a nine-point moving window and a second-order polynomial fitting [33]. Based on the smoothed spectra, the MSC and SNV transformation were performed to mitigate the impact of solid particle size scattering and refractive index on the sample surface. The MSC first calculates the mean spectrum and then compares each spectrum with the mean spectrum as a unitary linear regression. The SNV subtracts the mean value of the spectrum from the original spectrum and divides it by the standard deviation of the spectrum [34,35]. All the pre-processing methods were implemented under MATLAB R2022b.

2.4. Feature Selection Methods

To eliminate redundancy and improve processing efficiency, SPA and CARS algorithms were compared for extracting feature bands from the processed kiwifruit spectra. Both algorithms were implemented under MATLAB software. The SPA is a forward variable selection technique aimed at minimizing collinearity within a vector space [36]. By employing vector projection analysis, it identifies a set of variables from the spectral data containing the least redundant information, minimizing collinearity among variables within the dataset. This, in turn, reduces the number of variables used for detection and enhances detection efficiency [37]. The CARS algorithm involves the selection of variables with large absolute regression coefficients using an adaptive weighted algorithm. It selects a subset of variables through cross-validation, aiming to minimize the cross-validation RMSE [29]. In this study, the CARS method was implemented utilizing ten-fold cross-validation and 100 Monte Carlo sampling iterations to determine the features with the lowest cross-validation RMSE.

2.5. Modeling Methods

2.5.1. Multiple Linear Regression (MLR)

The MLR is a statistical method that attempts to simulate the relationship between two or more explanatory variables and a response variable by fitting a linear equation to observed data [5]. In this study, all the modeling methods were carried out in MATLAB R2022b.

2.5.2. Partial Least Squares Regression (PLS)

The PLS considers the correlation between data and incorporates principal component analysis to filter out spectral noise during the regression process. PLS generates latent variables that maximize the covariance between sensitive bands and sweetness variables. By prioritizing latent variables based on their contribution to the predictive quality of the regression model, PLS facilitates the selection of a simplified model without the risk of overfitting. In this study, the number of latent variables was selected on the basis of the standard error of leave-one-out cross-validation.

2.5.3. Least Squares Support Vector Machines (LSSVM)

The LSSVM is an extension of the support vector machine (SVM). It employs a least squares linear system instead of the quadratic programming method in SVM to estimate the errors between the predicted and true values [38]. LSSVM simplifies the solution process using equation constraints based on the Lagrange multiplier method, resulting in improved computational efficiency and prediction capabilities [39]. In this study, the calibration and validation datasets were initially normalized. After thorough debugging, a regularization parameter of 100 and a kernel parameter of 10 were selected.

2.5.4. Back Propagation (BP) Neural Network

The BP neural network is a multilayer feed-forward neural network trained using the error backpropagation algorithm. It consists of input, hidden, and output layers, and it employs the network error squared as the objective function. The gradient descent method is utilized to calculate the minimum value of this objective function [40]. In this study, the BP neural network was employed to train the normalized data. After parameter tuning and training, the best model was achieved with four nodes in the hidden layer and one node in the output layer.

2.6. Evaluation Metrics for Model Accuracy

The coefficient of determination (R2) and root mean square error (RMSE) were employed to assess the model’s accuracy. R2 reflects the goodness of fit, while RMSE quantifies the deviation between predicted and measured values. A higher R² with a value closer to 1, and a lower RMSE with a value closer to 0 indicate a better prediction model. The formulas are as follows:
R 2 = i = 1 n ( y ^ i y ¯ ) 2 / i = 1 n ( y i y ¯ ) 2
R M S E = i = 1 n ( y i y ^ i ) 2 / n
where, n denotes the number of samples. yi represents the measured value of the sample i, y ¯ represents the average of the measured values of the sample, y ^ i represents the estimated value of the sample i, and RMSE represents the root mean square error.

3. Results and Analysis

3.1. Description of Kiwifruit Sweetness Data

An analysis of variance (ANOVA) was conducted to assess the kiwifruit sweetness levels across five sampling areas. The results indicated no significant differences among the five sampling areas. The statistical characteristics of the samples for each period was presented in Table 2. As the picking date progressed, the kiwifruit ripened gradually, with its sweetness value increasing from 7.56% in the early stage to 15.73% in the late stage of harvest. The average sweetness value for the entire harvest period was 10.58%. The coefficient of variation of sweetness at the early stage of harvest (T1) was relatively large at 20.64%, gradually decreasing as the reproductive period advanced.

3.2. Response of Kiwifruit Surface Reflectance to Sweetness Content

The response patterns of the SG, SNV, and MSC spectra at different sweetness levels were illustrated in Figure 3. SG smoothing effectively mitigated the random interference originating from the original spectra, enhancing the overall smoothness of the spectral curves. Subsequently, after SNV and MSC transformations, the curves became more compact, and distinctive patterns emerged in specific spectral bands. For instance, the spectral reflectance curves of kiwifruit in the vicinity of 720~850 nm exhibited gradual decreases and increased with saccharinity variations, particularly evident in the SNV and MSC transformations. In contrast, the spectral reflectance in the ranges of 1560~1960 nm and 2000~2270 nm displayed a discernible regularity, which increased progressively with rising sweetness levels, demonstrating a clear positive correlation.

3.3. Feature Extraction

To address the computational intensity and information redundancy associated with full-band models, the study employed SPA and CARS algorithms for sensitive band selection. As summarized in Table 3 and illustrated in Figure 4, a noticeable difference emerged between the two algorithms in terms of sensitive bands. The CARS algorithm frequently selected consecutive wavelength information, while the SPA algorithm followed a more dispersed pattern. Although the locations of the characteristic wavelengths extracted by these algorithms differed, they consistently contained three spectral regions, 400~756 nm, 900~1250 nm, and 1900~2500 nm. Under the SPA, all three transformed spectra obtained sensitive wavelengths both in blue and red regions. In contrast, the CARS algorithm only identified the sensitive position of the red band through MSC transformation and pinpointed the sensitive location at 422 nm in the blue band through SG processing. Both algorithms successfully captured reflectance peaks as sensitive bands ranging from 900 to 1250 nm. Moreover, the SPA also identified spectral bands near 800 nm, 1400 nm, and 1800 nm. In summary, both screening methods effectively reduced the dimensionality of spectral data and trimmed down the number of full-band feature parameters, compressing the original 2101 spectra into 8~20 significant spectral features.

3.4. Calibration and Validation of Sweetness Estimation Models

With the features screened by SPA and CARS as the independent variables, the kiwifruit sweetness estimation models under different harvest periods were constructed. The R2 and RMSE of each prediction and validation model were shown in Table 4 and Table 5.

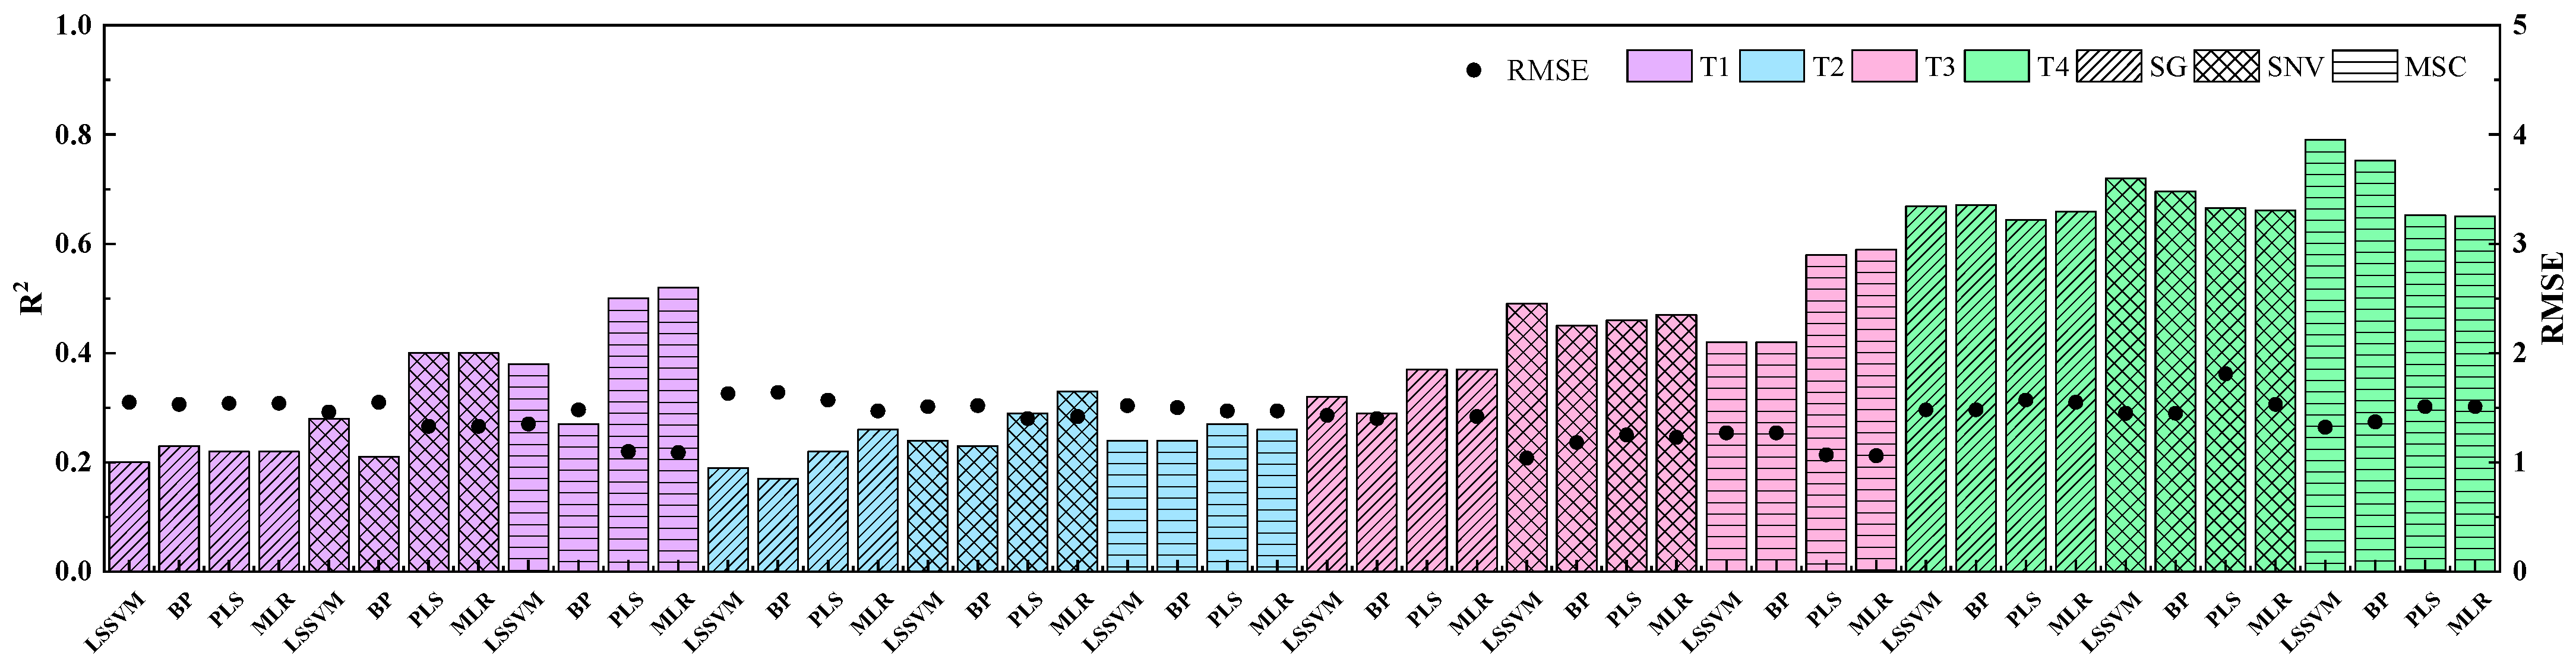
3.4.1. Sweetness Estimation Based on Hyperspectral Features from SPA

In general, the accuracy of models based on SNV and MSC methods surpassed that of the model employing the SG method(Table 4 and Table 5; Figure 5). During the T1 period, after spectral preprocessing, the R2 increased from 0.20 to 0.52, and the RMSE decreased from 1.55 to 1.09. In the T2 period, the R2 increased from 0.17 to 0.33, and the RMSE decreased from 1.57 to 1.40. During the T3 period, the R2 increased from 0.29 to 0.59, and the RMSE decreased from 1.43 to 1.04. During the T4 period, the R2 value improved from 0.64 to 0.79, while the RMSE reduced from 1.57 to 1.32. Notably, It can also be clearly seen from Figure 5 that the modeling and validation accuracy were superior for the whole harvest period (T4) compared to individual harvest periods(T1, T2, and T3).
From a modeling perspective, the LSSVM method outperformed the others in the whole harvest period (T4). The accuracy of each estimation model followed the order of LSSVM, BP, MLR, and PLS. The optimal estimation model was given by the LSSVM using MSC processing in combination with features extracted by the SPA algorithm, with the R2 of the validation dataset being 0.79 and RMSE being 1.32. The scatter distribution between measured and predicted sweetness values was close to the 1:1 line (Figure 6).
For the other harvest stages, both the PLS and MLR models had higher accuracy than the LSSVM and BP models. The accuracy of the models in the T3 period was higher than that in the T1 period, and the T2 period was the lowest. For the T3 period, the best model was MSC-SPA-MLR, with an R2 of 0.59 and RMSE of 1.04 respectively. For the T1 period, the R2 was concentrated in the range of 0.20∼0.52, and the RMSE was in the range of 1.09∼1.55. The best model was MSC-SPA-MLR with an R2 of 0.52. The models in the T2 period were all less accurate, with R2 between 0.17 and 0.33 and RMSE between 1.40 and 1.64.

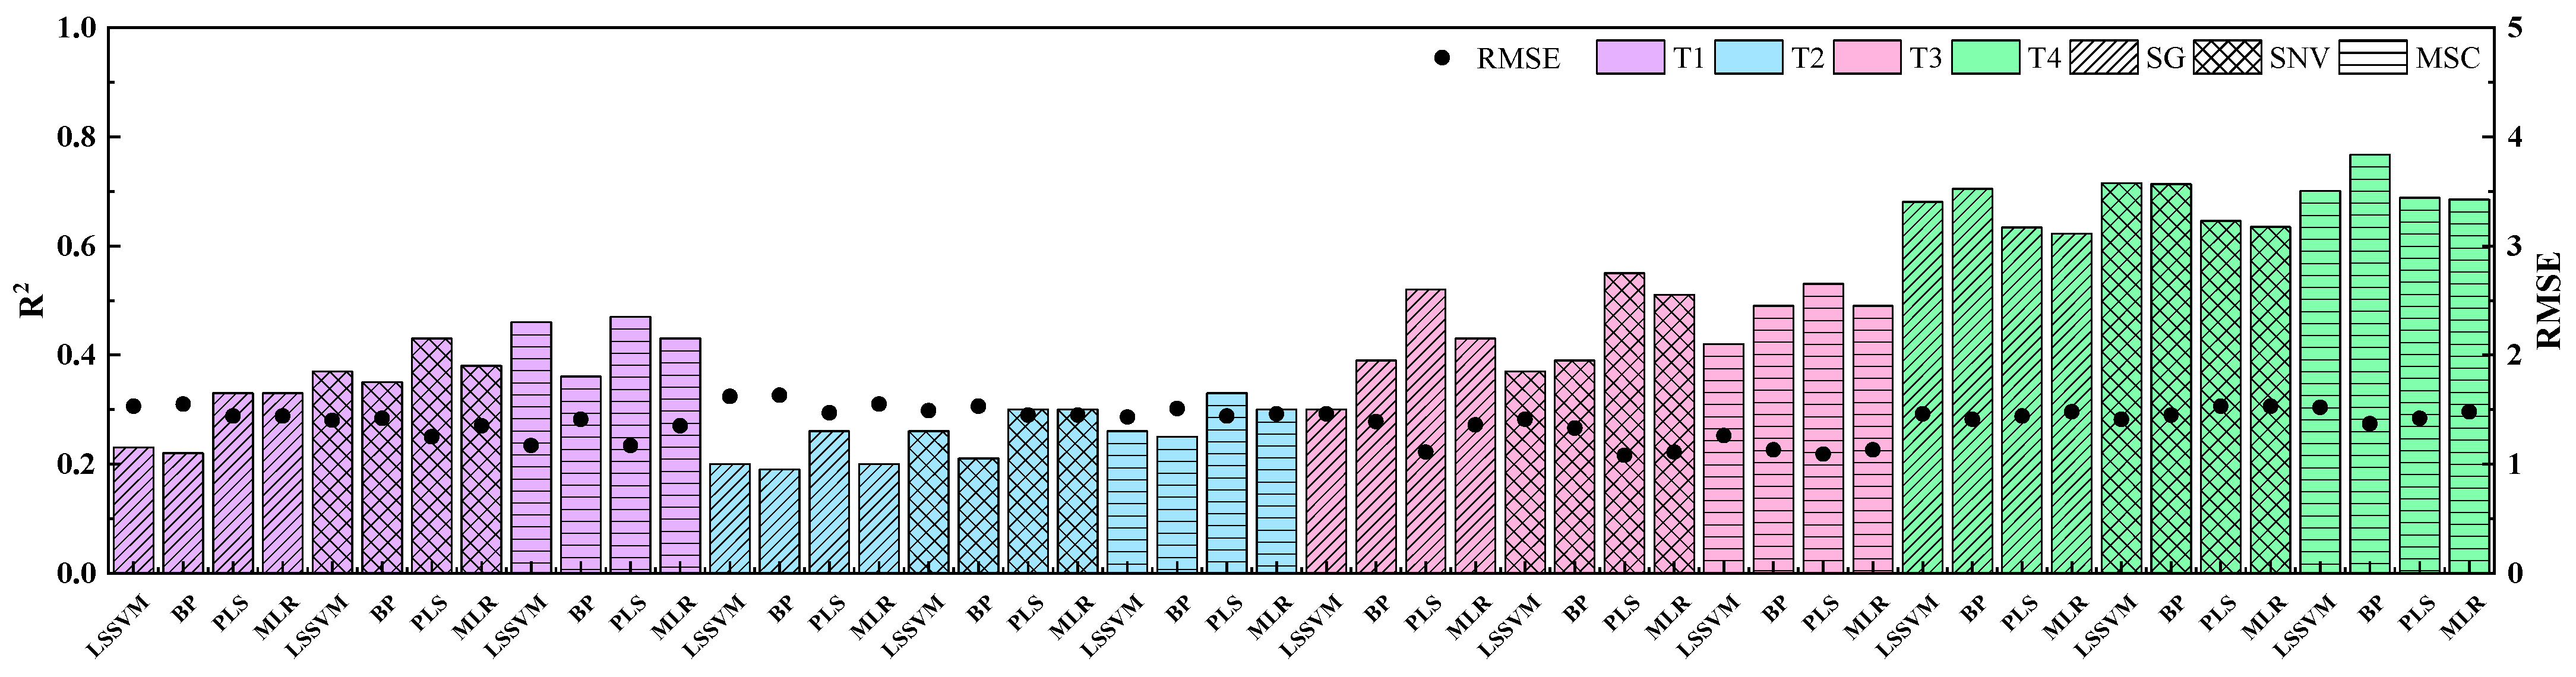
3.4.2. Sweetness Estimation Based on Hyperspectral Features from CARS

The model accuracy under the CARS algorithm has also been improved after SNV and MSC spectral preprocessing(Table 4 and Table 5; Figure 7). During the T1 period, the R2 increased from 0.22 to 0.47, and the RMSE decreased from 1.55 to 1.17. In the T2 period, the R2 increased from 0.19 to 0.33, and the RMSE decreased from 1.63 to 1.43. During the T3 period, the R2 increased from 0.30 to 0.55, and the RMSE decreased from 1.46 to 1.08. During the T4 period, the R2 value improved from 0.62 to 0.77, while the RMSE reduced from 1.53 to 1.37.
The accuracy of kiwifruit sweetness estimation models established by features screened by the CARS method were shown in Table 4 and Figure 7. All the models in the whole harvest period (T4) were the best. The optimal sweetness prediction model under the CARS algorithm at the T4 stage was MSC-BP. The fitting line between predicted and measured sweetness values was close to the 1:1 line, with R2 being 0.77 and RMSE being 1.37 (Figure 8). Overall, the accuracy of models constructed with the features extracted from SNV and MSC spectra was improved compared to that of the model under SG spectra.
For other harvest periods, the prediction results of the T3 period were relatively high. The best estimation model in T3 was built by combining features under SNV transformation and PLS regression method, with R2 of 0.55 and RMSE of 1.08, followed by the T1 period. The best model was obtained by the MSC-CARS-PLS method in the T1 period, with R2 of predictive models between 0.22 and 0.47, and RMSE between 1.17 and 1.55. The accuracy of the prediction models was lower in the T2 period, with R2 ranging from 0.19 to 0.33, and RMSE from 1.44 to 1.63.

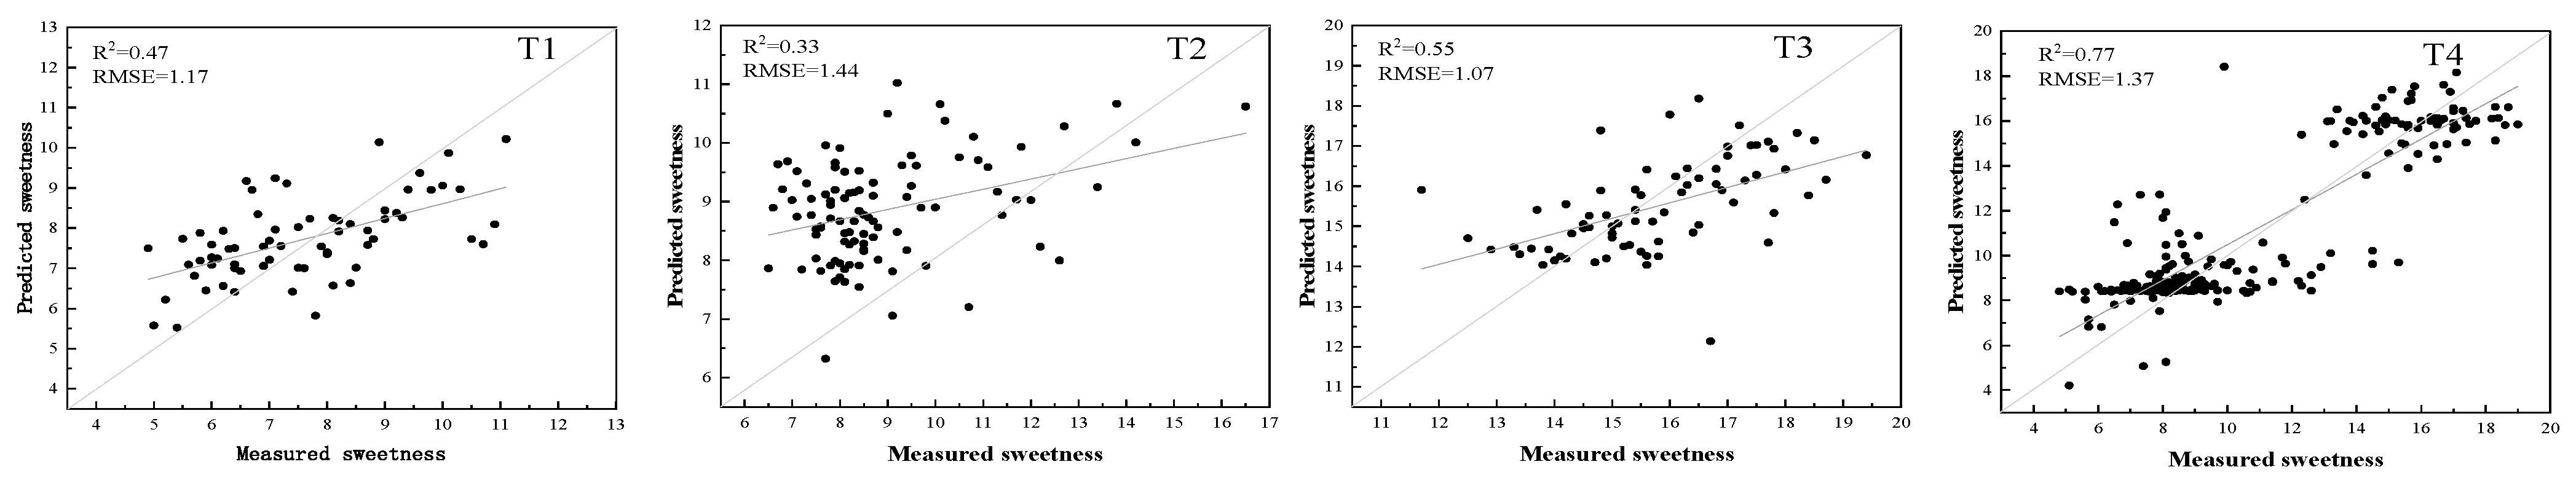
3.5. Comparison and Accuracy Analysis

In a comprehensive comparison, the estimation models developed under different kinds of methods were predictive and similar for kiwifruit sweetness in all four periods. The accuracy of validation models under both SPA and CARS features showed that the estimation accuracy for each harvest period (T1, T2, and T3) were lower than that in the full-harvest period (T4). From the modeling methods, the prediction accuracy of the LSSVM and the BP methods were lower than that of the PLS and the MLR under each harvesting period (T1, T2, and T3) due to the fact that the nonlinear model required a greater number of samples, whereas the models for the full-harvest period (T4), the LSSVM and the BP, were significantly superior to the rest of the two algorithms. Comparing the scatter distribution of T4 period in Figure 6 and Figure 8, the dispersion of scatters between the measured and predicted values in verification dataset was smaller with SPA feature selection method than CARS, and the fitting line was closer to the 1:1 line.
Under the SPA feature selection method, the best models for estimating the sweetness of kiwifruit at T1, T2, and T3 periods were MSC-SPA-MLR, SNV-SPA-MLR, and MSC-SPA-MLR, which could explain 52%, 33%, and 59% of the variation in kiwifruit sweetness levels, respectively. The best validation model for the whole harvest period was MSC-SPA-LSSVM, which could explain up to 79% of the variability in kiwifruit sweetness. The best models for kiwifruit sweetness from T1 to T3 period under the CARS feature selection method were MSC-CARS-PLS, MSC-CARS-PLS, and SNV-CARS-PLS, which could explain 47%, 33%, and 55% of the variation in kiwifruit sweetness levels, respectively. The best validation model for the whole harvest period was MSC-CARS-BP, which could explain up to 77% of the variability in kiwifruit sweetness levels. Comparing the scatter distributions in Figure 6 and Figure 8, it could be seen that during the T4 period, the scatter distribution under the SPA algorithm was more concentrated and closer to the 1:1 line. In contrast, under the CARS algorithm, the sweetness predicted for measured values of 6–10% was mostly around 8%, while those with 14–18% are predicted to be about 16%. Overall, the accuracy of estimation models with features from SPA were higher than those from the CARS algorithm.

4. Discussion

4.1. Impact of Spectral Pre-Processing on Sweetness Prediction

The spectral reflectance of kiwifruit aligns with the typical reflectance curve of the plant [41]. The shape of the reflectance curve is mainly controlled by the absorption information of the biochemical components present in the sample. But the scatter information related to the complex interaction of the light with the physical structure of the samples also added to the reflectance signals [42]. Solid samples often feature non-uniform surfaces and can scatter light during diffuse reflection, resulting in additive and multiplicative effects and causing a weaker spectral signal. Therefore, the remove of the scatter information from the hyperspectral data is the first step for predicting chemical components in NIR data modeling. Given that kiwifruit spectra are susceptible to various factors, both the MSC and SNV transformation were used to correct the light scattering from the uneven surface distribution of kiwifruit. In SNV, each spectrum was centered and then scaled by the corresponding standard deviation to reduce the multiplicative effects of scattering. MSC corrected the baseline and amplification effects to the reference spectrum for every spectrum [43,44]. They were used to compensate for additive and/or multiplicative effects in spectral data. Studies on different subjects showed different performances of each scatter-correction technique [45,46]. Our result showed improved sweetness prediction results after MSC and SNV transformation than the smoothed spectra. By contrast, the performance of MSC was slightly better than SNV under the same regression method, but the difference between two methods was not significant. Some studies have shown that a better predictive performance could be obtained when the information from differently scatter corrected data was jointly used [47,48]. The fusion of information from different scatter-correction techniques will cause a large amount of data. Whether the fusion is effective for the estimation of kiwifruit sweetness needs to be verified in future work. Overall, MSC or SNV transformation was suggested for the extraction of kiwifruit properties with NIR data.

4.2. Influence of Feature Extraction Methods on Sweetness Prediction

The effective features were important for the development of sweetness estimation models. The removal of non-informative features will produce better prediction results with simpler and more stable models. Both SPA and CARS algorithms were implemented for selection of key wavelengths and reduction of the redundant information generated through hyperspectral data. After feature selection, the count of features processed by the SPA and CARS algorithm was 8~20, which was much lower than the full bands. The general distribution trend was similar for two algorithms. The overlapping variables could be observed in the spectral range of 400~756 nm, 900~1250 nm, and 1900~2500 nm, which were corresponding to the absorbance range of the O-H and C-H bonds present in total sugar. Notably, both SPA and CARS algorithms extracted wavelengths in the red and blue regions, demonstrating that kiwifruit exhibits significant absorption of red and blue light during its growth period for photosynthesis to produce sugar. This phenomenon corresponds with the findings of Benelli et al. (2022) and Liu et al. (2017) [49,50]. Furthermore, characteristic bands near 760, 970 [51], 1200 [52], and 1400 nm were identified and significantly contributed to the regression model. The best model for sweetness estimating was suggested by the SPA method. It was because SPA iteratively selected characteristic wavelengths in geometric space considering the representativeness and difference of the samples contributing to more accurate sweetness forecasts.

4.3. Impact of Modeling Methods on Sweetness Prediction

In this study, the spectral reflectance at the range of 400–2500 nm was used to select the optimal model combination. Both classical linear models of MLR and PLS, as well as nonlinear models of LSSVM and BP based on SPA and CARS algorithms for processed spectra were compared. Zhu et al. (2017) previously employed multiple linear regression (MLR), partial least squares regression (PLS), and least squares support vector machine (LSSVM) for estimation of kiwifruit internal qualities [53], achieving accuracy greater than 0.94. Similarly, Meng et al. (2021) utilized hyperspectral data to estimate plum properties and achieved accuracy exceeding 0.93 using SPA and CARS algorithms with MLR and BP [25]. In line with these findings, our results showed that better accuracies were observed by the nonlinear models SPA-LSSVM and CARS-BP, which achieved accuracy of 0.79 and 0.77, respectively. In contrast, MLR and PLS models achieved the highest accuracy at 0.59, indicating that the relationship between kiwifruit spectra and sweetness extends beyond a typical linear correlation.
From the perspective of agricultural research, the physicochemical parameter model constructed during the whole growth period of crops often had high precision, and could explore the change law of properties from the growth cycle [54]. The study declared that the estimation model was robust only when the sample had a sufficiently wide maturity range [55]. For kiwifruit, the distribution of sweetness was concentrated in each harvest period. The estimation model at whole harvest stage gave the best expression of sweetness changes. This was consistent with the previous research. Numerous researchers in non-destructive detecting of fruit internal qualities had consistently reported that sweetness content estimation models outperformed those for other quality attributes such as pH and firmness [25,35,56,57]. This research could partially provide a theoretical basis for the development of portable non-destructive monitoring equipment for kiwifruit sweetness.

4.4. Challenges

The study demonstrating the utilization of hyperspectral reflectance for non-destructive kiwifruit sweetness testing holds great promise for the future. However, this investigation exclusively focused on Cuixiang kiwifruit, characterized by a smooth, scarless surface and oval shape, for the purpose of controlling variables. It remains to be explored whether similar results can be achieved with other kiwifruit varieties or those with minor imperfections. Therefore, future research should involve a broader selection of kiwifruit varieties, encompassing diverse appearances, to ensure model stability, broaden the scope of measurement, and enhance model accuracy.

5. Conclusions

Based on Vis/NIR reflectance data of fresh kiwifruit, the kiwifruit sweetness was estimated across four harvest periods by employing SG, MSC, and SNV transformation methods, SPA and CARS feature selection techniques, and MLR, PLS, LSSVM, and BP modeling approaches. SNV and MSC algorithms could remove the scatter information from the Vis/NIR data due to the uneven surface distribution of kiwifruit, which significantly enhanced the relationship between the spectral reflectance and sweetness. SPA and CARS methods for feature extraction reduced the number of spectral variables from 2101 to a range of 8–20, which significantly diminished data redundancy and made a simple equation for sweetness estimation. The accuracy of the sweetness estimation model in the whole harvest stage was the best. The optimal model combination was MSC-SPA-LSSVM with R² of 0.79 and RMSE of 1.32. This combination effectively reduced the original 2101 spectra to just 8, achieving substantial data reduction while rapid, non-destructive, and accurate predicting of kiwifruit sweetness levels. The sensitive wavelength selected in this study will provide a theoretical basis for the potential application of Vis/NIR technology in the sweetness prediction of different fruits. The procedures for sweetness estimation would partially provide a theoretical and technical basis for the development of portable non-destructive monitoring equipment for kiwifruit sweetness. However, it remains a particular challenge to test the model performance of more kiwifruit cultivars.

Author Contributions

Conceptualization, C.W.; methodology, C.W.; software, C.W.; validation, C.W. and F.L.; formal analysis, C.W.; investigation, C.W., X.C., R.Y., K.F. and Z.L.; resources, F.L.; data curation, C.W., X.C., R.Y., K.F. and Z.L.; writing—original draft preparation, C.W.; writing—review and editing, C.W.,R.Y. and F.L.; visualization, C.W.; supervision, F.L.; project administration, F.L.; funding acquisition, F.L. All authors have read and agreed to the published version of the manuscript.

Funding

This research was funded by the National Natural Science Foundation of China (41701398).

Institutional Review Board Statement

Not applicable.

Informed Consent Statement

Not applicable.

Data Availability Statement

Data is contained within the article.

Conflicts of Interest

The authors declare no conflict of interest.

Abbreviations

The following abbreviations were uesd in this manuscript:
SGSavitzky-Golay Smoothing
SNVStandard Normal Variate
MSCMultiplicative Scatter Correction
SPASuccessive Projections Algorithm
CARSCompetitive Adaptive Reweighted Sampling
LSSVMLeast Squares Support Vector Machine
BPBack Propagation Neural Network
PLSPartial Least Squares
MLRMultiple Linear Regression

References

  1. Huang, Z.Y.; Li, J.; Zhang, J.F.; Guo, Y.Y.; Hui, G.H. Physicochemical properties enhancement of Chinese kiwi fruit (Actinidia chinensis Planch) via chitosan coating enriched with salicylic acid treatment. J. Food Meas. Charact. 2017, 11, 184–191. [Google Scholar] [CrossRef]
  2. Lu, Y.H.; Kang, T.T.; Zhang, X.J.; Gao, J.B.; Chen, Z.J.; Zhou, J.B. Evaluation of current fertilization status in kiwifruit orchards on the northern slope of Qinling Mountains: A case study of Yujiahe catchment, in Zhouzhi County. J. Plant Nutr. Fert. 2016, 22, 380–387. [Google Scholar]
  3. Guo, W.C.; Zhao, F.; Dong, J.L. Nondestructive measurement of soluble solids content of kiwifruits using near-infrared hyperspectral imaging. Food Anal. Methods 2016, 9, 38–47. [Google Scholar] [CrossRef]
  4. Moughan, P.J.; Rutherfurd, S.M.; Balan, P. Chapter Nine—Kiwifruit, Mucins, and the Gut Barrier. Adv. Food Nutr. Res. 2013, 68, 169–185. [Google Scholar] [PubMed]
  5. Torkashvand, A.M.; Ahmadi, A.; Nikravesh, N.L. Prediction of kiwifruit firmness using fruit mineral nutrient concentration by artificial neural network (ANN) and multiple linear regressions (MLR). J. Integr. Agric. 2017, 16, 1634–1644. [Google Scholar] [CrossRef]
  6. Carlini, P.; Massantini, R.; Mencarelli, F. Vis-NIR measurement of soluble solids in cherry and apricot by PLS regression and wavelength selection. J. Agric. Food Chem. 2000, 48, 5236–5242. [Google Scholar] [CrossRef] [PubMed]
  7. Bochereau, L.; Bourgine, P.; Palagos, B. A method for prediction by combining data analysis and neural networks: Application to prediction of apple quality using near infra-red spectra. J. Agric. Eng. Res. 1992, 51, 207–216. [Google Scholar] [CrossRef]
  8. Fan, S.X.; Huang, W.Q.; Li, J.B.; Guo, Z.M.; Zhao, C.J. Application of characteristic NIR variables selection in portable detection of soluble solids content of apple by near infrared spectroscopy. Spectrosc Spect Anal. 2014, 34, 2707–2712. [Google Scholar]
  9. Guo, Z.M.; Huang, W.Q.; Peng, Y.K.; Chen, Q.S.; Ouyang, Q.Y.; Zhao, J.W. Color compensation and comparison of shortwave near infrared and long wave near infrared spectroscopy for determination of soluble solids content of ‘Fuji’ apple. Postharvest Biol. Technol. 2016, 115, 81–90. [Google Scholar] [CrossRef]
  10. Sánchez, M.T.; De la Haba, M.J.; Benítez-López, M.; Fernández-Novales, J.; Garrido-Varo, A.; Pérez-Marín, D. Non-destructive characterization and quality control of intact strawberries based on NIR spectral data. J. Food Eng. 2012, 110, 102–108. [Google Scholar] [CrossRef]
  11. Sánchez, M.T.; De la Haba, M.J.; Serrano, I.; Pérez-Marín, D.C. Application of NIRS for nondestructive measurement of quality parameters in intact oranges during on-tree ripening and at harvest. Food Anal. Methods 2013, 6, 826–837. [Google Scholar] [CrossRef]
  12. Martinsen, P.; Schaare, P. Measuring soluble solids distribution in kiwifruit using near-infrared imaging spectroscopy. Postharvest Biol. Technol. 1998, 14, 271–281. [Google Scholar] [CrossRef]
  13. Schaare, P.N.; Fraser, D.G. Comparison of reflectance, interactance and transmission modes of visible-near infrared spectroscopy for measuring internal properties of kiwifruit (Actinidia chinensis). Postharvest Biol. Technol. 2000, 20, 175–184. [Google Scholar] [CrossRef]
  14. Ma, T.; Xia, Y.; Inagaki, T.; Tsuchikawa, S. Non-destructive and fast method of mapping the distribution of the soluble solids content and pH in kiwifruit using object rotation near-infrared hyperspectral imaging approach. Postharvest Biol. Technol. 2021, 174, 111440. [Google Scholar] [CrossRef]
  15. Li, J.; Huang, B.H.; Wu, C.P.; Sun, Z.; Xue, L.; Liu, M.H.; Chen, J.Y. Nondestructive detection of kiwifruit textural characteristic based on near infrared hyperspectral imaging technology. Int. J. Food Prop. 2022, 25, 1697–1713. [Google Scholar] [CrossRef]
  16. McGlone, V.A.; Jordan, R.B.; Seelye, R.; Martinsen, P.J. Comparing density and NIR methods for measurement of kiwifruit dry matter and soluble solids content. Postharvest Biol. Technol. 2002, 26, 191–198. [Google Scholar] [CrossRef]
  17. Yang, B.; Guo, W.C.; Huang, X.L.; Du, R.Y.; Liu, Z.H. A portable, low-cost and sensor-based detector on sweetness and firmness grades of kiwifruit. Comput. Electron. Agric. 2020, 179, 105831. [Google Scholar] [CrossRef]
  18. Wang, H.X.; Wang, C.; Peng, Z.H.; Sun, H.M. Feasibility study on early identification of freshness decay of fresh-cut kiwifruit during cold chain storage by Fourier transform-near infrared spectroscopy combined with chemometrics. J. Food Sci. 2022, 87, 3138–3150. [Google Scholar] [CrossRef] [PubMed]
  19. Afonso, A.M.; Antunes, M.D.; Cruz, S.; Cavaco, A.M.; Guerra, R. Non-destructive follow-up of ‘jintao’ kiwifruit ripening through VIS-NIR spectroscopy–individual vs. average calibration model’s prediction. Postharvest Biol. Technol. 2022, 188, 111895. [Google Scholar] [CrossRef]
  20. François, I.M.; Brandt, T.D.; De Proft, M. On the origin of kiwifruit: Classifying kiwifruit from different countries using vis/nir spectroscopy. Commun. Agric. Appl. Biol. Sci. 2008, 73, 149–152. [Google Scholar]
  21. Malavi, D.; Nikkhah, A.; Alighaleh, P.; Einafshar, S.; Raes, K.; Van Haute, S. Detection of saffron adulteration with Crocus sativus style using NIR-hyperspectral imaging and chemometrics. Food Control 2024, 157, 110189. [Google Scholar] [CrossRef]
  22. Cen, H.Y.; He, Y.; Huang, M. Measurement of soluble solids contents and pH in orange juice using chemometrics and Vis-NIRS. J. Agric. Food Chem. 2006, 54, 7437–7443. [Google Scholar] [CrossRef] [PubMed]
  23. Rogel-Castillo, C.; Boulton, R.; Opastpongkarn, A.; Huang, G.; Mitchell, A.E. Use of near-infrared spectroscopy and chemometrics for the nondestructive identification of concealed damage in raw almonds (Prunus dulcis). J. Agric. Food Chem. 2016, 64, 5958–5962. [Google Scholar] [CrossRef] [PubMed]
  24. Xu, S.; Lu, H.Z.; Ference, C.; Qiu, G.J.; Xin, L. Rapid nondestructive detection of water content and granulation in postharvest “shatian” pomelo using visible/near-infrared spectroscopy. Biosens 2020, 10, 41. [Google Scholar] [CrossRef] [PubMed]
  25. Meng, Q.L.; Shang, J.; Huang, R.S.; Zhang, Y. Determination of soluble solids content and firmness in plum using hyperspectral imaging and chemometric algorithms. J. Food Process Eng. 2021, 44, e13597. [Google Scholar] [CrossRef]
  26. Li, J.B.; Guo, Z.M.; Huang, W.Q.; Zhang, B.H.; Zhao, C.J. Near-infrared spectra combining with CARS and SPA algorithms to screen the variables and samples for quantitatively determining the soluble solids content in strawberry. Spectrosc Spect Anal. 2015, 35, 372–378. [Google Scholar]
  27. Liu, Y.D.; Zhang, G.W.; Cai, L.J. Analysis of chlorophyll in Gannan navel orange with algorithm of GA and SPA based on hyperspectral. Spectrosc Spect Anal. 2012, 32, 3377–3380. [Google Scholar]
  28. Zhan, B.S.; Ni, J.H.; Li, J. Hyperspectral technology combined with CARS algorithm to quantitatively determine the SSC in Korla fragrant pear. Spectrosc Spect Anal. 2014, 34, 2752–2757. [Google Scholar]
  29. Li, H.D.; Liang, Y.Z.; Xu, Q.S.; Cao, D.S. Key wavelengths screening using competitive adaptive reweighted sampling method for multivariate calibration. Anal. Chim. Acta 2009, 648, 77–84. [Google Scholar] [CrossRef]
  30. Qin, Y.H.; Song, K.K.; Zhang, N.Q.; Wang, M.H.; Zhang, M.; Peng, B. Robust NIR quantitative model using MIC-SPA variable selection and GA-ELM. Infrared Phys. Technol. 2023, 128, 104534. [Google Scholar] [CrossRef]
  31. Berhow, M.A.; Singh, M.; Bowman, M.J.; Price, N.P.J.; Vaughn, S.F.; Liu, S.X. Quantitative NIR determination of isoflavone and saponin content of ground soybeans. Food Chem. 2020, 317, 126373. [Google Scholar] [CrossRef] [PubMed]
  32. Zhang, D.Y.; Xu, Y.F.; Huang, W.Q.; Tian, X.; Xia, Y.; Xu, L.; Fan, S.X. Nondestructive measurement of soluble solids content in apple using near infrared hyperspectral imaging coupled with wavelength selection algorithm. Infrared Phys. Technol. 2019, 98, 297–304. [Google Scholar] [CrossRef]
  33. Savitzky, A.; Golay, M.J.E. Smoothing and differentiation of data by simplified least squares procedures. Anal. Chem. 1964, 36, 1627–1639. [Google Scholar] [CrossRef]
  34. Maleki, M.R.; Mouazen, A.M.; Ramon, H.; De Baerdemaekeret, J. Multiplicative scatter correction during on-line measurement with near infrared spectroscopy. Biosyst. Eng. 2007, 96, 427–433. [Google Scholar] [CrossRef]
  35. Moghimi, A.; Aghkhani, M.H.; Sazgarnia, A.; Sarmad, M. Vis/NIR spectroscopy and chemometrics for the prediction of soluble solids content and acidity (pH) of kiwifruit. Biosyst. Eng. 2010, 106, 295–302. [Google Scholar] [CrossRef]
  36. Araújo, M.C.U.; Saldanha, T.C.B.; Galvao, R.K.H.; Yoneyama, T.; Chame, H.C.; Visani, V. The successive projections algorithm for variable selection in spectroscopic multicomponent analysis. Chemom. Intell. Lab. Syst. 2001, 57, 65–73. [Google Scholar] [CrossRef]
  37. Tang, R.N.; Chen, X.P.; Li, C. Detection of nitrogen content in rubber leaves using near-infrared (NIR) spectroscopy with correlation-based successive projections algorithm (SPA). Appl. Spectrosc. 2018, 72, 740–749. [Google Scholar] [CrossRef] [PubMed]
  38. Suykens, J.A.K.; De Brabanter, J.; Lukas, L.; Vandewalle, J. Weighted least squares support vector machines: Robustness and sparse approximation. Neurocomputing 2002, 48, 85–105. [Google Scholar] [CrossRef]
  39. De Kruif, B.J.; De Vries, T.J.A. Pruning error minimization in least squares support vector machines. IEEE Trans. Neural Netw. 2003, 14, 696–702. [Google Scholar] [CrossRef]
  40. Chen, X.K.; Li, F.L.; Wang, Y.N.; Shi, B.T.; Hou, Y.H.; Chang, Q.R. Estimation of winter wheat leaf area index based on UAV hyperspectral remote sensing. Trans. Chin. Soc. Agric. Eng. 2020, 36, 40–49. [Google Scholar]
  41. Hu, W.H.; Sun, D.W.; Blasco, J. Rapid monitoring 1-MCP-induced modulation of sugars accumulation in ripening ‘Hayward’ kiwifruit by Vis/NIR hyperspectral imaging. Postharvest Biol. Technol. 2017, 125, 168–180. [Google Scholar] [CrossRef]
  42. Van Beers, R.; Aernouts, B.; Watté, R.; Schenk, A.; Nicolaï, B.; Saeys, W. Effect of maturation on the bulk optical properties of apple skin and cortex in the 500–1850 nm wavelength range. J. Food Eng. 2017, 214, 79–89. [Google Scholar] [CrossRef]
  43. Bi, Y.M.; Yuan, K.L.; Xiao, W.Q.; Wu, J.Z.; Shi, C.Y.; Xia, J.; Chu, G.H.; Zhang, G.X.; Zhou, G.J. A local pre-processing method for near-infrared spectra, combined with spectral segmentation and standard normal variate transformation. Anal. Chim. Acta 2016, 909, 30–40. [Google Scholar] [CrossRef]
  44. Mishra, P.; Verkleij, T.; Klont, R. Improved prediction of minced pork meat chemical properties with near-infrared spectroscopy by a fusion of scatter-correction techniques. Infrared Phys. Technol. 2021, 113, 103643. [Google Scholar] [CrossRef]
  45. Guo, Q.; Wu, W.; Massart, D.L. The robust normal variate transform for pattern recognition with near-infrared data. Anal. Chim. Acta 1999, 382, 87–103. [Google Scholar] [CrossRef]
  46. Ge, Y.H.; Tu, S.Y. Identification of Chilling Injury in Kiwifruit Using Hyperspectral Structured-Illumination Reflectance Imaging System (SIRI) with Support Vector Machine (SVM) Modelling. Anal. Lett. 2023, 56, 2040–2052. [Google Scholar] [CrossRef]
  47. Mishra, P.; Biancolillo, A.; Roger, J.M.; Marini, F.; Rutledge, D.N. New data preprocessing trends based on ensemble of multiple preprocessing techniques. TrAC Trends Anal. Chem. 2020, 132, 116045. [Google Scholar] [CrossRef]
  48. Mishra, P.; Lohumi, S. Improved prediction of protein content in wheat kernels with a fusion of scatter correction methods in NIR data modelling. Biosyst. Eng. 2021, 203, 93–97. [Google Scholar] [CrossRef]
  49. Benelli, A.; Cevoli, C.; Fabbri, A.; Ragni, L. Ripeness evaluation of kiwifruit by hyperspectral imaging. Biosyst. Eng. 2022, 223, 42–52. [Google Scholar] [CrossRef]
  50. Liu, D.Y.; Guo, W.C. Identifying CPPU-Treated Kiwifruits Using Near-Infrared Hyperspectral Imaging Technology. Food Anal. Methods 2017, 10, 1273–1283. [Google Scholar] [CrossRef]
  51. McGlone, V.A.; Kawano, S. Firmness, dry-matter and soluble-solids assessment of postharvest kiwifruit by NIR spectroscopy. Postharvest Biol. Technol. 1998, 13, 131–141. [Google Scholar] [CrossRef]
  52. Workman, J.; Weyer, L. Practical Guide to Interpretive Near-Infrared Spectroscopy; Taylor & Francis Group: New York, NY, USA, 2007; pp. 63–70. [Google Scholar]
  53. Zhu, H.Y.; Chu, B.Q.; Fan, Y.Y.; Tao, X.Y.; Yin, W.X.; He, Y. Hyperspectral Imaging for Predicting the Internal Quality of Kiwifruits Based on Variable Selection Algorithms and Chemometric Models. Sci. Rep. 2017, 7, 7845. [Google Scholar] [CrossRef] [PubMed]
  54. Li, F.L.; Wang, L.; Liu, J.; Wang, Y.N.; Chang, Q.R. Evaluation of Leaf N Concentration in Winter Wheat Based on Discrete Wavelet Transform Analysis. Remote Sens. 2019, 11, 1331. [Google Scholar] [CrossRef]
  55. Clark, C.J.; McGlone, V.A.; De Silva, H.N.; Manning, M.A.; Burdon, J.; Mowat, A.D. Prediction of storage disorders of kiwifruit (Actinidia chinensis) based on visible-NIR spectral characteristics at harvest. Postharvest Biol. Technol. 2004, 32, 147–158. [Google Scholar] [CrossRef]
  56. Ma, T.; Zhao, J.; Inagaki, T.; Su, Y.; Tsuchikawa, S. Rapid and nondestructive prediction of firmness, soluble solids content, and pH in kiwifruit using Vis–NIR spatially resolved spectroscopy. Postharvest Biol. Technol. 2022, 186, 111841. [Google Scholar] [CrossRef]
  57. Li, M.; Pullanagari, R.R.; Pranamornkith, T.; Yule, I.J.; East, A.R. Quantitative prediction of post storage ‘Hayward’ kiwifruit attributes using at harvest Vis-NIR spectroscopy. J. Food Eng. 2017, 202, 46–55. [Google Scholar] [CrossRef]
Figure 1. Geographic location of the study area.
Applsci 14 04145 g001
Figure 2. The procedure of spectral processing and sweetness determination in this study.
Applsci 14 04145 g002
Figure 3. The response of kiwifruit surface spectral reflectance to different sweetness levels. Reflectance with (a) SG processing, (b) SNV processing, and (c) MSC processing.
Applsci 14 04145 g003
Figure 4. Feature extraction of SG, SNV and MSC transformation spectra under SPA and CARS methods.
Applsci 14 04145 g004
Figure 5. The validation of sweetness estimation models with features by SPA algorithm.
Applsci 14 04145 g005
Figure 6. Scatter distribution between the predicted and measured sweetness in each harvest stage with features by SPA.
Applsci 14 04145 g006
Figure 7. The validation of sweetness estimation models with features by CARS algorithm.
Applsci 14 04145 g007
Figure 8. Scatter distribution between the predicted and measured sweetness in each harvest stage with features by CARS algorithm.
Applsci 14 04145 g008
Table 1. Kiwifruit sample collection in this study.
YearDateNo. of Samples
202126 August, 4 September, 29 September20, 70, 50
202229 September, 25 September, 25 October130, 250, 215
Table 2. Statistical description of Kiwifruit samples.
PeriodNo. of SamplesSweetness (%)Coefficient of Variation
MinimumMaximumAverage
T12024.811.17.5620.64%
T22906.413.98.8117.84%
T321511.219.415.739.86%
T47074.819.410.5835.95%
Table 3. Selection of sensitive bands using different methods.
Transformed SpectraMethodNo. of FeaturesSensitive Band (nm)
SGCARS15422 959 1143 1230 1231 1232 1233 1234 1235 1396 1397 1398 1399 2425 2490
SPA16404 562 677 708 757 812 978 982 1081 1234 1395 2395 2471 2479 2489 2500
SNVCARS19959 1142 1143 1144 1145 1228 1229 1230 1231 1232 1233 1234 1235 1388 1389 1390 1391 1392 2424
SPA13400 405 408 411 699 724 913 1138 1420 1781 1902 1987 2169
MSCCARS20644 645 647 708 929 942 1138 1139 1140 1231 1232 1233 1234 1392 1393 1394 1395 1835 1836 2490
SPA8407 639 708 756 1142 1230 1435 1902
Note: “SG” means “Savitzky-Golay Smoothing”; “SNV” means “Standard Normal Variate”; “MSC” means “multiplicative scatter correction”; “SPA” means “successive projections algorithm”; “CARS” means “competitive adaptive reweighted sampling”.
Table 4. The R2 of kiwifruit sweetness estimation models under different harvest periods with different methods.
SpectrumFeatureLSSVMBPPLSMLR
T1T2T3T4T1T2T3T4T1T2T3T4T1T2T3T4
SGSPA0.200.190.320.670.230.170.290.670.220.220.370.640.220.260.370.66
CARS0.230.200.300.680.220.190.390.700.330.260.520.630.330.200.430.62
SNVSPA0.280.240.490.720.210.230.450.700.400.290.460.670.400.330.470.66
CARS0.370.260.370.710.350.210.390.710.430.300.550.650.380.300.510.64
MSCSPA0.380.240.420.790.270.240.420.750.500.270.580.650.520.260.590.65
CARS0.460.260.420.700.360.250.490.770.470.330.530.690.430.300.490.69
Note: “SG” means “Savitzky-Golay Smoothing”; “SNV” means “Standard Normal Variate”; “MSC” means “multiplicative scatter correction”; “SPA” means “successive projections algorithm”; “CARS” means “competitive adaptive reweighted sampling”; “LSSVM” means “least squares support vector machine”; “BP” means “back propagation neural network”; “PLS” means “partial least squares”; “MLR” means “multiple linear regression”.
Table 5. The RMSE of kiwifruit sweetness estimation models under different harvest periods with different methods.
SpectrumFeatureLSSVMBPPLSMLR
T1T2T3T4T1T2T3T4T1T2T3T4T1T2T3T4
SGSPA1.551.631.431.481.531.641.401.481.541.571.431.571.541.471.421.55
CARS1.531.621.461.461.551.631.391.411.441.471.111.531.441.551.361.48
SNVSPA1.461.511.041.451.551.521.181.451.331.401.251.811.331.421.231.53
CARS1.401.491.411.411.421.531.331.451.251.451.081.531.351.451.111.53
MSCSPA1.351.521.271.321.481.501.271.371.101.471.071.511.09 1.471.051.51
CARS1.171.431.261.521.411.511.131.371.171.441.091.421.351.461.131.48
Note: “SG” means “Savitzky-Golay Smoothing”; “SNV” means “Standard Normal Variate”; “MSC” means “multiplicative scatter correction”; “SPA” means “successive projections algorithm”; “CARS” means “competitive adaptive reweighted sampling”; “LSSVM” means “least squares support vector machine”; “BP” means “back propagation neural network”; “PLS” means “partial least squares”; “MLR” means “multiple linear regression”.
Disclaimer/Publisher’s Note: The statements, opinions and data contained in all publications are solely those of the individual author(s) and contributor(s) and not of MDPI and/or the editor(s). MDPI and/or the editor(s) disclaim responsibility for any injury to people or property resulting from any ideas, methods, instructions or products referred to in the content.

