Abstract
Heterogeneous data have been used to enhance behavior prediction performance; however, it involves issues such as missing data, which need to be addressed. This paper proposes enhanced pet behavior prediction via Sensor to Skeleton Generative Adversarial Networks (S2GAN)-based heterogeneous data synthesis. The S2GAN model synthesizes the key features of video skeletons based on collected nine-axis sensor data and replaces missing data, thereby enhancing the accuracy of behavior prediction. In this study, data collected from 10 pets in a real-life-like environment were used to conduct recognition experiments on 9 commonly occurring types of indoor behavior. Experimental results confirmed that the proposed S2GAN-based synthesis method effectively resolves possible missing data issues in real environments and significantly improves the performance of the pet behavior prediction model. Additionally, by utilizing data collected under conditions similar to the real environment, the method enables more accurate and reliable behavior prediction. This research demonstrates the importance and utility of synthesizing heterogeneous data in behavior prediction, laying the groundwork for applications in various fields such as abnormal behavior detection and monitoring.
1. Introduction
Accurate and automatic recognition of situations and behaviors using raw data is crucial for behavior prediction. Recent advancements in Internet of Things (IoT), artificial intelligence (AI), and wireless sensor networks have facilitated the rapid collection and processing of high-dimensional raw data, thereby improving behavior monitoring []. Among research on various monitoring targets, research centered on companion animals has recently increased.
Understanding and predicting the behavior of pets is crucial for animal welfare, behavior modification, disease prevention, and early detection of diseases [,]. Because it relies on manual observation by pet owners or experts, it is time-consuming; there is ongoing research to automate and quantify pet behavior []. However, data on pet behavior are often complex, heterogeneous, and frequently incomplete, making its effective analysis and usage challenging.
Despite the introduction of various pet IoT devices and advancements in AI technology enabling precise predictions and analyses of pet behavior, the development of comprehensive models for predicting pet behavior still requires further research. Most previous studies have relied on data collected in limited spaces or have analyzed only simple behaviors [,,]; they do not adequately consider the actual size and diversity of pets’ living spaces and have limitations in reflecting the diversity and complexity of pet behavior.
Recently, there have been attempts in the field of behavior prediction to improve performance using heterogeneous data. For instance, video data may encounter issues due to obstacles or blind spots, whereas sensor data can suffer from problems such as noise []. Using heterogeneous data, it is possible to mitigate these issues and enhance prediction performance []. In research targeting humans, using various heterogeneous data is common. However, research on behavior prediction that targets pets has gradually progressed because of difficulties in data collection and the diversity of pet behaviors.
Herein, we propose a new method for predicting pet behavior by synthesizing heterogeneous data using the Sensor to Skeleton Generative Adversarial Networks (S2GAN) model. The heterogeneous data used in this approach were collected using commonly used cameras and wearable devices for monitoring pets.
When dealing with heterogeneous data, it is crucial to note that even partially missing data can cause significant problems for the model. Therefore, our method based on the S2GAN model—a generative adversarial network that enables the transformation of sensor data into the feature of skeleton data—aims to overcome the limitations of video data by supplementing missing data with a small data collection range. Even if the feature of skeleton generation is not accurately replicated, there is still value in reflecting these features. This approach aims to expand the recognized behavioral range of pets, allowing for accurate modeling and prediction of pet behavior in various environments.
The main contributions of this research are as follows.
- Improving the accuracy and reliability of behavior prediction through efficient preprocessing and integration for predicting complex behaviors of pets.
- Exploring the possibility of enhancing behavior prediction by addressing existing missing data issues through the S2GAN-based synthesis of heterogeneous data.
- Demonstrating the practicality of the proposed method by applying it to data collected in real-world environments.
This study will prompt a re-evaluation of existing approaches in the field of pet behavior prediction and contribute to the development of more precise and effective prediction models. In addition, it will lay an important foundation for advancing related research and improving pet welfare.
The remainder of this article is structured as follows: Section 2 reviews the related research in the field of pet behavior prediction and explains the background and necessity of this study. Section 3 details the principles of pet behavior prediction via the proposed S2GAN-based heterogeneous data synthesis method and discusses the design and implementation process of the developed behavior prediction method. In Section 4, through experimental results and analysis, we prove the effectiveness of our method. Finally, Section 5 discusses the implications and limitations of our research findings and proposes future research directions.
2. Related Works
2.1. Data Synthesis for Behavior Prediction
Data synthesis is the creation of artificial data with statistical features similar to the original data. It is a valuable method for improving the performance of deep-learning-based models by addressing the limitations and biases in the original data [].
The role of data synthesis in the field of behavior prediction is very important. By artificially generating data that is difficult to obtain in real situations, data synthesis provides various scenarios necessary for model training. Especially, when collecting behavior data is difficult due to ethical or practical constraints, data synthesis helps overcome these limitations.
Therefore, research on data synthesis is currently being conducted for various targets of behavior monitoring and under different environments. Wang et al. introduced a SensoryGAN to generate training data and address the challenge of collecting real data for human behavior monitoring based on wearable sensors []. They explored a neural network structure optimized for each behavior for the generator and discriminator using a 1D-CNN (Convolution Neural Network) layer and bidirectional LSTM (Long Short Term Memory) layer for actions. Yan et al. proposed a method for generating sequences of joint movements from a single static image [].
Research on the synthesis of data for pets is significantly less prevalent than that for humans. Several existing studies have aimed to overcome the issue of insufficient data, particularly for pose estimation. Mu et al. proposed a novel consistency-constrained semi-supervised learning method that uses both spatial and temporal consistencies, enabling accurate keypoint predictions for real images without image labeling []. Deane et al. also addressed the challenge of missing data by proposing a parametric canine model, DynaDog+T, for binary segmentation, which allows the creation of synthetic images for 2D/3D joint key points, silhouette maps, and part segmentation []. Moreover, there are studies on synthesizing data based on sensor data. Kim et al. proposed a TN (Text to Numerical)-GAN-based multidimensional time-series augmentation method to minimize data bias [].
Research in behavior prediction primarily uses GANs or diffusion models to synthesize video-based data, enhancing model accuracy and generalizability by diversifying the training datasets, thereby yielding reliable outcomes. However, most existing studies have focused on homogeneous data synthesis, such as modifying the appearance of images or generating data for specific actions using sensors []. While useful for data augmentation, these approaches face limitations in multimodal behavior prediction, which requires the integration of various data sources.
The synthesis of heterogeneous data offers the potential to maximize the advantages of multimodal learning and use complementary information provided by different data types. However, applications in the behavior prediction or recognition field are still rare, particularly studies targeting pets. Research in this area is still in its early stages, and further studies are warranted to develop specific methodologies and models that can effectively combine heterogeneous data to improve prediction accuracy.
2.2. Behavior Prediction
In behavior prediction research, studies have typically been conducted with humans as the primary subjects. Human behavior is predicted using homogeneous data, where similar types of data are combined, and heterogeneous data, where different types of data are combined []. Video and sensor data are integrated and used as heterogeneous data. For example, Tavakoli et al. used heterogeneous data from in-car cameras and driver’s wearable devices and used machine learning algorithms such as random forest to recognize driver activities such as using the phone, eating, crossing intersections, and highway driving []. Ranieri et al. proposed an indoor action recognition method for the elderly using the RGB-D camera images captured by a humanoid robot, wearable inertial sensors, and surrounding sensors attached to items inside a home []. Hafeez et al. [] proposed a system that effectively detects human falls and daily activities using wearable accelerometers and video data collected by cameras directly worn on the body. These studies based on heterogeneous data addressed quality issues inherent in homogeneous data and demonstrated excellent prediction performance.
Research on behavior prediction of pets predominantly utilizes homogeneous data. Video data used for predicting the behavior of pets are obtained from cameras attached to specific locations. Bleuer-Elsner et al. mounted cameras on the ceiling of their experimental space to automatically identify dogs exhibiting attention-deficit hyperactivity disorder behavior []. Chen et al. predicted six behavior patterns, including walking, sitting, sleeping, and eating, using Yolov3-based extraction []. Moreover, research on predicting behavior through pose estimation is being conducted. Methods have been proposed that use depth cameras or deep-learning techniques to estimate poses from regular RGB images [,].
Sensor-based research typically involves collecting behavioral data using wearable devices. Accelerometers and gyroscope sensors are commonly used for activity measurement. Multisensor data, collected through wearable devices or sensors installed in the environment, offer the advantage of being able to monitor pets’ physical activities, location, and even physiological states in real time. Aich et al. proposed a method for recognizing the behavior and emotions of dogs by attaching sensors to their neck and tail to collect data []. Kumpulainen et al. attached sensors to different parts—one on the neck and the other on the harness—utilizing accelerometers and gyroscope sensors to predict behavior [].
Research on pet behavior prediction has mostly focused on multisensor data rather than video data []. This approach focuses on analyzing and predicting pets’ movements or activity patterns based on data collected from sensors. However, relying solely on a multisensor-based approach may face certain limitations in comprehensively understanding and predicting pets’ behavior and emotional states. Although sensor data can provide information about pets’ physical activities, they may lack the ability to capture the visual aspects of behavior or situational context. For example, the emotional states of pets, such as stress or joy, can be more accurately analyzed through video data. Therefore, for effective pet behavior prediction, it is necessary to utilize a comprehensive approach that integrates various types of data.
Unlike human behavior prediction, the behavior patterns of pets are irregular and anomalous. Particularly, the poses of small animals involve short distances between joints, and sensor values and joint coordinates change rapidly over brief periods. These characteristics imply that the same behavior can appear differently in humans. Although research on behavior recognition using heterogeneous data is actively being conducted with a focus on humans, applying methodologies developed for humans to pets may be inappropriate. In addition, unpredictable movements can frequently lead to missing data, which may decrease the accuracy of pet behavior prediction. Thus, there is a need for new prediction models that consider the unique behavioral characteristics of pets. Our proposed behavior prediction method was designed to meet these new requirements by integrating various data sources, enabling accurate prediction of pet behavior.
2.3. Comparison with Previous Works
Table 1 summarizes and compares existing studies based on data utilized, the algorithm of behavior prediction models, and the number of predicted behavior patterns. Research targeting pets is particularly challenging due to various constraints on data collection, such as pet stress, data collection spaces, and efforts to capture diverse behavior patterns. Especially, behaviors that occur with a low frequency are difficult to detect due to data imbalance, leading to a limited number of behaviors predicted in most studies. Collecting heterogeneous data is even more challenging because of the need for temporal synchronization and integration of data from different sources.
Among the existing research on pets that use heterogeneous data, studies that incorporate both image data and sensor data include Ide et al. (2021) [] and Kim et al. (2022) []. The study in [] integrates sound data alongside image and sensor data, with a focus on predicting the behavior of rescue dogs. This research has limitations in that the video data annotated with sensor data are also limited.
The study in [] focused on behavior prediction using heterogeneous data, which integrates areas detected from video footage with accelerometer and gyroscope data collected from wearable devices, demonstrating the potential to enhance prediction accuracy by integrating various data sources. However, installing cameras in every location where pet data are collected, such as homes, can raise cost issues and privacy concerns for pet owners. This often leads to missing video data, highlighting the need for innovative solutions to address these challenges.
This paper proposes an enhanced behavior prediction method using heterogeneous data, building on insights from previous research. The biggest issue with utilizing heterogeneous data is the problem of missing data during the collection process, which occurs more frequently in video data with a limited collection radius. Therefore, by synthesizing the features of the skeleton based on sensor data, we aim to address this issue and improve the performance of pet behavior prediction models.

Table 1.
Comparison with related studies.
Table 1.
Comparison with related studies.
| Research | Image Data | Sensor Data | Algorithms | Number of Behaviors | |||
|---|---|---|---|---|---|---|---|
| RGB | RGB + Skeleton | Acc | Gyro | Mag | |||
| Wang et al. (2022) [] | O | LSTM | 8 | ||||
| Hussain et al. (2022) [] | O | O | CNN | 10 | |||
| Kim et al. (2023) [] | O | O | O | TNGAN, CNN–LSTM | 9 | ||
| Ide et al. (2021) [] | O | O | O | CNN, LSTM | 11 | ||
| Chen et al. (2021) [] | O | Yolov3 | 6 | ||||
| Yu et al. (2022) [] | O | Videopose3D | 1 | ||||
| Lee et al. (2021) [] | O | TRT-Net | 7 | ||||
| Kim et al. (2022) [] | O | O | O | CNN–LSTM | 7 | ||
| Proposed Method | O | O | O | O | O | GAN, CNN–LSTM | 9 |
3. Pet Behavior Prediction via S2GAN-based Data Synthesis
Herein, we introduce a new method for pet behavior prediction via data synthesis based on the S2GAN model. We aim to achieve precise behavior prediction in real-life environments, focusing on the typical living conditions of pets in Korea and using CCTV and wearable devices commonly used for observing behavior. We simulated an indoor domestic space where pets primarily reside and used one CCTV and one wearable device, as shown in Figure 1. To address the issue of differing data collection ranges between these devices, S2GAN-based data synthesis was performed to compensate for any potential data loss, thereby ensuring high performance.
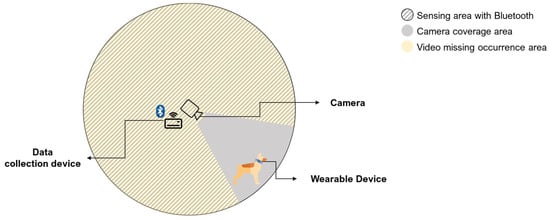
Figure 1.
Simulation research environment: Indoor space primarily inhabited by pets.
The behavior prediction process is divided into four main stages, as shown in Figure 2. The first stage is data collection, where video data from CCTV and nine-axis-sensor (accelerometer, gyroscope, and magnetometer) data from wearable devices are gathered to capture the behavior of pets. In the second stage, namely data preprocessing, the collected data are processed to transform it into a format suitable for model training. This involves extracting the joints of pets from the video data and normalizing the sensor data to create sequences. The third stage is data synthesis, where, in cases of video data loss due to sensor data being collected outside the CCTV’s range, S2GAN-based data synthesis is performed to create fake skeleton feature sequences. In the final stage, existing data and synthesized data are combined to perform behavior prediction using a CNN–LSTM-based network. This model predicts the following nine behaviors: Standing on Two Legs, Standing on All Fours, Sitting on Two Legs, Sitting on All Fours, Lying Down, Lying, Walking, Sniffing, and Eating.
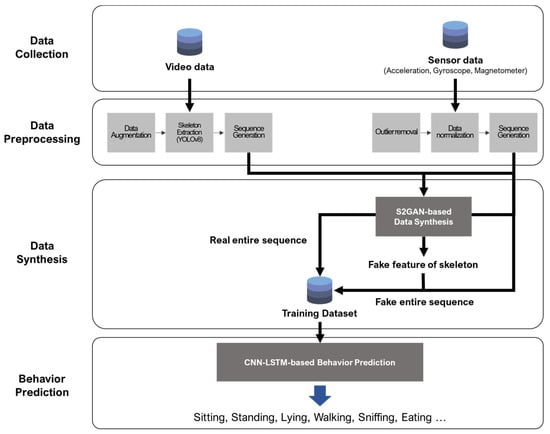
Figure 2.
Overall process of pet behavior prediction via S2GAN-based data synthesis.
3.1. Data Collection
Data collection focused on behaviors occurring in indoor environments such as homes. To ensure smooth data collection, the setup was configured to enable data gathering from a webcam for CCTV and wearable devices around the data collection device through communication. During data collection, the pet may or may not be within the camera’s capturing radius. However, it is assumed that the sensor data are collected without missing values. Herein, data related to the natural behaviors of pets were collected to predict pet behavior. Therefore, behaviors such as petting or touching the dog during filming are allowed unless it significantly disturbs the collar. However, in the case of data bias and shortage of data for specific behaviors, actions that can be induced through training (such as sitting and lying down) are permitted.
Pets exhibit various behaviors depending on their surroundings and interactions. Representative actions must be selected for monitoring pet behaviors to mitigate the individual differences in common behaviors among pets. Stephan et al. investigated the impact of factors such as breed, gender, and neutering status on pet behavior when left alone at home []. Their analysis of 77 pets revealed passive and low-activity levels in the absence of their owners. Therefore, pet behaviors in an indoor environment are monitored herein, emphasizing low-activity postures and behaviors such as walking and sniffing.
This paper selects and defines nine representative behaviors based on previous studies, as shown in Table 2. The duration of each behavior can vary significantly. Some behaviors occur instantaneously and conclude quickly, while others persist for relatively longer periods. To enable the model to effectively learn and reflect this diversity of behaviors, it is necessary to establish a uniform sequence length that can encompass all types of actions. Accordingly, by considering the minimum and maximum durations of behaviors with short durations (e.g., shaking, scratching, fluffing, and barking) and those with long durations (e.g., walking, sniffing, and eating/chewing), the sequence length was set to 3 s.
Table 2.
Predicted pet behaviors and descriptions.
All video and sensor data were stored and managed based on the starting time of the behavior. Video data were saved with the name of the pet targeted for prediction, video file name, start time, and end time of the video. Sensor data were saved with the name of the pet targeted for prediction and the MAC (Media Access Control) address of the wearable device and collected three-axis accelerometer data, three-axis gyroscope data, three-axis magnetometer data, and time. Because sensor data were collected at 50 Hz, all data were synchronized based on microseconds.
3.2. Data Preprocessing
3.2.1. Video Preprocessing
The collected videos underwent preprocessing for data synthesis and behavior prediction. The video data were preprocessed in the following order: data augmentation, skeleton extraction, and sequence generation.
First, data augmentation was performed to enable the model to learn various behavior patterns. Owing to the varied installation locations of CCTVs by different users, augmentation processes that consider these differences and deal with motion blur from fast-moving pets were required. Therefore, augmentations through horizontal flipping, rotation, and blurring were performed to ensure consistent performance across various situations.
Subsequently, pose estimation was performed using a you only look once version 8 (YOLOv8)-based pose estimator. YOLOv8 is an AI framework that supports various computer vision tasks, such as detection, segmentation, and classification []. While there are options such as DeepLabCut [] and DeepPoseKit [] for pet-pose estimation, they generally exhibit slower training speeds and are slightly less robust to variations in different environments. YOLOv8, with improved accuracy and speed compared with previous versions of the YOLO series, has gained prominence in recent studies []. Therefore, we performed pose estimation using the YOLOv8 model. The extracted joint coordinates were categorized into major sections—head, torso, front legs, and hind legs—constituting a total of 24 points (Figure 3).
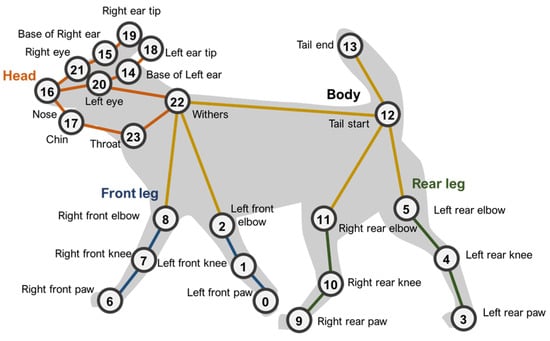
Figure 3.
Key points used for skeleton extraction.
Finally, data sequences were generated using time windows set to 3 s intervals. Each time window was designed to overlap 50% of the next, ensuring continuity in the time-series data and minimizing information loss. Each sequence includes 20 frames, each containing the x and y coordinates of the joints. Consequently, the dimensions of the data sequence are structured as (sequence length, number of frames, number of joints, 2), where 2 denotes the x and y coordinates for each joint; this structure was specifically designed to effectively capture the visual characteristics of behavioral patterns.
3.2.2. Sensor Preprocessing
Sensor data were preprocessed via outlier removal, data normalization, interpolation, and the creation of sensor data sequences.
Outlier removal involves excluding values that significantly deviate from the observed range. Including such values in training can lead to suboptimal performance, for which the interquartile range was employed.
To ensure uniform scaling of the data, normalization was performed. When conducting deep-learning-based training using numerical data, the data must be normalized because a wide distribution and range can make predictions difficult. Noise may be present after outlier removal; therefore, the Z-Score normalization method was used as it was less affected by outliers.
Next, interpolation was performed for some missing values that occurred for various reasons. Interpolation was performed when less than 20% of the data were missing in the sequence length based on the 3 s standard in the entire collected data. A cubic interpolation method was used for this purpose. The method interpolates the data using a cubic polynomial between two data points, better reflecting the trend of the time series than linear or quadratic methods.
Finally, similar to video preprocessing, sequence generation also applied a sliding window with 3 s intervals and 50% overlapping. Consequently, the dimension of the sequence was configured as (sequence length, 3, 3), where the first “3” denotes the three sensors: accelerometer, gyroscope, and magnetometer, and the last “3” represents the x, y, and z axes.
3.3. S2GAN-Based Data Synthesis
S2GAN-based data synthesis (Figure 4) was performed when pets moved out of the camera’s capturing range or when skeleton extraction failed. The S2GAN model has two key components: a generator and a discriminator. The generator receives sensor sequence data and action class labels as inputs to synthesize fake skeleton features to supplement the real data, filling in missing parts of the dataset.
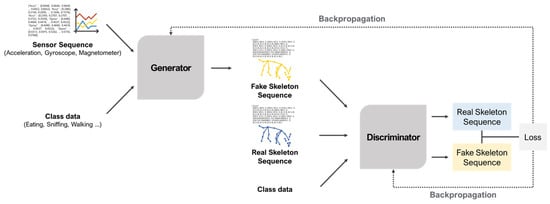
Figure 4.
S2GAN-based data synthesis process.
Meanwhile, the discriminator distinguishes between the fake data produced by the generator and the real data. Throughout the training process, the discriminator learns to discern authenticity while the generator progressively improves and crafts sophisticated fake data to deceive the discriminator.
Figure 5 shows the generator and discriminator structures. The generator takes in preprocessed sensor sequence data and one-hot encoded class labels to generate x and y coordinates for skeleton points within a 2D image. To match the shape of the incoming sequence data, class data are processed through a dense layer and concatenated based on their features. The structure is designed such that while it comprises the same layers, the x and y coordinates are processed separately and concatenated toward the end. This arrangement necessitates passing through two instances of time-distributed convolution 2D transpose layers and one convolution LSTM 2D layer to ensure spatial consistency and temporal continuity across all frames.
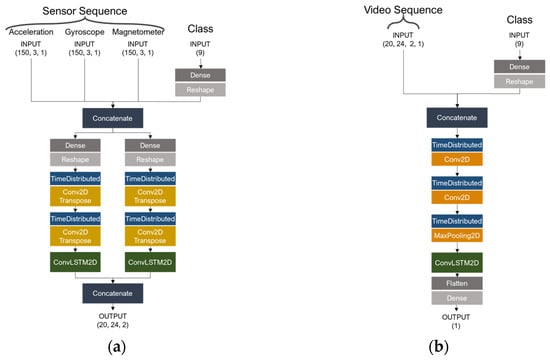
Figure 5.
S2GAN-based data synthesis network structure. (a) Represents the generator, and (b) represents the discriminator.
The discriminator receives real and fake video sequences and class labels as inputs to determine the authenticity of the given video sequence. Similar to the generator, class data are processed through a dense layer to conform to the shape of the incoming sequence data and concatenated with the video sequences based on their features. The network subsequently passes through two time-distributed convolution 2D layers and one max-pooling 2D layer, thereby reducing dimensions and distilling features. Finally, the convolutional LSTM 2D layer considers features at each timestep through convolutional operations, extracting refined features in a reduced dimension. The process culminates in a dense layer with a sigmoid activation function, outputting the probability of the input video sequence being real or fake.
3.4. Pet Behavior Prediction
Real and fake data are used to predict pet behavior. The network model structure for behavior prediction includes a CNN–LSTM hybrid model (Figure 6), which is systematically segmented into three principal components: (1) a section dedicated to feature extraction through convolutional processes, which effectively captures spatial features; (2) a section that leverages LSTM to analyze temporal sequences, thereby preserving the continuity and dynamics of behavioral patterns over time; and (3) a final integration section, which combines the spatial and temporal features for accurate behavior prediction. This integration ensures that video and sensor data are processed in their respective streams before being fused, enhancing the ability of the model to make informed predictions based on a multimodal dataset.
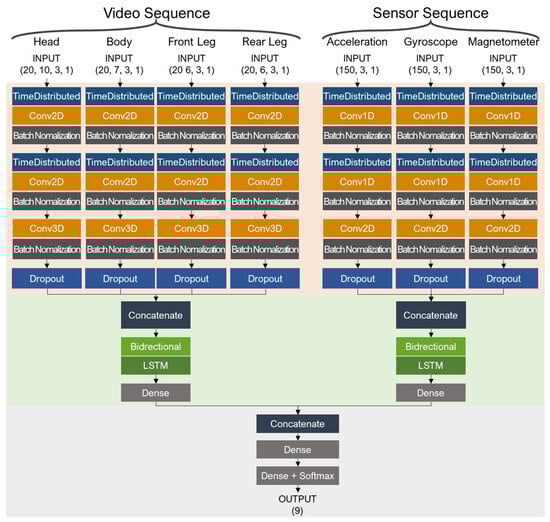
Figure 6.
Behavior prediction network architecture.
Video data consists of preprocessed sequences for the head, body, front legs, and rear legs, which are fed into the model as separate streams. Within each stream, time-distributed 2D convolutional layers are applied twice to extract features of the joints. Subsequently, a 3D convolutional layer is applied, which performs convolutions across the time series, joint locations, and x/y coordinates, designed to reduce all dimensions except for the time series to a size of one. This dimensionality reduction is intended for input into the LSTM layer. Following each convolutional operation, the ReLU activation function and batch normalization are applied, normalizing the input data and stabilizing the learning process. The final stage of the convolutional operations includes a dropout at a rate of 0.5 to prevent overfitting. The data processed for the head, body, front legs, and rear legs are then concatenated and fed into the bidirectional LSTM layer. This bidirectional LSTM processes sequences in forward and reverse directions, considering the context before and after each point in time, effectively extracting behavior patterns.
In the case of sensor data, the accelerometer, gyroscope, and magnetometer data were combined and concurrently input into the model. The overall process parallels that of video data handling; however, due to sensor data having one less dimension compared to video data, time-distributed 1D convolutional and 2D convolutional operations are conducted instead. All the steps, including dropout and LSTM, were performed similarly to those of the video sequence data.
The extracted features from the video sequence data and sensor sequence data were first processed through a dense layer with 32 hidden units and then concatenated to combine their features. Following this, the combined features were passed through two additional dense layers and a softmax activation function to output the probabilities of the behaviors represented by the sequences.
4. Experiment
The experiments in this paper were designed to evaluate the efficiency and accuracy of pet behavior prediction through S2GAN-based data synthesis. The experimental setup constructed for this purpose is described in Table 3.
Table 3.
Experimental environment specifications.
4.1. Data Collection Tools and Collected Dataset
To facilitate smooth data collection, a kit consisting of a webcam for CCTV, wearable devices, and a data collection device was assembled. The CCTV webcam used is the ABKO APC930 model, capturing data at FHD (1920 × 1080) resolution at 20 FPS. Since the goal of this paper is to apply the setup in real environments, the position or shooting angle of the webcam was not fixed. To ensure effective joint extraction from the video, the entire body of the pet was recorded within a 3 m radius. The wearable device was custom-made, consisting of Maxim’s MAX32670 board and an ICM-20948 IMU sensor, collecting accelerometer, gyroscope, and magnetometer data at 50 Hz. Finally, as shown in Figure 7a, the board was mounted inside a 3D-printed case and attached to a collar, weighing approximately 28 g with dimensions of approximately 40 × 15 × 10 mm3.
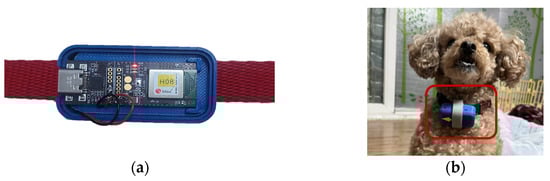
Figure 7.
Custom-made wearable device for the pet. (a) Wearable device board; (b) actual appearance of a dog wearing the device.
The data collection device was a tool designed to synchronize and process video and sensor data based on time. As shown in Figure 8, the Odroid-N2+ board produced by Hard Kernel was used in this study. An application installed on the data collection device enabled users to start and stop data collection. Upon completion of data collection, an environment was established to store the data in a database connected to a server.
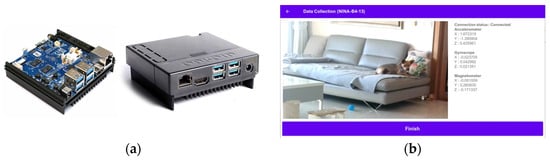
Figure 8.
Odroid-N2+ board and the application of data collection devices: (a) Odroid-N2+ board produced by Hard Kernel and (b) screen showing data collection.
Participants were recruited to collect pet behavior data; to ensure that data could be collected in an environment similar to real-life settings, instructions for setting up and using the data collection device, CCTV, and wearable devices were provided to the participant.
Ultimately, data were collected from 10 dogs (Table 4). During the data collection process, instances where a part of a human body appeared in the frame or only a part of the pet was captured, preventing skeleton extraction, were excluded. The number of actions collected for each behavior is listed in Table 5.
Table 4.
List of dogs that participated in the experiment.
Table 5.
Amount of data per behavior used in the experiment.
4.2. Results of Data Preprocessing
4.2.1. Video Preprocessing
Video data preprocessing involved creating sequences of x and y coordinates where the skeleton was extracted in each frame. To improve the accuracy of skeleton extraction, open datasets, such as the StandardExtra dataset [] and the Animal Pose dataset [], were used for dog-pose estimation. The Stanford extra dataset is labeled for joint coordinates using the Stanford dogs dataset containing images of over 120 breeds. The animal pose dataset provides joint coordinates for dogs, cats, cows, horses, and sheep; herein, only data for dogs were extracted. The number of data points used for dog detection is shown in Table 6.
Table 6.
Number of utilized data points in image data preprocessing.
For skeleton extraction, the YOLOv8 model adopted herein was differentiated by size into nano (n), small (s), medium (m), large (l), and extra-large (x) variants. Using the prepared dog-pose dataset, training was conducted on the m, l, and x models; the results are shown in Figure 9. With batch sizes of 16 and 100 epochs, the YOLOv8x model demonstrated the best performance across various scales and, thus, was selected. The results of pose estimation on a portion of the collected dataset using the trained YOLOv8x model are shown in Figure 10.
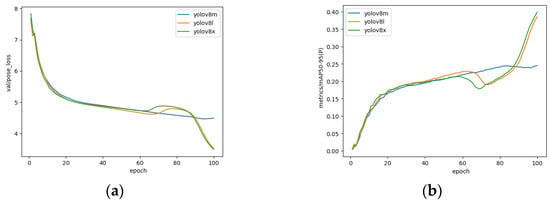
Figure 9.
Learning results by YOLOv8 model. (a) Represents the loss value for validation data, and (b) shows the performance results for mAP (mean Average Precision) at the 50–95 range.
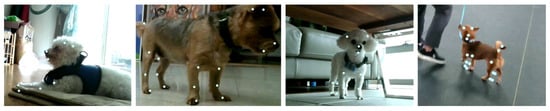
Figure 10.
Some examples of the skeleton extracted through YOLOv8x model.
4.2.2. Sensor Preprocessing
The preprocessing of sensor data involved outlier removal and normalization. Figure 11 shows the distributions of the original data (a) and the preprocessed data (b). Subsequently, cubic interpolation was performed only in cases where continuous missing data occurred for less than 20% of the sequence length based on 3 s. Based on this, sequences were generated.
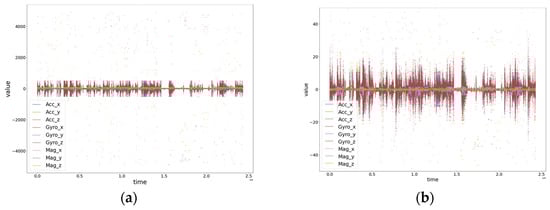
Figure 11.
Comparison of original data vs. preprocessed data distribution. (a) Represents the original data, and (b) represents the preprocessed data.
4.3. Results of the Data Synthesis Experiment
Herein, data synthesis was conducted based on the previously proposed S2GAN model. Further, 2000 training iterations with a batch size of eight were employed, and the Adam optimization function was used for the generator and discriminator models.
Figure 12 illustrates the use of S2GAN to synthesize skeleton data for typical static and dynamic behaviors, ‘Standing on All Fours’ and ‘Sniffing’, compared against real skeleton data. As shown in the resulting images, changes in behavior over time are distinctly represented for each specific action. Although the forms of the skeletons are not fully depicted, which might suggest difficulty in representing subtle movements, the joint coordinates reveal that while static behaviors show no change in position over time, dynamic behaviors exhibit some variations.
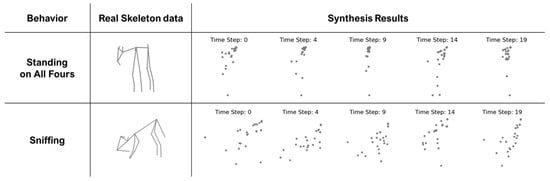
Figure 12.
Comparison between the synthesized results and the actual skeleton data for the behaviors ‘Standing on All Fours’ and ‘Sniffing’.
These results suggest that, although not perfect, the sensor data has the potential to replicate skeleton features. The arrangement of points at each time step indicates that the model is somewhat effective in recognizing the posture characteristics associated with each behavior. The potential for future improvements through more refined skeleton datasets, enhanced model architecture, and adjusted learning parameters is evident.
4.4. Results of the Behavior Prediction Experiment
Due to the lack of a clear benchmark for absolute performance and the absence of research on GAN models using heterogeneous data, especially video and sensor data, the impact of synthesizing heterogeneous data using the S2GAN model on the accuracy of pet behavior prediction was evaluated.
For this purpose, the data were divided into six dataset types: 100% real data, 50% real data, 50% synthesized data +50% real data, 30% synthesized data +70% real data, only 100% video data, and only 100% sensor data. This approach was devised to evaluate the synthetic data’s contribution to enhancing the model’s predictive accuracy.
For the experiment, the training, validation, and test datasets for each of the six datasets were divided with a ratio of 7:2:1. Hyperparameter settings included a batch size of 16 using categorical cross entropy as the loss function, Adam as the optimization function, a learning rate of 0.001, and 100 epochs.
Table 7 presents the experimental results according to the dataset used, displaying metrics such as Accuracy, Precision, Recall, and F1-Score. The best performance was observed when using 100% real data. Compared to the results from 50% real data, it was found that the performance improved as the proportion of real data increased, highlighting the positive impact of real data on the model’s learning capabilities. Meanwhile, the results from using synthesized data, although slightly lower, did not significantly differ from those obtained with the 100% real dataset.
Table 7.
Performance metrics with varying proportions of real and synthetic data.
In essence, the results obtained from this experiment confirm that the approach of synthesizing video skeleton features from sensor data using S2GAN can adequately replace the missing data. Herein, we demonstrate the potential of synthetic data to supplement actual data and present a new methodology to overcome the limitations of datasets arising potentially because of missing information.
To verify the efficacy of the proposed method, experiments were conducted using confusion matrices to analyze behavior prediction results from datasets comprising (a) only video data, (b) only sensor data, (c) 100% real data, and (d) a combination of 70% real and 30% synthetic data (Figure 13).
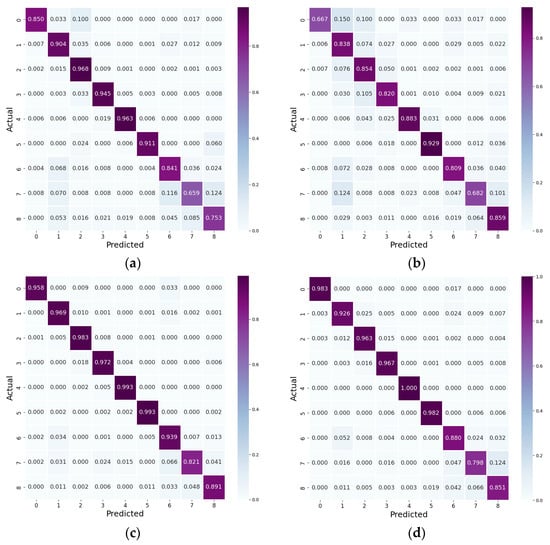
Figure 13.
Confusion matrix for behavior prediction results. (a) Represents 100% real video data only, (b) represents 100% real sensor data only, (c) represents 100% real data, and (d) represents 70% real data + 30% synthetic data.
First, a notable difference in the recognition of behaviors was observed while using video and sensor data independently. The video data revealed proficient prediction for behaviors 2, 3, 4, and 5, which are typically associated with less movement in pets, attributable to motion blur affecting the extraction of accurate skeleton coordinates. Moreover, sensor data usually yielded lower results than video data, with particularly poor recognition of behavior 0. Behaviors 7 and 8—often confused with behavior 1 due to similar sensor patterns—also demonstrated lower recognition rates, although sensor data were slightly better at capturing these behaviors than video data.
When analyzing the results from 100% real data, there was an overall improvement in the recognition of behaviors that were not well detected by either video or sensor data alone, highlighting the advantage of integrating heterogeneous data to enhance performance. Meanwhile, the dataset with 70% synthetic data and 30% real data showed partially lower rates than that with 100% real data but demonstrated a general improvement across all behaviors.
In summary, behavior prediction through data synthesis based on the proposed S2GAN model demonstrated that synthetic data can effectively address missing data issues within multimodal behavior prediction systems. This indicates that integrating synthetic data has the potential to significantly enhance the accuracy and reliability of behavior predictions.
5. Conclusions
Herein, we propose a method for predicting pet behavior by integrating video and sensor data through S2GAN-based data synthesis. The proposed method aims to improve prediction performance by addressing missing data due to differences in data collection ranges in heterogeneous data-based behavior prediction systems for dogs in real-life settings. We set up a system comprising commonly used CCTVs, pet wearable devices, and a data collection device to gather everyday behavior data from 10 dogs within their actual home environments. The video data were processed to extract the movements of the pets’ joints, while the sensor data were normalized after noise removal to form sequences. Using the proposed S2GAN-based data synthesis method, missing video data were supplemented by inputting the corresponding sensor data to extract the features of the pet’s skeleton, followed by behavior prediction using a CNN–LSTM-based model.
Using the proposed S2GAN-based data synthesis method, missing video data were supplemented by inputting the corresponding sensor data to extract pet skeleton coordinates, followed by behavior prediction using a CNN–LSTM-based model.
Experimental results demonstrate the potential of synthetic data in effectively replacing missing data, thereby proving the possibility of enhancing the performance of pet behavior prediction models. This study offers a valuable methodology for supplementing missing data and improving model predictability, especially in situations where missing data poses a problem. The significance of our experiment lies in the fact that the data were collected not in a standardized laboratory environment but directly from the pets’ actual living environments, namely their owners’ homes. This significantly enhances the practicality and applicability of this research, allowing for the acquisition of data that more accurately reflect the behavior of pets in real-life situations. Data collected in real-life environments capture the natural behavior patterns of pets more reliably and can increase the accuracy of predictions when applied to a model.
However, a limitation of this study is the potential bias in the collected pet behavior data due to variations in behavior data among individual pets. Although efforts were employed to address this via preprocessing and data composition during the training process, additional data collection for behaviors with limited samples could further enhance the model performance. In addition, the performance can be sufficiently improved with the skeleton prediction accuracy. Herein, because of the limited skeleton dataset, comprehensive learning could not be fully achieved. Nevertheless, if the extraction of skeletons is further enhanced in the future, synthesizing accurate skeleton features will be possible, further enhancing performance.
The behavior prediction method can be extended to future research on abnormal behavior detection. Thus, more detailed behavior recognition will be achieved by augmenting the currently collected joint coordinates. Additionally, our goal is to integrate this research with veterinary medicine to diagnose or predict diseases in pets. Continuous exploration of methods to improve the performance of behavior prediction is also part of future research.
Author Contributions
Conceptualization, J.K. and N.M.; methodology, J.K. and N.M.; software, J.K.; validation, J.K. and N.M.; formal analysis, J.K. and N.M.; investigation, J.K. and N.M.; resources, J.K. and N.M.; data curation, J.K. and N.M.; writing—original draft preparation, J.K.; writing—review and editing, J.K. and N.M.; visualization, J.K.; supervision, N.M.; project administration, N.M.; funding acquisition, N.M. All authors have read and agreed to the published version of the manuscript.
Funding
This research was supported by the National Research Foundation of Korea (NRF) grant funded by the Korean government (MSIT) (No. 2021R1A2C2011966).
Institutional Review Board Statement
The animal study protocol was approved by the Institutional Animal Care and Use Committee of Hoseo University IACUC (protocol code: HSUIACUC-22-006(2)).
Informed Consent Statement
Not applicable.
Data Availability Statement
The data presented in this study are available on request from the corresponding author due to privacy and ethical concerns.
Conflicts of Interest
The authors declare no conflicts of interest.
References
- Alshamrani, M. IoT and artificial intelligence implementations for remote healthcare monitoring systems: A survey. J. King Saud Univ.-Comput. Inf. Sci. 2022, 34, 4687–4701. [Google Scholar] [CrossRef]
- Wang, H.; Atif, O.; Tian, J.; Lee, J.; Park, D.; Chung, Y. Multi-level hierarchical complex behavior monitoring system for dog psychological separation anxiety symptoms. Sensors 2022, 22, 1556. [Google Scholar] [CrossRef] [PubMed]
- Zhu, H.; Salgırlı, Y.; Can, P.; Atılgan, D.; Salah, A.A. Video-based estimation of pain indicators in dogs. In Proceedings of the 2023 11th International Conference on Affective Computing and Intelligent Interaction (ACII), Cambridge, MA, USA, 10–13 September 2023; pp. 1–8. [Google Scholar]
- Mao, A.; Huang, E.; Wang, X.; Liu, K. Deep learning-based animal activity recognition with wearable sensors: Overview, challenges, and future directions. Comput. Electron. Agric. 2023, 211, 108043. [Google Scholar] [CrossRef]
- Chen, R.C.; Saravanarajan, V.S.; Hung, H.T. Monitoring the behaviours of pet cat based on YOLO model and raspberry Pi. Int. J. Appl. Sci. Eng. 2021, 18, 1–12. [Google Scholar] [CrossRef]
- Bleuer-Elsner, S.; Zamansky, A.; Fux, A.; Kaplun, D.; Romanov, S.; Sinitca, A.; van der Linden, D. Computational analysis of movement patterns of dogs with ADHD-like behavior. Animals 2019, 9, 1140. [Google Scholar] [CrossRef] [PubMed]
- Unold, O.; Nikodem, M.; Piasecki, M.; Szyc, K.; Maciejewski, H.; Bawiec, M.; Zdunek, M. IoT-based cow health monitoring system. In Proceedings of the International Conference on Computational Science, Lecture Notes in Computer Science; Springer: Cham, Switzerland, 2020; Volume 12141, pp. 344–356. [Google Scholar]
- Dang, L.M.; Min, K.; Wang, H.; Piran, M.J.; Lee, C.H.; Moon, H. Sensor-based and vision-based human activity recognition: A comprehensive survey. Pattern Recognit. 2020, 108, 107561. [Google Scholar] [CrossRef]
- Kim, J.; Moon, N. Dog behavior recognition based on multimodal data from a camera and wearable device. Appl. Sci. 2022, 12, 3199. [Google Scholar] [CrossRef]
- Wen, Q.; Sun, L.; Yang, F.; Song, X.; Gao, J.; Wang, X.; Xu, H. Time series data augmentation for deep learning: A survey. arXiv 2020, arXiv:2002.12478. [Google Scholar]
- Wang, J.; Chen, Y.; Gu, Y.; Xiao, Y.; Pan, H. Sensorygans: An effective generative adversarial framework for sensor-based human activity recognition. In Proceedings of the 2018 International Joint Conference on Neural Networks (IJCNN), Rio de Janeiro, Brazil, 8–13 July 2018; pp. 1–8. [Google Scholar]
- Yan, Y.; Xu, J.; Ni, B.; Zhang, W.; Yang, X. Skeleton-aided articulated motion generation. In Proceedings of the 25th ACM International Conference on Multimedia, Mountain View, CA, USA, 23–27 October 2017; pp. 199–207. [Google Scholar]
- Mu, J.; Qiu, W.; Hager, G.D.; Yuille, A.L. Learning from synthetic animals. In Proceedings of the IEEE/CVF Conference on Computer Vision and Pattern Recognition, Seattle, WA, USA, 13–19 June 2020; pp. 12386–12395. [Google Scholar]
- Deane, J.; Kearney, S.; Kim, K.I.; Cosker, D. DynaDog+ T: A parametric animal model for synthetic canine image generation. arXiv 2021, arXiv:2107.07330. [Google Scholar]
- Kim, H.; Moon, N. TN-GAN-Based Pet Behavior Prediction through Multiple-Dimension Time-Series Augmentation. Sensors 2023, 23, 4157. [Google Scholar] [CrossRef] [PubMed]
- Gu, F.; Chung, M.H.; Chignell, M.; Valaee, S.; Zhou, B.; Liu, X. A survey on deep learning for human activity recognition. ACM Comput. Surv. CSUR 2021, 54, 1–34. [Google Scholar] [CrossRef]
- Yadav, S.K.; Tiwari, K.; Pandey, H.M.; Akbar, S.A. A review of multimodal human activity recognition with special emphasis on classification, applications, challenges and future directions. Knowl.-Based Syst. 2021, 223, 106970. [Google Scholar] [CrossRef]
- Tavakoli, A.; Kumar, S.; Boukhechba, M.; Heydarian, A. Driver state and behavior detection through smart wearables. In Proceedings of the 2021 IEEE Intelligent Vehicles Symposium (IV), Nagoya, Japan, 11–17 July 2021; pp. 559–565. [Google Scholar]
- Ranieri, C.M.; MacLeod, S.; Dragone, M.; Vargas, P.A.; Romero, R.A.F. Activity recognition for ambient assisted living with videos, inertial units and ambient sensors. Sensors 2021, 21, 768. [Google Scholar] [CrossRef] [PubMed]
- Hafeez, S.; Alotaibi, S.S.; Alazeb, A.; Al Mudawi, N.; Kim, W. Multi-sensor-based Action Monitoring and Recognition via Hybrid Descriptors and Logistic Regression. IEEE Access 2023, 11, 48145–48157. [Google Scholar] [CrossRef]
- Mathis, A.; Mamidanna, P.; Cury, K.M.; Abe, T.; Murthy, V.N.; Mathis, M.W.; Bethge, M. DeepLabCut: Markerless pose estimation of user-defined body parts with deep learning. Nat. Neurosci. 2018, 21, 1281–1289. [Google Scholar] [CrossRef] [PubMed]
- Graving, J.M.; Chae, D.; Naik, H.; Li, L.; Koger, B.; Costelloe, B.R.; Couzin, I.D. DeepPoseKit, a software toolkit for fast and robust animal pose estimation using deep learning. eLife 2019, 8, e47994. [Google Scholar] [CrossRef] [PubMed]
- Aich, S.; Chakraborty, S.; Sim, J.S.; Jang, D.J.; Kim, H.C. The design of an automated system for the analysis of the activity and emotional patterns of dogs with wearable sensors using machine learning. Appl. Sci. 2019, 9, 4938. [Google Scholar] [CrossRef]
- Kumpulainen, P.; Cardó, A.V.; Somppi, S.; Törnqvist, H.; Väätäjä, H.; Majaranta, P.; Gizatdinova, Y.; Antink, C.H.; Vehkaoja, A. Dog behaviour classification with movement sensors placed on the harness and the collar. Appl. Anim. Behav. Sci. 2021, 241, 105393. [Google Scholar] [CrossRef]
- Hussain, A.; Ali, S.; Kim, H.C. Activity detection for the wellbeing of dogs using wearable sensors based on deep learning. IEEE Access 2022, 10, 53153–53163. [Google Scholar] [CrossRef]
- Ide, Y.; Araki, T.; Hamada, R.; Ohno, K.; Yanai, K. Rescue dog action recognition by integrating ego-centric video, sound and sensor information. In Pattern Recognition. Proceedings of the ICPR International Workshops and Challenges, Lecture Notes in Computer Science, Virtual, 10–15 January 2021; Springer: Cham, Switzerland, 2021; Volume 12663, pp. 321–333. [Google Scholar]
- Yu, R.; Choi, Y. OkeyDoggy3D: A Mobile Application for Recognizing Stress-Related Behaviors in Companion Dogs Based on Three-Dimensional Pose Estimation through Deep Learning. Appl. Sci. 2022, 12, 8057. [Google Scholar] [CrossRef]
- Lee, H.J.; Ihm, S.Y.; Park, S.H.; Park, Y.H. An Analytic Method for Improving the Reliability of Models Based on a Histogram for Prediction of Companion Dogs’ Behaviors. Appl. Sci. 2021, 11, 11050. [Google Scholar] [CrossRef]
- Stephan, G.; Leidhold, J.; Hammerschmidt, K. Pet dogs home alone: A video-based study. Appl. Anim. Behav. Sci. 2021, 244, 105463. [Google Scholar] [CrossRef]
- Glenn, J. Ultralytics YOLOv8. 2023. Available online: https://github.com/ultralytics/ultralytics (accessed on 2 March 2023).
- Wang, S.; Zhang, X.; Ma, F.; Li, J.; Huang, Y. Single-Stage Pose Estimation and Joint Angle Extraction Method for Moving Human Body. Electronics 2023, 12, 4644. [Google Scholar] [CrossRef]
- Biggs, B.; Boyne, O.; Charles, J.; Fitzgibbon, A.; Cipolla, R. Who left the dogs out? 3d animal reconstruction with expectation maximization in the loop. In European Conference on Computer Vision (ECCV); Springer: Cham, Switzerland, 2020; pp. 195–211. [Google Scholar]
- Cao, J.; Tang, H.; Fang, H.S.; Shen, X.; Lu, C.; Tai, Y.W. Cross-domain adaptation for animal pose estimation. In Proceedings of the IEEE/CVF International Conference on Computer Vision (ICCV), Seoul, Republic of Korea, 27 October–2 November 2019; pp. 9498–9507. [Google Scholar]
Disclaimer/Publisher’s Note: The statements, opinions and data contained in all publications are solely those of the individual author(s) and contributor(s) and not of MDPI and/or the editor(s). MDPI and/or the editor(s) disclaim responsibility for any injury to people or property resulting from any ideas, methods, instructions or products referred to in the content. |
© 2024 by the authors. Licensee MDPI, Basel, Switzerland. This article is an open access article distributed under the terms and conditions of the Creative Commons Attribution (CC BY) license (https://creativecommons.org/licenses/by/4.0/).