
Experimental Study on Grouting Quality Detection in Prestressed Pipeline Based on Scattered Wave Method


1
China Construction Seventh Engineering Bureau Co., Ltd., Zhengzhou 450003, China
2
School of Water Conservancy and Transportation, Zhengzhou University, Zhengzhou 450001, China
*
Authors to whom correspondence should be addressed.
Buildings 2024, 14(5), 1402; https://doi.org/10.3390/buildings14051402
Submission received: 19 April 2024
/
Revised: 6 May 2024
/
Accepted: 11 May 2024
/
Published: 14 May 2024
(This article belongs to the Section Building Energy, Physics, Environment, and Systems)
Abstract
:The grouting quality of prestressed pipelines directly affects the safety and durability of prestressed reinforced concrete bridge structures, attracting wide attention from the engineering community. Based on the principles of the scattering wave method, this paper designs and manufactures a large-scale model to simulate the actual construction testing environment. Several sets of design defects with significantly distributed spans in the prestressing ducts were pre-set, and the Engineering Geophysical Instrument System–Pipeline Grouting Profile (EGS-PGP) equipment developed was used to detect the grouting quality of the prestressed pipelines under different conditions, obtaining the frequency attenuation values at defect locations. The study shows that stability of the peak frequency throughout the test can indicate compact grouting, while a large fluctuation in the peak frequency range with no regular changes can indicate non-compact grouting; a sudden increase or decrease in peak frequency can effectively indicate the location of grouting defects along the pipeline. The number of sudden changes in frequency can indicate the number of gaps inside the pipeline. The chirp signal, compared to the hammer impact signal, shows greater stability and engineering application value in detecting defects using the scatter wave method. This study provides technical support for the detection of grouting quality in prestressed pipelines based on chirp signals.
1. Introduction
There are nearly one million highway bridges and over 70 million meters of structures in China, leading to a significant demand for inspection and maintenance of in-service bridges [1]. Prestressed concrete bridges account for over 95% of the total [2]. Prestressed concrete structures, due to their high compressive strength, large fatigue resistance, light self-weight, strong crack resistance, and the ability to reduce the main tensile stress and shear force in flexural members, as well as to reduce the amount of concrete and steel reinforcement, have improved the durability and load capacity of reinforced concrete bridges. These advantages have led to the widespread application of prestressed concrete structures in large bridge constructions. In the process of prestressed beam fabrication, pipe grouting not only isolates prestressed steel from air to prevent corrosion but also generates good bonding with prestressed steel. Grouting transfers the structural load force through the slurry, increasing the stability of the structure, thereby enhancing the component’s crack resistance and load-bearing capacity. If air gaps or water ingress occur inside the pipes, prestressed steel can be corroded by water and air, leading to significant damage to the bond between the prestressed steel and concrete. When corrosion occurs, the expansion in the steel volume causes cracking of the surrounding concrete, causing separation of the upper and lower parts of the concrete, forming internal defects in the top steel mesh, resulting in a decrease in the bridge’s strength and posing a serious hazard to the prestressed system of the bridge [3,4,5]. Traditional destructive testing methods such as drilling and slicing not only damage the prestressed steel inside the pipeline but also incur high costs and have low efficiency. Non-destructive testing techniques have become a focal point in pipeline grouting quality inspection due to their advantages of non-destructiveness, compatibility, and dynamism [6].
Infrared thermography, as an emerging non-destructive testing method, captures subtle differences in material surface temperature and emissivity to transform these differences into intuitive thermal images. Maierhofer et al. [7] used thermography to inspect prestressed concrete beams, where heated prestressed tendons corresponded to the grouted areas with higher temperatures, and ungrouted areas had lower temperatures along the pipeline direction. However, this technique is limited to detecting only the surface layer of concrete and imposes stringent requirements on detection time and processes, making its practical application challenging. Tian et al. [8] applied the lead zirconate titanate (PZT) time reversal method to monitor grouting quality by assessing changes in peak values of time-reversed focusing signals. Jiang et al. [9] established a 2D finite element model for monitoring the density of prestressed pipeline grouting using piezoelectric ceramic sensors. By comparing voltage signals, power spectral density energy, and wavelet pack energy under different voltages, they estimated the grouting quality of prestressed pipelines. Liu et al. [10] utilized the finite element analysis software ANSYS 12.0 to establish a three-dimensional finite element model of pipeline corrosion defects, and analyzed the distribution rules of internal currents and induced magnetic fields in the pipeline under different defect volumes. Based on the frequency components of the excited signal, these methods analyze the interlayer medium properties between the two test points through spectral analysis, enabling the determination of internal defects in concrete beams. While effectively detecting defects in solid concrete, these methods remain highly sensitive to the burial depth of the prestressed pipelines and the material of the corrugated pipes.
To avoid the aforementioned issues, researchers have proposed non-destructive testing methods based on stress wave reflection and transmission theories, taking advantage of the characteristics where the speed, frequency, and other acoustic parameters of waves change when influenced by the type of medium [11,12]; Martin [13], Wang Shaoqiang [14], Hu [15], and Yang Changmin et al. [16] have each put forward some non-destructive testing methods based on stress wave reflection and transmission theories. Research results have shown that this method has a significant ability to detect the grouting quality of prestressed pipelines and, in conjunction with finite element software, to analyze the impact of different defect types on localization detection. Although non-destructive testing has been effective in both ultrasonic and impact-echo methods, providing a rough assessment of the grouting quality of prestressed ducts, the non-uniformity and multiphase nature of prestressed bridge materials, as well as the instability of the hammering signal, result in many defects in enhancing and extracting weak wave signals amidst a strong “structural noise” background. These factors lead to significant errors in the detection results, underscoring the need for further research on the types of wave-based detection signals used.
In the detection of the compactness of corrugated pipe grouting, the scale of the detection target is usually centimeters or decimeters. Due to the small scale of the target, it is very difficult to meet the reflection conditions of sound waves, as the wavelength is large and the beam width is narrow, making it hard to achieve perfect reflection. In comparison, the applicability of scattered waves is broader, not restricted by strict reflection conditions, and can be more effectively applied in the detection of corrugated pipe grouting compactness. Xu et al. [17] conducted experimental research on scattered wave seismic methods in the Caijiaying polymetallic mining area. Yin et al. [18] applied scattered wave forward modeling in the Tongling mining area, guiding the system design of a seismic observation system for metallic mining based on equivalent offset co-scattering imaging, coupled with the processing of the acquired data. In the field of engineering exploration, Zhao et al. [19] proposed a tunnel seismic advance prediction technology based on a mixed model of scattering and reflection. Zhang et al. [20] designed a rapid mobile detection device suitable for urban construction conditions based on the scattering characteristics and equivalent offset method, which helps to solve the problem of detecting voids in urban engineering. Research on scattered waves in China started relatively late, with limited depth in combining scattered wave studies with non-destructive testing for the quality assessment of prestressed pipeline grouting.
Chirp signals, also known as linear frequency-modulated signals, have been widely applied in various fields such as communication, radar, sonar, biomedical, and seismic exploration due to their excellent noise immunity and strong penetration capabilities. Additionally, they are often used as signal models to simulate various natural phenomena [21,22]. With the rapid development of signal technology, some scholars have integrated digital signals with non-destructive testing. Guo et al. [23] used the ABAQUS 2017 software to conduct numerical simulation research on the propagation of chirp signals in prestressed pipelines at different grouting levels. Song et al. [24] developed a super magnetic pulse excitation seismic source using ultramagnetic shape memory materials, enabling controllable seismic sources in mass anchoring mass detection. Wang et al. [25] compared various detection signals using a self-developed Delphi application program, analyzing characteristics such as signal frequency bands and autocorrelation. Their results demonstrated the effectiveness of chirp signals for anchor quality detection and the substantial improvement in detection accuracy using controlled seismic source technology. Meng et al. [26] used high-power pulsed xenon lamps to induce chirp pulse radar thermal imaging technology to detect surface cracks in silicon/phenolic composite materials widely used in engine nozzle insulation. They found that the pulsed high-power xenon-lamp-induced chirp pulse radar thermal imaging technology reliably quantified surface cracks in silicon/phenolic composite materials.
In conclusion, chirp signals (linear frequency-modulated signals; LFMs) utilize the linear variation in signal frequency over time, making them suitable for detection systems in various fields such as communication, radar, sonar, biomedical, and seismic exploration [25]. Although chirp signals have been applied in the field of non-destructive testing, their utilization in quality inspection of grouting in prestressed pipelines is limited. Therefore, this study proposes a scattered wave detection method based on chirp signals. It first constructs large-scale prestressed concrete beam models with different types of defects, then utilizes the scattered wave method with the developed Engineering Geophysical Instrument System–Pipeline Grouting (EGS-PGP) equipment to detect the grouting quality of prestressed pipelines under different conditions, obtaining frequency attenuation amplitudes at defect positions. The conclusions of this study aim to provide a new rapid inspection technology for non-destructive detection of prestressed pipeline grouting quality.
2. Theoretical Methods
2.1. Scattering Wave Method
The scattered wave method is further developed based on the theory of the transmission wave method. Rapidly localizing the specific position of defects in prestressed pipeline grouting on bridges is a major challenge in the field of non-destructive testing. This research is based on the theory of time–frequency transformation, aiming to establish a prestressed pipeline grouting defect identification technology based on peak frequency and wave velocity analysis.
To simplify the research process, the prestressed bridge beam is simplified into a horizontal profile that passes through the location of the steel strands in the corrugated pipe, as shown in Figure 1. In the process of using scattered wave technology to locate and detect grouting defects, the measurement points should be arranged equidistantly along the direction of the projection of the prestressed pipeline on the side of the beam. Subsequently, a known-frequency seismic source signal is emitted from one end of the prestressed pipeline, and a trigger sensor is set at this end to start the timing. Then, the other receiving sensor is moved sequentially along the set measurement point direction to capture the scattered signals at each position. By analyzing the spectrum of these signals and the characteristics of wave velocity changes, the presence of defects can be identified, and the exact location of the defect can be determined accurately. The scattered wave method provides an effective technical approach for the precise localization of defects in prestressed pipeline grouting on bridges [27].
Within the prestressed pipeline system, neglecting the thickness of the corrugated pipe walls, the velocities at which stress waves propagate in the steel strands, cement grout, and concrete are all constant. According to Fermat’s principle, the propagation of waves in a medium follows the principle of taking the shortest-time path. Therefore, the angle relationships of wave propagation in Figure 1 satisfy
At the end of the corrugated pipe, the steel strands are excited in the transverse section, and the measurement points arranged equidistantly along the side of the beam receive the signals sequentially. The frequency shift ∆fi at any measurement point Ai is
where fSi is the spectral center of the source signal, fRi is the spectral center of the received signal at the i-th measurement point, L1, L2, and L3 represent the propagation paths of the signal in the steel strands, cement grout, and concrete, respectively, and α1, α2, and α3 are the absorption coefficients of the steel strands, cement grout, and concrete.
When the corrugated pipe is grouted densely, the propagation of waves is considered to strictly follow Snell’s Law in an ideal state; the formula for frequency shift can be written as
In this formula, ∆l represents the distance between measurement points. From Equation (3), it can be seen that under the densely grouted condition, and are constants, the displacement value of the spectral center shift (referred to as the “frequency shift value”) is only related to the displacement of the measurement points. Taking the first measurement point as the reference point, a static correction that eliminates the influence of the measurement point displacement i∆l on subsequent measurement points yields the abnormal spectral center shift value , hereinafter referred to as the “frequency shift anomaly.” Combined with the formula for central frequency variance, it is known that the frequency shift anomaly forms a small fluctuating horizontal curve in the coordinate system.
When the compaction and junction degree of prestressed pipeline grouting are not uniform due to, for example, gaps and looseness, local abnormal wave impedance areas will appear [28]. Under the excitation of an external acoustic source, the scattering source will generate scattered waves, and the greater the difference in wave impedance, the stronger the scattered waves. Therefore, the scattering wave method can be used to determine whether grouting defects exist and the distribution of their locations [29]. The value of in Equation (2) is no longer a deterministic value. According to scattering theory and the randomness of the non-densely grouted structure in the corrugated pipe, the propagation path of the waves and the attenuation coefficient α2 along this path undergo irregular changes. Correspondingly, is also irregularly changed due to the different angle of wave incidence, resulting in an irregular change in the integration path. The determination of cannot be achieved using analytical methods [30]. By borrowing the idea of static correction, eliminating the influence of measurement point displacement i∆l, the anomalous frequency shift value can be regarded as caused by the non-densely grouted or cavitated sections inside the corrugated pipe. Therefore, the quality of grouting can be judged by the change in peak frequency and the complexity of the frequency chromatographic identification waveform, and the specific location of defects can be located, which provides convenience for further engineering processes.
2.2. Chirp Signal
A linear frequency modulation signal (chirp signal) is a signal whose frequency gradually changes over time, and the signal frequency can gradually increase or decrease. In some areas, the term “chirp” is considered interchangeable with the term “sweep signal”. A chirp signal, as a source signal, has an optimal frequency range, and when the frequency is in the range of 2–20 kHz, it is the most suitable source signal for the detection of prestressed pipelines. Under the extreme condition that the chirp signal has only a small amplitude, it can still have good autocorrelation characteristics. Through the calculation of the attenuation coefficient, it is found that chirp signal energy attenuation is small after long distance propagation. These characteristics show that the chirp signal has good penetration ability and anti-noise ability, which provides a strong guarantee for accurate analysis and processing in the case of a weak signal. A large number of studies show that the detection distance and detection accuracy of the signal are contradictory when the peak power is certain. The scanning characteristics of the chirp signal itself can well reconcile the contradiction between the two, and improve the signal penetration ability and echo signal resolution. In other words, when the peak power of the pulse signal is determined, the chirp signal can adapt itself to long-distance propagation and have greater energy by modulating the frequency and length of the signal. Meanwhile, good autocorrelation characteristics are the guarantee of high signal resolution, so as to solve the contradiction between effective propagation distance and resolution [31].
The time-domain expression of the chirp signal is as follows in Equation (4):
In Equation (4), (t) is referred to as the signal-weighting function, fmin represents the initial frequency, and k represents the frequency sweep rate. When the weighting function (t) is a constant, it forms the time-domain expression of an amplitude-modulated chirp signal; and different values of k correspond to different signal forms.
For a linear chirp signal, the numerical expression for the linearly changing instantaneous frequency over time is as follows:
In Equation (5), is the initial frequency, and K is the sweep rate. That is, the instantaneous frequency of the signal increases by a fixed value. This paper mainly focuses on studying linear amplitude-modulated chirp signals, i.e., the case where the k value in Equation (4) is a constant.
3. Model Test
3.1. Experimental Design
As shown in Figure 2 and Figure 3, the prestressed bridge beam model in this experiment is pre-set with four prestressed ducts, numbered from bottom to top as N1, N2, N3, and N4. Three defects of 0.5 m in length are set across the four ducts, with two located on the N4 duct at 4.25–4.75 m and 6.25–6.75 m from end A, and one on the N3 duct at 3.25–3.75 m from end A. In addition to the pre-set grouting defects, the remaining positions of the N4 and N3 ducts are densely grouted, the N2 duct is entirely grouted and compacted, and the N1 duct is completely empty and not grouted. The operational conditions of ducts N1 to N4 are summarized in Table 1. The layout of measurement points is shown in Figure 1, with a spacing of 0.2 m between each measurement point Ai along the length of the beam. The distance from A1 to the bottom end of the beam is also 0.2 m, with a total of 49 measurement points being set-up.
The cross-sectional dimensions of the specimen are 0.2 × 0.4 m, and the concrete strength grade is C30. The concrete mix ratio of cement is water:sand:crushed stone:water reducer = 1:1.49:3.02:0.46:0.02; the grouting material selected is H-60 prestressed pipeline grouting material; reinforcement is HRB400, with a reinforcement cover thickness of 25 mm; metal corrugated pipes are used, with an inner diameter of 55 mm; each corrugated pipe contains five strands of low-relaxation high-strength steel, with a nominal diameter of approximately 34 mm, the five strands of steel wire are arranged in a circular shape spread along the inside of the pipe with each end of the steel strands exposed for about 10 cm.
First, a chirp signal is used as the excitation source for testing, and the experimental results are analyzed. Then, a hammer strike signal is used as the excitation source for testing and compared with the experimental results of the chirp signal. The research outcome provides technical support for quality inspection of grouting of prestressed ducts.
3.2. EGS-PGP Detection Instrument
The EGS-PGP, Engineering Geophysical Instrument System–Pipeline Grouting Profile (detection imaging), for detecting the quality of grouting in prestressed ducts, consists of Computer processing terminal, Chirp signal transmitter, Signal receiving sensor and Wireless data acquisition device as shown in Figure 4. The accelerometer uses the JM series IEPE-type sensor, with a sensitivity of 1200 mv/g. The wireless router uses the TP-LINK 150 M wireless portable router, with an effective communication distance of 70 m between the router and the computer, and a limited communication distance of 30 m with the wireless data acquisition instrument, which can meet a wireless communication range of up to 100 m on the detection site.
The scattering wave method uses a chirp signal, as shown in Figure 5. This chirp signal is generated by the Simulink function block of MATLAB 2021 as Chirp(t, , T, ). Here, T represents the pulse width, f0 represents the initial frequency, f1 represents the final frequency, the value of t depends on the sampling rate. The sampling rate of this signal is fs = 5 × 10⁶, the pulse width T = 32 ms, the number of sampling points N = fs*T, and the sweep frequency range is from 20 Hz to 10 kHz.
4. Results and Analysis
4.1. Comparative Analysis of Full-Strip Void Signal
The scattering of stress waves at the grouting defect position leads to the loss of high-frequency components in the propagation of signals in prestressed pipelines due to phase cancellation interference. The stress waves propagate in prestressed pipelines with different degrees of grouting density, showing a transfer process from high frequency to low frequency. The frequency spectrum curves of the 49 sampling points collected under different scenarios were Fourier-transformed to obtain spectrograms. The peak frequency and its corresponding position of each measuring point were then extracted separately to derive a peak frequency graph. It is possible to determine whether there is a defect in the prestressed pipeline and pinpoint the specific location of the defect by analyzing changes in the frequency spectrum curve and peak frequency. Due to the limited length of this article, only the frequency spectrum curves of some measuring points under N1 and N2 are presented, as shown in Figure 6 and Figure 7.
The experimental results comparing pipeline N1 with pipeline N2 are shown in Figure 8. For pipeline N2, the peak frequency of each measurement point in the densely grouted area ranges from 6462 Hz to 6714 Hz, fluctuating by 252 Hz, with an average peak frequency of 6606 Hz; the peak standard deviation is 58 Hz. For pipeline N1, the peak frequency of each measurement point in the loosely grouted area ranges from 3632 Hz to 5508 Hz, fluctuating by 1876 Hz, with an average peak frequency of 4667 Hz; the peak standard deviation is 519 Hz and there are no obvious regular pattern changes.
The entire section of the N2 pipeline is densely grouted, without voids, and the peak frequency is stable with minimal variation. The standard deviation is also small, indicating that the frequencies at various points are close to the average peak frequency, effectively determining that the pipeline is compactly grouted. On the other hand, the entire section of the N1 pipeline contains voids, with significant fluctuations in peak frequency and a standard deviation much higher than that of the compactly grouted section. The frequency changes irregularly, allowing for an effective determination that the grouting of the pipeline is not compact enough.
In sum, stability of the peak frequency throughout the test can indicate compact grouting, while a large fluctuation in the peak frequency range with no regular changes can indicate non-compact grouting.
4.2. Single-Void Signal Analysis and Comparison
The experimental results comparing pipeline N2 with pipeline N3 are shown in Figure 9. For pipeline N3, the peak frequency at each measurement point ranges from 4250 Hz to 6620 Hz, fluctuating by 2370 Hz. In the densely grouted area, the peak frequency stabilizes around 6500 Hz, with an average peak frequency of 6332 Hz. At the defect location between 3 m and 4 m from the sensor, the peak frequency ranges from 4250 Hz to 5379 Hz, with an attenuation range of 15.05% to 32.88%. After a sharp decrease, the peak frequency abruptly increases back to the original frequency range.
Pipeline N2 has no void areas throughout the grouting process, and the stable peak frequency throughout the entire length indicates effective judgment of the densely grouted condition of the pipeline. For pipeline N3, the void area in the grouting is between 3.25 m and 3.75 m. The abrupt changes in peak frequency indicate a preliminary effective judgment of the grouting defect area between 3 m and 4 m, consistent with the actual design conditions. In conclusion, a sudden increase or decrease in peak frequency can effectively indicate the location of grouting defects along the pipeline.
4.3. Analysis and Comparison of Multiple Void Signals
The experimental results comparing pipeline N3 with pipeline N4 are shown in Figure 10. For pipeline N4, the peak frequency at each measurement point ranges from 3296 Hz to 6500 Hz, fluctuating by 3204 Hz. In the densely grouted area, the peak frequency stabilizes around 6400vHz, with an average peak frequency of 6036 Hz. At the sensor positions of 4–5 m, the peak frequency ranges from 4486 Hz to 5661 Hz, and at 6–7 m, it ranges from 3296 Hz to 4471 Hz. The attenuation ranges of the peak frequencies are 6.21–25.68% and 25.93–45.39% at these defect locations, respectively. The peak frequencies at both defect locations show a sharp decrease followed by an abrupt increase back to the original frequency range.
For pipeline N3, the void area in the grouting is between 3.25 m and 3.75 m, and the abrupt changes in peak frequency indicate a preliminary effective judgment of the grouting defect area between 3 m and 4 m. For pipeline N4, the void areas in the grouting are between 4.25 and 4.75 m and 6.25 and 6.75 m. The abrupt changes in peak frequency indicate a preliminary effective judgment of the grouting defect areas between 4 and 5 m and 6 and 7 m. The number of void areas can be determined by the number of times the peak frequency shows abrupt changes, with the attenuation range of the peak frequency at the second void area being 19.71% higher compared to the first void area. In other words, the number of sudden changes in frequency can indicate the number of gaps inside the pipeline.
4.4. Analysis of Different Signal Sources
Elastic wave spectra generated by impacts and propagated in concrete are commonly used to assess thickness or locate internal defects. Sometimes, the analyzed spectra contain many complex frequencies, so a program called frequency spectrogram imaging has been developed to visually identify defect locations on cross-sections. The program is developed in Microsoft Visual C# 2010, and its core code functionality involves transforming stress wave time-domain curves into frequency-domain curves through Fourier transform. Due to the complexity of frequencies in the spectrum, the frequencies are categorized into predefined RGB bands by dividing the frequency ranges in the code.
The frequency spectrum diagram is the post-processing of the EGS-PGP prestressed pipeline grouting quality detection system for the frequency spectrum curve. The horizontal axis represents the position of the measuring points at the bottom of the beam, and the vertical axis corresponds to the values within the frequency range. The vibration amplitude transitions from low to high are represented by a gradient from deep blue to deep red, divided into 16 color levels. The amplitude in the deep blue region is 0, and the deep red region represents the maximum amplitude measured at that point. Disorder of multiple colors in the frequency spectrum diagram indicates the complexity of the frequency spectrum curve at that point, suggesting the possible presence of non-densely grouted areas nearby. Consistency of colors in the frequency spectrum reflects the monotonicity of the frequency spectrum curve tested at that point, implying that the area may have tightly grouted regions. A schematic diagram of the frequency spectrum is shown in Figure 11.
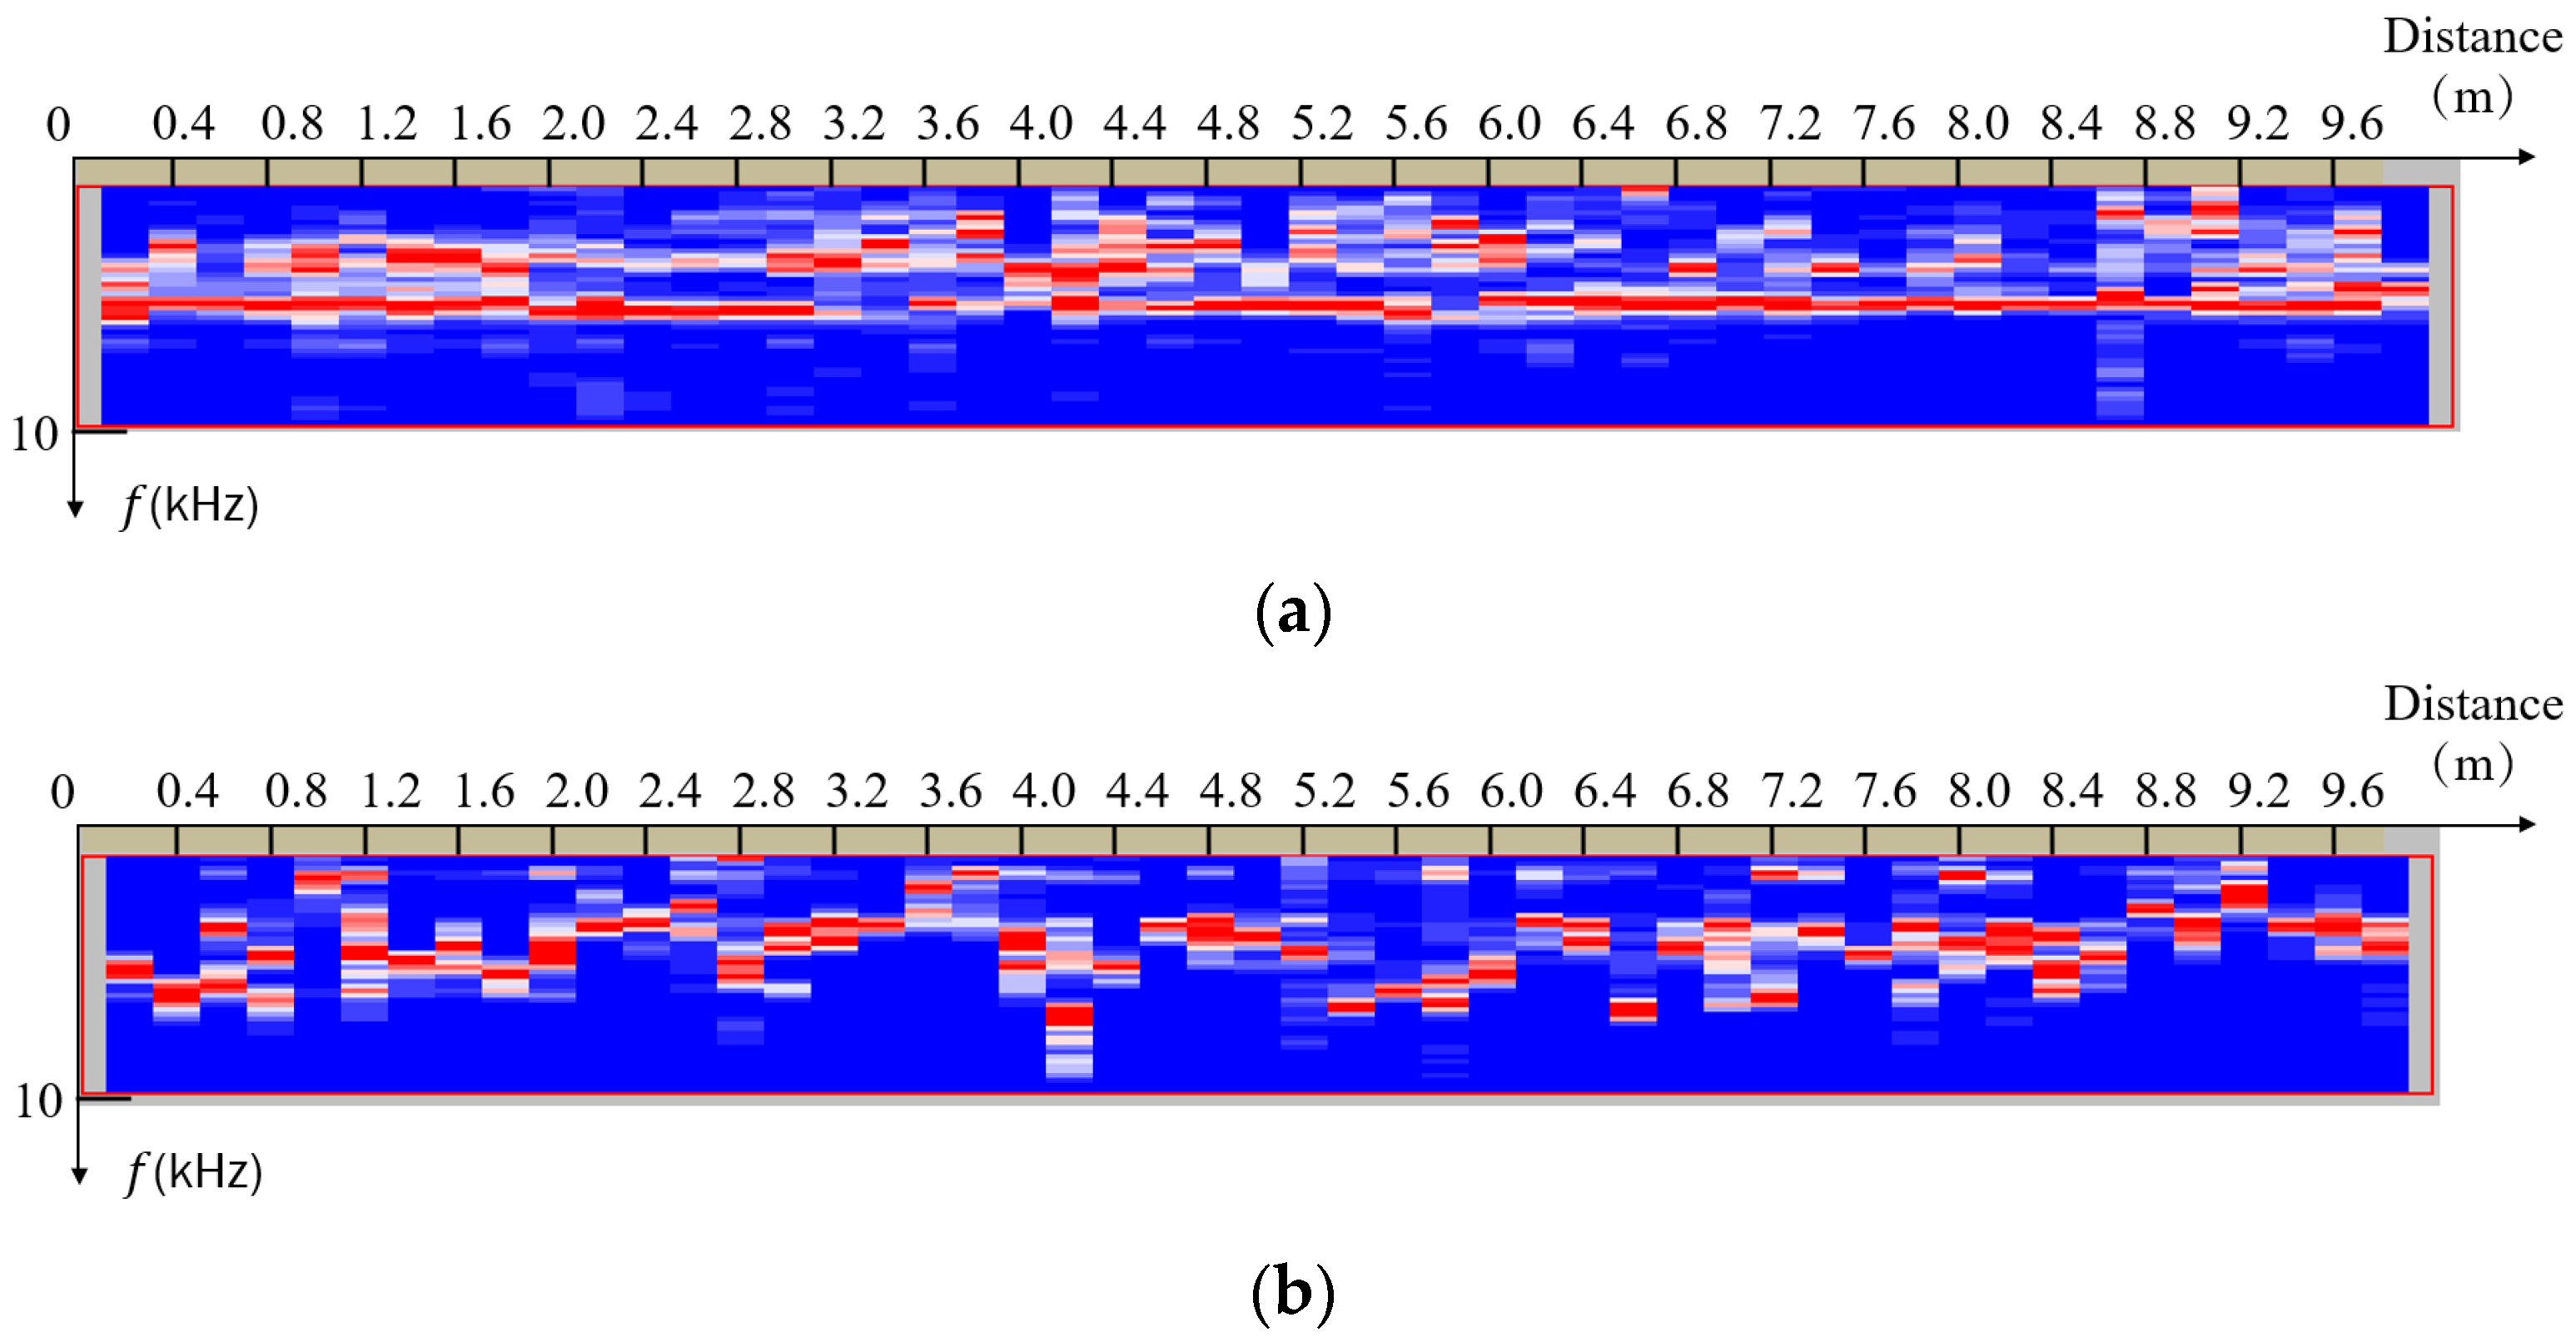
Test data for N4 and N1 using a chirp signal excitation device and hammer impact as the vibration source triggers and the EGS-PGP instrument for reception are shown in Figure 12, Figure 13, Figure 14 and Figure 15, respectively.
The following conclusions can be drawn from Figure 12, Figure 13, Figure 14 and Figure 15: For the frequency spectrogram of the chirp signal, at distances of 4.25 m to 4.75 m and 6.25 m to 6.75 m from end A of pipeline N4, and at a distance of 3.25 m to 3.75 m from end A of pipeline N3, there are distinct, multi-colored chaotic spectra, indicating the presence of slurry defects in that area; the vibration amplitude of pipeline N2 (highlighted in red) remains uniform, with no significant multi-colored chaotic spectra, suggesting the absence of defects. The red area of pipeline N1 exhibits chaotic and irregular patterns, indicating voids within the pipeline; for the frequency spectrogram of the impact signal, all pipelines exhibit multi-colored chaotic spectra over their entire length range, making it difficult to determine pipeline defects.
Although the hammer impact signal has a low cost and high energy as a vibration source, as well as strong penetration capabilities, in practical scatter wave method multi-point positioning detection operations it is unstable as a trigger source. The received frequency will change with the different impact forces, angles, and times of various operators, making it challenging to detect defect locations through frequency analysis. In comparison, the chirp signal has consistent energy and frequency with each triggering, showing better stability, and is suitable for scatter-wave-method multi-point positioning detection.
5. Conclusions
This study conducted experimental research on a test beam to investigate the quality of prestressed pipeline grouting using the scatter wave method. A comparative analysis was performed on the signal detection results under different conditions, leading to the following main conclusions:
- (1)
- Stability of the peak frequency throughout the test can indicate compact grouting, while a large fluctuation in the peak frequency range with no regular changes can indicate non-compact grouting. For the 10 m long prestressed pipes, the peak frequencies in the compact grouting area at various measuring points ranged from 6462 Hz to 6714 Hz, with an average peak frequency of 6606 Hz, and the peak frequencies in the non-compact grouting area at various measuring points ranged from 3632 Hz to 5508 Hz, with an average peak frequency of 4667 Hz.
- (2)
- A sudden increase or decrease in peak frequency can effectively indicate the location of grouting defects along the pipeline. For the 10 m long prestressed pipes with only one defect, the maximum peak frequency attenuation at the defect position reached 32.88%.
- (3)
- The number of sudden changes in frequency can indicate the number of gaps inside the pipeline. The largest attenuation in peak frequency occurred when the second gap was 2 m away from the first gap, with a difference of 19.71%.
- (4)
- The Chirp signal, compared to the hammer impact signal, shows greater stability and engineering application value in detecting defects using the scatter wave method. The frequency spectrogram post-processed by the EGS-PGP prestressed pipeline grouting quality detection system has engineering application value in visualizing defects.
Author Contributions
Writing—original draft, M.S.; Writing—review & editing, Y.Y., W.W. and P.G.; Supervision, Y.C.; Project administration, Q.W. All authors have read and agreed to the published version of the manuscript.
Funding
The authors are grateful for the financial support from the Key Research Projects of Higher Education Institutions in Henan Province (24A560021 (Pan Guo)), and the Henan Postdoctoral Foundation (202102015 (Pan Guo)).
Data Availability Statement
The data that support the findings of this study are available from the corresponding author upon reasonable request.
Conflicts of Interest
Authors Yushan Ye and Qingshan Wang were employed by the company China Construction Seventh Engineering Bureau Co., Ltd. The other authors declare that they have no known competing financial interests or personal relationships that could have appeared to influence the work reported in this paper.
References
- Zhang, J.; Jin, J.; Wang, Y.; Zhou, W.; Liu, Z. Study Progress of Intelligent Inspection Technology and Equipment for Highway Bridge. J. Highw. Transp. Res. Dev. 2023, 40, 58. [Google Scholar]
- Yan, M.; Yang, Y.; Li, X.; Bao, Y.; Sun, J.; Sun, B. Pretensioned prestress friction losses considering contact imperfection at deviators in prestressed concrete girders. Struct. Infrastruct. Eng. 2021, 17, 1639–1650. [Google Scholar] [CrossRef]
- Sadri, A. Application of impact-echo technique in diagnoses and repair of stone masonry structures. NDT E Int. 2003, 36, 195–202. [Google Scholar] [CrossRef]
- Savino, P.; Tondolo, F.; Sabia, D.; Quattrone, A.; Biondini, F.; Rosati, G.; Anghileri, M.; Chiaia, B. Large-Scale Experimental Static Testing on 50-Year-Old Prestressed Concrete Bridge Girders. Appl. Sci. 2023, 13, 834. [Google Scholar] [CrossRef]
- Woodward, R.J.; Blake, L.S.; Sketch, W.A.J.; Walley, F.; Nicholson, T.A.; Hannah, C.; Dawson, D.B.; Williams, F.W.; Dawe, P.H.; Hendley, A.H.; et al. Collapse of Ynys y Gwas Bridge Bridge. Proc. Inst. Civ. Eng. 1989, 86, 1171–1191. [Google Scholar]
- Rehman, S.K.U.; Ibrahim, Z.; Memon, S.A.; Jameel, M. Nondestructive test methods for concrete bridges: A review. Constr. Build Mater. 2016, 107, 58–86. [Google Scholar] [CrossRef]
- Maierhofer, C.; Arndt, R.; Röllig, M.; Rieck, C.; Walther, A.; Scheel, H.; Hillemeier, B. Application of impulse-thermography for non-destructive assessment of concrete structures. Cem. Concr. Compos. 2006, 28, 393–401. [Google Scholar] [CrossRef]
- Tian, Z.; Huo, L.; Gao, W.; Song, G.; Li, H. Grouting monitoring of post-tensioning tendon duct using PZT enabled time-reversal method. Measurement 2018, 122, 513–521. [Google Scholar] [CrossRef]
- Jiang, T.; He, B.; Zhang, Y.; Wang, L. Detecting of the Longitudinal Grouting Quality in Prestressed Curved Tendon Duct Using Piezoceramic Transducers. Sensors 2020, 20, 1212. [Google Scholar] [CrossRef]
- Liu, H.W.; Zhan, S.P.; Du, Y.H.; Zhang, P. Study on Pulsed Eddy Current Nondestructive Testing Technology for Pipeline Corrosion Defects Based on Finite Element Method. Appl. Mech. Mater. 2011, 120, 36–41. [Google Scholar] [CrossRef]
- Suzuki, T.; Shiotani, T.; Ohtsu, M. Evaluation of cracking damage in freeze-thawed concrete using acoustic emission and X-ray CT image. Constr. Build Mater. 2017, 136, 619–626. [Google Scholar] [CrossRef]
- Yang, Y.X.; Chai, W.H.; Liu, D.C.; Zhang, W.D.; Lu, J.C.; Yang, Z.K. An Impact-Echo Experimental Approach for Detecting. Concr. Struct. Faults Adv. Civ. Eng. 2021, 2021, 8141015. [Google Scholar]
- Martin, J.; Broughton, K.J.; Giannopolous, A.; Hardy, M.S.A.; Forde, M.C. Ultrasonic tomography of grouted duct post-tensioned reinforced concrete bridge beams. NDT E Int. 2001, 34, 107–113. [Google Scholar] [CrossRef]
- Wang, S. Application of Nondestructive Testing Technology in Quality Evaluation of Plain Concrete and RC Structures in Bridge Engineering: A Review. Buildings 2022, 12, 843. [Google Scholar] [CrossRef]
- Hu, M.; Xu, Y.; Li, S.; Lu, H. Detection of defect in ballastless track based on impact echo method combined with improved SAFT algorithm. Eng. Struct. 2022, 269, 114779. [Google Scholar] [CrossRef]
- Yang, C.; Shi, C.; Su, S.; Liu, M. Detection and analysis of grouting compactness based on frequency spectrum analysis and wavelet packet entropy technology. Build. Struct. 2021, 51, 110–115. [Google Scholar]
- Xu, M.C.; Gao, J.H.; Rong, L.X.; Liu, J.X.; Cai, M.T.; Wang, G.K. Experimental study of scattered wave seismic method in the Caijiaying polymetallic mining area. Geophys. Geophys. Explor. 2003, 27, 49–54. [Google Scholar]
- Yin, J.; Wang, W.; Wang, Y. Application of seismic scattering wave simulation imaging method in a mining area of Tongling. Prog. Geophys. 2009, 24, 1367–1376. [Google Scholar]
- Zhao, Y.; Jiang, H.; Zhao, X. Tunnel seismic tomography method for geologica prediction and its application. Appl. Geophys. 2006, 3, 69–74+130. [Google Scholar] [CrossRef]
- Zhang, J.; Liu, S.; Yang, C.; Liu, X.; Wang, B. Detection of urban underground cavities using seismic scattered waves: A case study along the Xuzhou Metro Line 1 in China. Near Surf. Geophys. 2020, 19, 95–107. [Google Scholar] [CrossRef]
- Dolmatov, D.O.; Ermoshin, N.I. Digital Coherent Signal Processing with Calculations in Frequency Domain for Solving Ultrasound Tomography Problems Using Matrix Antenna Arrays with Nonequidistant Arrangement of Elements. Russ. J. Nondestruct. Test. 2023, 58, 869–881. [Google Scholar] [CrossRef]
- Liu, J.; Dong, B.; Wang, F.; Wang, Y.; Chen, M.; Liu, G. Study on cracks defect inspection for GFRP laminates using laser excitation chirp pulsed photothermal radar imaging (CP-PRI). Infrared Phys. Technol. 2021, 114, 103689. [Google Scholar] [CrossRef]
- Guo, Z. Research on Grout Transmission Method Detection of Pre-Stressed Holes Based on BP Neural Network. Ph.D. Thesis, Zhengzhou University, Zhengzhou, China, 2022. [Google Scholar]
- Song, W.; Li, Z.; Xiao, B.; Li, G.; Li, Z. Research on the processing method of non-destructive testing data for anchor rod anchoring quality. J. Eng. Geophys. 2012, 9, 337–341. [Google Scholar]
- Yan, Y.; Wang, Y.; Chen, H. Modulation of Multiple Chirp Signals and Analysis of their Propagation Characteristics in Anchor Rods. Data Acquis. Process. 2012, 27, 27–30. [Google Scholar]
- Meng, X.; Wang, F.; Liang, Z.; Zhang, X.; Weng, J.; Li, Z.; Liu, J.; Chen, M.; Wang, Y.; Yue, H. Research on the detection of silica/phenolic composite surface cracks using instantaneous high-power xenon lamp-induced chirp-pulsed radar thermography. Measurement 2023, 209, 112494. [Google Scholar] [CrossRef]
- He, Y.X.; Liu, J.; Guo, L.Y. Research on the Technology of Defects Detection in Prestressed Pipe Grouting. Adv. Mater. Res. 2012, 1615, 1312–1318. [Google Scholar] [CrossRef]
- Li, B.; Wang, C. Analysis of the application effect of scattering imaging method in the quality detection of post-tensioned prestressed duct grouting. Urban Bridges Flood Control. 2013, 337–339+26. [Google Scholar]
- Halliday, F.D.; Curtis, A.; Vermeer, P.; Strobbia, C.; Glushchenko, A.; van Manen, D.J.; Robertsson, J.O. Interferometric ground-roll removal: Attenuation of scattered surface waves in single-sensor data. Geophysics 2010, 75, SA15–SA25. [Google Scholar] [CrossRef]
- Yang, C.; Jin, D.; Liang, D. Method of identification and solution about long-wavelength static correction: A case study from the seismic data in Ordos loess plateau. Prog. Geophys. 2016, 31, 2212–2218. [Google Scholar]
- Mavoungou, D.M.N.; Zhang, P.; Zhang, S.; Wang, Q. Numerical Simulation Research on Response Characteristics of Grouting Defects of Ground Penetrating Radar for Detection of Grouting Quality behind Tunnel Wall. J. World Archit. 2021, 5, 1–20. [Google Scholar] [CrossRef]
Figure 1.
Schematic diagram of the seismic reflection method.
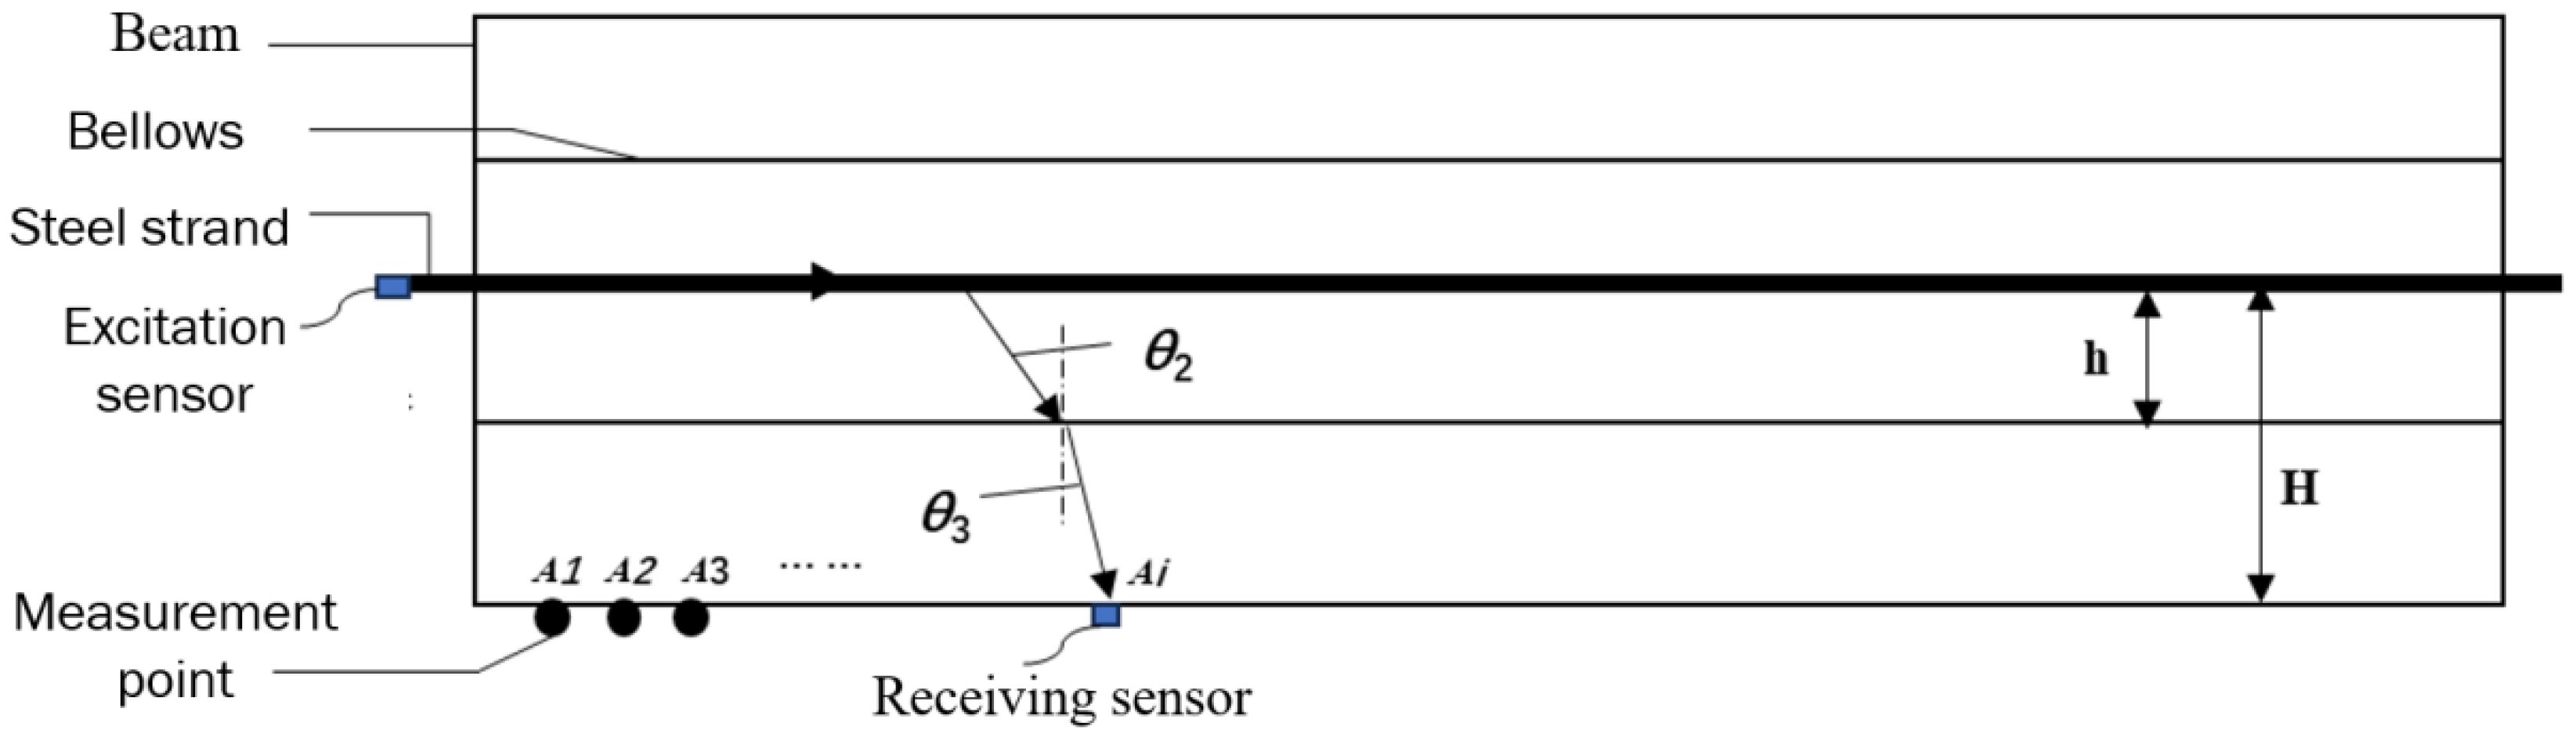
Figure 2.
Design diagram of prestressed beam model (units: mm).
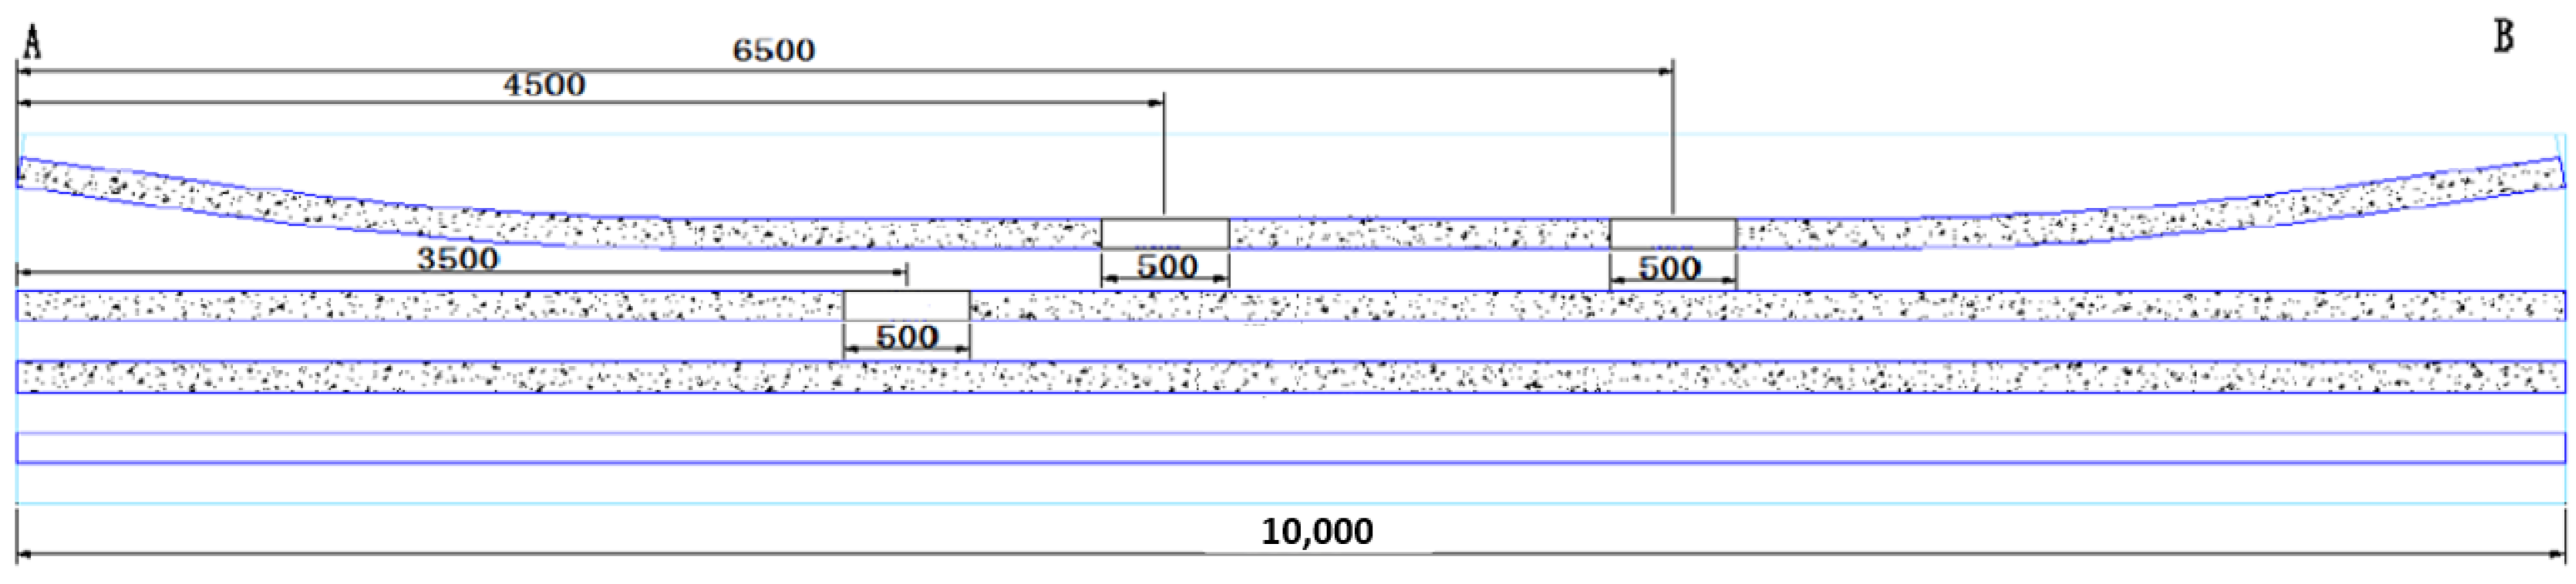
Figure 3.
Manufacturing process of the prestressed beam model. (a) Setting up steel strands and anchors. (b) Overall model diagram of prestressed bridge beams and slabs.
Figure 3.
Manufacturing process of the prestressed beam model. (a) Setting up steel strands and anchors. (b) Overall model diagram of prestressed bridge beams and slabs.
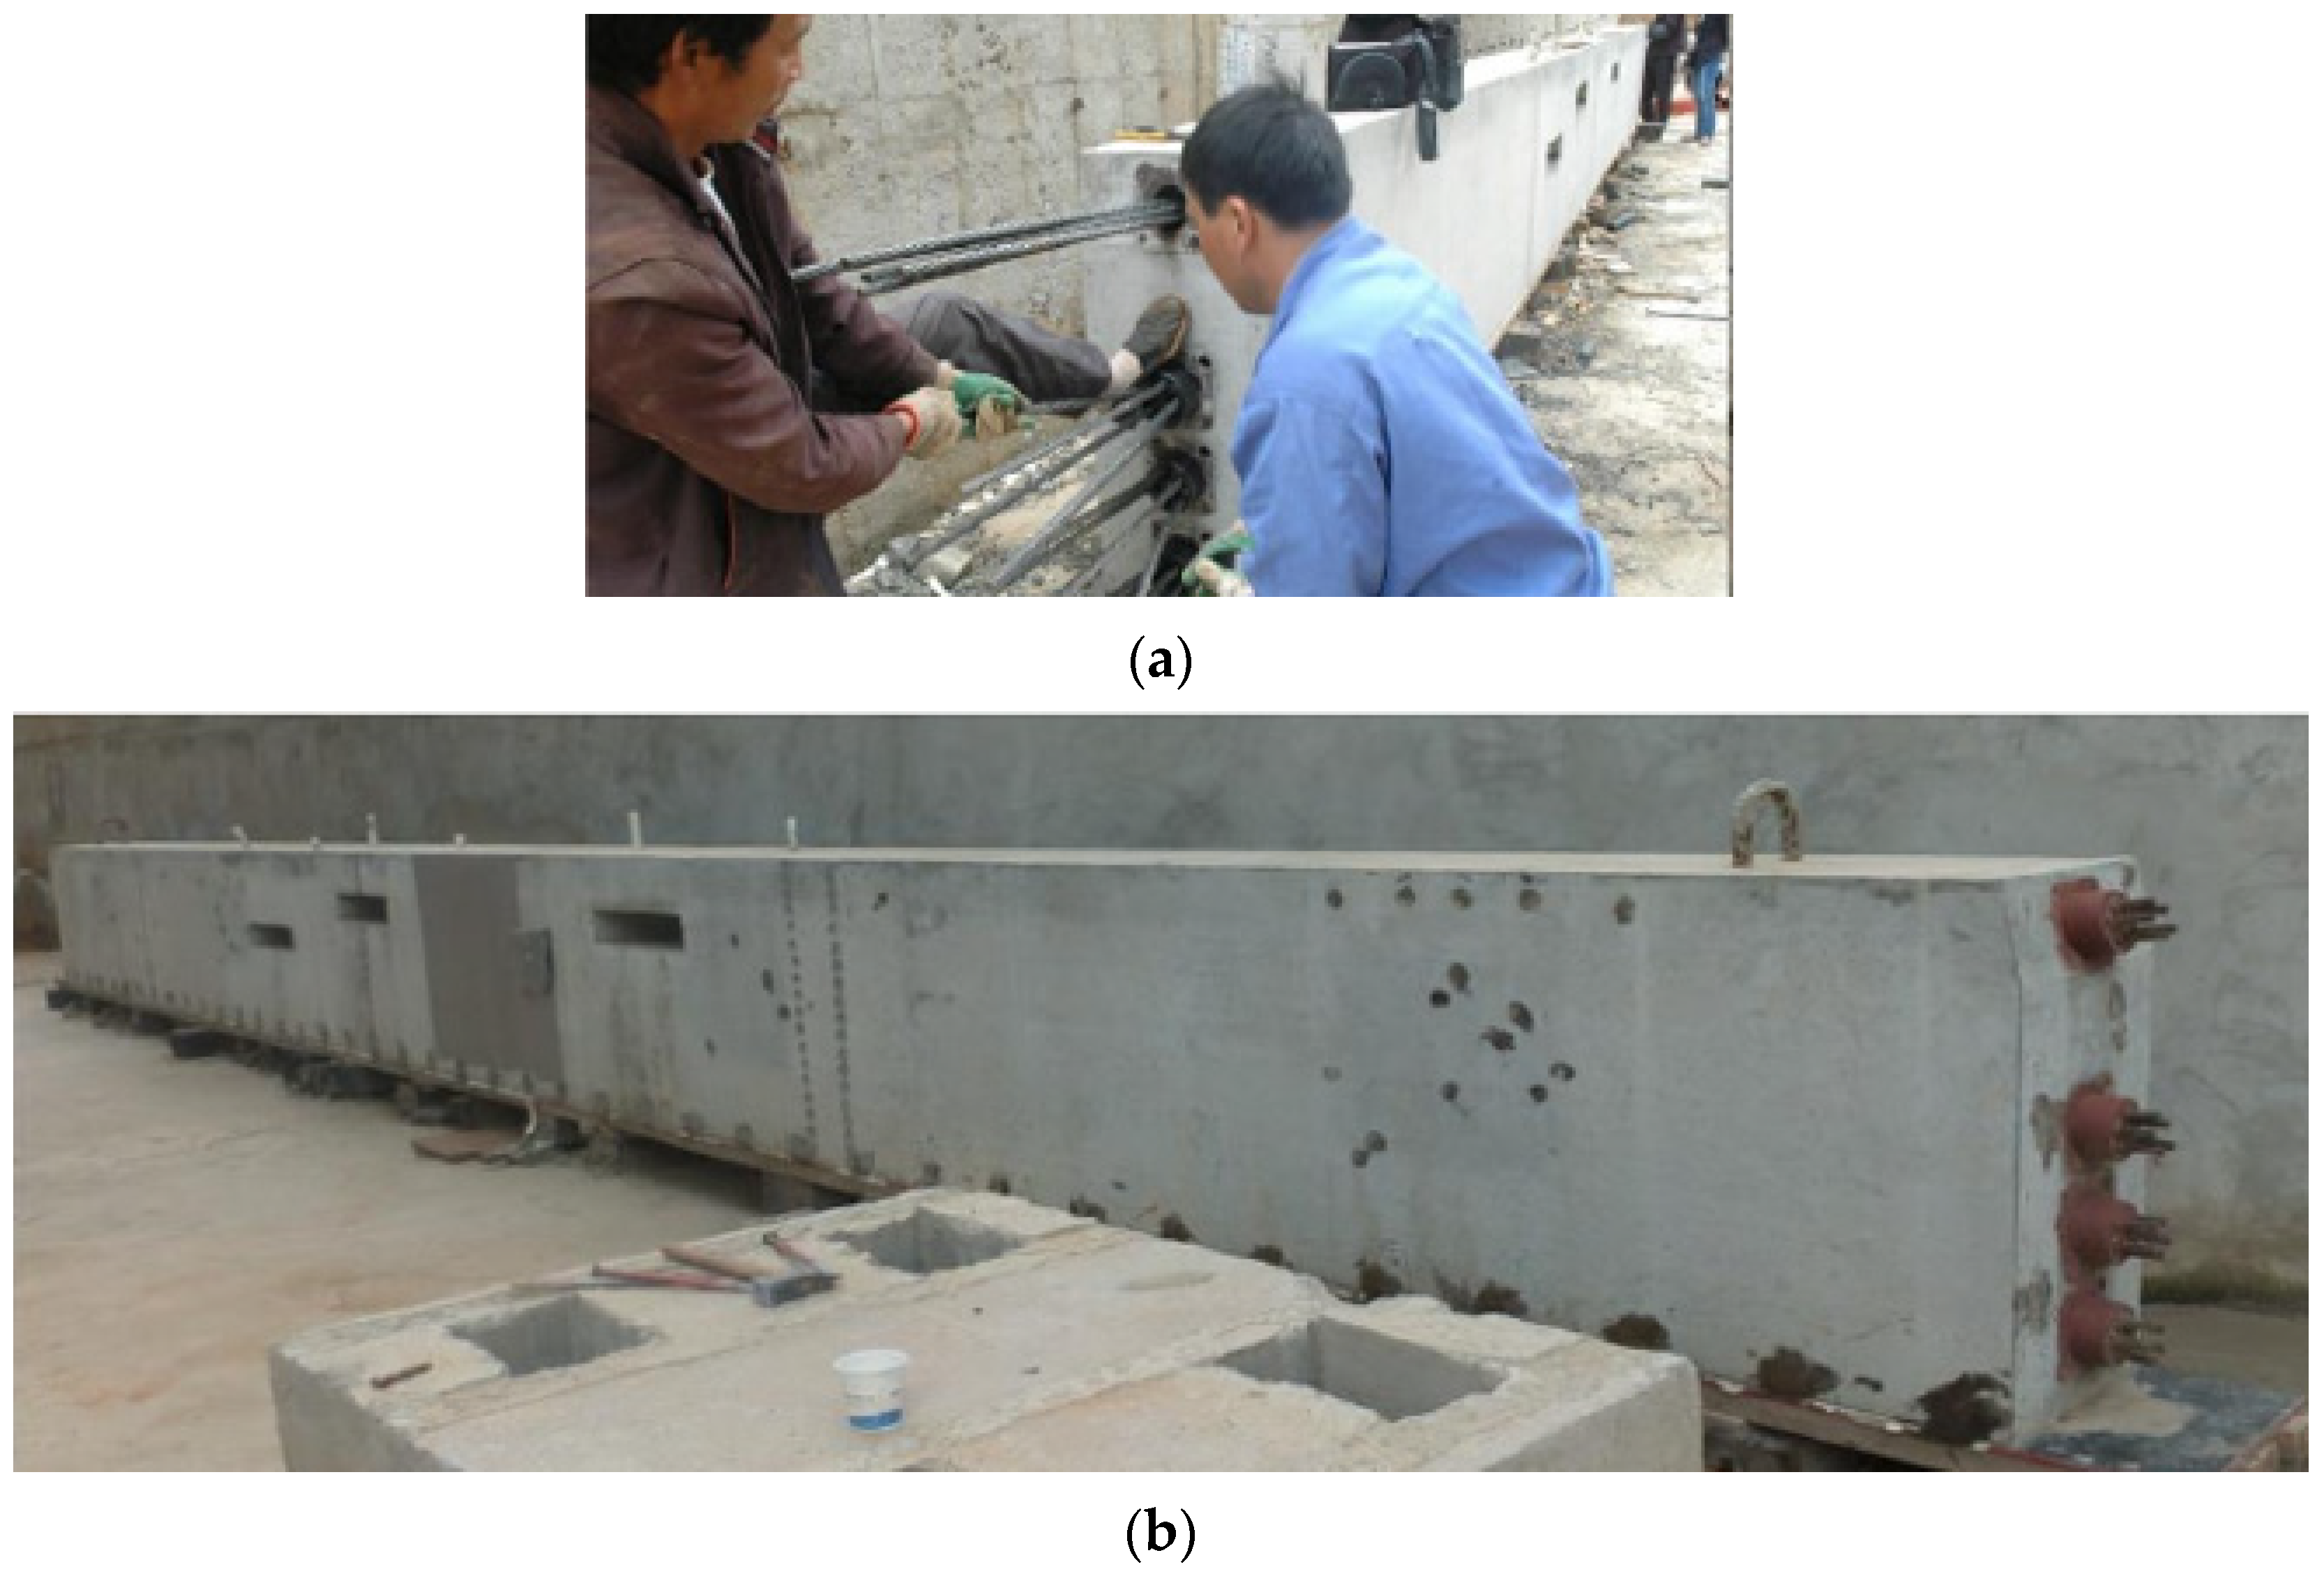
Figure 4.
Quality inspection instrument for grouting of EGS-PGP prestressed pipelines. 1—Computer processing terminal; 2—Chirp signal transmitter; 3—Signal receiving sensor; 4—Wireless data acquisition device.
Figure 4.
Quality inspection instrument for grouting of EGS-PGP prestressed pipelines. 1—Computer processing terminal; 2—Chirp signal transmitter; 3—Signal receiving sensor; 4—Wireless data acquisition device.
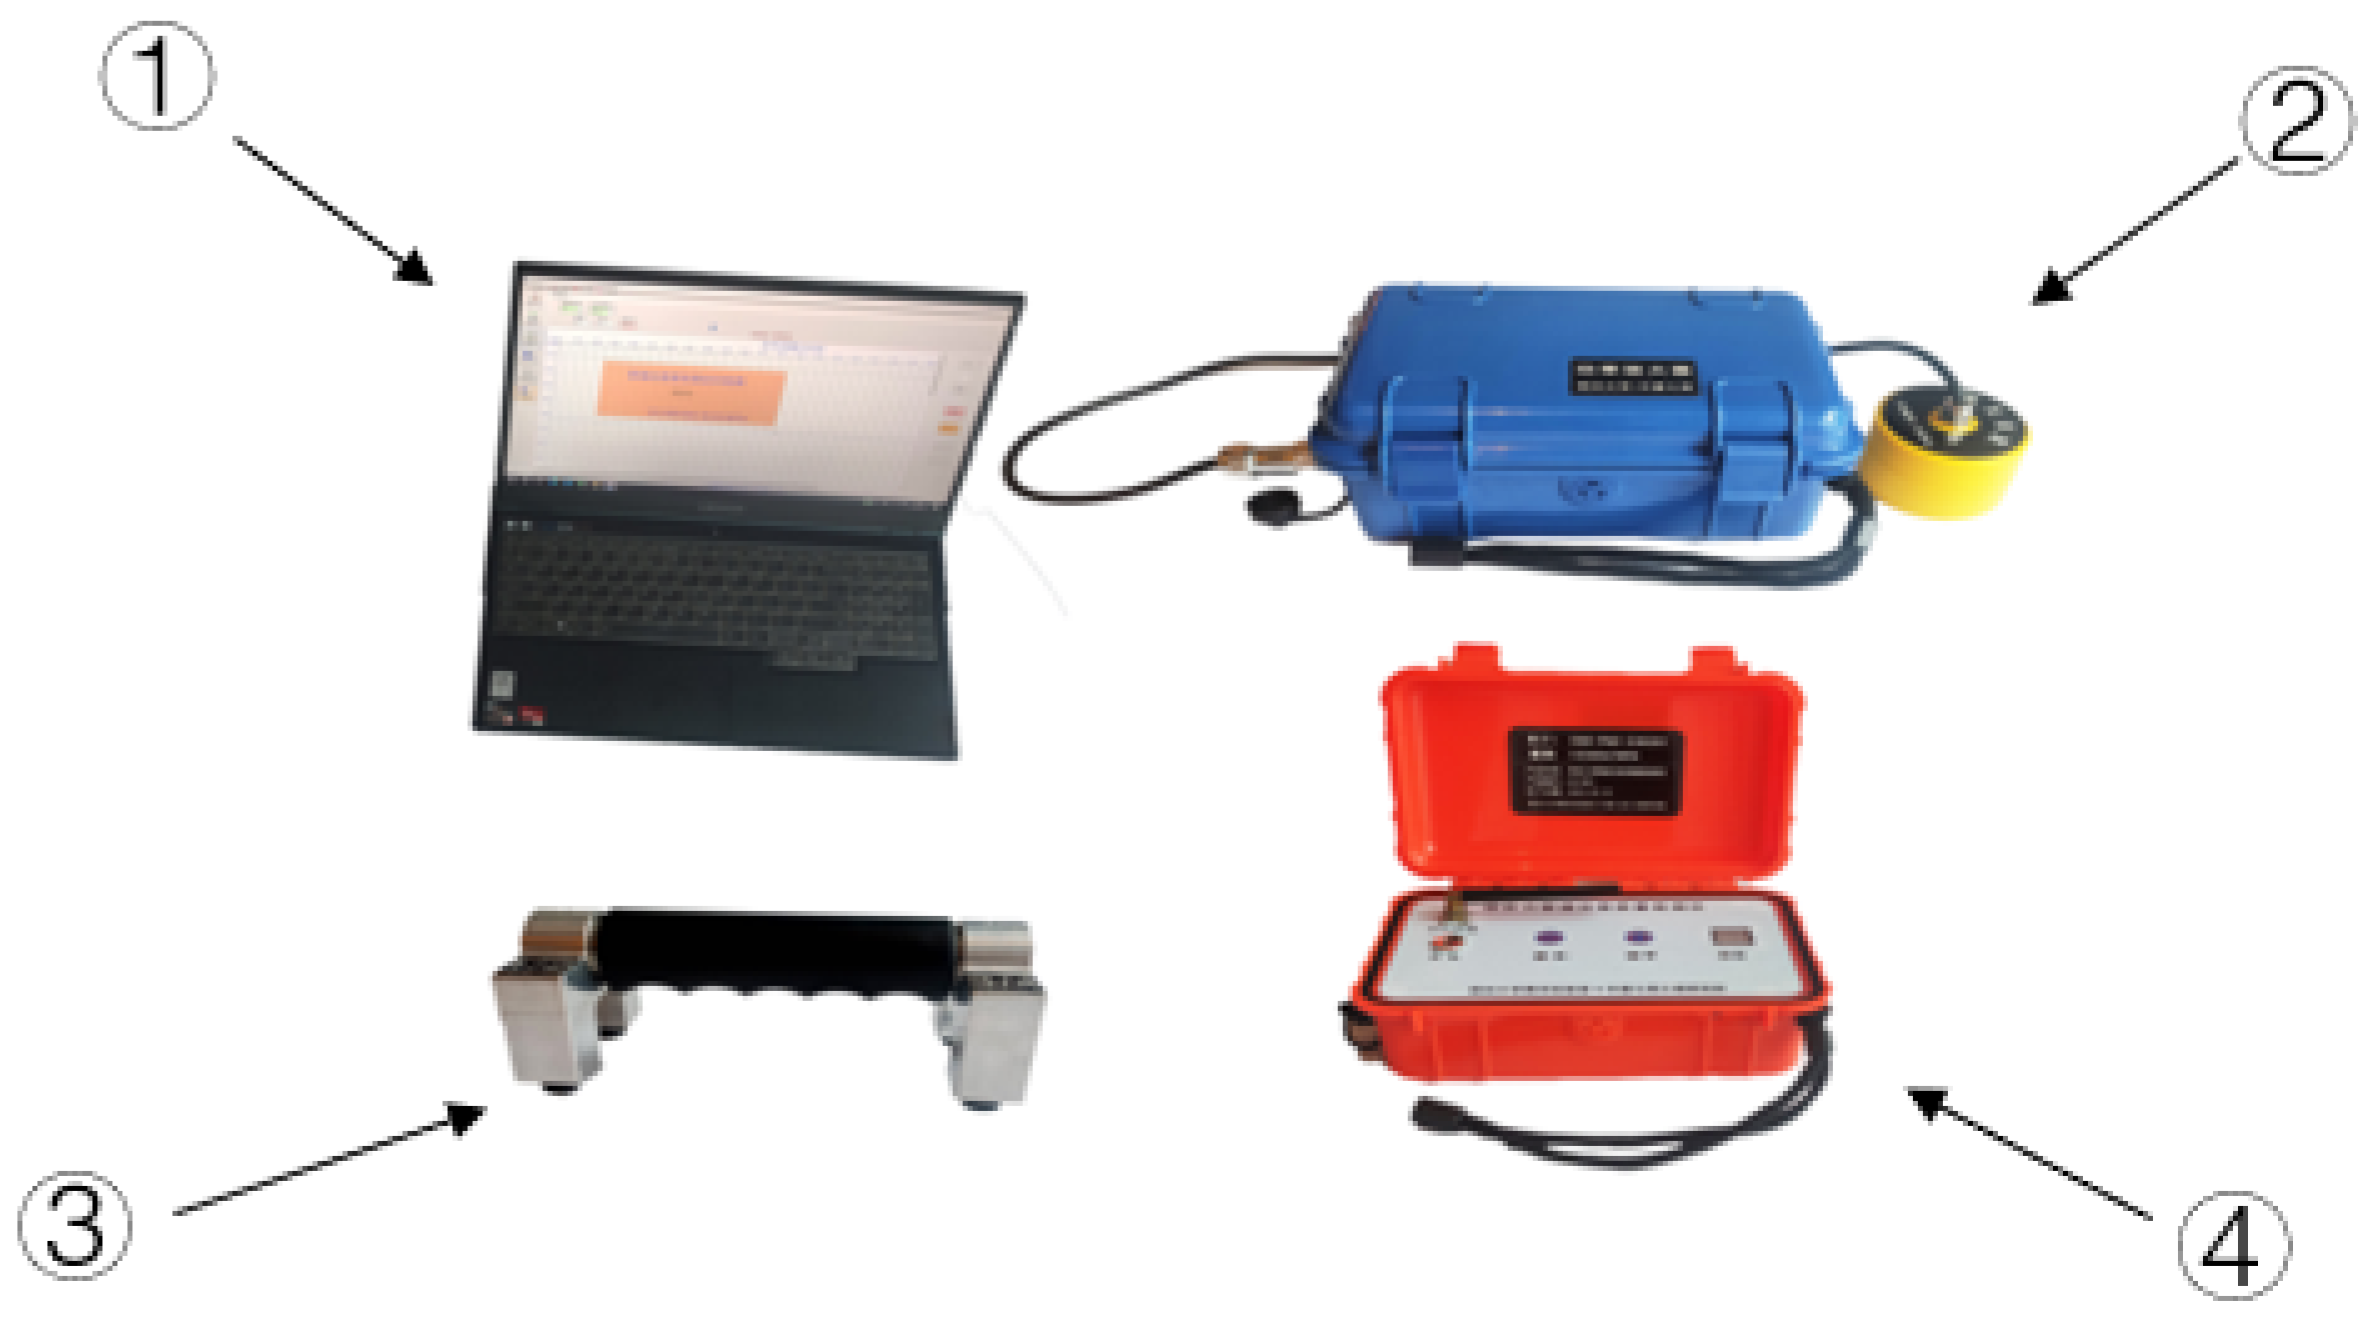
Figure 5.
Schematic diagram of the chirp signal.
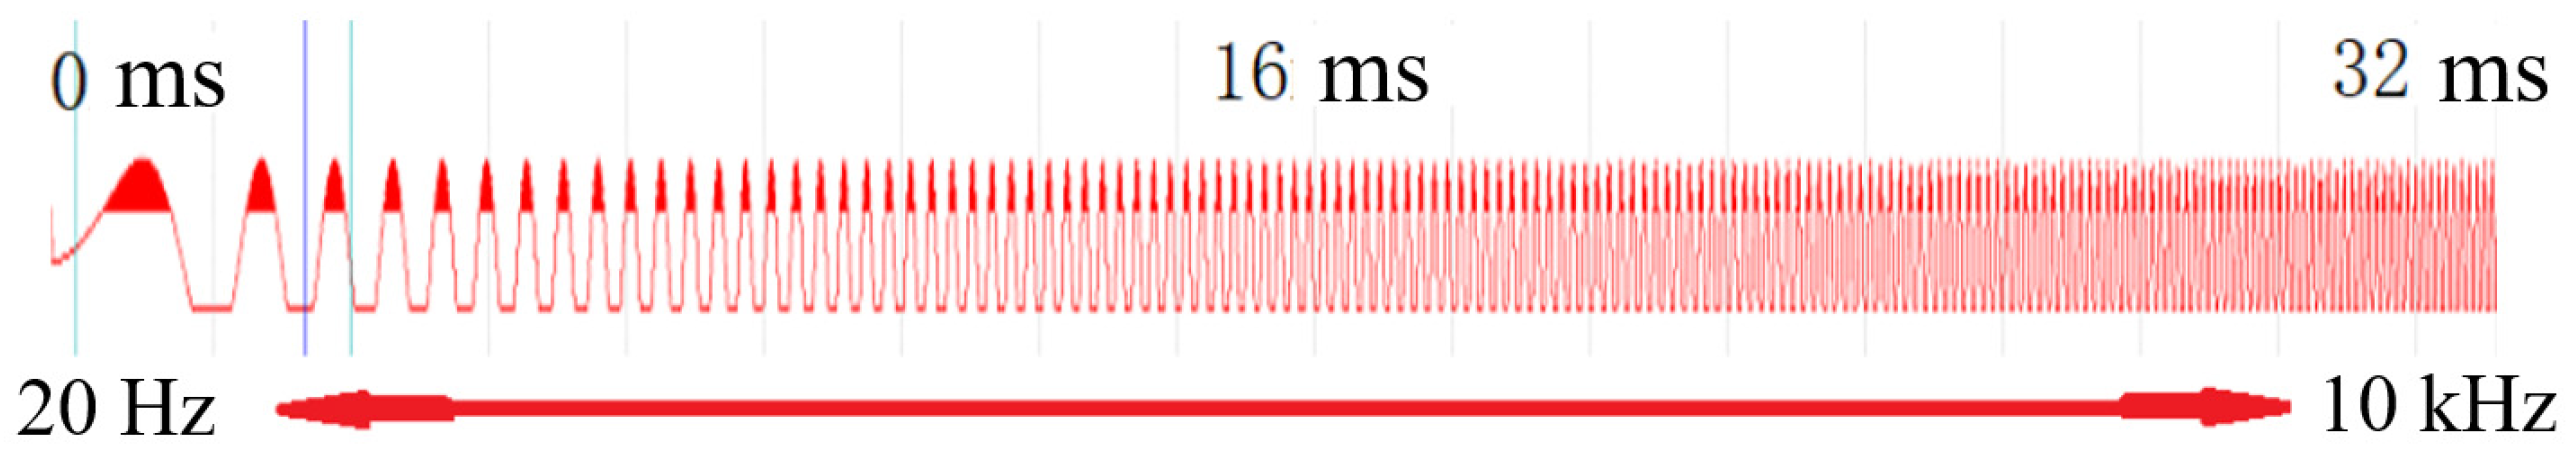
Figure 6.
Frequency spectrum plot of certain measurement point N1.

Figure 7.
Frequency spectrum plot of certain measurement point N2.

Figure 8.
Peak frequency diagram of each measuring point in pipelines N1 and N2.

Figure 9.
Peak frequency diagram of each measuring point in pipelines N2 and N3.

Figure 10.
Peak frequency diagram of each measuring point in pipelines N3 and N4.
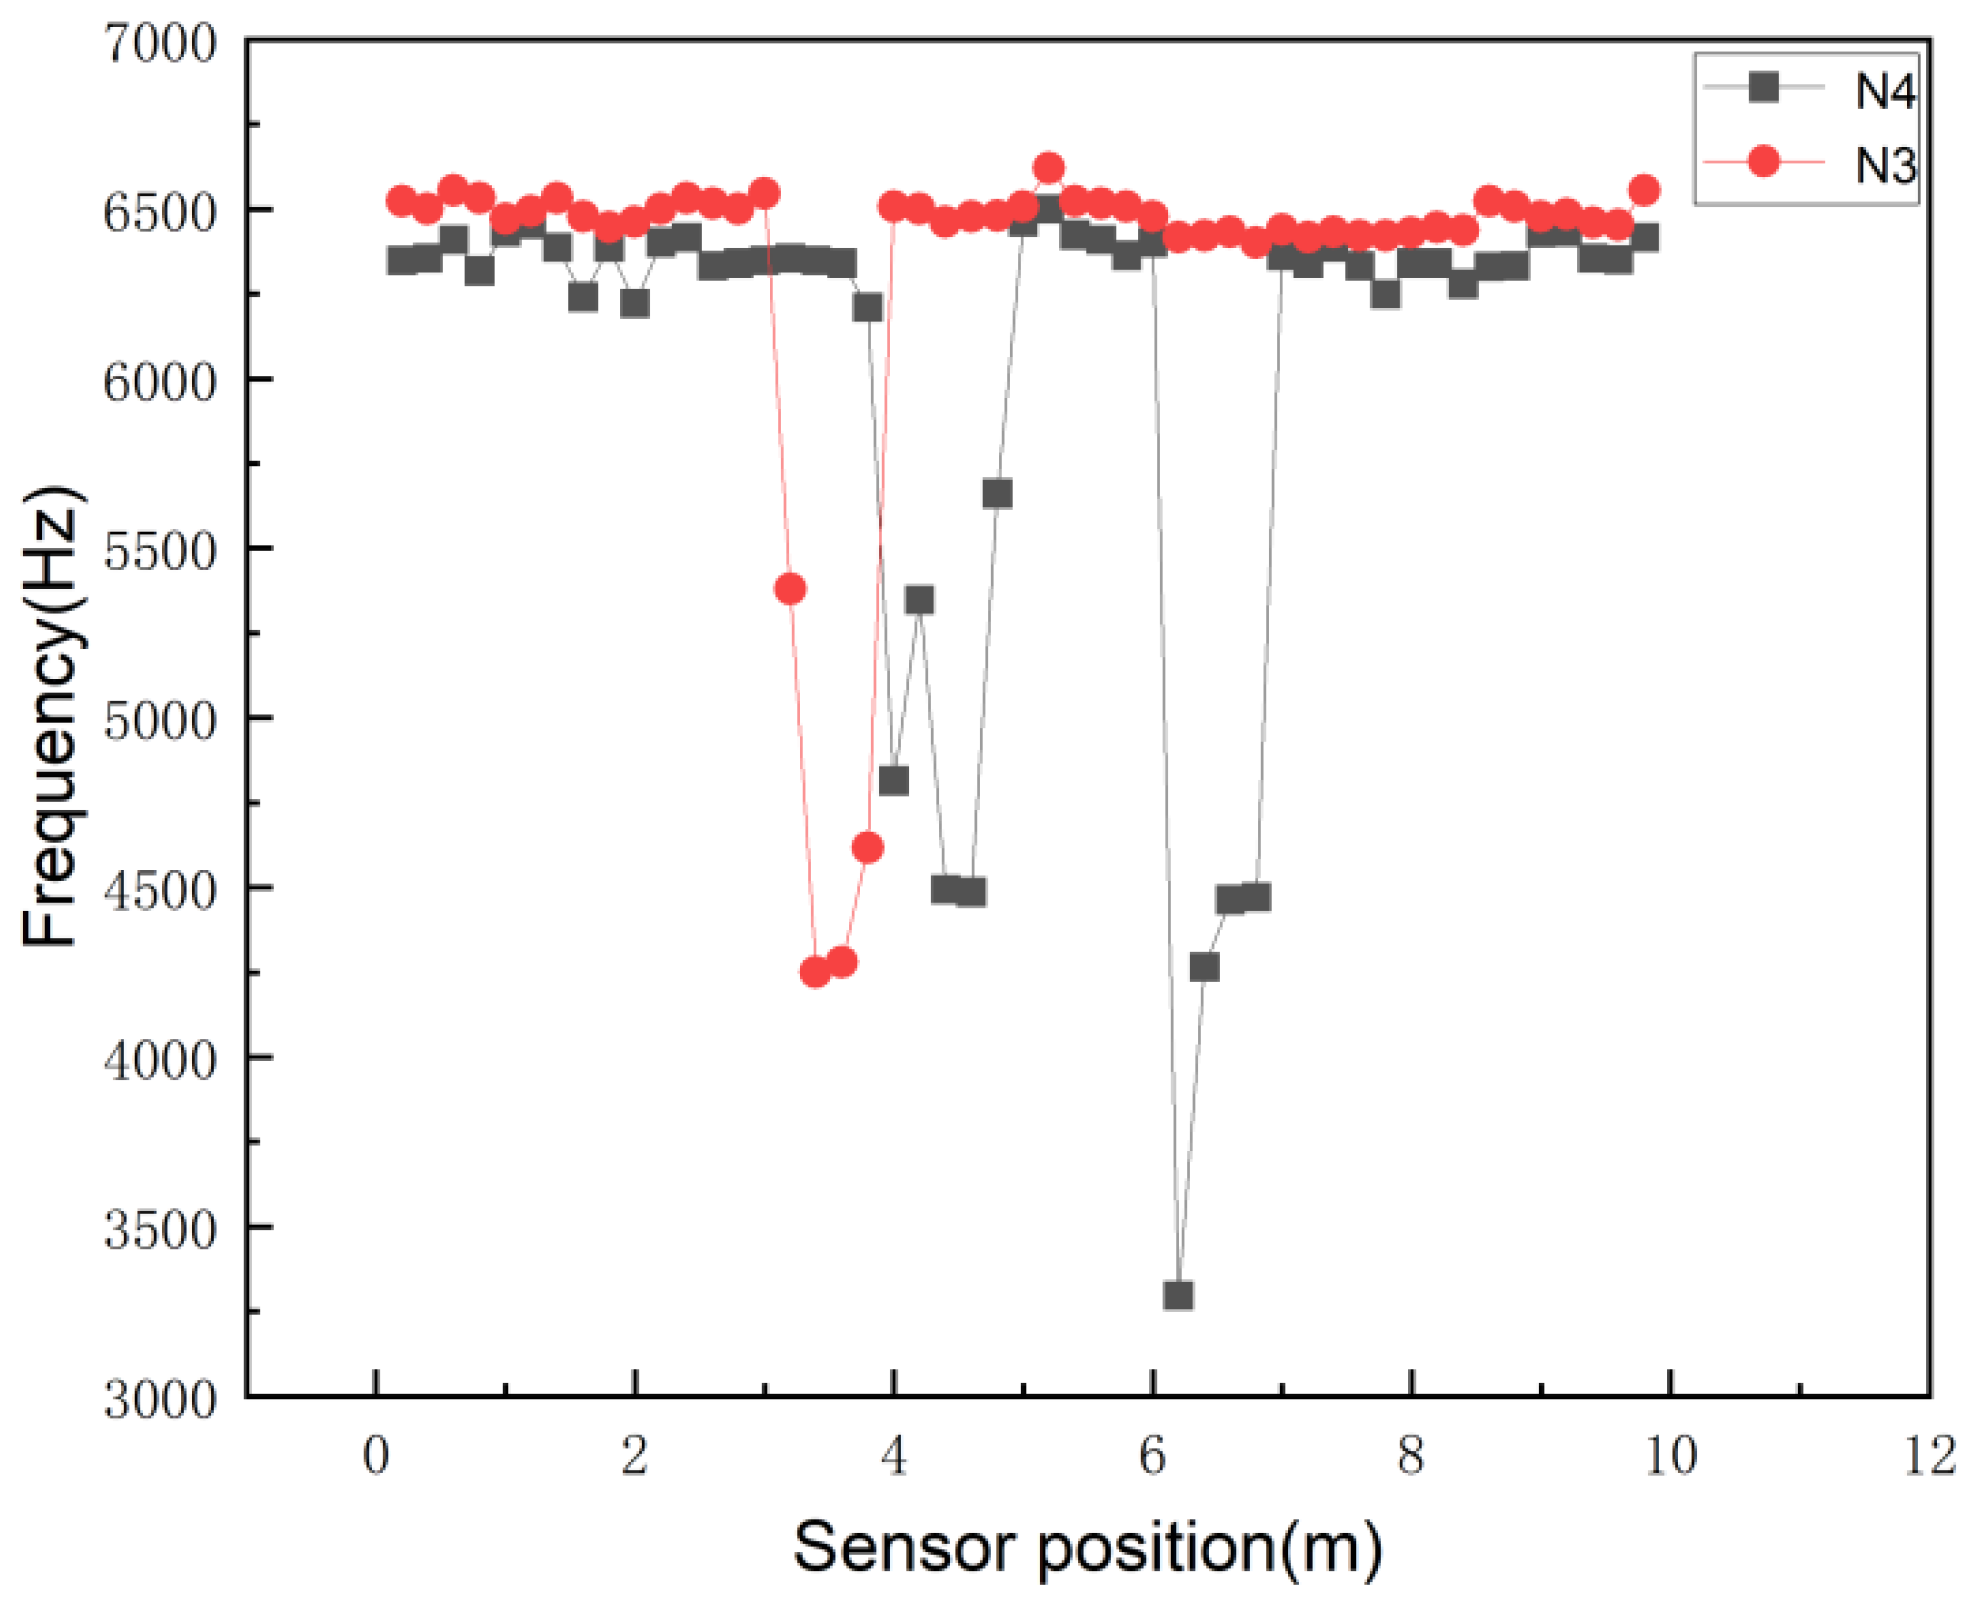
Figure 11.
Frequency spectrum diagram.
Figure 12.
Frequency spectrogram of pipeline N4. (a) Chirp signal. (b) Hammering signal.
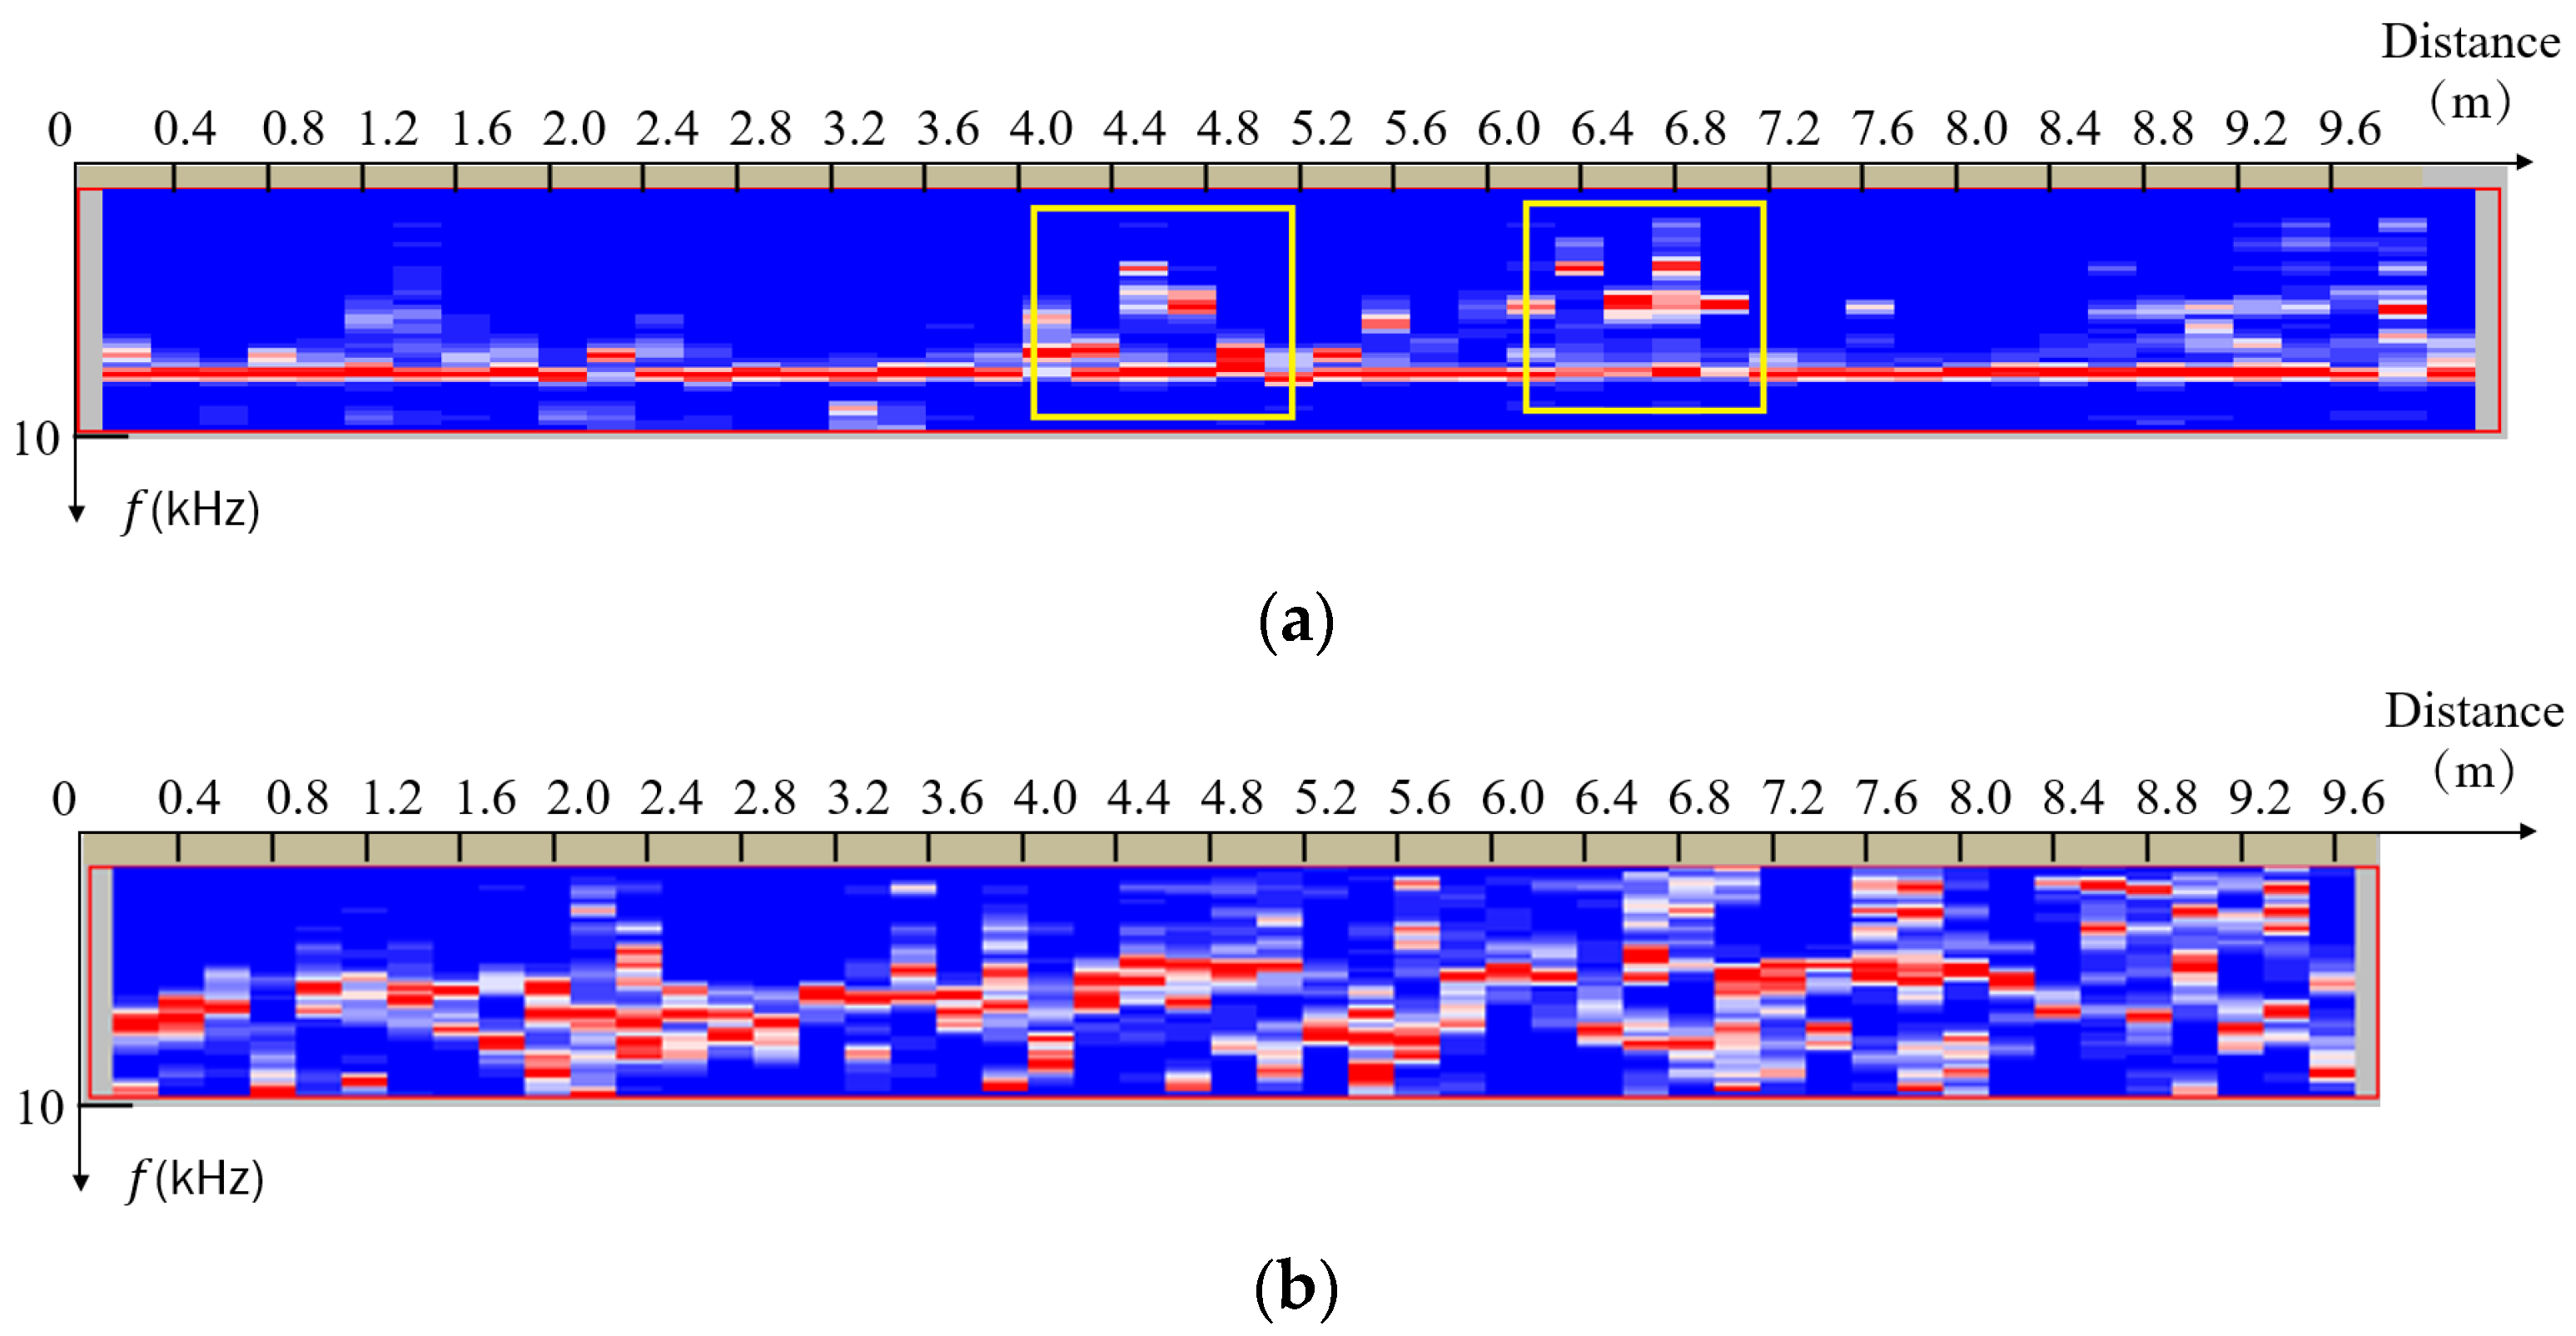
Figure 13.
Frequency spectrogram of pipeline N3. (a) Chirp signal. (b) Hammering signal.

Figure 14.
Frequency spectrogram of pipeline N2. (a) Chirp signal. (b) Hammering signal.
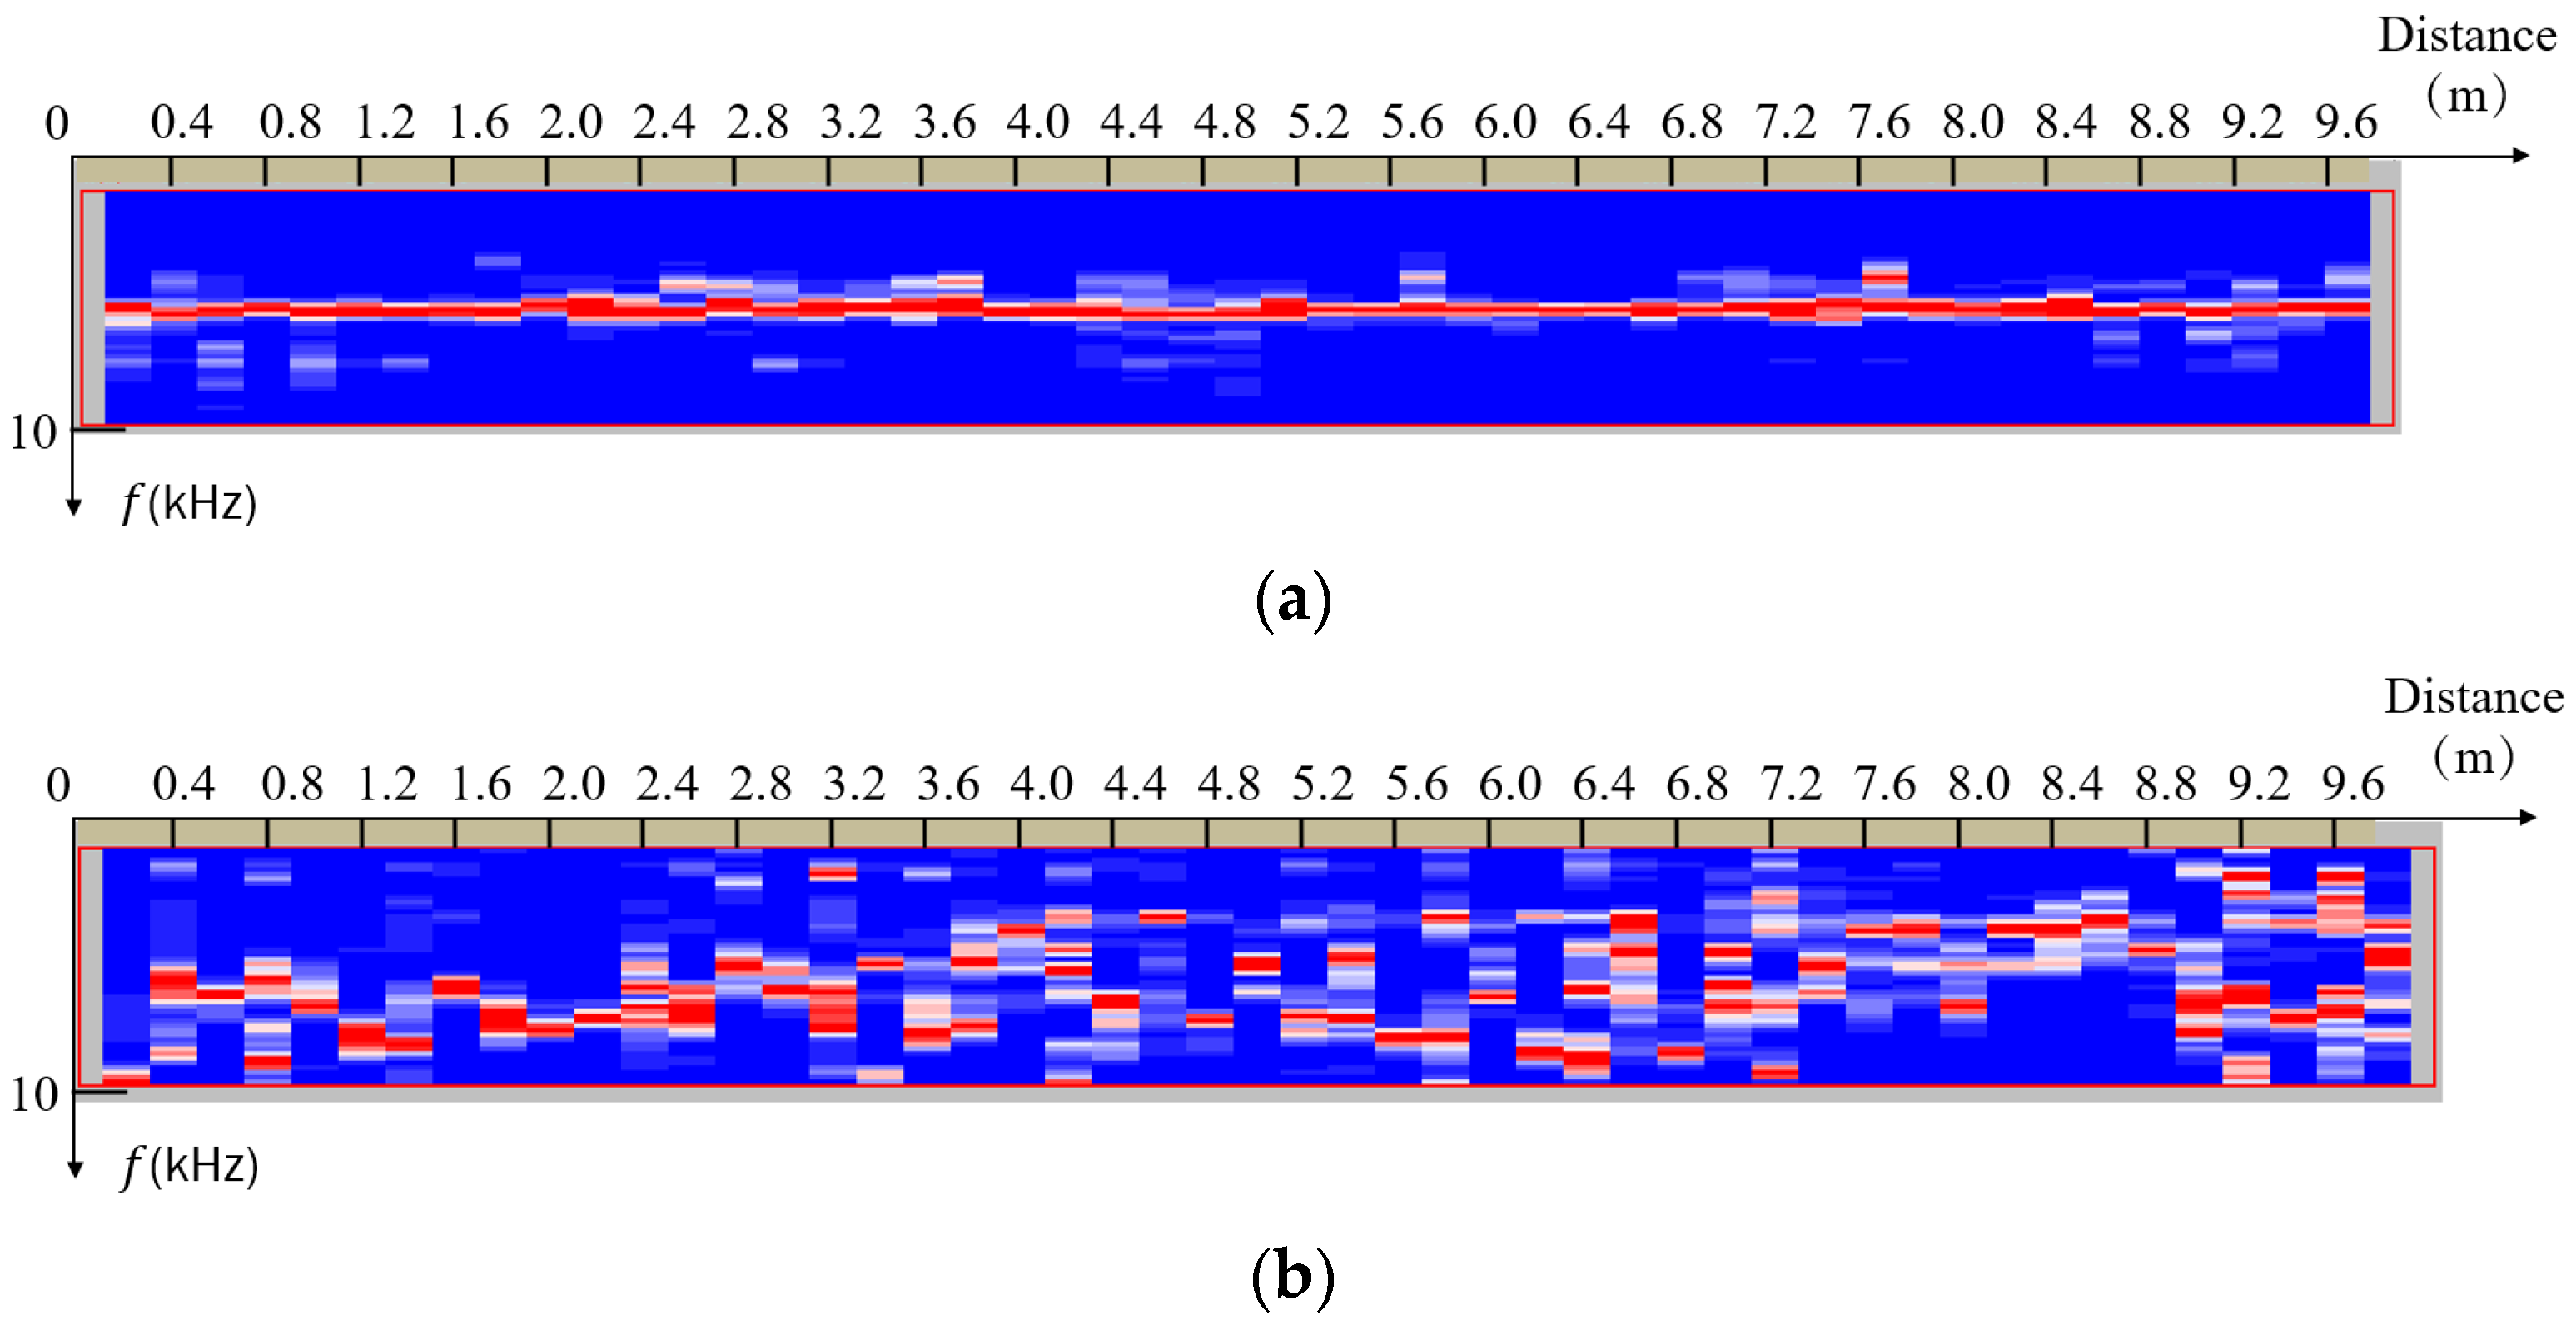
Figure 15.
Frequency spectrogram of pipeline N1. (a) Chirp signal. (b) Hammering signal.

Table 1.
Model design parameters.
| Pipeline | Length | With or Without Defects | Defect Location |
|---|---|---|---|
| N1 | 10 m | With | Completely empty, no grouting |
| N2 | 10 m | Without | No defects |
| N3 | 10 m | With | 3.25 m~3.75 m |
| N4 | 10 m | With | 4.25 m~4.75 m 6.25 m~6.75 m |
Disclaimer/Publisher’s Note: The statements, opinions and data contained in all publications are solely those of the individual author(s) and contributor(s) and not of MDPI and/or the editor(s). MDPI and/or the editor(s) disclaim responsibility for any injury to people or property resulting from any ideas, methods, instructions or products referred to in the content. |
© 2024 by the authors. Licensee MDPI, Basel, Switzerland. This article is an open access article distributed under the terms and conditions of the Creative Commons Attribution (CC BY) license (https://creativecommons.org/licenses/by/4.0/).
Share and Cite
MDPI and ACS Style
Ye, Y.; Wu, W.; Wang, Q.; Song, M.; Cai, Y.; Guo, P. Experimental Study on Grouting Quality Detection in Prestressed Pipeline Based on Scattered Wave Method. Buildings 2024, 14, 1402. https://doi.org/10.3390/buildings14051402
AMA Style
Ye Y, Wu W, Wang Q, Song M, Cai Y, Guo P. Experimental Study on Grouting Quality Detection in Prestressed Pipeline Based on Scattered Wave Method. Buildings. 2024; 14(5):1402. https://doi.org/10.3390/buildings14051402
Chicago/Turabian StyleYe, Yushan, Wenqi Wu, Qingshan Wang, Minghao Song, Yingchun Cai, and Pan Guo. 2024. "Experimental Study on Grouting Quality Detection in Prestressed Pipeline Based on Scattered Wave Method" Buildings 14, no. 5: 1402. https://doi.org/10.3390/buildings14051402
Note that from the first issue of 2016, this journal uses article numbers instead of page numbers. See further details here.