
Correlation Analysis of Tunnel Deformation and Internal Force in the Earthquake Based on Tunnel Inclination


1
School of Civil Engineering, Architecture and Environment, Hubei University of Technology, Wuhan 430068, China
2
School of Civil Engineering, Architecture and Environment, Wuhan University of Technology, Wuhan 430070, China
*
Author to whom correspondence should be addressed.
Buildings 2024, 14(5), 1395; https://doi.org/10.3390/buildings14051395
Submission received: 30 March 2024
/
Revised: 24 April 2024
/
Accepted: 28 April 2024
/
Published: 13 May 2024
(This article belongs to the Section Building Structures)
Abstract
:An increasing number of studies have shown that the seismic response of shield tunnels differs from that of aboveground structures. While the seismic response of aboveground structures is mainly influenced by the peak acceleration and frequency of the earthquake, the seismic response of shield tunnels is more influenced by the ground displacement due to the surrounding soil layers. In this study, it is not appropriate to follow the seismic concept of aboveground structures. Dynamic time-history analysis is a powerful and effective method to study the seismic response of tunnels in the typical subway in this paper. The analysis results show that the overall levelling of the tunnel will not affect the tunnel too much, and the seismic response of the tunnel is mainly related to the relative displacement of the ground around the tunnel. The analysis results show that the internal force of the tunnel and the tunnel inclination have a good linear relationship, and the tunnel inclination can be used to measure the magnitude of the seismic response of the tunnel. In the seismic design of shield tunnels, the inclination of the tunnel can be taken into account to evaluate the change in the internal forces of the tunnel during earthquakes, which avoids the need for complex dynamic time-history analysis and greatly improves the efficiency of the seismic design of shield tunnels.
1. Introduction
Compared to traditional construction methods such as cut-and-cover, the shield construction method has significant advantages such as minimal impact on the surrounding environment, construction not restricted by terrain and topography, a small footprint and a wide applicability to various geological conditions. Based on these characteristics, the shield construction method has become the preferred choice for modern urban tunnel construction in soft soil areas compared to other underground construction methods, and is widely used in the construction of urban subway tunnels, river crossing tunnels, water supply pipelines, power tunnels and other urban engineering projects.
Meanwhile, there have been several major earthquakes around the world in recent decades [1,2,3]. The devastation caused by earthquakes is horrific, with incalculable casualties and economic losses. Historically, structural damage from earthquakes has been rare due to the relatively small number of underground structures. As a result, traditional perceptions of the seismic performance of underground structures have been overly optimistic. However, the occurrence of the Kobe earthquake [4,5,6] in Japan in 1995 raised concerns about the seismic performance of underground structures. In the Kobe earthquake, the drainage pipe system, one of the lifelines of modern cities, suffered fractures, cracks and joint separation, resulting in a loss of function. Kobe’s major subway stations were also badly damaged, and the subway tunnels suffered minor damage. The Chi-Chi earthquake [7,8,9] in Taiwan in September 1999 and the Wenchuan earthquake [10,11] in May 2008 also caused some damage to underground structures [12,13,14].
In the case of tunnels, even if they do not collapse completely in an earthquake, extensive damage that affects their use may be difficult to repair [15]. Therefore, it is important to consider the seismic performance of tunnels [15,16,17] to ensure their safety and to meet the seismic requirements of shield tunnels in modern society.
Numerical analysis methods are essential for studying the seismic resistance of shield tunnels [18,19]. With the rapid development of computer technology, numerical analysis methods have made significant progress. These methods consider a wider range of factors, allowing detailed analysis of the combined effects of various factors to better meet engineering requirements. Research on numerical methods [20,21] has attracted much attention from scholars around the world and has produced many results. When studying the seismic characteristics of tunnels, the use of numerical calculation methods makes it possible to simulate soil layers, tunnel linings, etc. to treat the soil, foundation and structural parts of the site as a whole calculation; to obtain the dynamic response of the structure and the soil; to consider the dynamic properties of the soil such as heterogeneity and nonlinearity; to analyse the combined effects of several factors; and to make the structural analysis more realistic, such as different seismic wave effects, different constitutive models and different terrain conditions [22]. Many studies have also proposed various indicators to measure the damage index of tunnels in earthquakes, such as lateral convergence of tunnels [23], deformation rate [24], joint angle [25], etc.
Studies have shown that the seismic response of tunnels differs from that of aboveground structures [26]. The seismic response of aboveground structures is closely related to the peak acceleration and frequency of earthquakes, and the aboveground structures may have different vibration modes under seismic action [27,28]. In contrast, the seismic response of shield tunnels is strongly influenced by the ground displacement due to the presence of the surrounding soil layer and is not closely related to the peak acceleration and frequency of earthquakes [29,30,31]. Therefore, for the seismic design of shield tunnels, it is not appropriate to follow the calculation methods and indices of aboveground structures. The existence of the soil layer makes the dynamic time analysis of shield tunnels more difficult and time-consuming, and it is more difficult to be applied in the design of shield tunnels. In order to make the seismic analysis of shield tunnels widely applied in the design, this paper adopts the dynamic time-history analysis method to analyse typical underground tunnels, establishes the relationship between the internal force and the deformation of tunnels in earthquakes and proposes the tunnel inclination to measure the dynamic response of tunnels in earthquakes. It is expected that the tunnel inclination will be directly used to measure the tunnel response, avoiding the complex dynamic time-course analysis, reducing the difficulty of the seismic design of shield tunnels and improving the efficiency of the seismic design of shield tunnels.
2. Dynamic Time-History Analysis of the Shield Tunnel
A shield tunnel section of the Metro is selected for dynamic time-history analysis of its seismic response, analysing the tunnel’s internal force response and deformation response.
2.1. Model Calculation Range
To mitigate the artificial boundary surface reflection waves in dynamic calculations, the calculation range can be increased to dissipate the reflection waves by using the inherent damping effect of the soil. However, if the computational domain is too large, it will increase the computational cost and reduce the work efficiency. By setting free field boundary conditions around the calculation model, the free field can be effectively simulated, reducing the impact of reflected waves. Therefore, the calculation area of the model should be selected reasonably. Professor Lou Menglin’s research [32] showed that when the ratio of the size of the foundation plane to the size of the structure plane is greater than 5, the dynamic calculation results tend to be stable and the effect of the lateral boundary can be ignored. The experimental results of Chen Yueqing [33] also show that if the ratio of the size of the free field plane to the width of the model structure is greater than 2, the effect of the lateral boundary can be ignored. Based on these above principles, the width of the computational model in this example is set to 100 m.
In dynamic time-history analysis, it is generally advisable to select the soil layer with a seismic shear wave velocity greater than 300 m/s as the seismic bedrock surface. The soil layers at 70 m depth generally meet this condition, so the depth of the calculation model can be set to 70 m.
2.2. Model Calculation Parameters
The tunnel is constructed using the shield method, and the whole ring of segment is divided into one top block F (16°), two adjacent blocks L (65°), two standard blocks B (65°) and one bottom block (84°). The blocks are connected by M30 bolts, with an outer diameter of 6.2 m and an inner diameter of 5.5 m. The depth of burial of the centre of the tunnel is −17.1 m and the soil layers through which the tunnel passes are mainly layer ④ soil and layer ⑤ 1 soil. The cross section of the tunnel and soil layers are shown in Figure 1. Soil parameters can be obtained from geological survey data. The material parameters of each soil layer are shown in Table 1.
The reinforced concrete pipe sheet is made of C50 high-performance concrete, and its material parameter indicators are shown in Table 2.
2.3. Treatment of Seismic Waves
For aboveground structures, due to the fact that the self-oscillation frequencies of different structures are not identical, it is often necessary to consider the seismic response with different vibration modes in different earthquakes [34]. Due to the constraints of the surrounding ground, the shield tunnel does not vibrate freely by resonance and its seismic response is not sensitive to different frequencies of seismic waves. Therefore, instead of selecting several seismic waves with different frequencies for calculation, only one seismic wave is selected for calculation. The tunnels in this paper are selected from the Shanghai area, in which the seismic design intensity is a 7 degree, and the peak ground acceleration of the earthquake is 0.1 g. There is no similar record of actual seismic waves in the Shanghai area historically. Therefore, an artificial seismic wave with a maximum acceleration of 0.1 g at the surface is selected for the calculation, and in order to eliminate the residual velocity and displacement of the seismic wave, the seismic wave is baseline-corrected so that the final velocity and displacement of the seismic wave are 0. The acceleration time scale, velocity time scale and displacement time scale of the bedrock input seismic wave used in the example are shown in Figure 2, Figure 3 and Figure 4.
2.4. Division of the Grid
In the direction of seismic wave propagation, the maximum grid size should be less than 1/8 of the wavelength corresponding to the highest frequency of the input waveform [35], and the maximum cell sizes for different soil materials and tunnels to satisfy the accuracy of the dynamic calculation are given in Table 3. With this as a limiting condition, the computational model can be meshed and the meshing is shown in Figure 5.
2.5. Tunnel Seismic Calculation Process
After the calculation model is established, the calculation can be started, and the calculation process is mainly divided into three steps as follows:
(1) Calculation of soil gravity stress field
The bottom of the calculation model is constrained in the horizontal and vertical directions and the sides are constrained in the horizontal direction and free in the vertical direction so that the soil body reaches equilibrium under the action of self-gravity; that is, the calculation of the soil body’s self-gravity stress field is completed.
(2) Tunnel excavation analysis
Excavate the soil body in which the tunnel is located and impose the lining unit to simulate the lining after the equilibrium calculation; that is, complete the tunnel excavation calculation.
(3) Calculation of the tunnel dynamic time history
The soil body is given the corresponding damping parameters, the free field boundary is applied around the model, the viscous boundary is applied at the bottom and the seismic effect is input at the bottom to start the calculation. After the vibration of the model stops, the calculation reaches equilibrium, which is the completion of the calculation of the tunnel dynamic time history.
3. Analysis of the Results of Seismic Response Calculations for Metro Tunnels
3.1. Internal Force Response Analysis
Under seismic loading, the internal force of the tunnel structure may be greater or less than under conventional loading. Figure 6 and Figure 7 show the envelope diagrams of the bending moment and the axial force of the tunnel under seismic loading, respectively. From Figure 6, it can be seen that the bending moments at 0°, 90°, 180° and 270° of the tunnel are greater under conventional loading, while the bending moments at these locations do not vary greatly under seismic loading. A similar pattern can be found in Figure 7, which indicates that the seismic loading does not have too great an effect on the bending moments and axial forces at 0°, 90°, 180° and 270° of the tunnel.
Table 4 shows the distribution of the extreme values of the bending moments and axial forces in Figure 6 and Figure 7. It is easy to see from Table 4 that the distribution of the extreme values of the bending moments and axial forces under seismic loading is quite different from that under conventional loading, and none of them appear in the parts where the bending moments under conventional loading are large, such as at 0°, 90°, 180°, 270°, etc. The maximum values of the bending moments occur at 169°, 180°, 270°, etc. The maximum value of the bending moment occurred at 169°, which was 18.2% larger than the conventional bending moment at the corresponding location, and the maximum value of the negative bending moment occurred at 253°, which was 43.6% larger than the conventional bending moment at the corresponding location.
Figure 8 shows the variation of the tunnel bending moment with time under the effect of the earthquake. Consistent with the bending moment envelope shown in Figure 6, the tunnels at 180° and 270° are less affected by the earthquakes, with a small range of variation of less than 10 kNm. The tunnels at 169° and 253° are more affected by the earthquakes, with a range of variation of about 22 kNm at 169° and about 45 kNm at 253°.
Due to the different burial depths of the top and bottom of the tunnel, there is generally a relative displacement between the surrounding soils under seismic action, and Figure 9 shows the changes in the relative displacement of the surrounding soils under seismic action. From Figure 9, it can be seen that the relative displacement of the ground at the top and bottom of the tunnel reaches its maximum value in the positive and negative directions after the earthquake for 7.32 s and 7.58 s, respectively, which is 0.45 cm and 0.35 cm. Figure 8 shows that, except for a few points (at 169°), the bending moment of the tunnel reaches the maximum or minimum value after the earthquake occurs at about 7.32 s and 7.58 s. This indicates to some extent that, due to the restraining effect of the soil around the tunnel, the seismic response of the tunnel is closely related to the relative displacement of the surrounding soil, and the greater the relative displacement of the soil near the top and bottom of the tunnel, the greater the bending moment generated by the tunnel.
Under seismic loading, the axial force of the tunnel is relatively small compared to the bending moment; even the axial force in the largest part of the tunnel (249°) increases by only 2.7% compared to the axial force under conventional loading. Figure 10 shows the time history of the axial force at 249° of the tunnel, which fluctuates within a range of about 27 kN, and the maximum axial force is reached here after 7.32 s of the seismic event, which is the same time as the maximum relative displacement of the ground near the top and bottom of the tunnel. The time at which the axial force reaches its maximum is also consistent with the time at which the relative displacement of the ground near the top and bottom of the tunnel reaches its maximum, showing that the magnitude of the axial force and the relative displacement of the ground around the tunnel are also correlated.
3.2. Deformation Response Analysis
Under the action of the artificial wave, the extreme value of the internal force of the tunnel generally occurred in the vicinity of 7.32 s and 7.58 s after the occurrence of the earthquake. In order to further analyse the relationship between the change in the internal force of the tunnel and the displacement of the surrounding soil body under the action of the earthquake, Figure 11 shows the deformation of the tunnel under the action of the soil body after the earthquakes occurred at 7.32 s, 7.58 s and 7.92 s. The dashed circle indicates the initial state of the tunnel when the earthquake did not occur, i.e., 0.00 s, and the solid line indicates the state of the tunnel after the earthquake. To make the deformation of the tunnel more visible, the displacements in the figure have been magnified by a factor of 300. Figure 12 and Figure 13 show the changes in the bending moment and the axial force of the tunnel after 7.32 s, 7.58 s and 7.92 s, respectively.
As shown in Figure 11, after the 7.32 s earthquake, the x-direction displacement of the tunnel vault at point A was −1.07 cm, and the x-direction displacement of the vault floor at point B was −1.52 cm; after the 7.58 s, the x-direction displacements of the vault and the arch bottom were −3.25 cm and −2.9 cm, respectively; and after the earthquake occurred 7.92 s, the x-direction displacements of the vault and the arch bottom reached −4.08 cm and −4.09 cm, respectively. Comparing with Figure 12 and Figure 13, it can be seen that when the earthquake occurred at 7.32 s, the total displacement of the tunnel was relatively small, but the relative displacements of each part of the tunnel were larger, the shape change was large and the corresponding bending moment and axial force were large, while the total displacement of the tunnel was larger, but the relative displacements of each part were small, the shape change was small and the corresponding bending moment and axial force were large. After 7.92 s, the total displacement of the tunnel is larger, but the relative displacement of each part is smaller, the shape change is small and the corresponding bending moment and axial force change are small, which indicates that the total displacement of the tunnel caused by the earthquake does not bring a large additional internal force to the tunnel, and the main reason for the change in the internal force of the tunnel is the relative displacement of each part of the tunnel.
If the bottom of the tunnel is taken as an immobile point, the displacement of other points in the tunnel relative to the bottom of the tunnel can be obtained. Figure 14 shows the relative displacement of the tunnel after the earthquake at 7.32 s and 7.58 s. Similarly, the dashed circle shows the initial state of the tunnel without the earthquake and the solid line shows the state of the tunnel after the earthquake, and the displacements in the figure have been magnified by a factor of 300. The lines AA, BB, CC and DD in Figure 14 are the diameters between 0° and 180°, 45° and 225°, 90° and 270° and 135° and 315°, in that order. Combined with Figure 12 and Figure 13, it can be seen that when the tunnel vault undergoes a positive x-displacement with respect to the bottom of the tunnel, the bending moments in the ranges 0° to 90° and 180° to 270° decrease while the axial forces increase, and the bending moments in the ranges 90° to 180° and 270° to 360° increase while the axial forces decrease. When the negative x-displacement of the tunnel vault occurs relative to the bottom of the tunnel, the change rule of the bending moment and the axial force is just the opposite. The bending moment increases and the axial force decreases in the range of 0° to 90° and 180° to 270°, and the bending moment decreases and the axial force increases in the range of 90° to 180° and 270° to 360°. These rules of change are to the tunnel diameter AA and diameter CC as the dividing line and change, indicating that there is a certain relationship between the change in the internal force of the tunnel and the change in the tunnel diameter.
In order to measure the magnitude of the deformation of the tunnel, the rate of change of the tunnel diameter can be used as a benchmark, which is defined in Equation (1)
It is worth noting that the relative displacements at 7.32 s and 7.58 s of the tunnel are approximately symmetrical about the diameter from 0° to 180°, as shown in Figure 15. Accordingly, the bending moments and axial forces at the corresponding moments are also approximately symmetrical about the diameter from 0° to 180°, as shown in Figure 16 and Figure 17.
If the tunnel is a symmetrical structure, the direction of the relative displacement does not affect the magnitude of the internal forces in the tunnel. The magnitude of the internal forces in the tunnel is only related to the magnitude of the relative displacement, which increases the extreme value of the internal forces in the tunnel and decreases the extreme value of the internal forces in the tunnel as the relative displacement decreases. Therefore, the tunnel inclination can be considered as a measure of the seismic effect on the tunnel. The definition of tunnel inclination is given in Equation (2)
where is the tunnel inclination, is the displacement of the top of the tunnel relative to the bottom and is the outer diameter of the tunnel. When the displacement of the top of the tunnel relative to the bottom is in the x-direction, the tilt is positive when the agreed x-direction is positive, and negative when the relative displacement is negative.
3.3. Analysis of the Relationship between the Internal Forces and the Tunnel Inclination
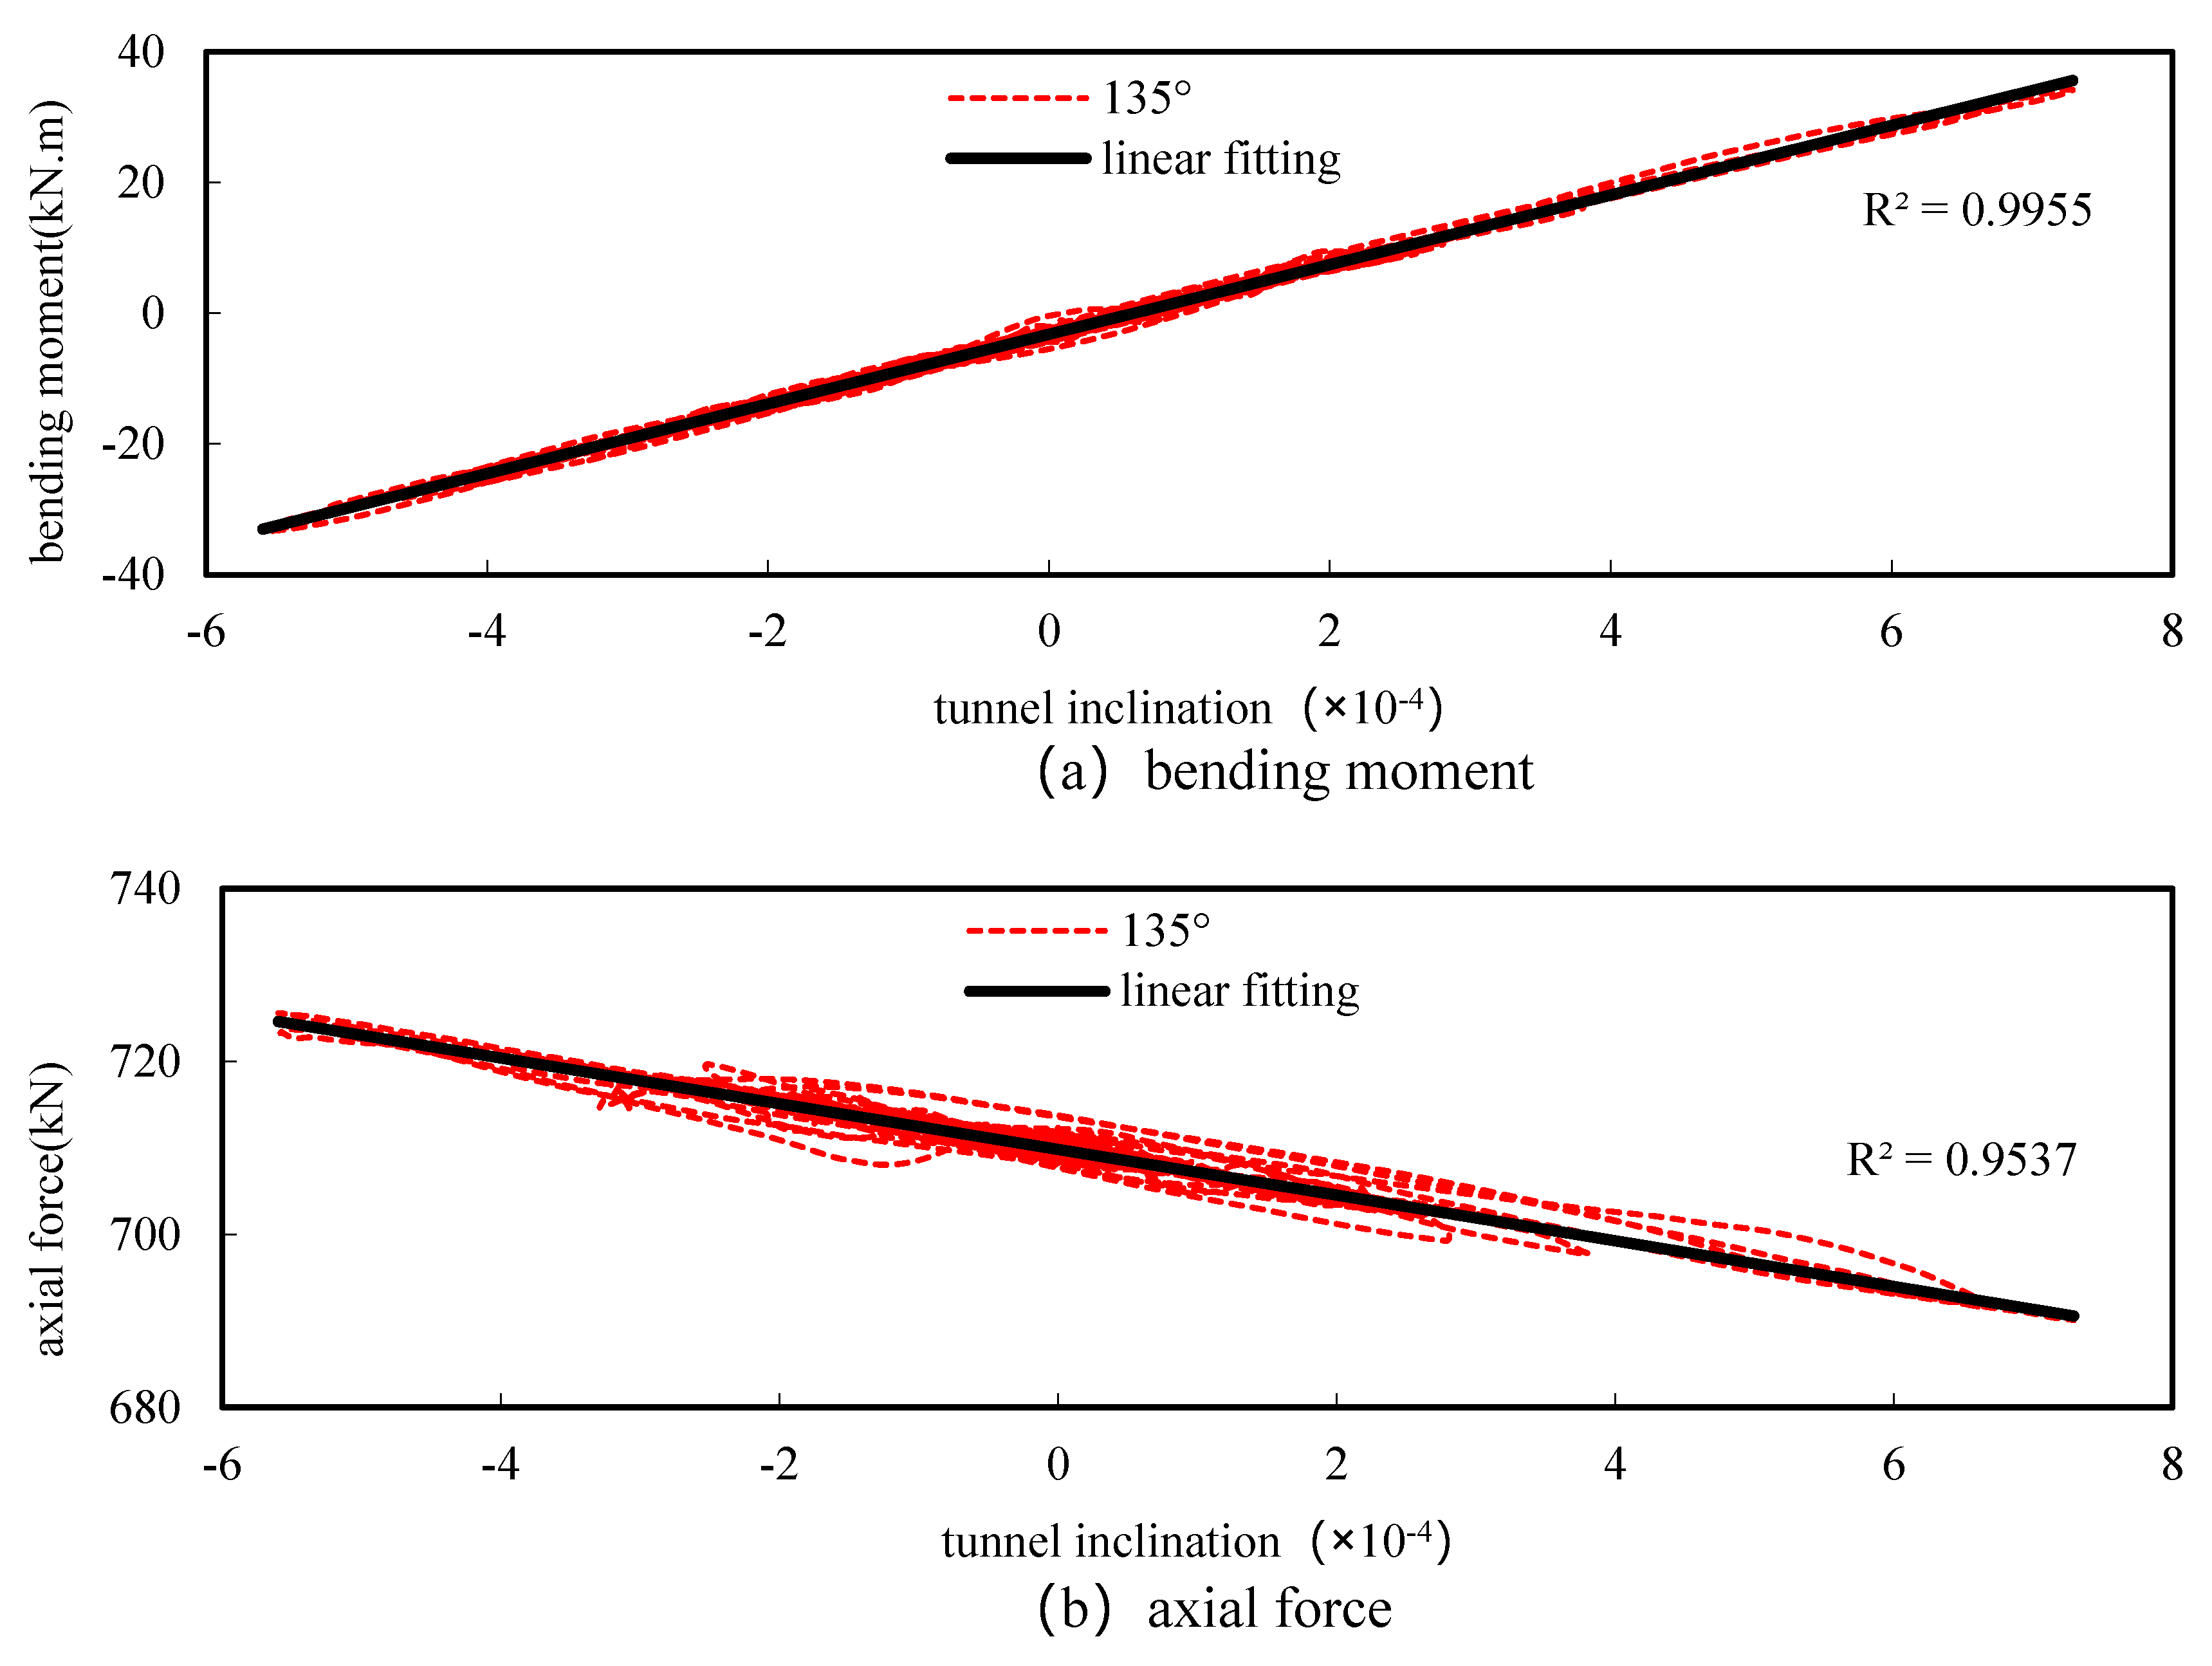
Figure 18, Figure 19, Figure 20, Figure 21, Figure 22, Figure 23, Figure 24 and Figure 25 show the relationship between the internal forces and the tunnel inclination at various representative locations. Figure 18, Figure 19, Figure 20 and Figure 21 show the extreme points of the internal forces in the tunnel according to Table 4. Figure 22 and Figure 23 show the locations where there is little change in the internal forces under seismic action, such as the bottom of the tunnel (at 180°) and the horizontal diameter of the tunnel (at 270°). Figure 24 and Figure 25 show the locations where the positive and negative bending moments change considerably under seismic action (at 45° and 135°).
From Figure 18, Figure 19, Figure 20, Figure 21, Figure 22, Figure 23, Figure 24 and Figure 25, it can be seen that there is a linear relationship between the bending moment and the inclination in all parts of the tunnel and the fit is high, and there is also a linear relationship between the axial force and the inclination but the fit is not as high as that of the bending moment. This is because under seismic action, the magnitude of change in the bending moment is relatively large, and the magnitude of change in the axial force is relatively small. In addition, the local difference in the bending moment is small relative to the magnitude of change, and therefore does not affect the overall fitting results, while the local difference in the axial force is large relative to the magnitude of change, and then it affects the overall fitting results. This is particularly evident at the horizontal diameter of the tunnel (270°), where the magnitude of change in the internal force is small, which has the worst fitting results. However, in general, under seismic action, the internal forces of the tunnel and the tunnel inclination basically show a good linear relationship, and it is feasible to use the tunnel inclination to measure the magnitude of the internal forces of the tunnel under seismic action.
4. Conclusions and Discussion
A typical Metro shield tunnel is calculated by dynamic time-history analysis, and the tunnel inclination was introduced to analyse the seismic response characteristics of Metro shield tunnels under the action of artificial seismic waves. Some laws of the seismic response of Metro tunnels are summarised as follows:
(1) Under seismic action, the distribution of both the bending moment and the axial force of the tunnel changes, and the location of their extreme point is different from that under conventional loading.
(2) Under seismic action, the bending moment of the tunnel has a large fluctuation, while the axial force fluctuation is relatively small. Meanwhile, the bending moments at 0°, 90°, 180°, 270° and other parts of the tunnel change less under seismic action, while the bending moments at 45°, 135°, 225°, 315° and other parts of the tunnel alternate between positive and negative with a larger fluctuation.
(3) Under seismic action, the bending moment decreases and the axial force increases in the parts of the tunnel whose diameters are subjected to tension, while the bending moment increases and the axial force decreases in the parts of the tunnel whose diameters are subjected to compression.
(4) The overall levelling of the tunnel will not affect the tunnel too much, and the seismic response of the tunnel is mainly related to the relative displacement of the soil surrounding the tunnel, which increases, and the corresponding changes in the internal forces and deformations of the tunnel also increase.
(5) The change of the internal force of the tunnel and the tunnel inclination show a good linear relationship, and the tunnel inclination can be introduced to measure the magnitude of the seismic response of the tunnel.
(6) Tunnel inclination is introduced to measure the magnitude of the tunnel seismic response, which improves on the irrationality of using peak seismic acceleration or relative ground displacement alone to measure the magnitude of the tunnel seismic response. The potential damage to the tunnel during an earthquake can be predicted in the design by estimating the ground displacement, and the damage to the tunnel during an earthquake can be assessed by monitoring the deformation of the tunnel.
(7) This paper adopts a homogenised model for the tunnel model and does not consider the joints, which can be used to further refine the relationship between the tunnel inclination and the tunnel joint stress and the internal force of the joint bolts, in order to more comprehensively assess the performance of tunnels in earthquakes.
(8) Large-diameter tunnels may be located in different soil layers and it is worthwhile to further investigate how stratigraphic variability affects the seismic performance of tunnels, and the results of this study have some role in guiding the selection of tunnels in seismic zones.
(9) Although seismic waves of different frequencies lead to different ground displacements, which in turn lead to changes in the seismic response of the tunnel, this phenomenon can be attributed to the relationship between the tunnel inclination and the tunnel seismic response. In a follow-up study, the effects of different seismic waves on tunnels will be investigated in more detail to prove this conclusion.
Author Contributions
Z.Y.: methodology; Z.Y. and Y.L.: software; C.C.: investigation. All authors have read and agreed to the published version of the manuscript.
Funding
This research was funded by The Technology Innovation Project of Hubei Province (Key Program, No. 2023BEB010), The Key Research and Development Program of Hubei Province (No. 2023BCB116) and The Key Research and Development Program of Hubei Province (No. 2023BAB024).
Data Availability Statement
Some or all of the data, models, or code that support the findings of this study are available from the corresponding author upon reasonable request. The authors declare that they have no known competing financial interests or personal relationships that could have appeared to influence the work reported in this paper.
Conflicts of Interest
The authors declare no conflicts of interest.
References
- Lin, Z.; Zhu, H.-H.; Yang, C.; Yang, L.-D. Anti-seismic Calculation for Shield Tunnels. J. Tongji Univ. 2004, 5, 607–611. [Google Scholar]
- Liu, J.; Li, B. Issues on the seismic analysis and design of subway structures. China Civ. Eng. J. 2006, 6, 106–110. [Google Scholar]
- Liu, J.; Li, B.; Liu, X. A static elasto-plastic analysis method in seismic design of underground structures. China Civ. Eng. J. 2007, 40, 68–76. [Google Scholar]
- He, Z.; Man, J.; Song, Y.; Xu, W.; Pang, Y. Longitudinal seismic displacement analysis of Quasi Seismic Isolation Bridge based on Energy-based Multimodal Pushover Method with and without collision. Soil Dyn. Earthq. Eng. 2024, 177, 108365. [Google Scholar] [CrossRef]
- Zhang, J.; Jia, J. Research on the Seismic Isolation Effect of the Ring Spring–Friction Pendulum Bearing in the Dakai Underground Subway Station. Appl. Sci. 2023, 13, 7093. [Google Scholar] [CrossRef]
- Lin, M.-L.; Lin, C.-H.; Li, C.-H.; Liu, C.-Y.; Hung, C.-H. 3D modeling of the ground deformation along the fault rupture and its impact on engineering structures: Insights from the 1999 Chi-Chi earthquake, Shigang District, Taiwan. Eng. Geol. 2021, 281, 105993. [Google Scholar] [CrossRef]
- Malekzadeh, M.; Shayanfar, M. Numerical Study on Seismic Behavior of Flexural Frames with Semi-Rigid Welded Steel Connections Considering Static and Reciprocating Loads: A Performance-Based Earthquake Approach. Appl. Sci. 2022, 12, 7617. [Google Scholar] [CrossRef]
- Cai, X.; Yang, C.; Yuan, Y. Hybrid Simulation of Seismic Responses of a Typical Station with a Reinforced Concrete Column. Appl. Sci. 2020, 10, 1331. [Google Scholar] [CrossRef]
- Amorosi, A.; Boldini, D.; Elia, G. Parametric study on seismic ground response by finite element modelling. Comput. Geotech. 2010, 37, 515–528. [Google Scholar] [CrossRef]
- Ming, S.; Tao, L.; Wang, Z. Shaking Table Tests on the Seismic Response of Symmetrically Integrated Underground Stations. Symmetry 2024, 16, 232. [Google Scholar] [CrossRef]
- Wen, H.; Zhou, Z.; Li, X.; Song, D.; He, Z.; Xin, C. Evaluation of the Damping Layer between the Tunnel Lining and Surrounding Rock via a Shaking Table Test. Sustainability 2023, 15, 13244. [Google Scholar] [CrossRef]
- Chen, C.; Zou, W.; Geng, P.; Gu, W.; Yuan, F.; He, C. Study on Seismic Damage Risk Assessment of Mountain Tunnel Based on the Extension Theory. Sustainability 2023, 15, 5294. [Google Scholar] [CrossRef]
- Shen, J.; Bao, X.; Chen, X.; Wu, X.; Cui, H. Prediction of Tunnel Earthquake Damage Based on a Combination Weighting Analysis Method. Symmetry 2022, 14, 1922. [Google Scholar] [CrossRef]
- Wang, T.-T.; Kwok, O.-L.A.; Jeng, F.-S. Seismic response of tunnels revealed in two decades following the 1999 Chi-Chi earthquake (Mw 7.6) in Taiwan: A review. Eng. Geol. 2021, 287, 106090. [Google Scholar] [CrossRef]
- Lu, C.; Hwang, J.-H. Damage analysis of the new Sanyi railway tunnel in the 1999 Chi-Chi earthquake: Necessity of second lining reinforcement. Tunn. Undergr. Space Technol. 2018, 73, 48–59. [Google Scholar] [CrossRef]
- Jiang, J.; Tao, R.; El Naggar, M.H.; Liu, H.; Du, X. Seismic performance and vulnerability analysis for bifurcated tunnels in soft soil. Comput. Geotech. 2024, 167, 106065. [Google Scholar] [CrossRef]
- Zhang, S.; Yuan, Y.; Yang, Y.; Li, C.; Yu, H. Experimental investigation of seismic performance of segmental tunnel with secondary lining under strong earthquake. Structures 2024, 60, 105833. [Google Scholar] [CrossRef]
- Sun, Q.; Hou, M.; Dias, D. Numerical study on the use of soft material walls to enhance seismic performance of an existing tunnel. Undergr. Space 2024, 15, 90–112. [Google Scholar] [CrossRef]
- Zou, Y.; Zhang, Y.; Liu, H.; Liu, H.; Miao, Y. Performance-based seismic assessment of shield tunnels by incorporating a nonlinear pseudostatic analysis approach for the soil-tunnel interaction. Tunn. Undergr. Space Technol. 2021, 114, 103981. [Google Scholar] [CrossRef]
- Liu, L.; Xu, C.; Du, X.; Iqbal, K. Longitudinal seismic response of shield tunnel: A multi-scale numerical analysis. Tunn. Undergr. Space Technol. 2023, 138, 105163. [Google Scholar] [CrossRef]
- Shekari, M.R.; Amiri, S.M.; Zareifard, M.R. A numerical approach for coupled analysis of the seismic response of a cable-moored submerged floating tunnel. Mar. Struct. 2022, 83, 103156. [Google Scholar] [CrossRef]
- Li, P.; Song, E.-X. Three-dimensional numerical analysis for the longitudinal seismic response of tunnels under an asynchronous wave input. Comput. Geotech. 2015, 63, 229–243. [Google Scholar] [CrossRef]
- Andreotti, G.; Lai, C.G. Use of fragility curves to assess the seismic vulnerability in the risk analysis of mountain tunnels. Tunn. Undergr. Space Technol. 2019, 91, 103008. [Google Scholar] [CrossRef]
- Fabozzi, S.; Bilotta, E.; Lanzano, G. A numerical study on seismic vulnerability of tunnel linings. In Proceedings of the 3rd Performance Based Design in Earthquake Geotechnical Engineering, Vancouver, BC, Canada, 16–19 July 2017; pp. 16–19. [Google Scholar]
- Moayedifar, A.; Nejati, H.R.; Goshtasbi, K.; Khosrotash, M. Seismic fragility and risk assessment of an unsupported tunnel using incremental dynamic analysis (IDA). Earthq. Struct. 2019, 16, 705. [Google Scholar]
- Yu, H.; Chen, J.; Bobet, A.; Yuan, Y. Damage observation and assessment of the Longxi tunnel during the Wenchuan earthquake. Tunn. Undergr. Space Technol. 2016, 54, 102–116. [Google Scholar] [CrossRef]
- Jan, T.S.; Liu, M.W.; Kao, Y.C. An upper-bound pushover analysis procedure for estimating the seismic demands of high-rise buildings. Eng. Struct. 2004, 26, 117–128. [Google Scholar] [CrossRef]
- Ye, L.; Pan, W. The Principle of Nonlinear Static Analysis (Push-over) and Numerical Examples. J. Build. Struct. 2000, 21, 37–43. [Google Scholar]
- Liu, J.; Li, B.; Liu, X. A pushover analysis method for seismic analysis of underground subway structures. J. Disaster Prev. Mitig. Eng. 2007, 27, 303–307. [Google Scholar]
- Fujiki, I.; Nakajima, M.; Otsuka, T.; Kosaka, A. Observation of earthquake response of subway tunnel. JSCE 1994, 11, 245–250. [Google Scholar]
- Koichiro, M.; Atsushi, K. A basic study on the earthquake resistant design method of shield tunnel in transverse direction. JSCE 2001, 9, 107–123. [Google Scholar]
- Lou, M.; Wu, J. Seimic response analysis of pile foundation structure system. China Civ. Eng. J. 1999, 5, 56–61. [Google Scholar]
- Chen, Y.; Lv, X.; Li, P. Shaking table testing for layered soil-foundation-structure interaction system. Earthq. Eng. Eng. Vib. 2001, 21, 104–112. [Google Scholar] [CrossRef]
- Demir, A.; Kayhan, A.H.; Palanci, M. Response- and probability-based evaluation of spectrally matched ground motion selection strategies for bi-directional dynamic analysis of low- to mid-rise RC buildings. Structures 2023, 58, 105533. [Google Scholar] [CrossRef]
- Lysmer, J.; Kuhlemeyer, R.L. Finite Dynamic Model for Infinite Media. J. Eng. Mech. Div. 1969, 95, 859–878. [Google Scholar] [CrossRef]
Figure 1.
Cross section of the tunnel and soil layers (m).
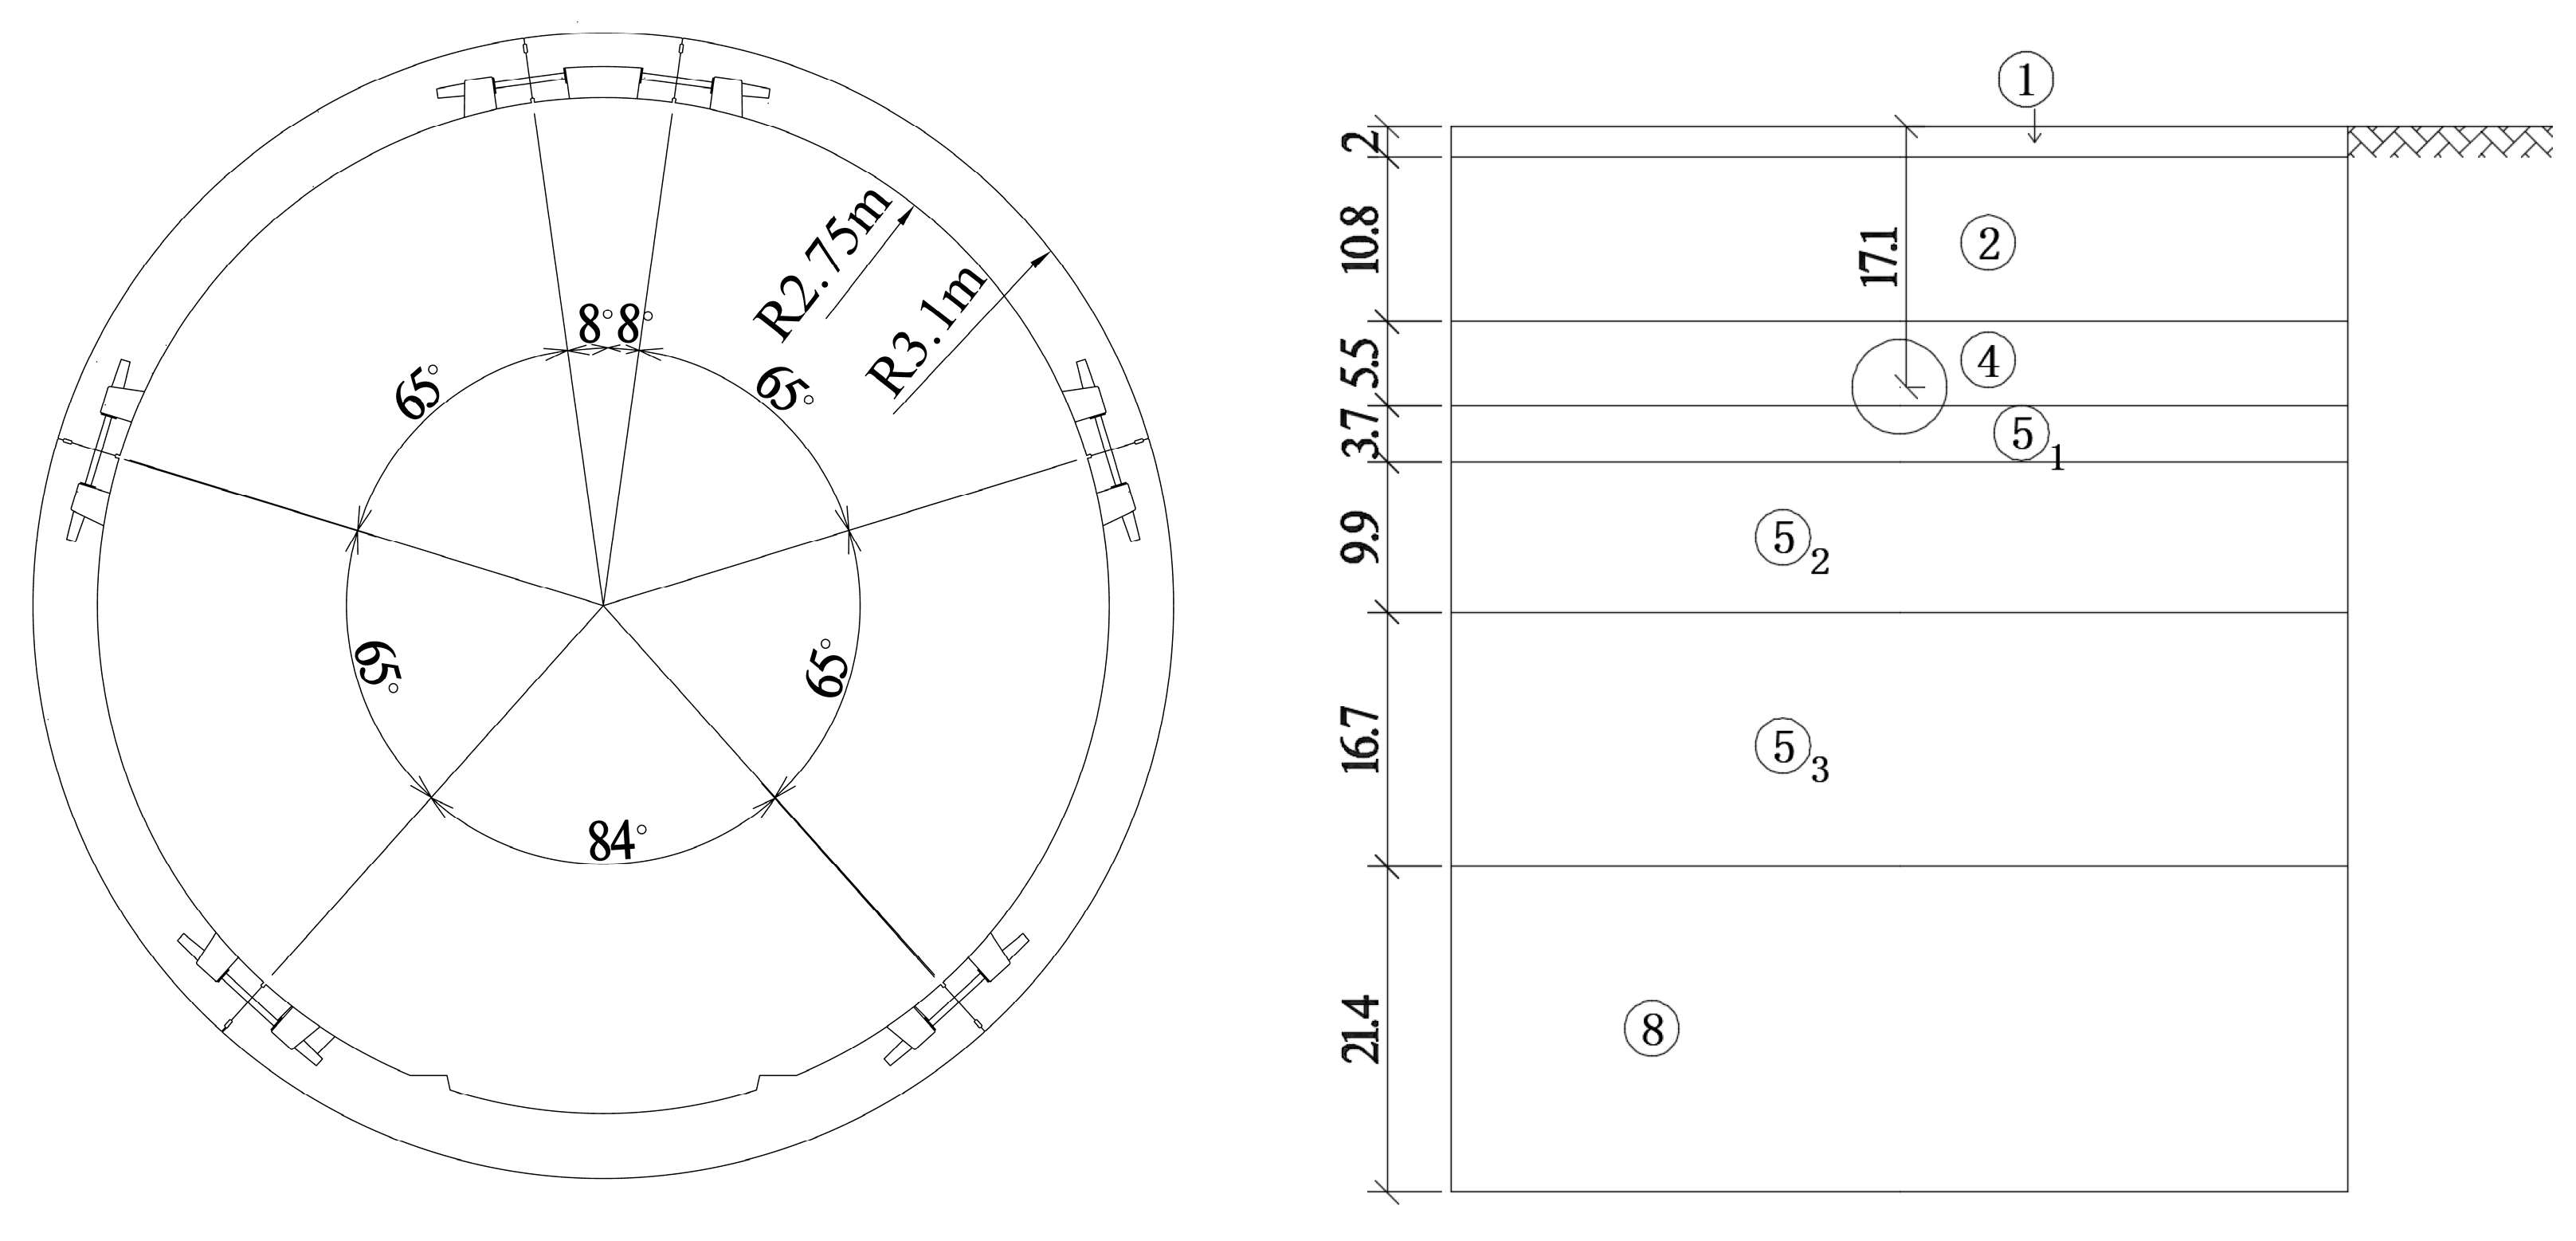
Figure 2.
Seismic wave acceleration time history.
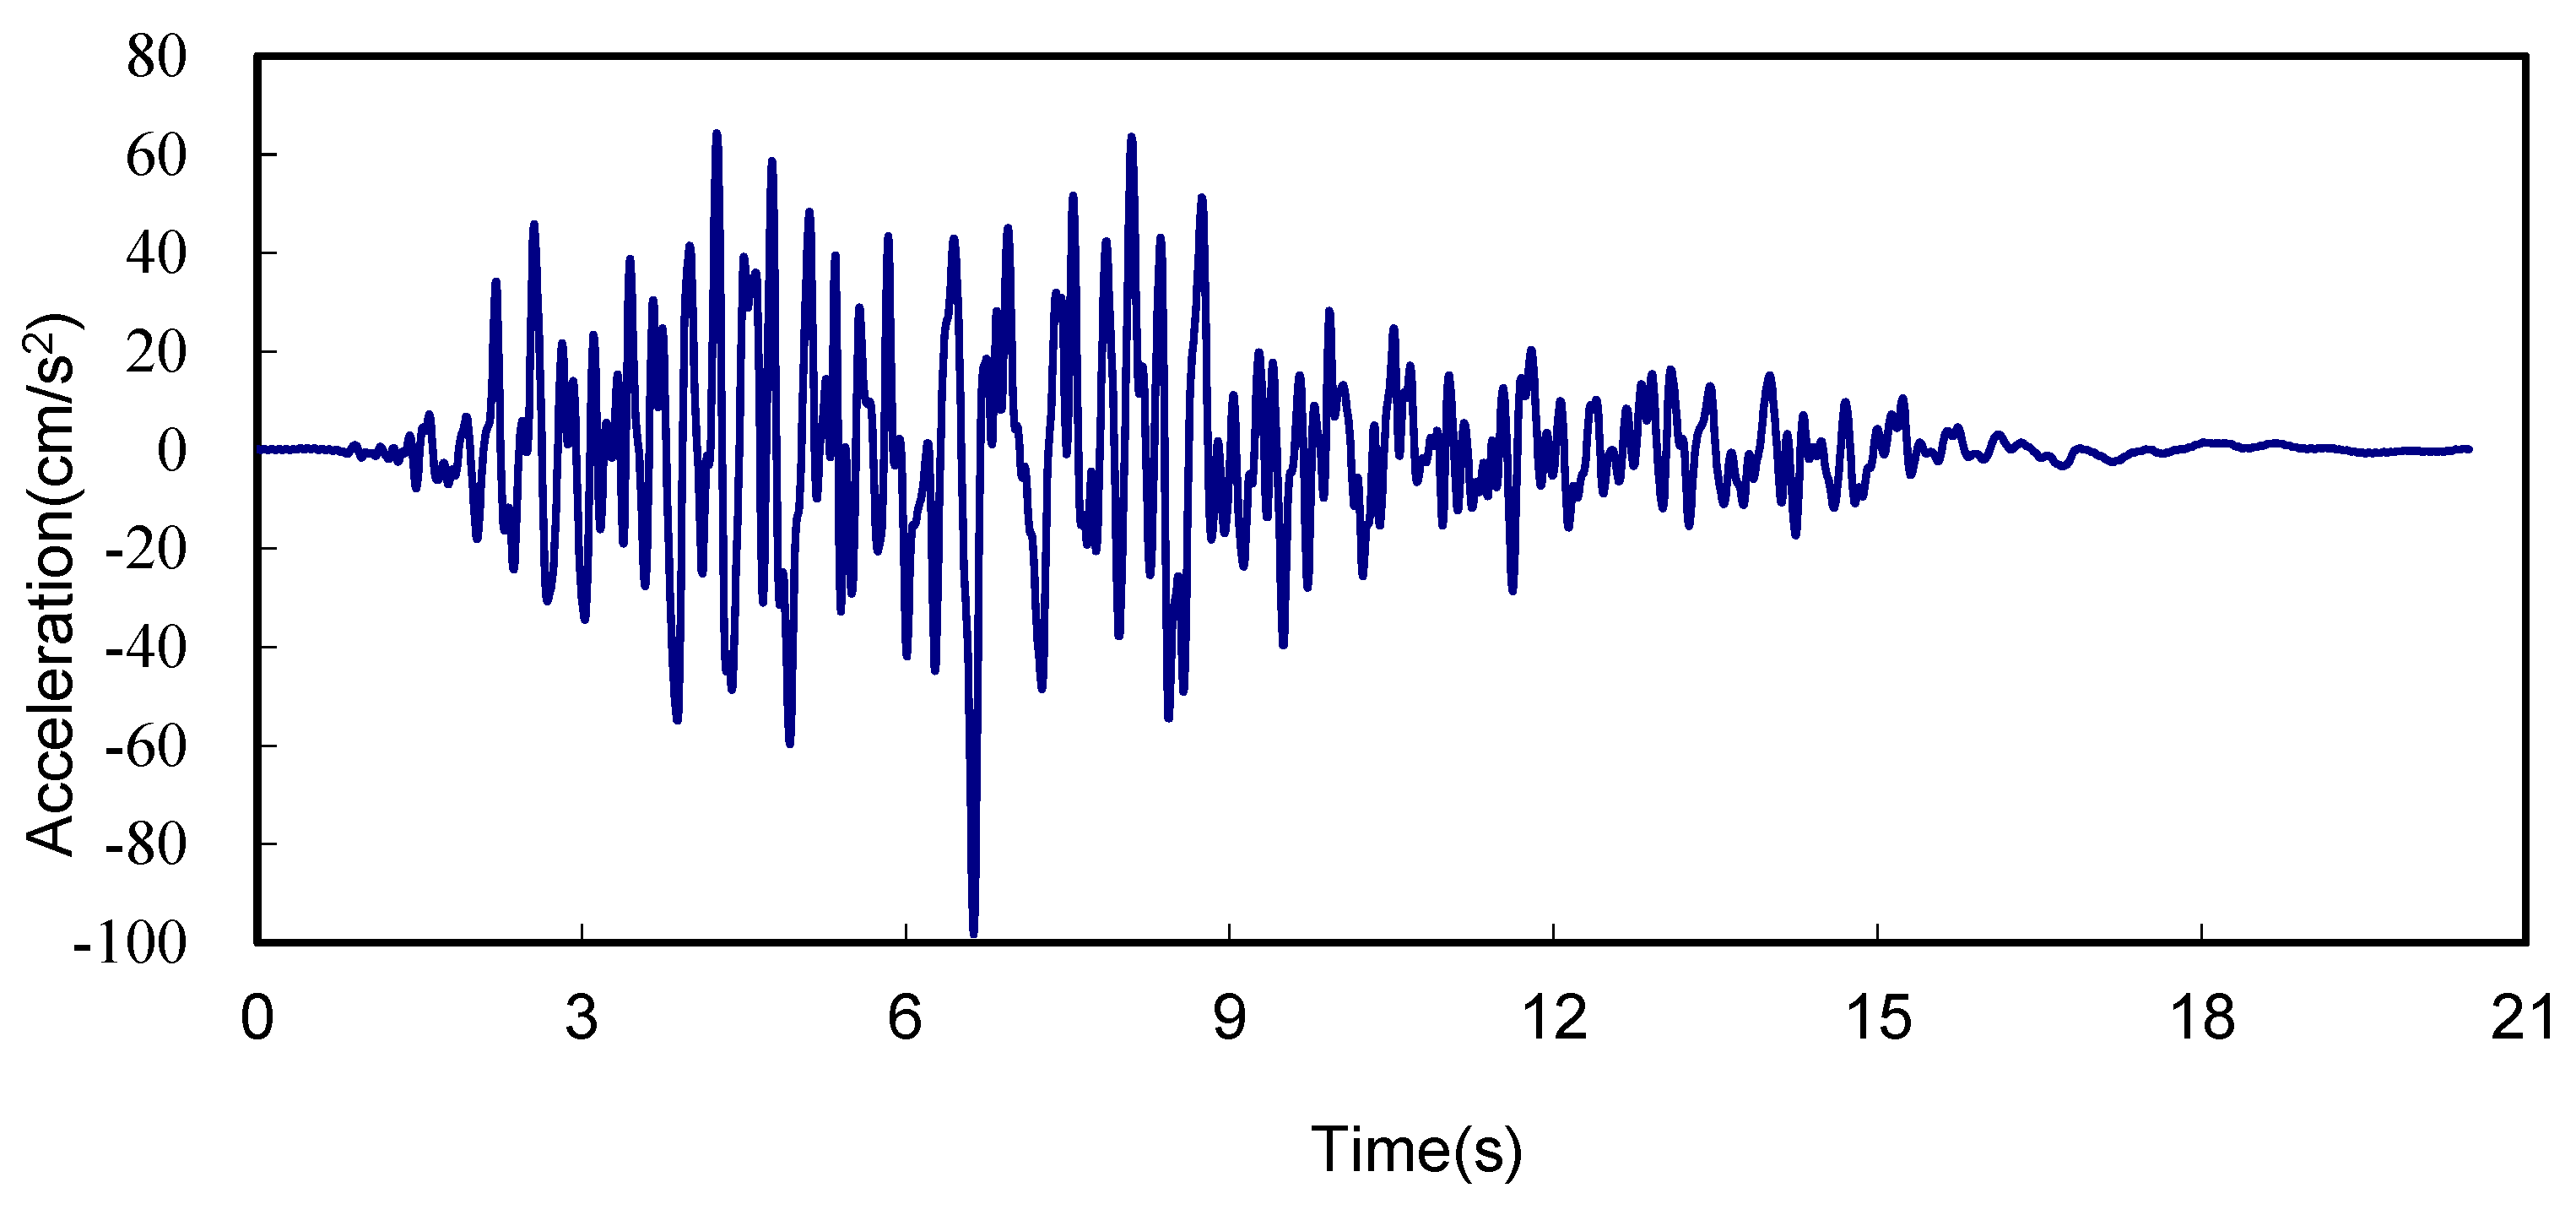
Figure 3.
Seismic wave velocity time history.
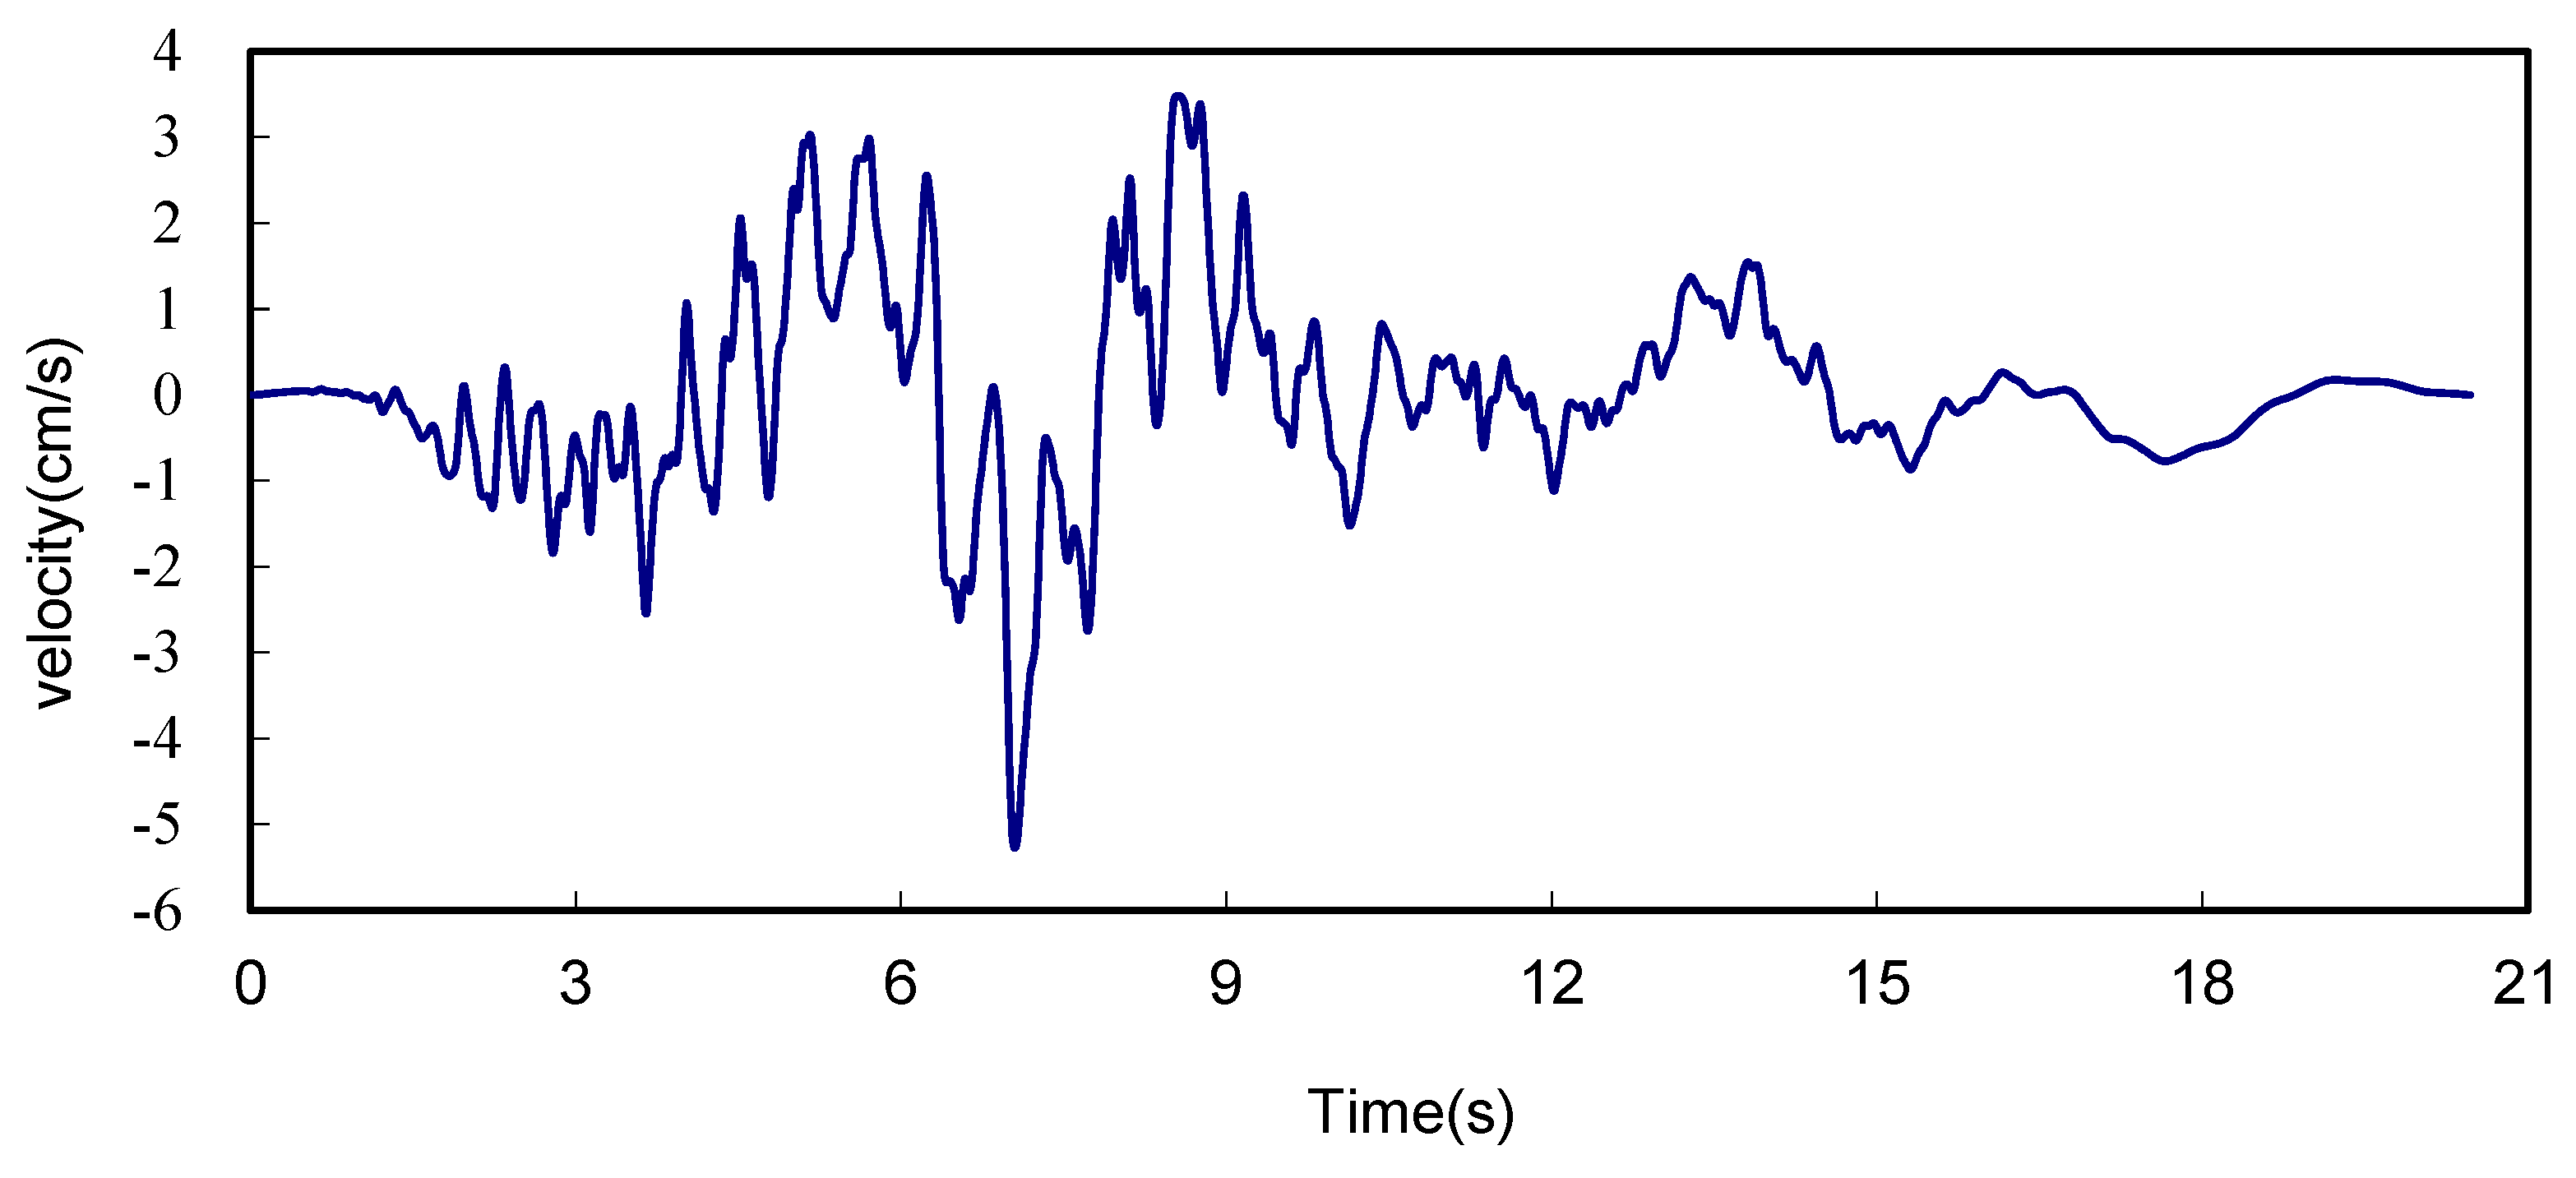
Figure 4.
Seismic wave displacement time history.

Figure 5.
Tunnel calculation grid.

Figure 6.
Bending moment envelope of the tunnel under seismic action.
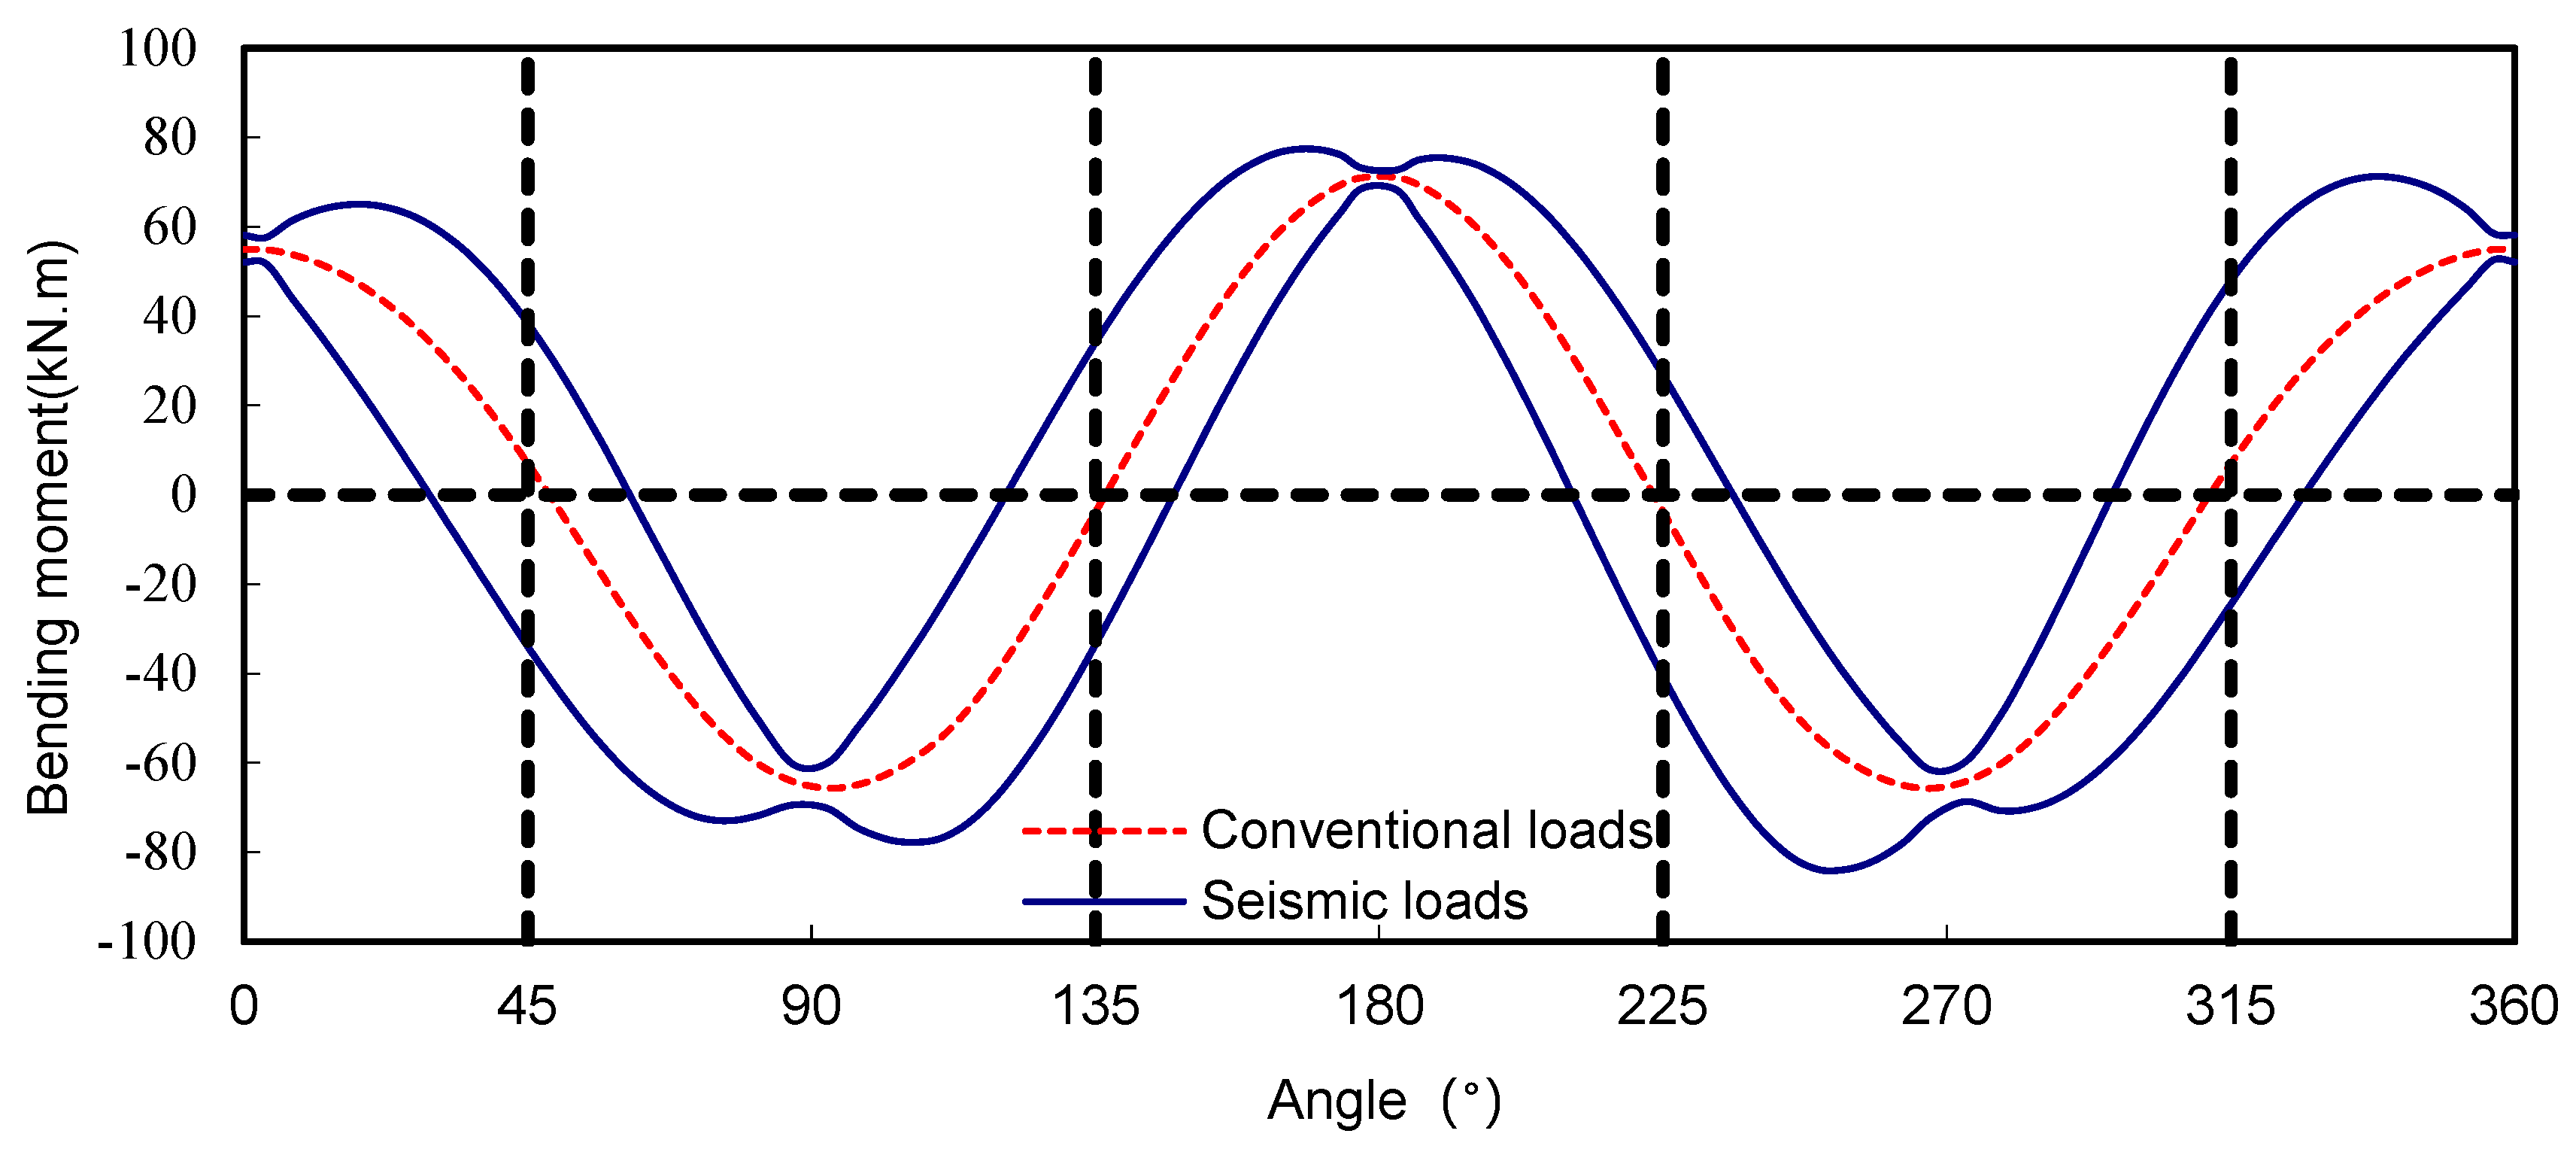
Figure 7.
Axial force envelope of the tunnel under seismic action.

Figure 8.
Time history of the tunnel bending moment under seismic action.
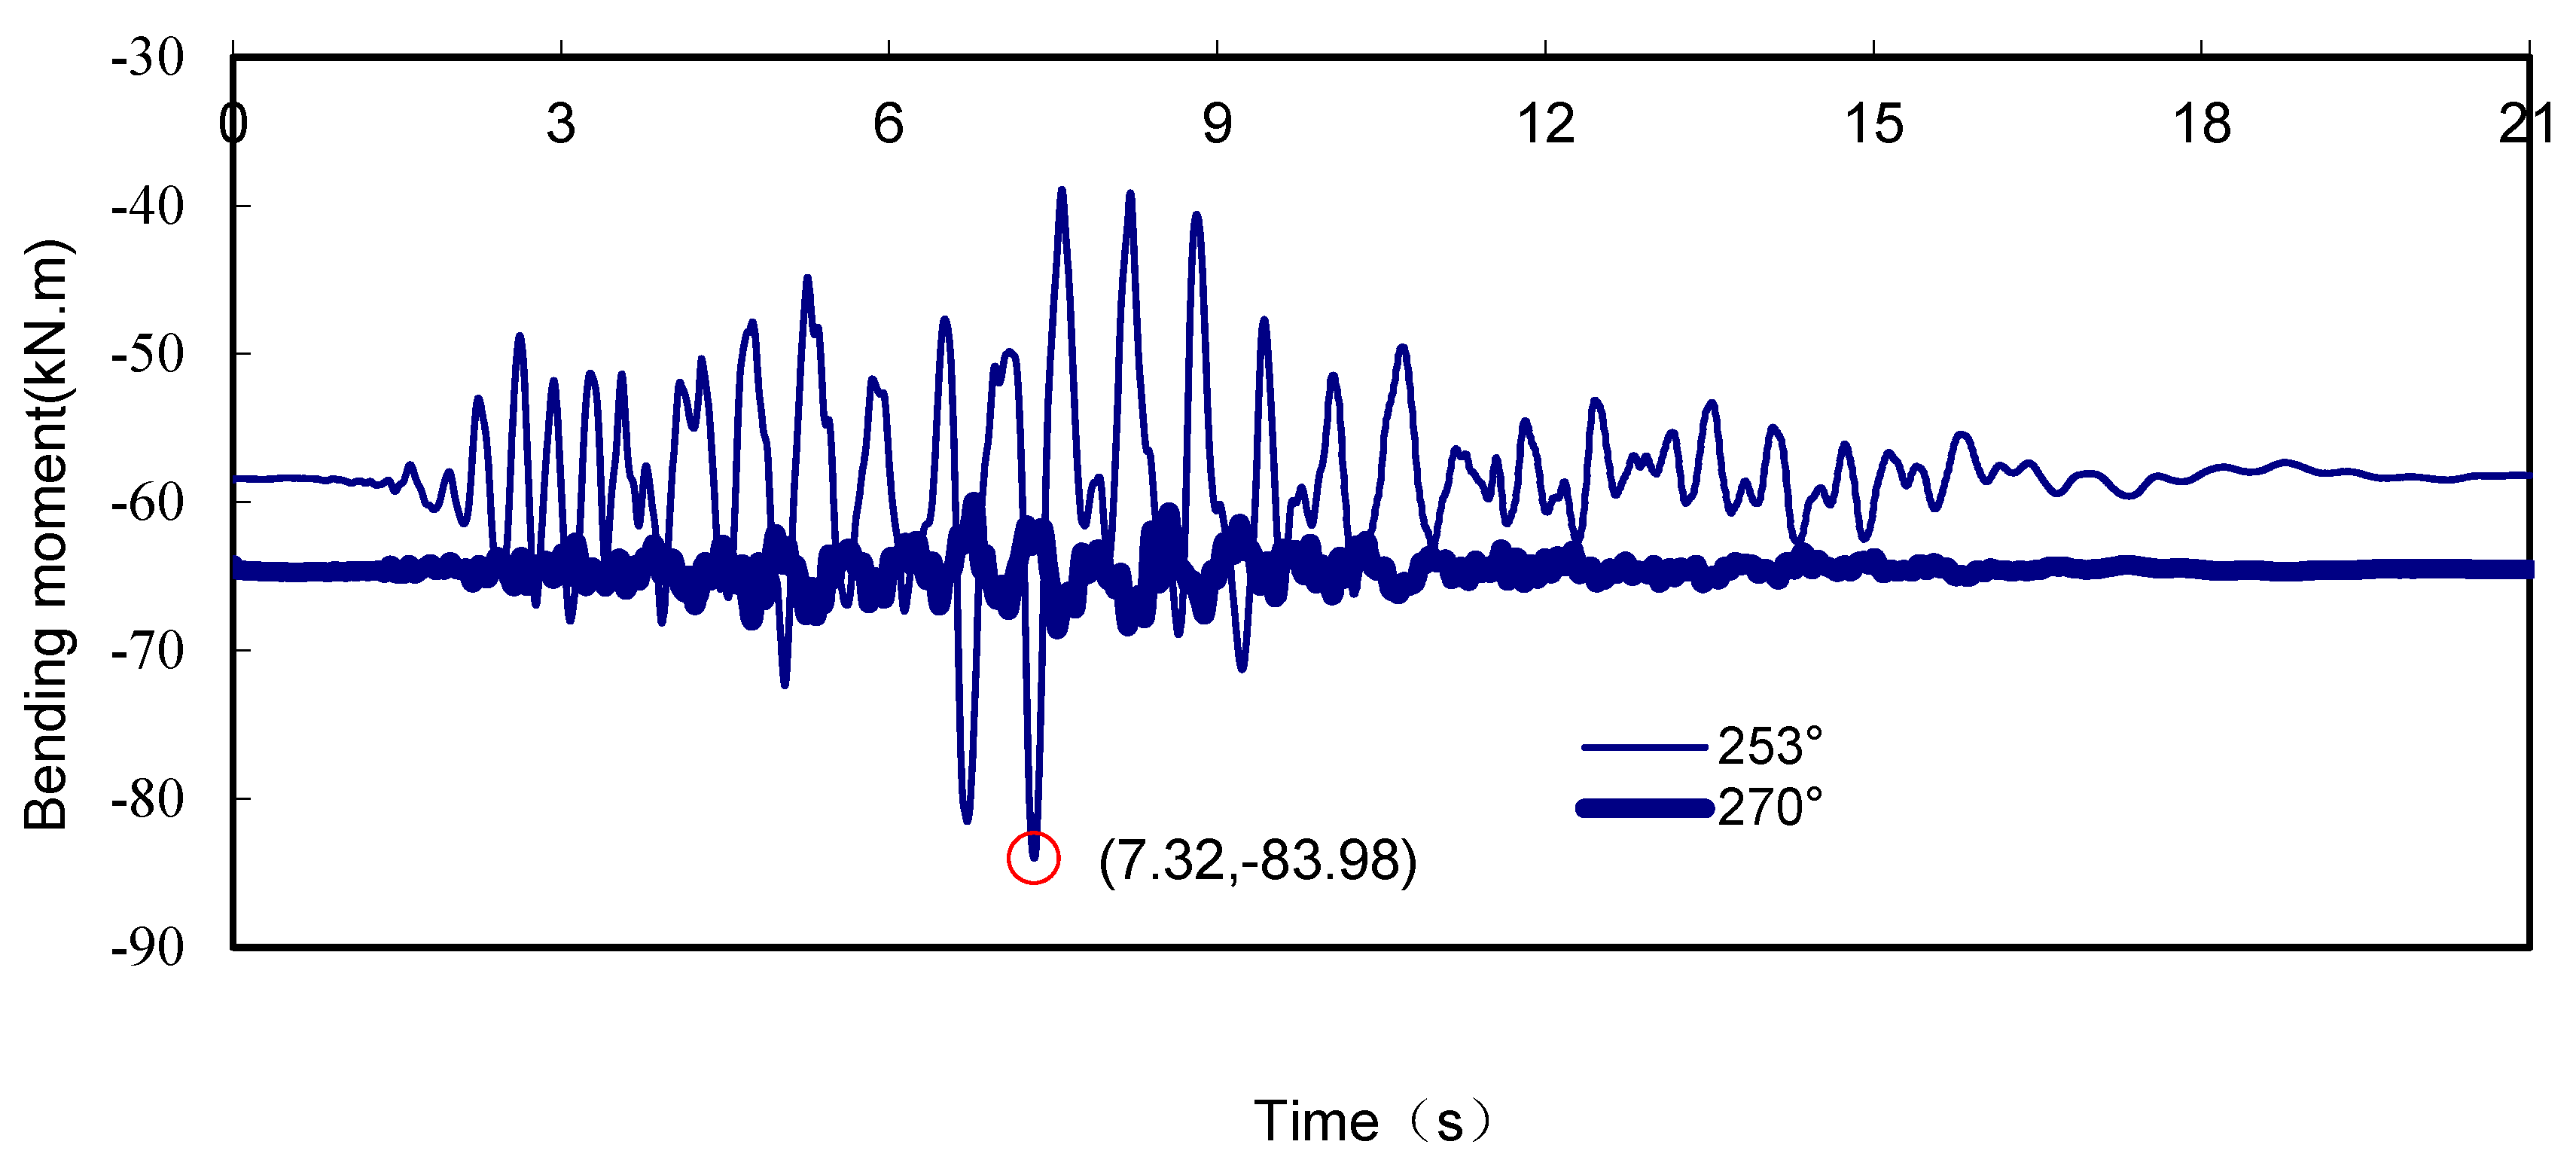
Figure 9.
Relative displacement of the top and bottom of the tunnel under seismic action.
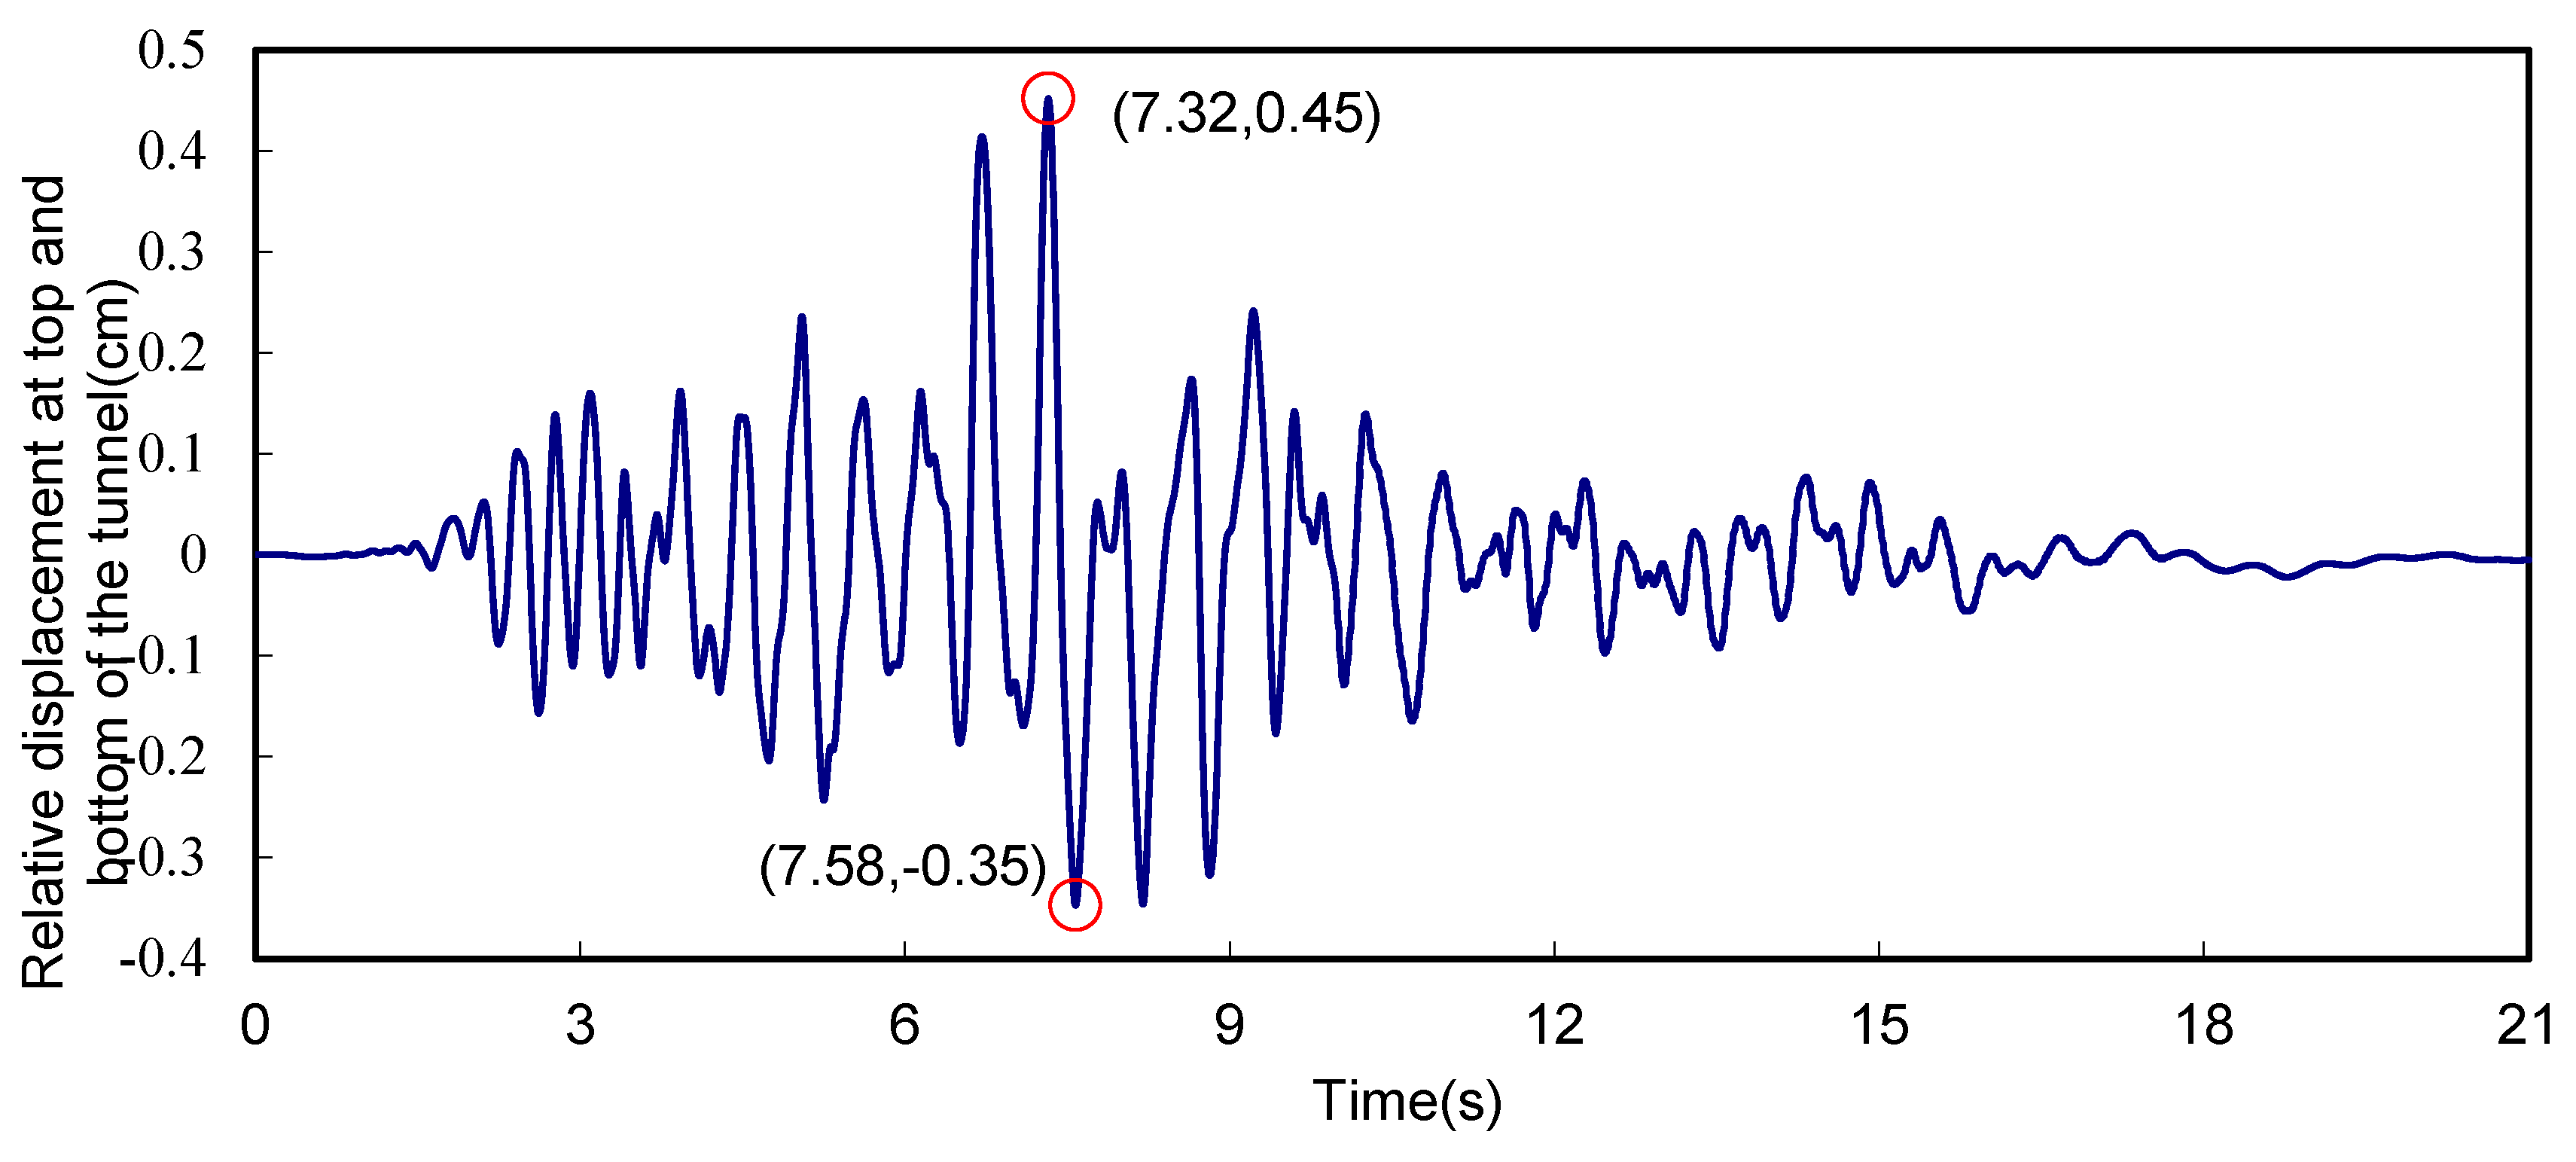
Figure 10.
Time history of the tunnel axial force under seismic action.

Figure 11.
Deformation of the tunnel under seismic action.

Figure 12.
Bending moment of the tunnel under seismic action.
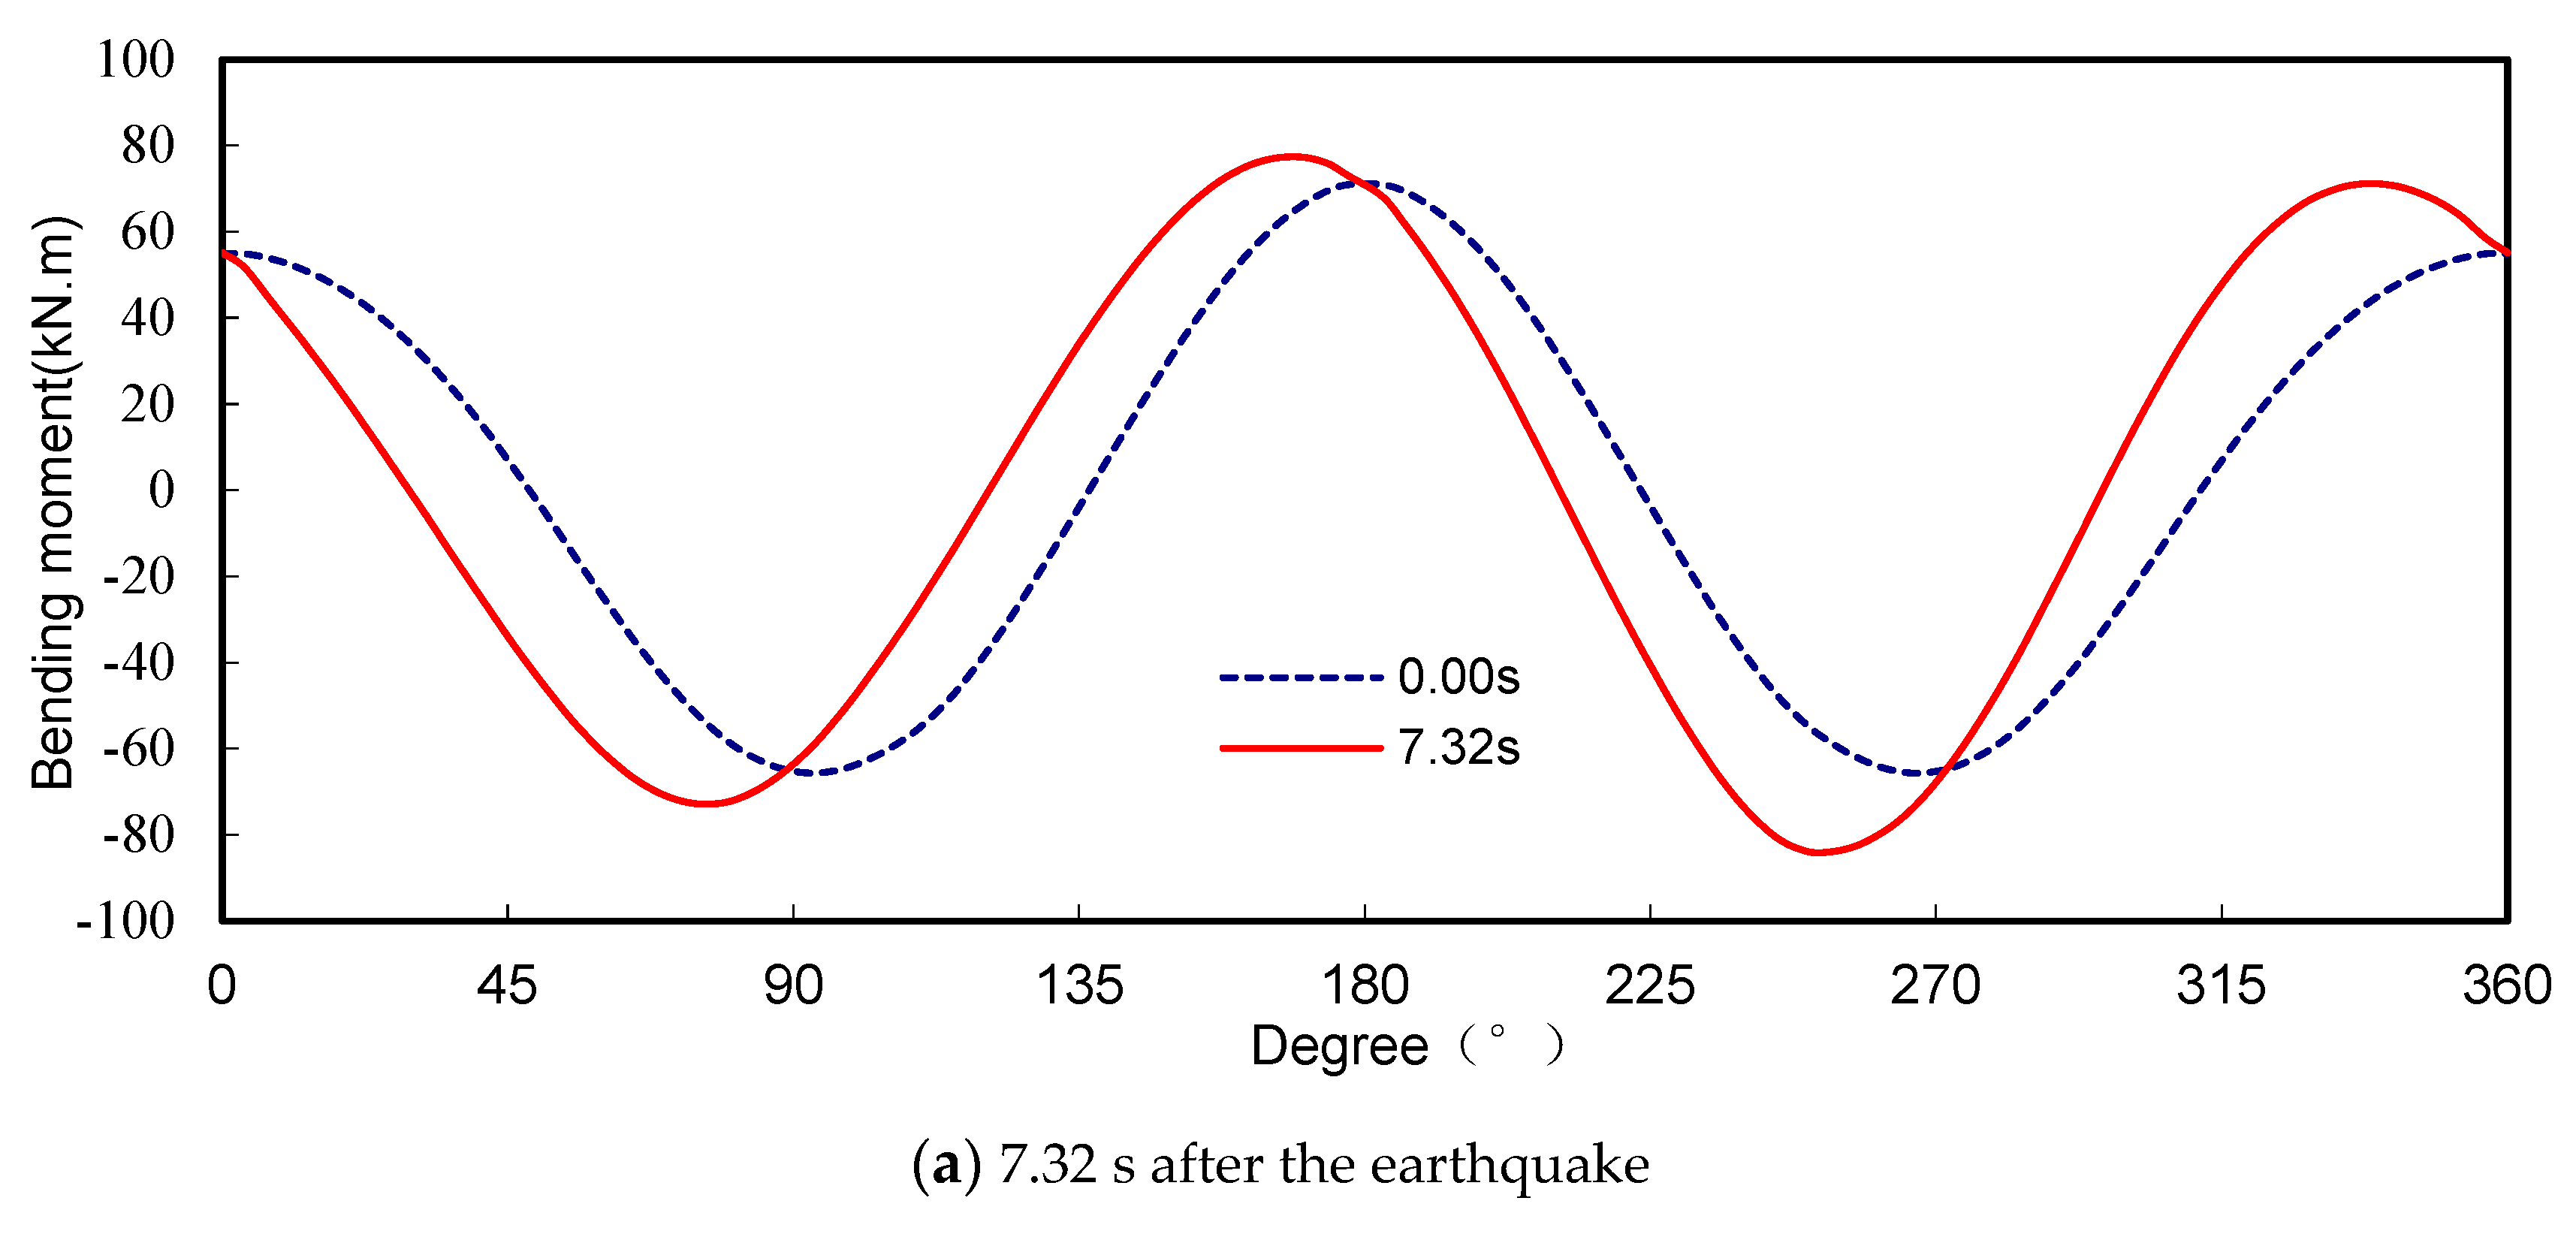
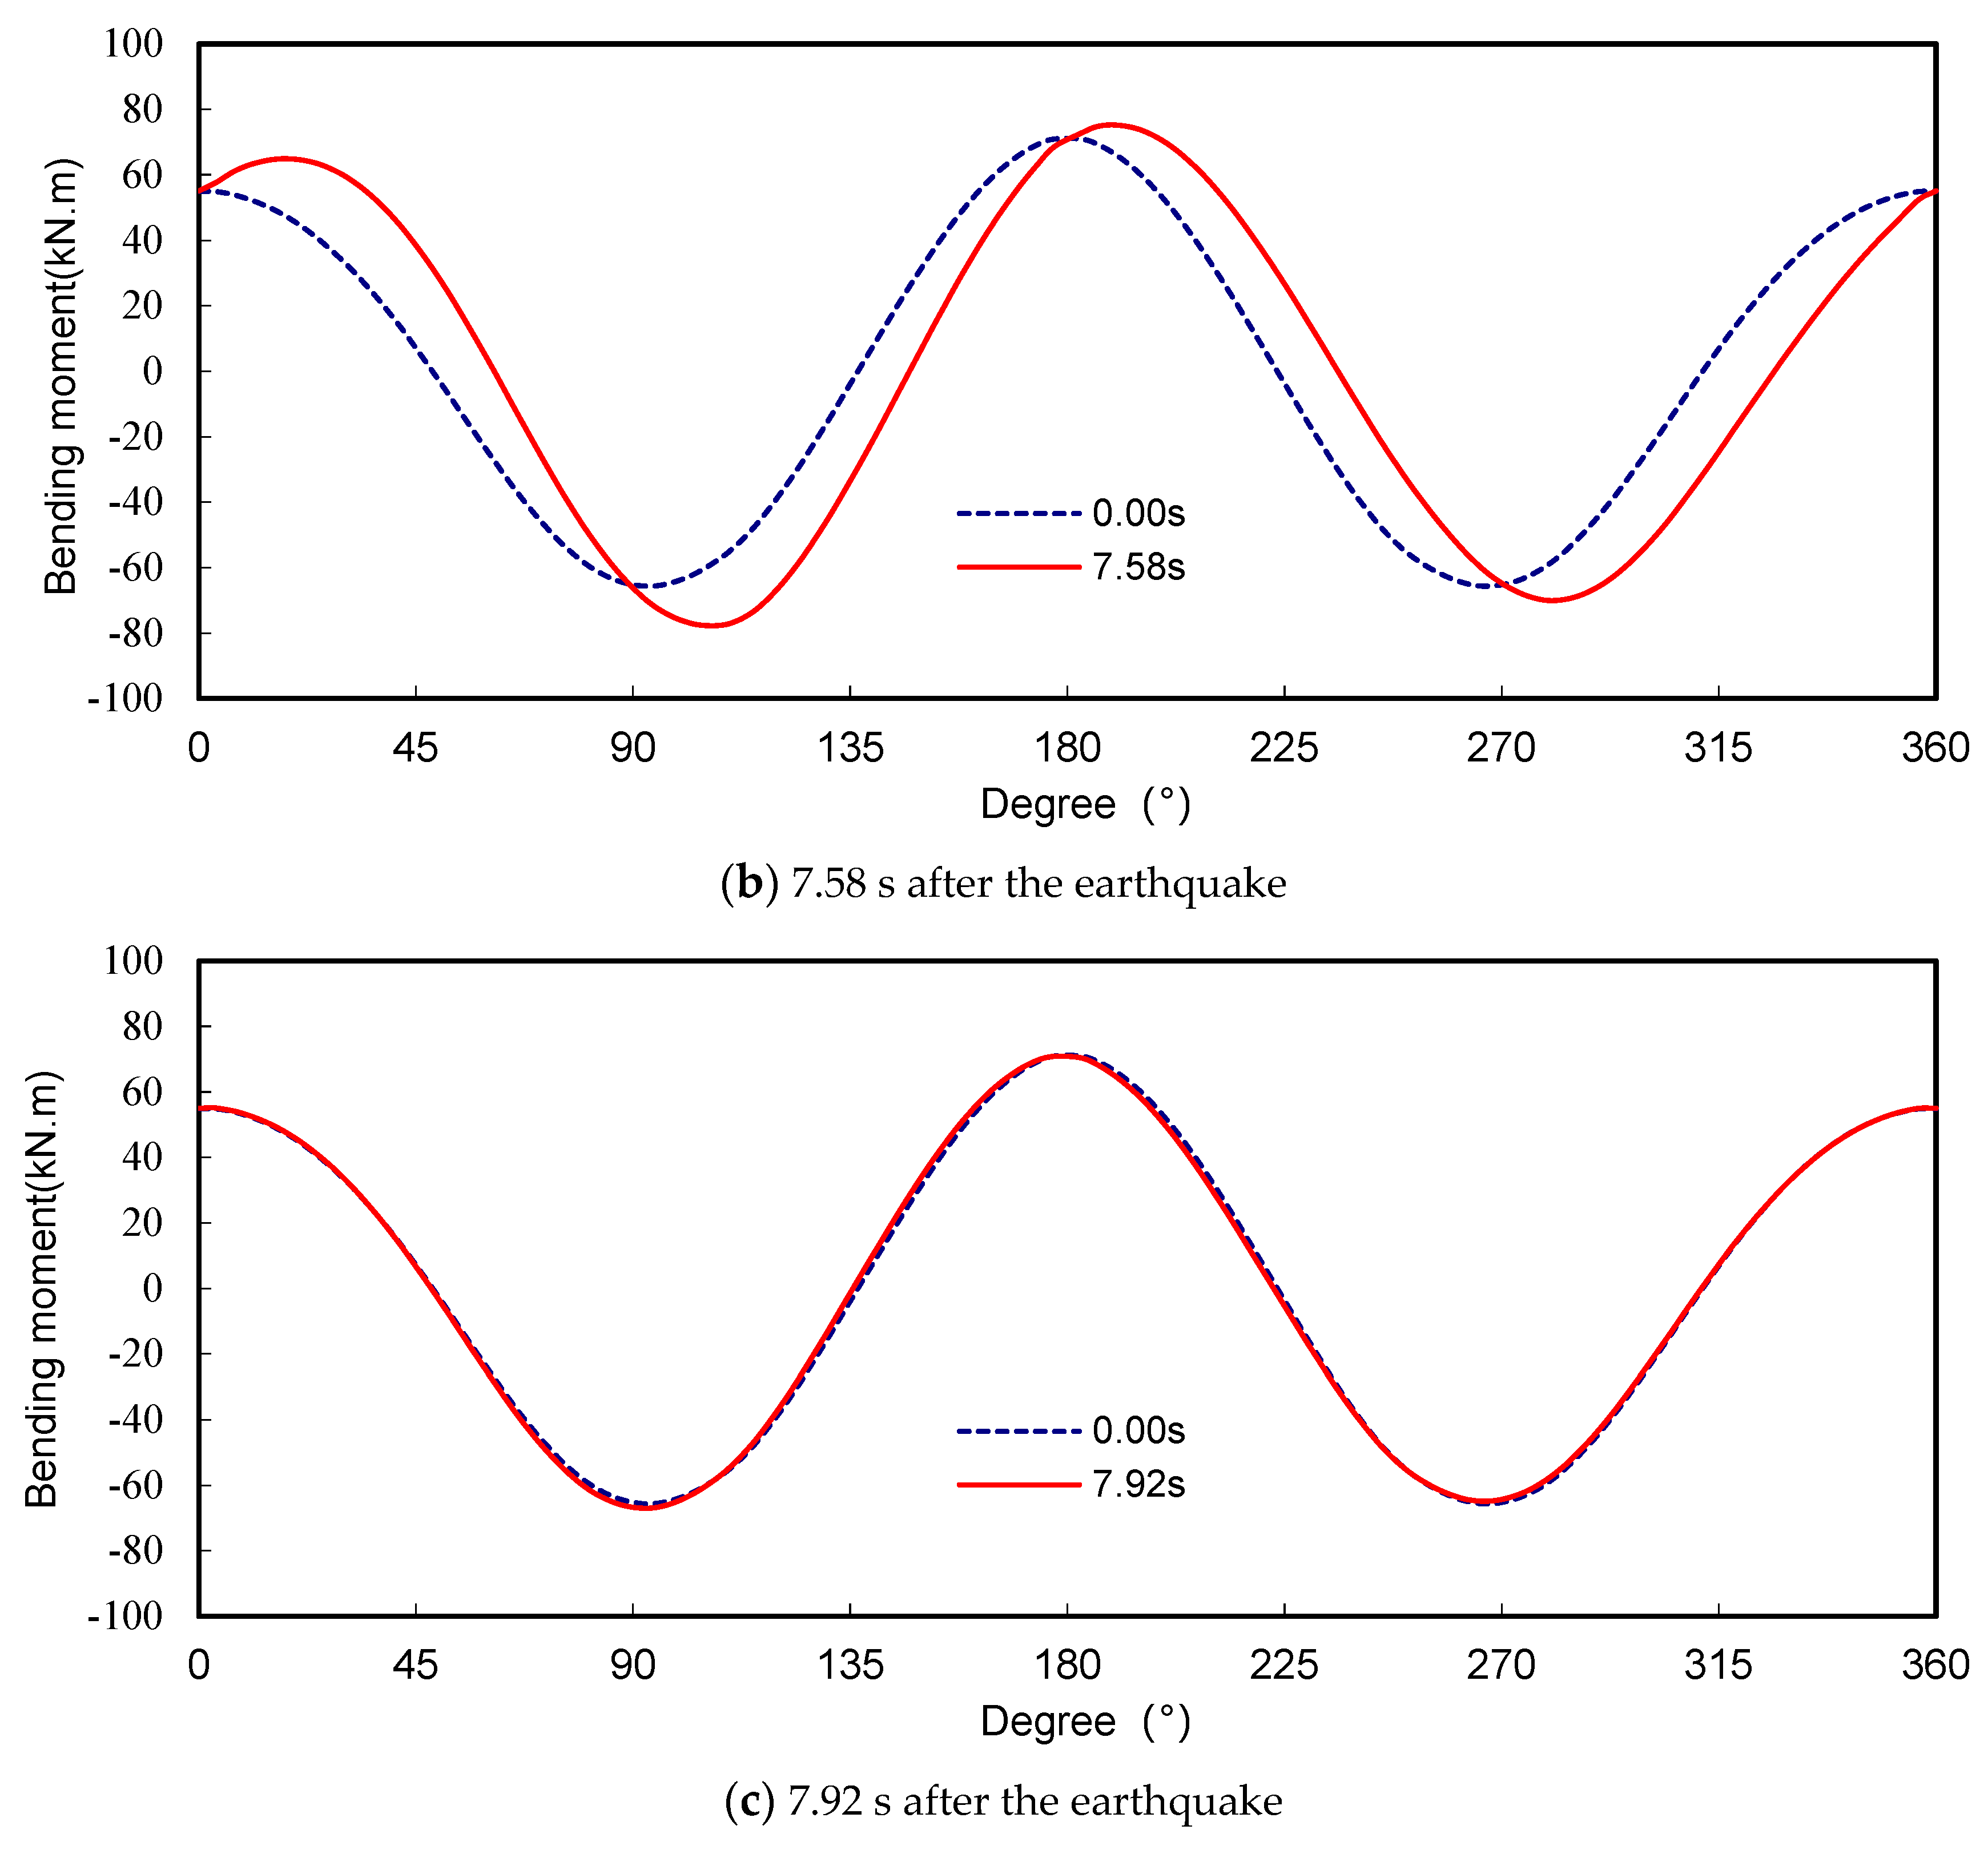
Figure 13.
Axial force of the tunnel under seismic action.
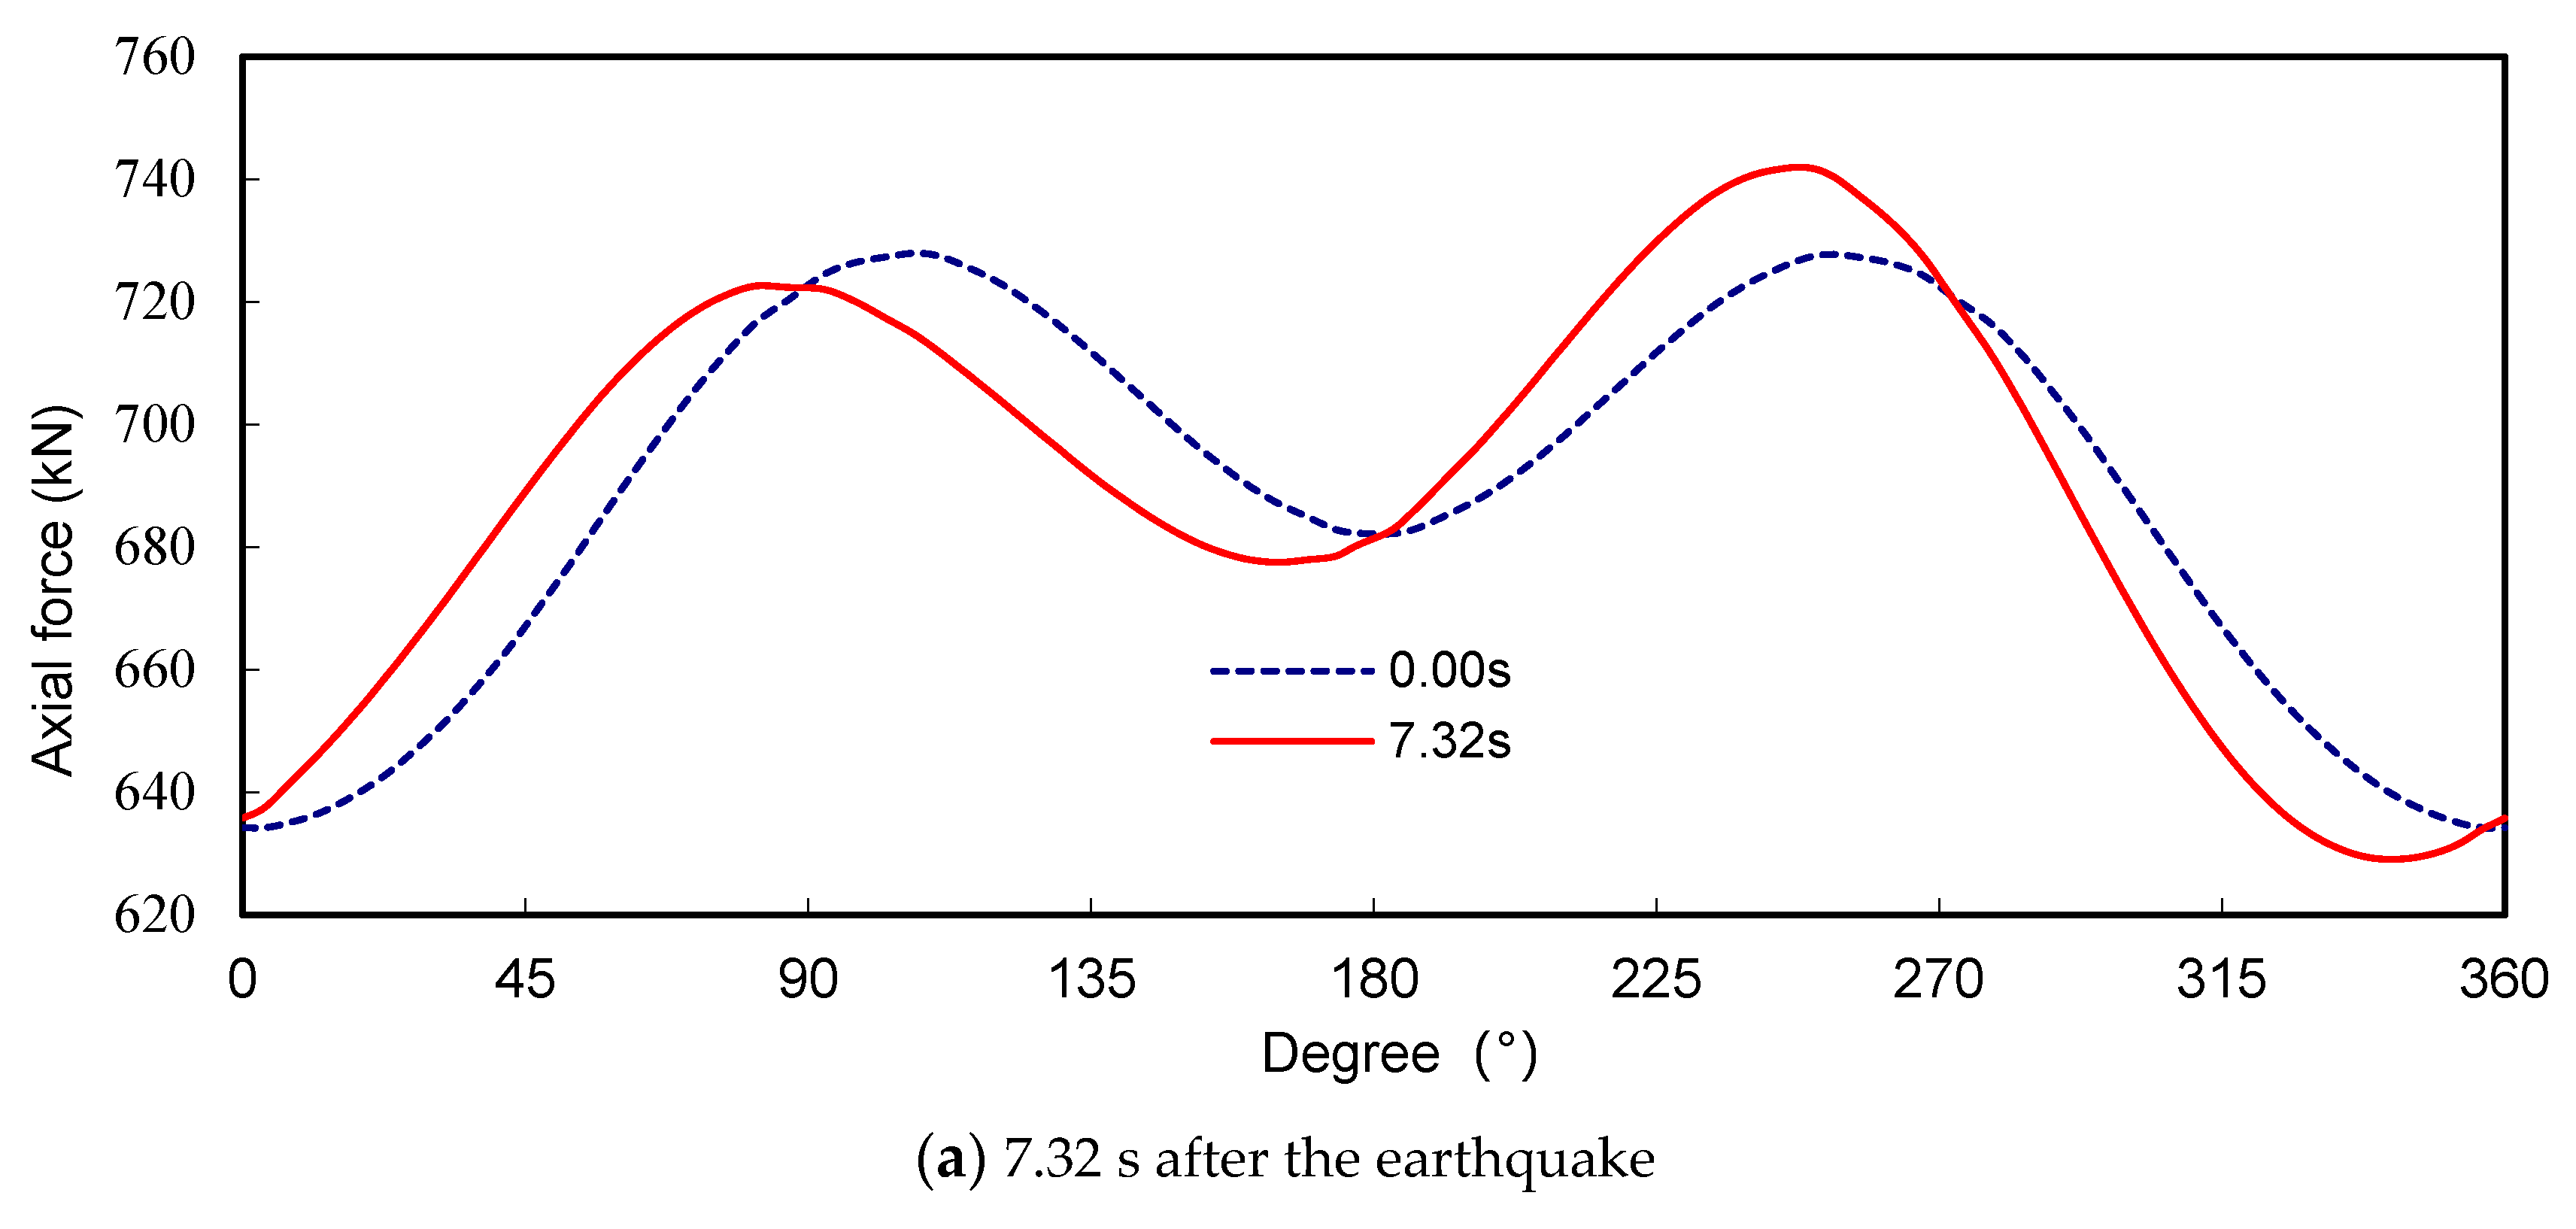

Figure 14.
Relative displacement of the tunnel under seismic action.
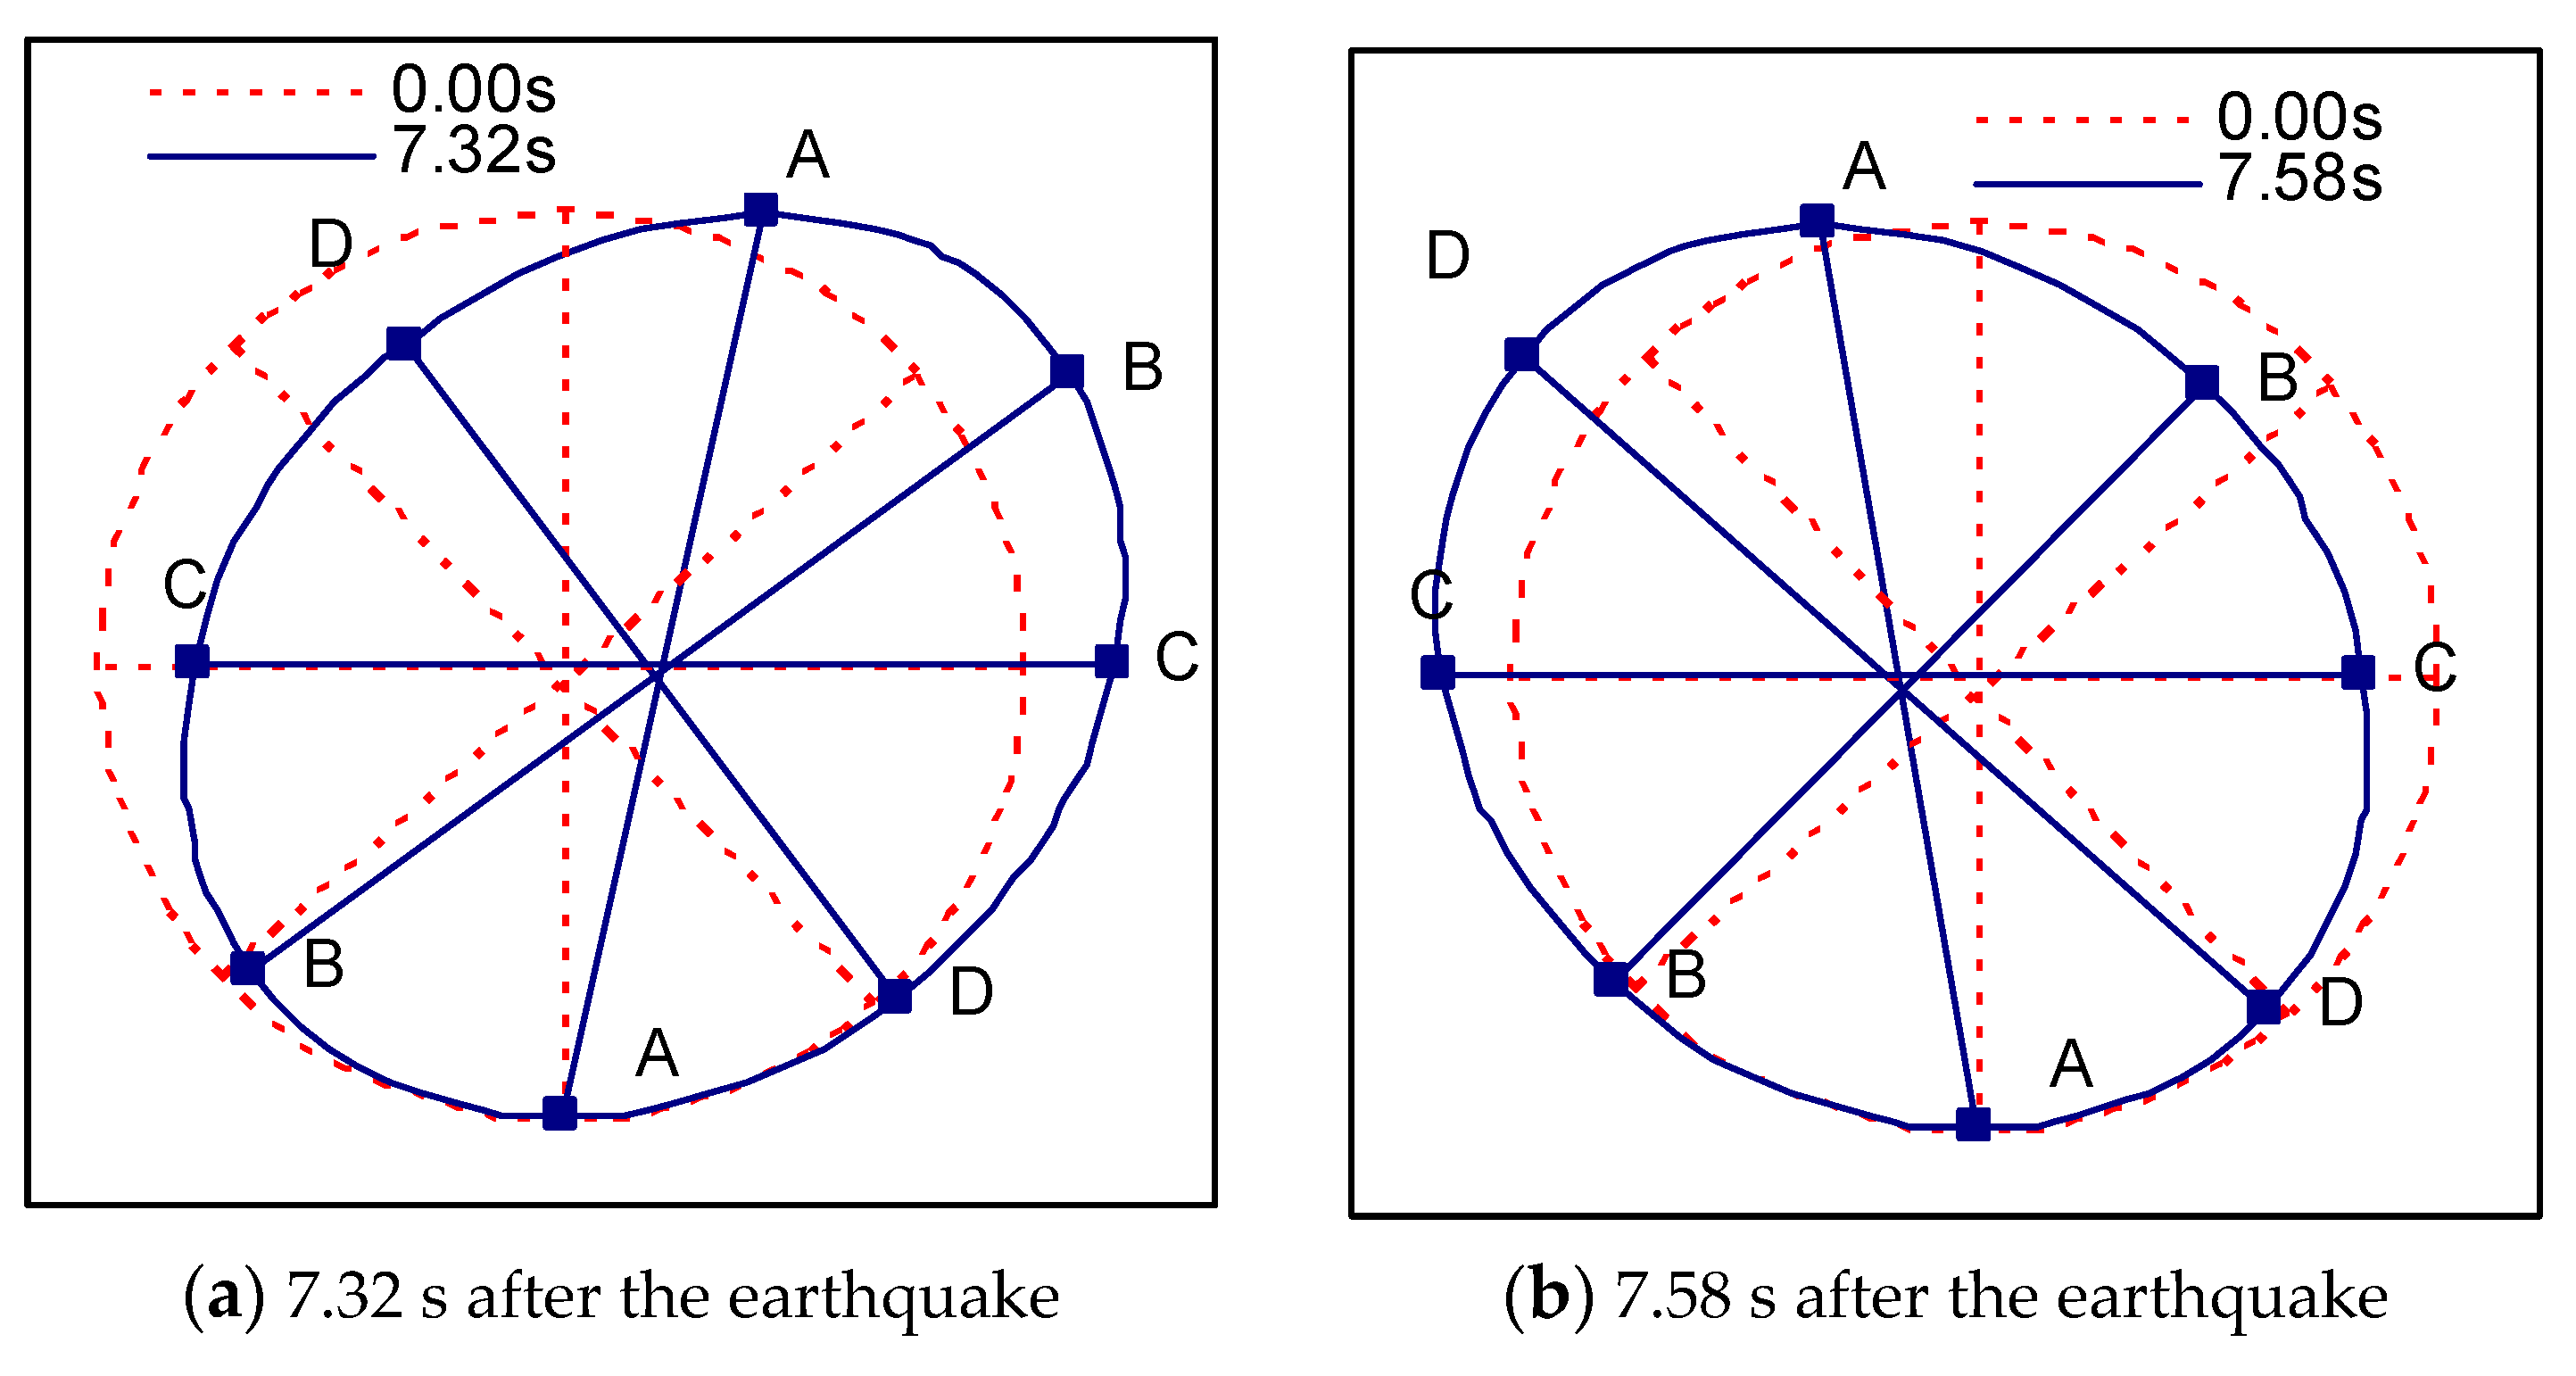
Figure 15.
Comparison of relative displacement of the tunnel under seismic action.

Figure 16.
Comparison of the bending moment of the tunnel under seismic action.
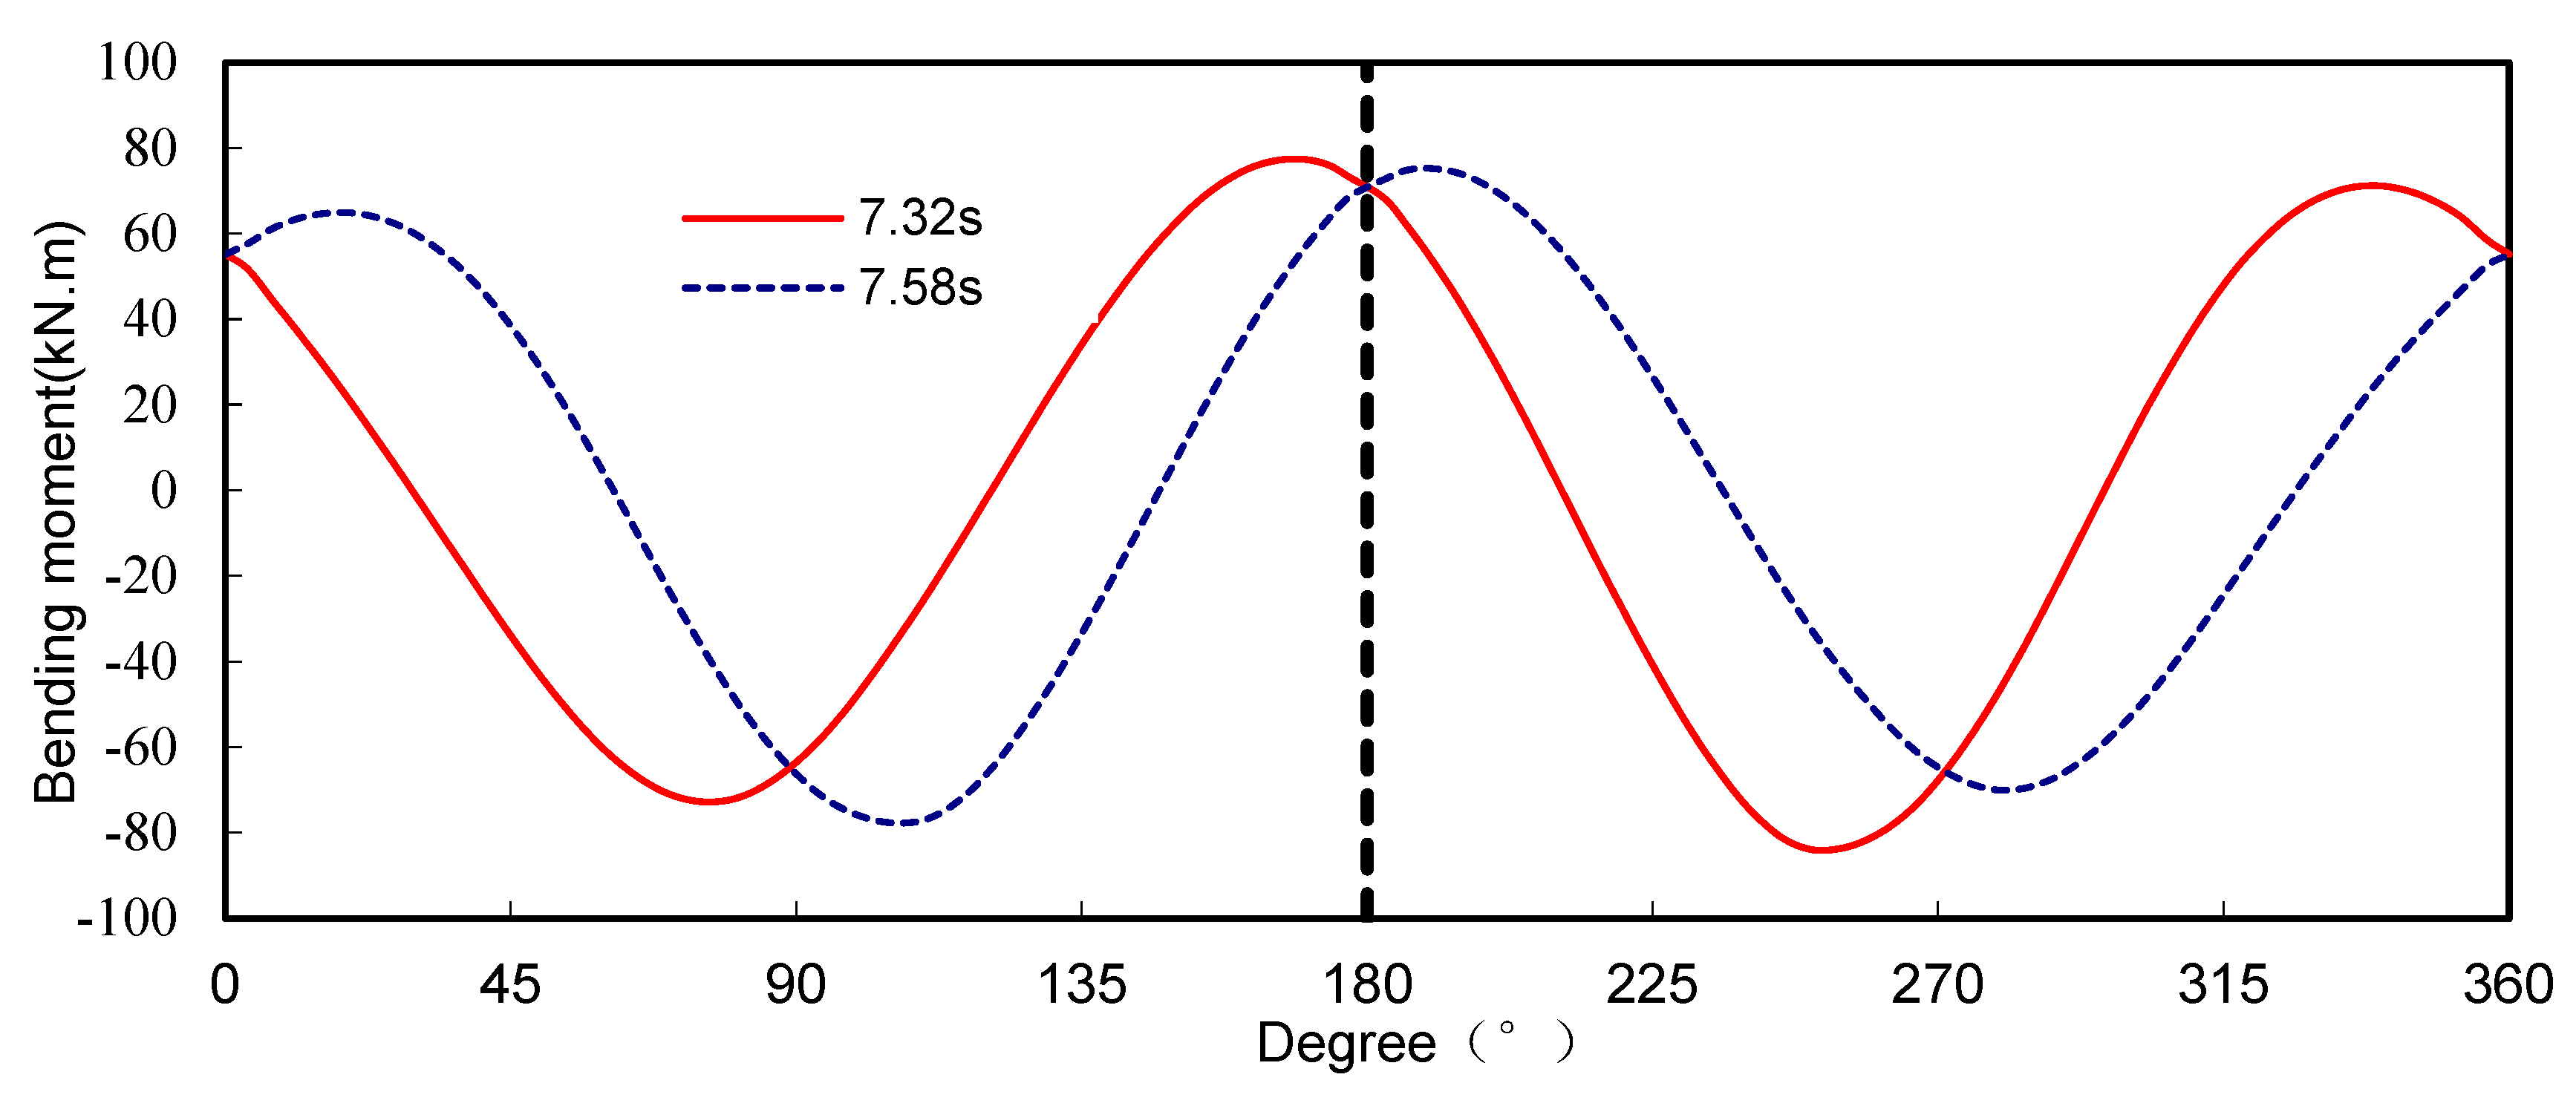
Figure 17.
Comparison of the axial force of the tunnel under seismic action.
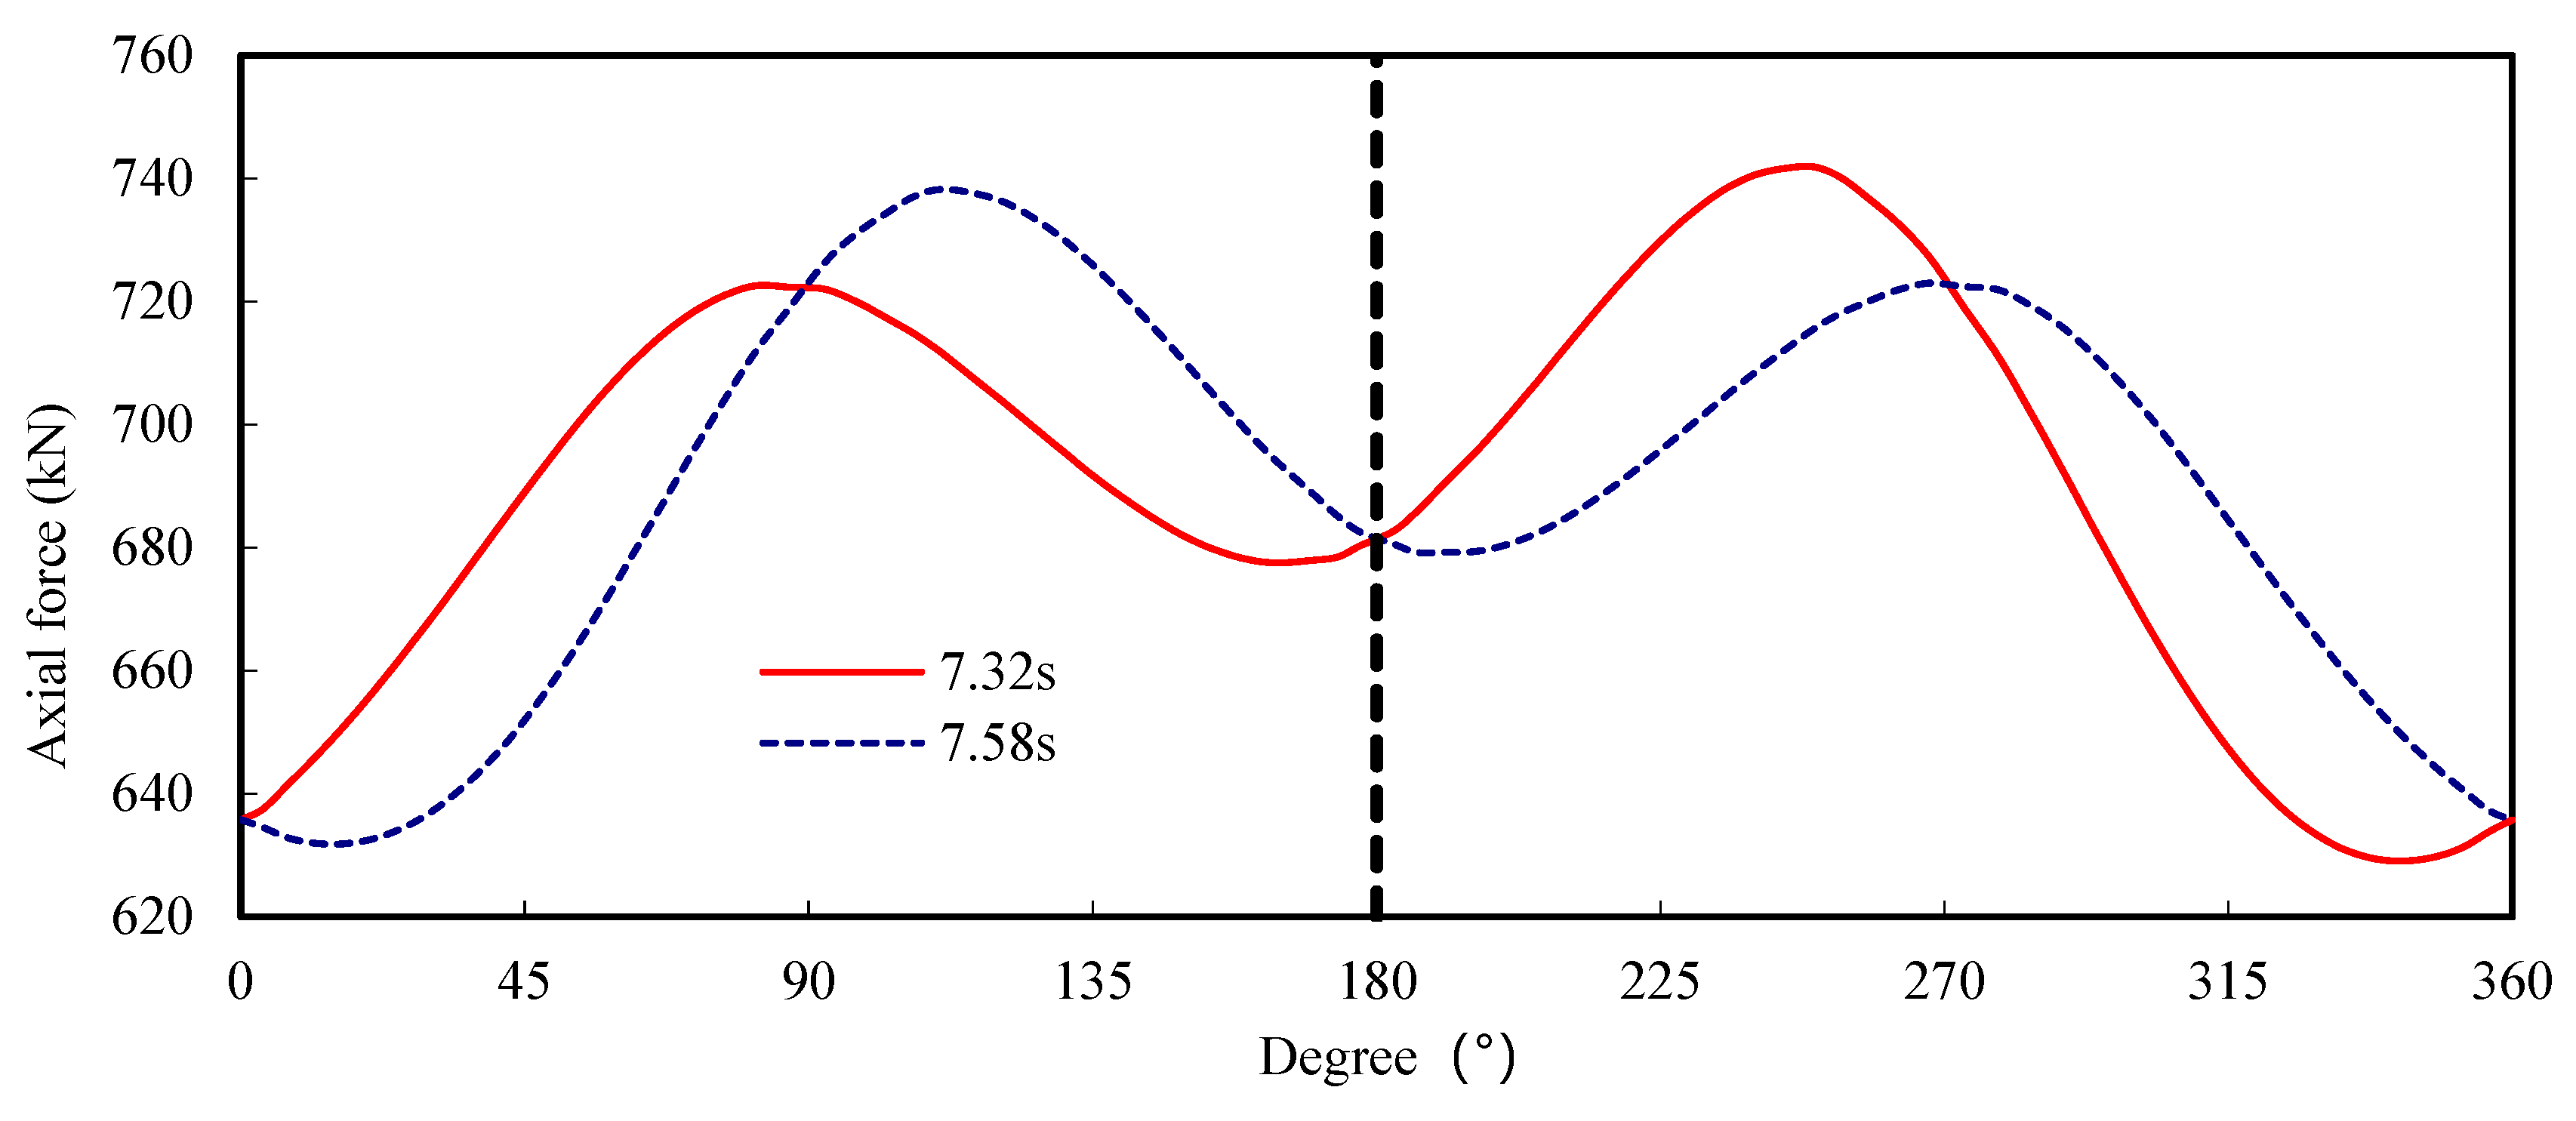
Figure 18.
Relationship between the internal forces and the tunnel inclination at the maximum positive bending moment (169°) under seismic.
Figure 18.
Relationship between the internal forces and the tunnel inclination at the maximum positive bending moment (169°) under seismic.

Figure 19.
Relationship between the internal forces and tunnel inclination at the maximum negative bending moment (253°) under seismic action.
Figure 19.
Relationship between the internal forces and tunnel inclination at the maximum negative bending moment (253°) under seismic action.
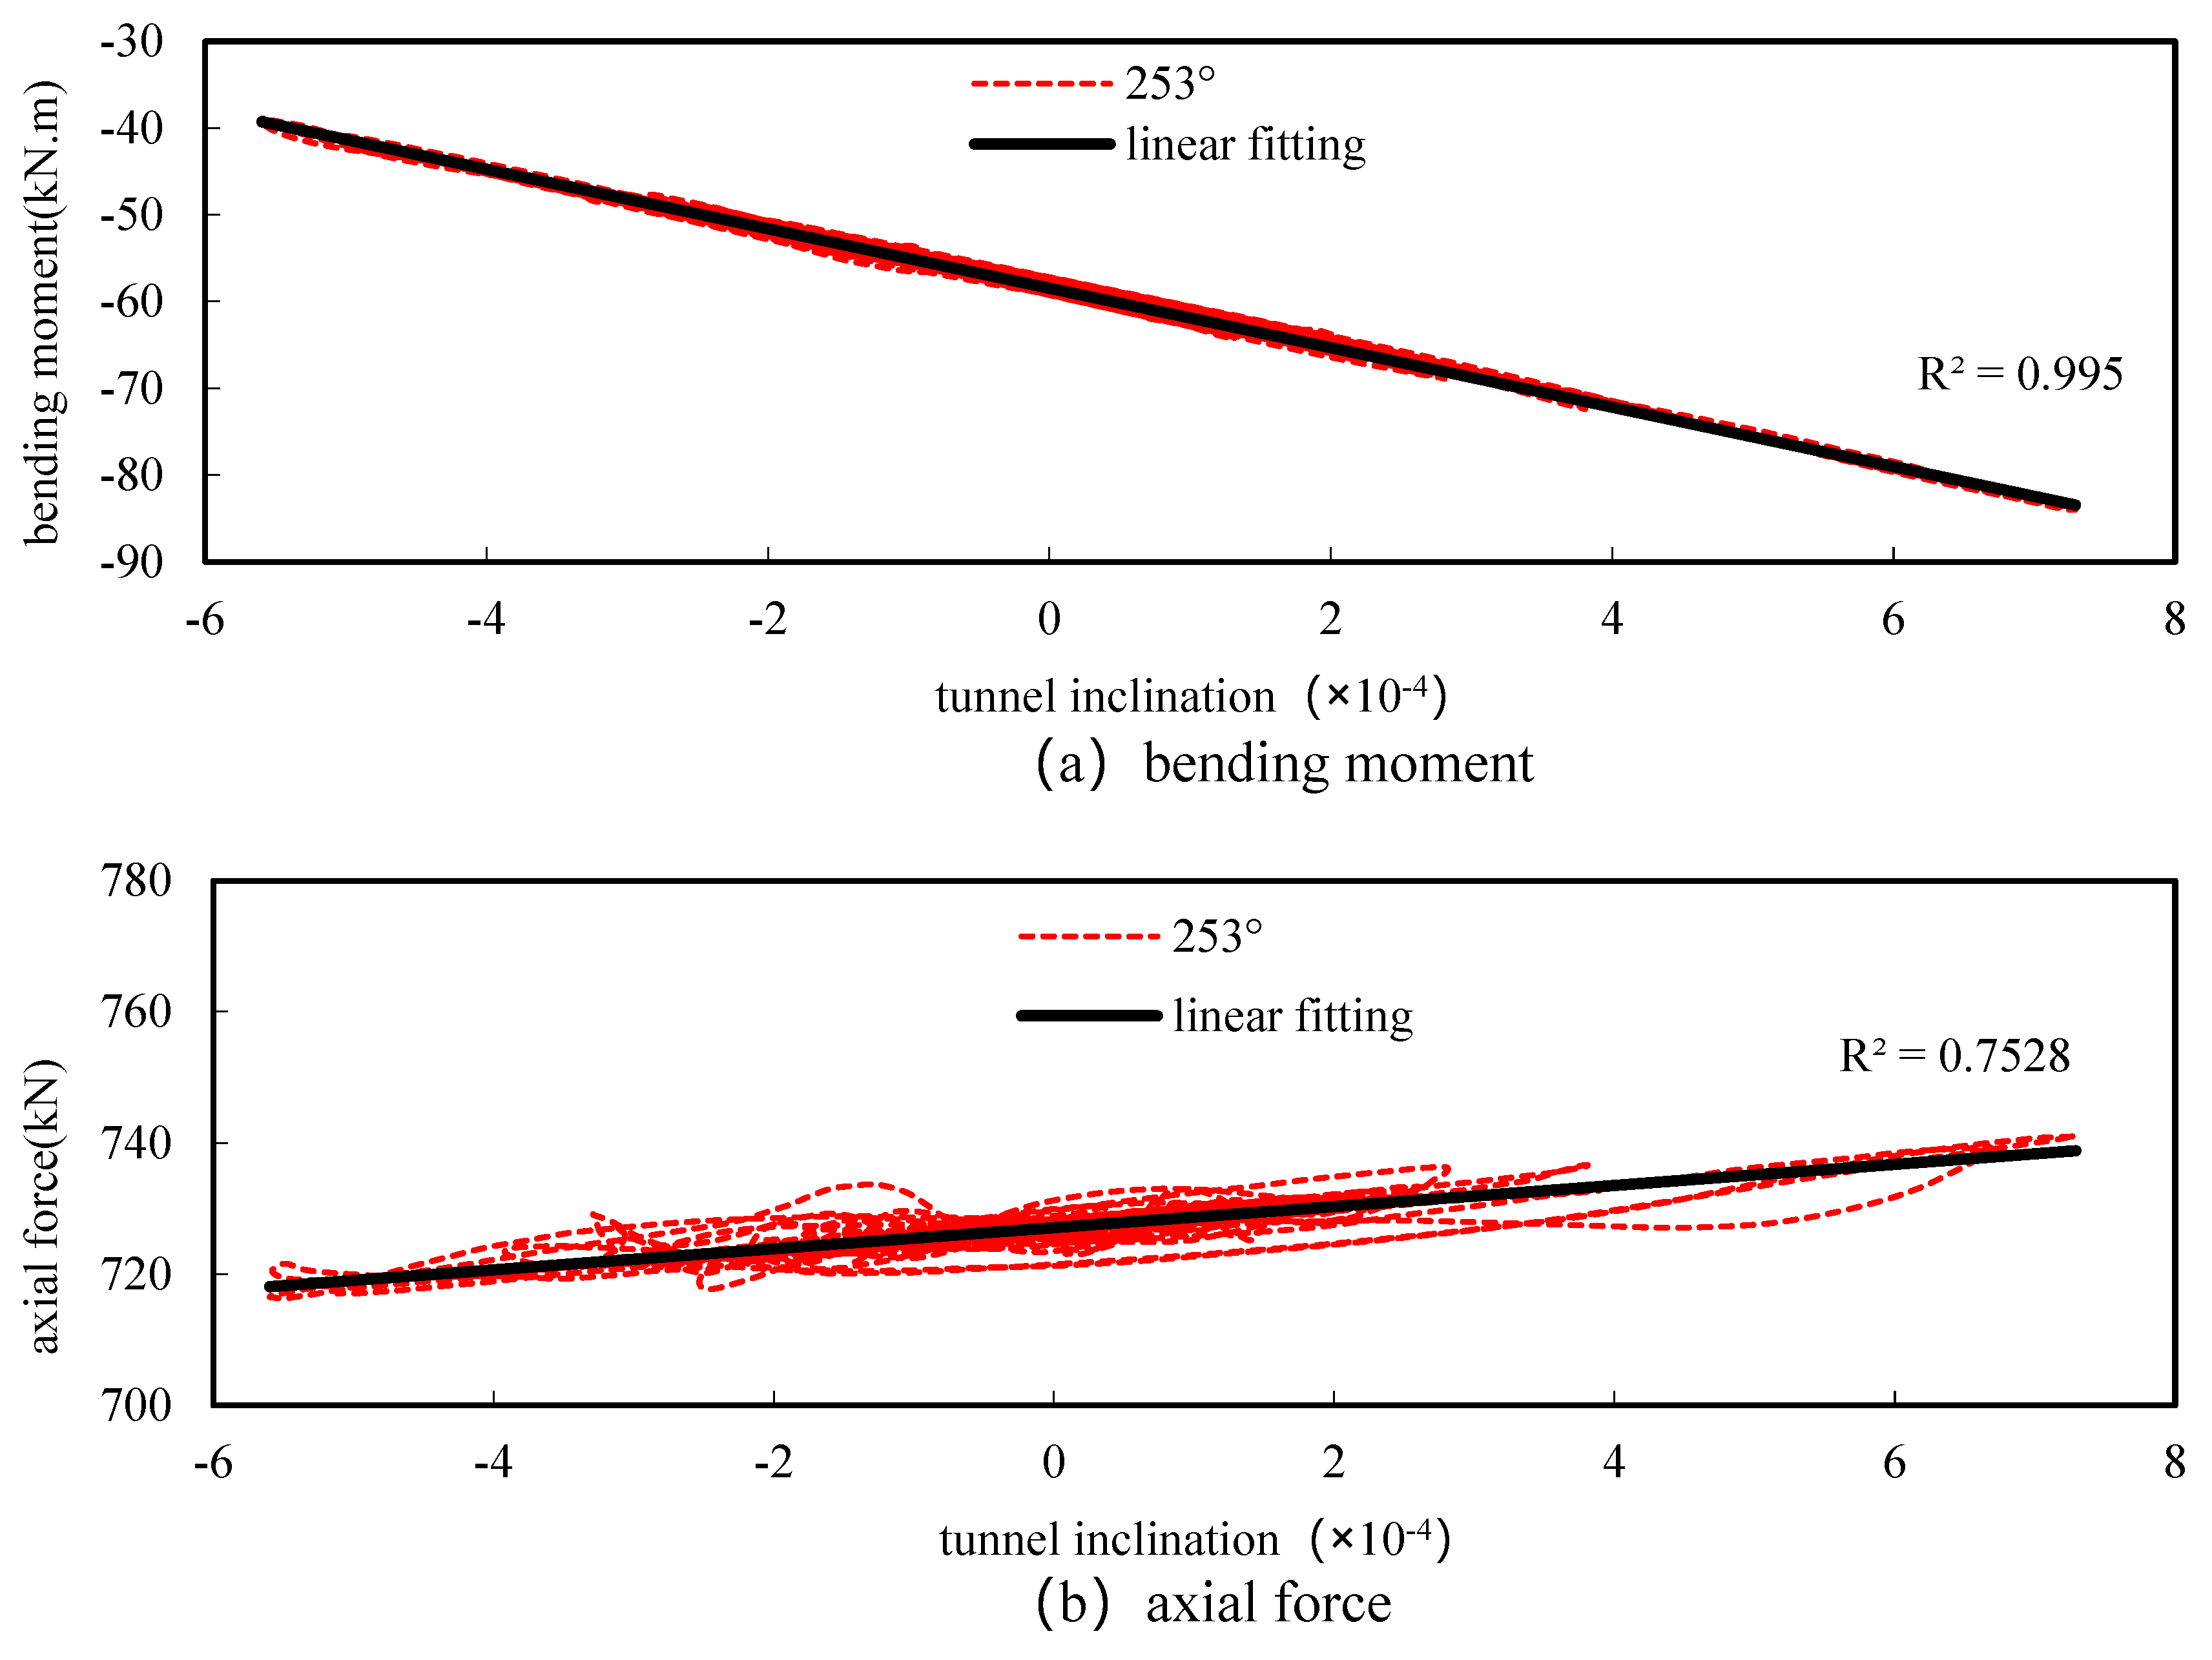
Figure 20.
Relationship between the internal forces and tunnel inclination at the maximum axial force (249°) under seismic action.
Figure 20.
Relationship between the internal forces and tunnel inclination at the maximum axial force (249°) under seismic action.
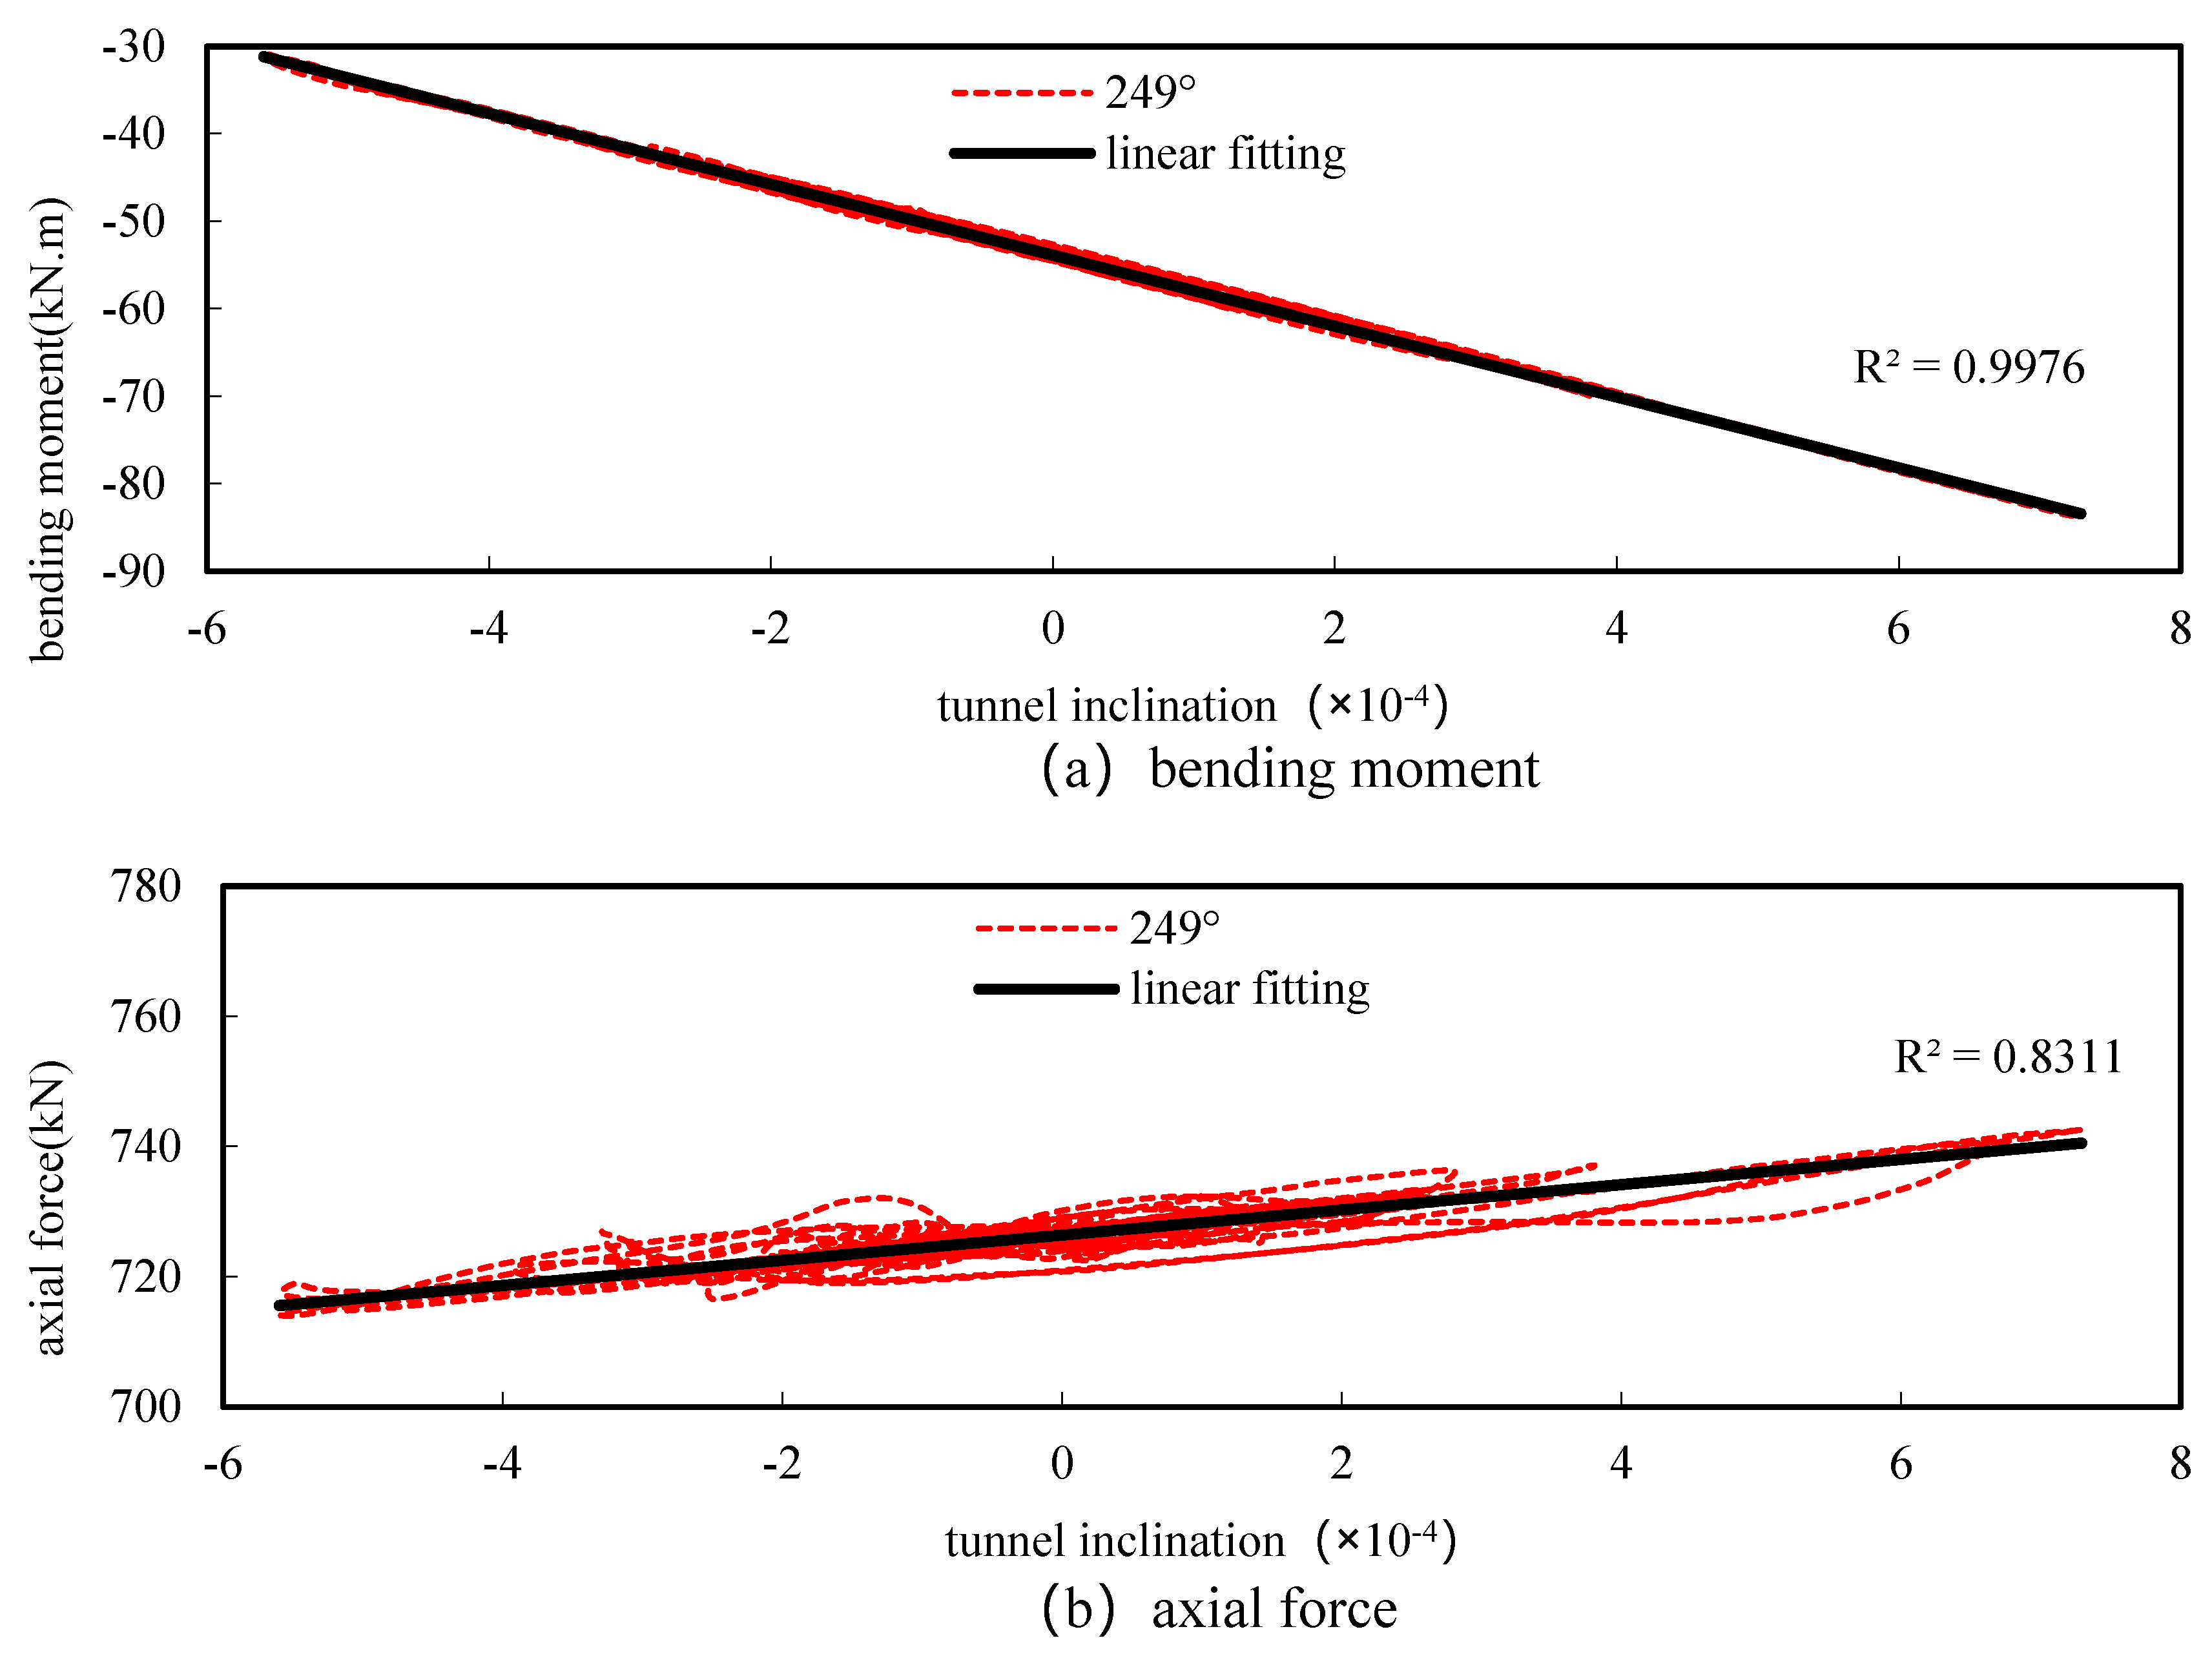
Figure 21.
Relationship between the internal forces and tunnel inclination at the minimum axial force (343°) under seismic action.
Figure 21.
Relationship between the internal forces and tunnel inclination at the minimum axial force (343°) under seismic action.

Figure 22.
Relationship between the internal forces and the tunnel inclination at 180° of the tunnel.
Figure 22.
Relationship between the internal forces and the tunnel inclination at 180° of the tunnel.
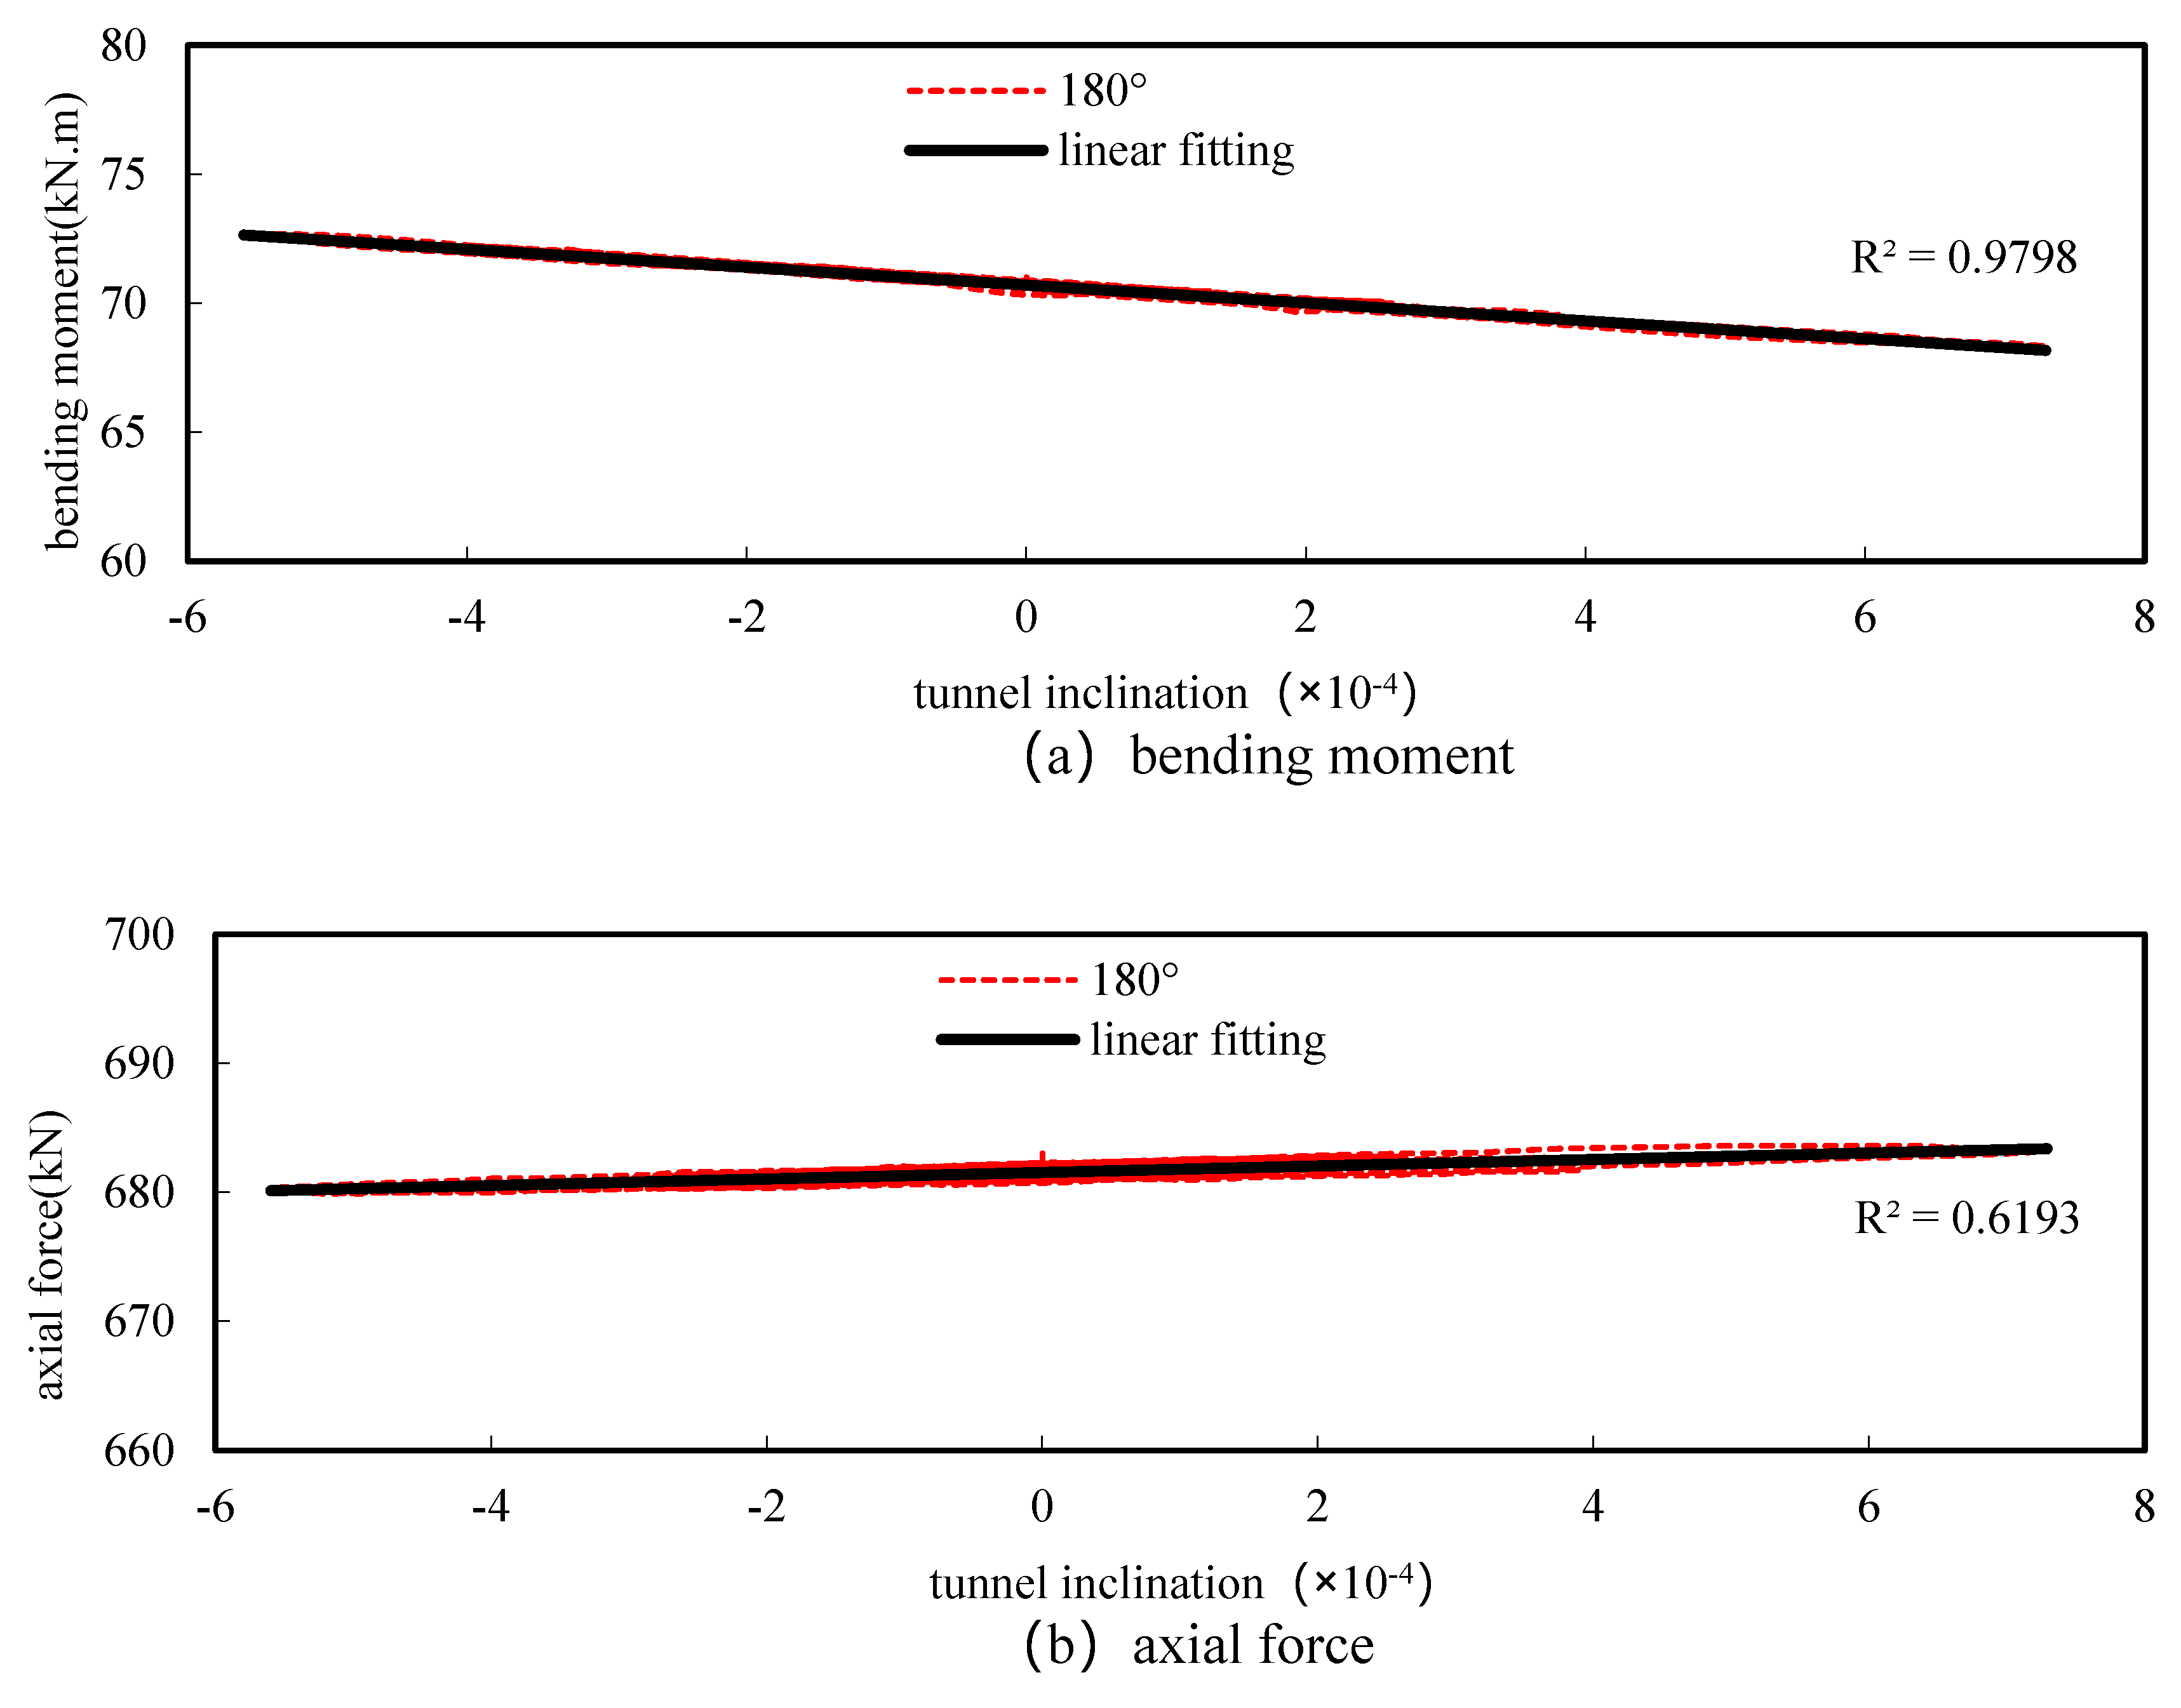
Figure 23.
Relationship between the internal forces and the tunnel inclination at 270° of the tunnel.
Figure 23.
Relationship between the internal forces and the tunnel inclination at 270° of the tunnel.
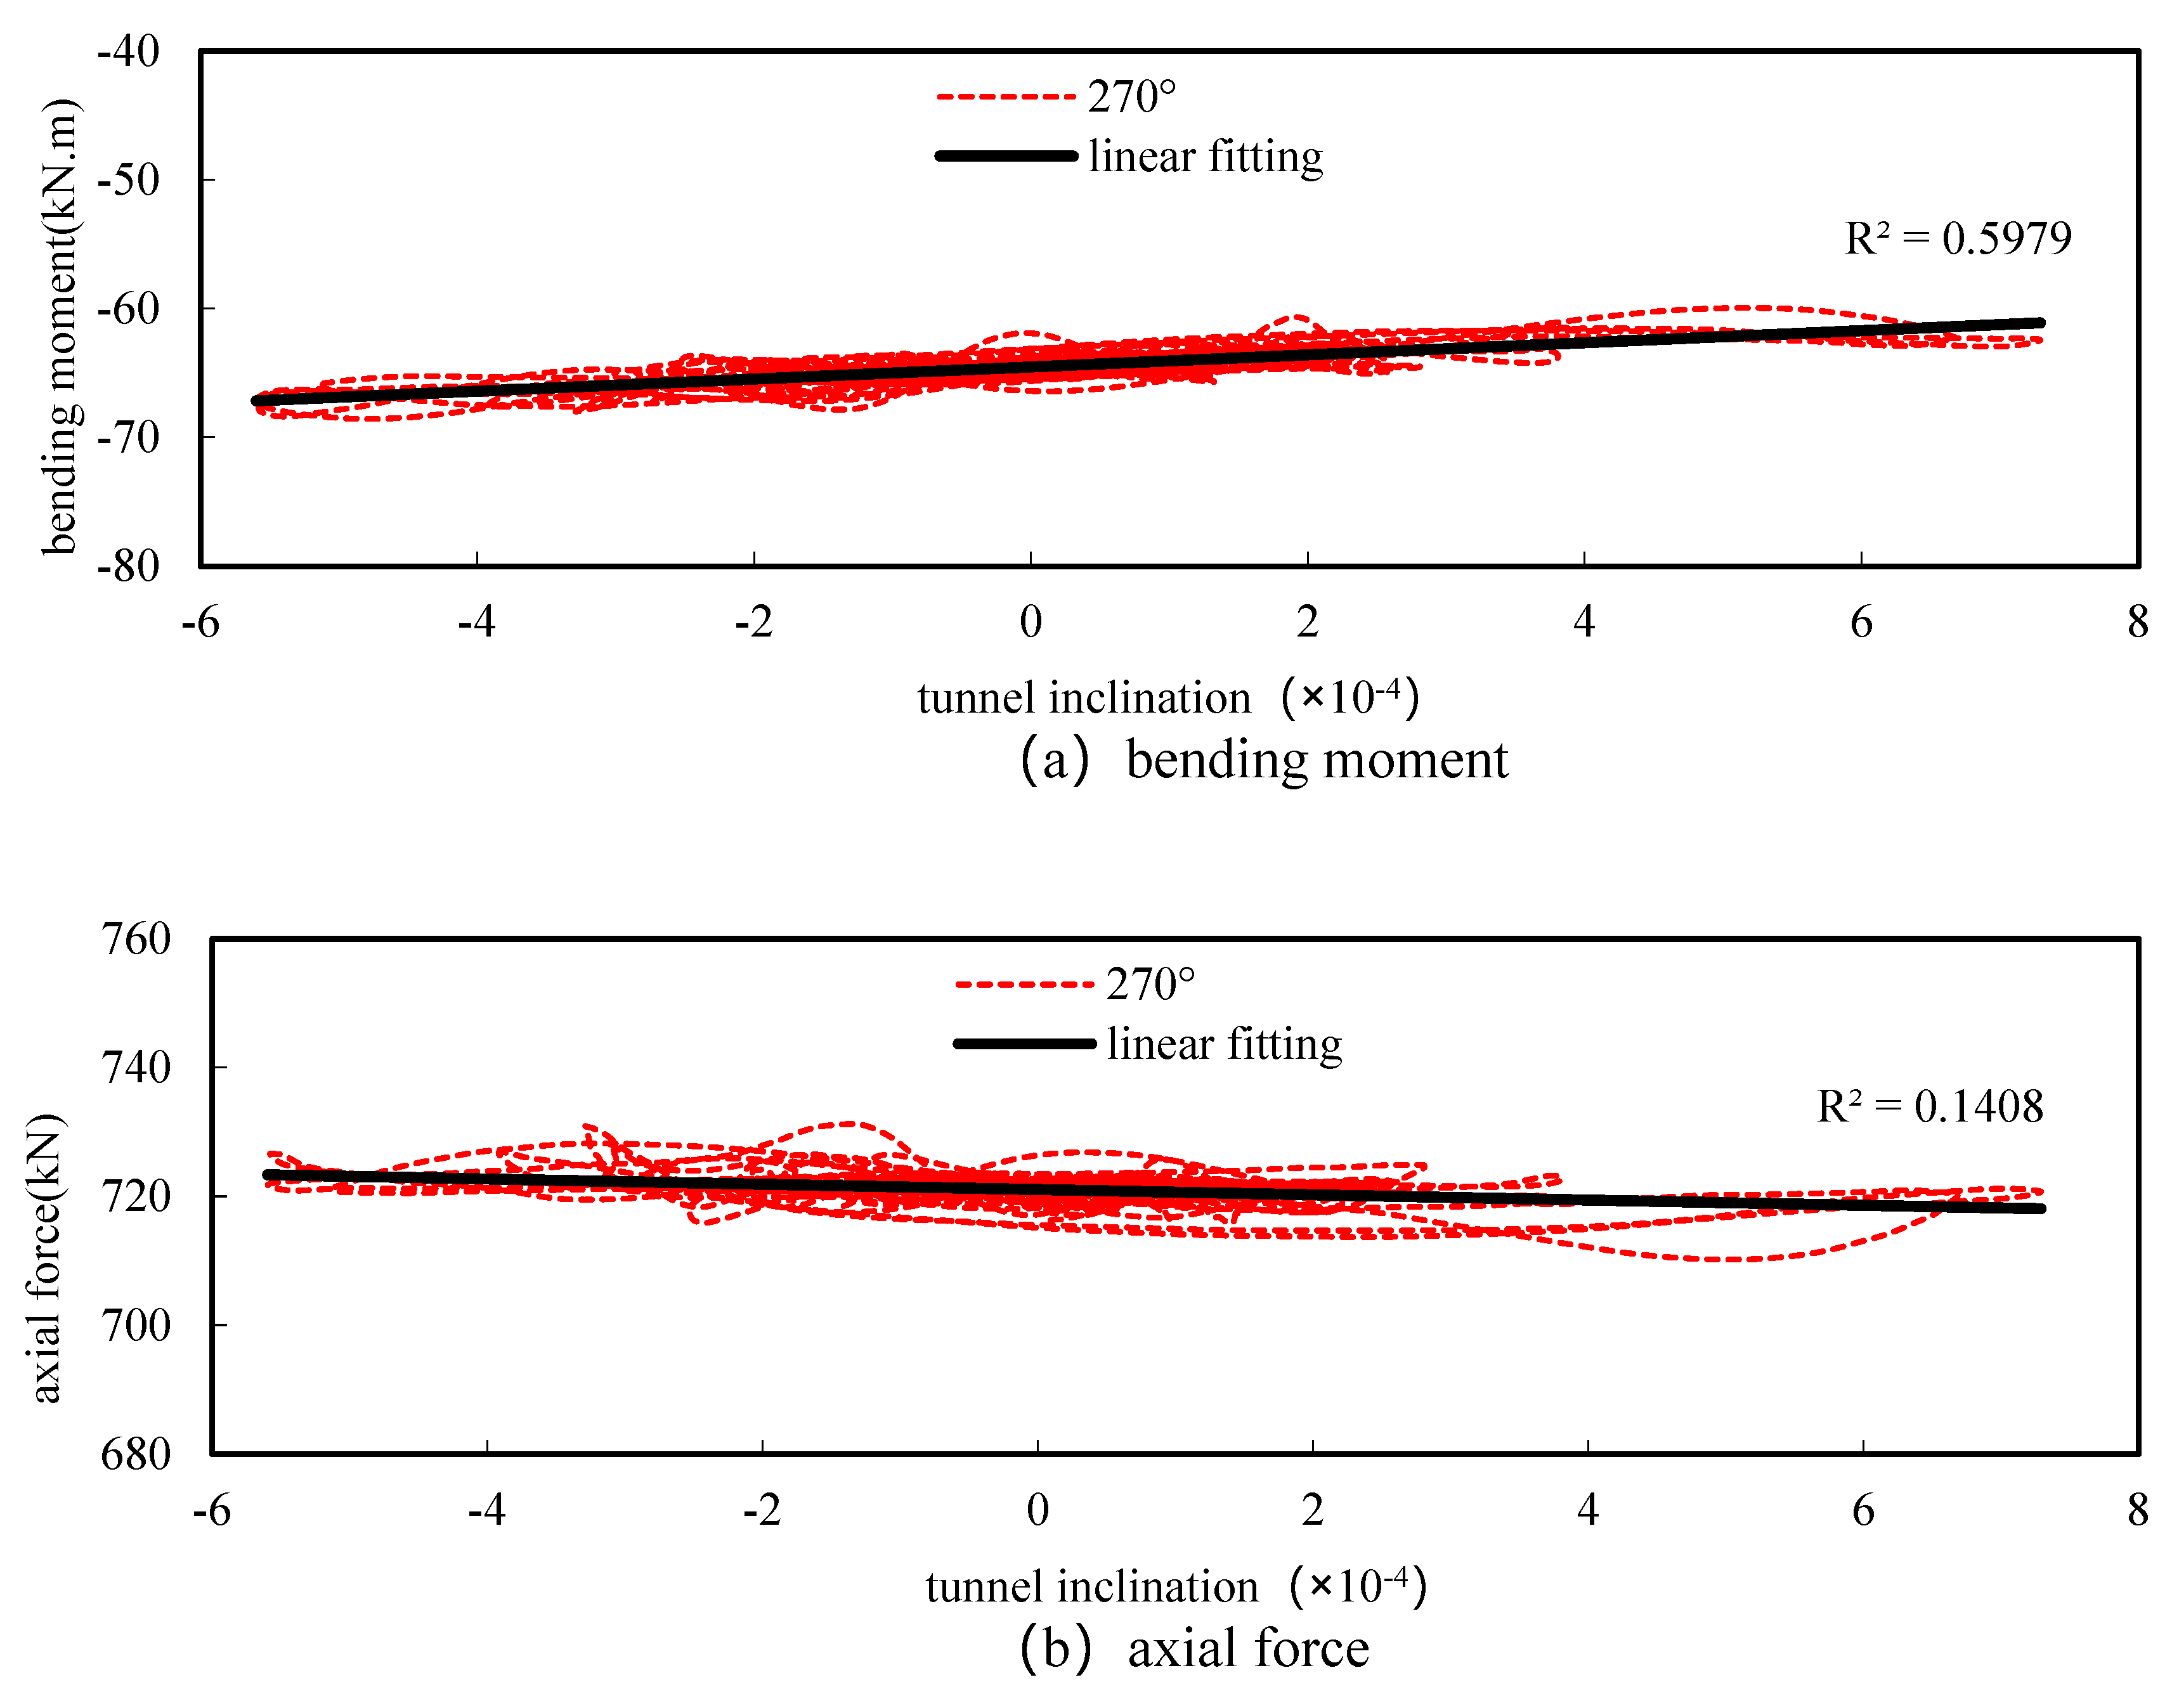
Figure 24.
Relationship between the internal forces and the tunnel inclination at 45° of the tunnel.
Figure 24.
Relationship between the internal forces and the tunnel inclination at 45° of the tunnel.

Figure 25.
Relationship between the internal forces and the tunnel inclination at 135° of the tunnel.
Figure 25.
Relationship between the internal forces and the tunnel inclination at 135° of the tunnel.

Table 1.
Soil parameters.
| Layer No. | Thickness (m) | Unit Weight γ (kN/m3) | c (kPa) | φ (°) | Coefficient of Static Lateral Pressure K0 | Shear Wave Velocity Vs (m/s) |
|---|---|---|---|---|---|---|
| ① | 2 | 18.4 | ||||
| ② | 10.8 | 18.5 | 4 | 29 | 0.4 | 220.4 |
| ④ | 5.5 | 17 | 13 | 10.5 | 0.55 | 161.2 |
| ⑤1 | 3.7 | 17.8 | 14 | 12 | 0.5 | 191.1 |
| ⑤2 | 9.9 | 18.2 | 4 | 28.5 | 0.4 | 194 |
| ⑤3 | 16.7 | 18.2 | 14 | 15.5 | 0.47 | 195.1 |
| ⑧ | 21.4 | 18.4 | 20 | 17.5 | 0.47 | 320 |
Table 2.
Parameters of reinforced concrete segment.
| Material | Elastic Modulus (MPa) | Poisson’s Ratio |
|---|---|---|
| C50 Concrete | 3.45 × 10⁴ | 0.18 |
Table 3.
Requirements for grid size.
| Material | Maximum Frequency of Seismic Waves (Hz) | Shear Wave Velocity (m/s) | Maximum Grid Size (m) |
|---|---|---|---|
| ② | 15 | 220.4 | 1.84 |
| ④ | 161.2 | 1.34 | |
| ⑤1 | 191.1 | 1.59 | |
| ⑤2 | 195.1 | 1.62 | |
| ⑤3 | 195.1 | 1.63 | |
| ⑧ | 320 | 2.67 |
Table 4.
The extreme values of internal forces in tunnels.
| 169° (Maximum Positive Moment) | 253° (Maximum Negative Moment) | 249° (Maximum Axial Force) | 343° (Minimum Axial Force) | |
|---|---|---|---|---|
| Maximum bending moment (kNm) | 77.43 | −83.98 | −83.69 | 70.61 |
| Minimum Bending Moment (kNm) | 55.07 | −38.94 | −30.81 | 30.89 |
| Conventional bending moment (kNm) | 65.49 | −58.48 | −53.98 | 47.80 |
| Maximum rate of change of bending moment | 18.2% | 43.6% | 55.0% | 47.7% |
| Maximum axial force (kN) | 693.50 | 740.40 | 741.90 | 651.10 |
| Minimum axial force (kN) | 677.85 | 717.55 | 715.35 | 629.00 |
| Conventional axial force (kN) | 690.60 | 722.30 | 722.25 | 643.90 |
| Maximum rate of change of axial force | 1.8% | 2.5% | 2.7% | 2.3% |
Disclaimer/Publisher’s Note: The statements, opinions and data contained in all publications are solely those of the individual author(s) and contributor(s) and not of MDPI and/or the editor(s). MDPI and/or the editor(s) disclaim responsibility for any injury to people or property resulting from any ideas, methods, instructions or products referred to in the content. |
© 2024 by the authors. Licensee MDPI, Basel, Switzerland. This article is an open access article distributed under the terms and conditions of the Creative Commons Attribution (CC BY) license (https://creativecommons.org/licenses/by/4.0/).
Share and Cite
MDPI and ACS Style
Yang, Z.; Liu, Y.; Chen, C. Correlation Analysis of Tunnel Deformation and Internal Force in the Earthquake Based on Tunnel Inclination. Buildings 2024, 14, 1395. https://doi.org/10.3390/buildings14051395
AMA Style
Yang Z, Liu Y, Chen C. Correlation Analysis of Tunnel Deformation and Internal Force in the Earthquake Based on Tunnel Inclination. Buildings. 2024; 14(5):1395. https://doi.org/10.3390/buildings14051395
Chicago/Turabian StyleYang, Zhiyong, Yin Liu, and Can Chen. 2024. "Correlation Analysis of Tunnel Deformation and Internal Force in the Earthquake Based on Tunnel Inclination" Buildings 14, no. 5: 1395. https://doi.org/10.3390/buildings14051395
Note that from the first issue of 2016, this journal uses article numbers instead of page numbers. See further details here.