

Field Testing of an Acoustic Method for Locating Air Leakages in Building Envelopes †

German Aerospace Center (DLR), Institute of Solar Research, Linder Höhe, 51147 Cologne, Germany
*
Author to whom correspondence should be addressed.
†
This paper is an extended version of our paper published in “Ventilation, IEQ and health in sustainable buildings”, 43rd AIVC—11th TightVent—9th Venticool Conference, Copenhagen, Denmark, 4–5 October 2023; Book of Proceedings; pp. 53–62, ISBN 978-2-930471-65-5. Available online: https://www.aivc.org/resources/collection-publications/aivc-conference-proceedings-presentations.
Buildings 2024, 14(4), 1159; https://doi.org/10.3390/buildings14041159
Submission received: 14 March 2024
/
Revised: 10 April 2024
/
Accepted: 15 April 2024
/
Published: 19 April 2024
(This article belongs to the Special Issue Research on the Airtightness of Buildings)
Abstract
:Maintaining the airtightness of building envelopes is critical to the energy efficiency of buildings, yet leak detection remains a significant challenge, particularly during building refurbishment. This study addresses the effectiveness of the acoustic beamforming measurement method in identifying leaks in building envelopes. For this reason, an in-field study employing the acoustic beamforming measurement method was conducted. The study involved testing over 30 rooms across three different multi-story office buildings of varying ages and heterogeneous envelope structures. Numerous leaks were located in the façades, which were subsequently visually confirmed or even verified with smoke sticks. The data, captured using an acoustic camera (a microphone ring array), revealed distinct spectra that indicate the method’s potential for further research. The basic functionality and the significant potential of this methodology for localizing leakages in large buildings were proven.
1. Introduction
Building envelope airtightness plays a significant role in the evaluation of a building’s energy efficiency [1,2]. Unintended airflow through building envelopes is responsible for 30% to 50% of a building’s heating and cooling energy, as assessed in studies of housing stocks from Finland [3], Estonia [4], and the UK [5]. Therefore, understanding and controlling unintended infiltration in buildings is important for energy conservation and environmental sustainability.
The prevalent method for assessing a building’s airtightness is the fan pressurization method or “blower door test”, as described in the ISO 9972 standard [6]. This technique is used to evaluate if buildings meet energy performance standards, compare the overall airtightness of different buildings, or check air permeability reductions post-refurbishment. However, it primarily provides an overall leakage rate, with the quantification and identification of individual leaks being challenging, time-consuming, and heavily reliant on the operator’s experience. Supplementary methods such as smoke stick use, anemometers [7], infrared thermography (e.g., qualitative [8,9], differential [10] or lock-in [11] methods), or tracer gases [12,13] are used for leak detection but have limitations, including the need for pressure differences or temperature gradients. Moreover, several innovative techniques have emerged as alternatives to the fan pressurization method, broadening the toolkit available for airtightness assessment [14].
In this context, this paper is located at the intersection of building science and acoustic engineering, addressing the need for efficient and reliable airtightness assessment methods. It explores the potential of acoustic methods as a supplementary approach to identify and quantify individual leaks in building envelopes. Acoustic testing, which is particularly appealing due to its non-invasive nature, does not require significant air movement through the envelope, allowing for assessments under naturally occurring low or no-flow conditions. Additionally, they do not depend on closed volumes, making them particularly suitable for use during the different stages of a building’s lifecycle, including construction and renovation, when traditional methods might be less effective or feasible.
The ASTM E1186 standard [7] introduces an acoustic approach for detecting leaks, proposing the use of sound detection. Originating from the work of Keast et al. [15] in the 1970s, this standard highlights the use of acoustic measurements for assessing building envelope integrity. Despite its potential, the efficacy and accuracy of this acoustic method have not yet been comprehensively studied. Early work by Sonoda and Peterson [16] introduced a sonic method for air leakage measurements, employing single microphones to characterize air leaks. Iordache et al. [17,18] introduced an approach correlating sound transmission loss with air infiltration rate to quantify unintended air infiltration through envelope components, which was later discussed by Hassan [19] and Berardi et al. [20]. While Graham [21] and Card et al. [22] considered measurements of infrasonic impedance for leakage determination, Kölsch et al. [23,24] focused on higher ultrasonic frequencies for locating and quantifying air leaks.
Recent advancements have seen the exploration of microphone arrays and beamforming techniques to detect air leakages, a method traditionally used in fields such as aerospace [25]. This technology, utilizing microphone arrays to detect sound wave patterns, presents a non-invasive and potentially more efficient alternative for identifying air leakages in building envelopes. In this context, Raman et al. [26] utilized beamforming and nearfield acoustic holography to detect and quantify leaks from a single window and door. Further studies [27,28] have focused on investigating single parts of building envelopes (e.g., single windows or doors) using microphone arrays and beamforming.
Our research extends the existing literature by undertaking (to our knowledge) the largest measurement campaign aimed at assessing building envelope airtightness using acoustic methods. This campaign was conducted on a building complex characterized by highly heterogeneous façades, encompassing a wide variety of materials, ages, and construction techniques, where the locations and extents of air leakages were previously unknown. This contribution provides valuable insights into the applicability and effectiveness of this method to real-world environments. Specifically, we expand the analysis of previous work [29] on pattern recognition in the selected acoustic spectra of leaks.
The main aim of our study is to demonstrate and validate the effectiveness of acoustic beamforming technology in large-scale, real-world scenarios for assessing building envelope airtightness. By conducting field tests on a variety of office buildings with differing ages and construction styles, this study presents an extensive application of this method.
2. Methods
2.1. Test Site
This study was part of a larger research project that also encompasses a UAV (unmanned aerial vehicle)-based infrared thermography assessment for U-value determination of the same building complex [30]. Within this larger project, three institute buildings were pre-selected. We obtained detailed information about the building’s location, size, and structure from the institutions. Five assessment criteria were used to determine the test site: (1) the feasibility of drone flight accessibility, ensuring safe and unrestricted UAV operations; (2) the heterogeneous age of the structure of the building parts, with a similarity in their usage to allow for comparative analysis; (3) variability in the façade designs among the building parts with comparable use to assess the impact of architectural diversity; (4) an overall size of the building complex that allows for complete capture; (5) a relatively simple geometric structure, facilitating the rapid and reliable creation of 3D models. The selected test site for this study was a research institution located in Villingen-Schwenningen, Germany. This site comprises five distinct buildings, each serving different functions and constructed at various times, thus offering a diverse test environment. For the purposes of this study, our focus was narrowed to the office buildings, designated as parts A, D, and E. These buildings were selected based on their construction or renovation years—approximately 1990, 1998, and 2019, respectively—providing a range of ages and construction styles for analysis. At the forefront of the measurement campaign, the staff working in Building D had often commented on draughts in the building. Building B is utilized for clean rooms, whereas Building C accommodates a cogeneration unit. An aerial photograph (refer to Figure 1) provides a visual representation of the site, including the labelling of the individual building parts, thereby offering a comprehensive overview of the measurement context.
2.2. Measurement Setup
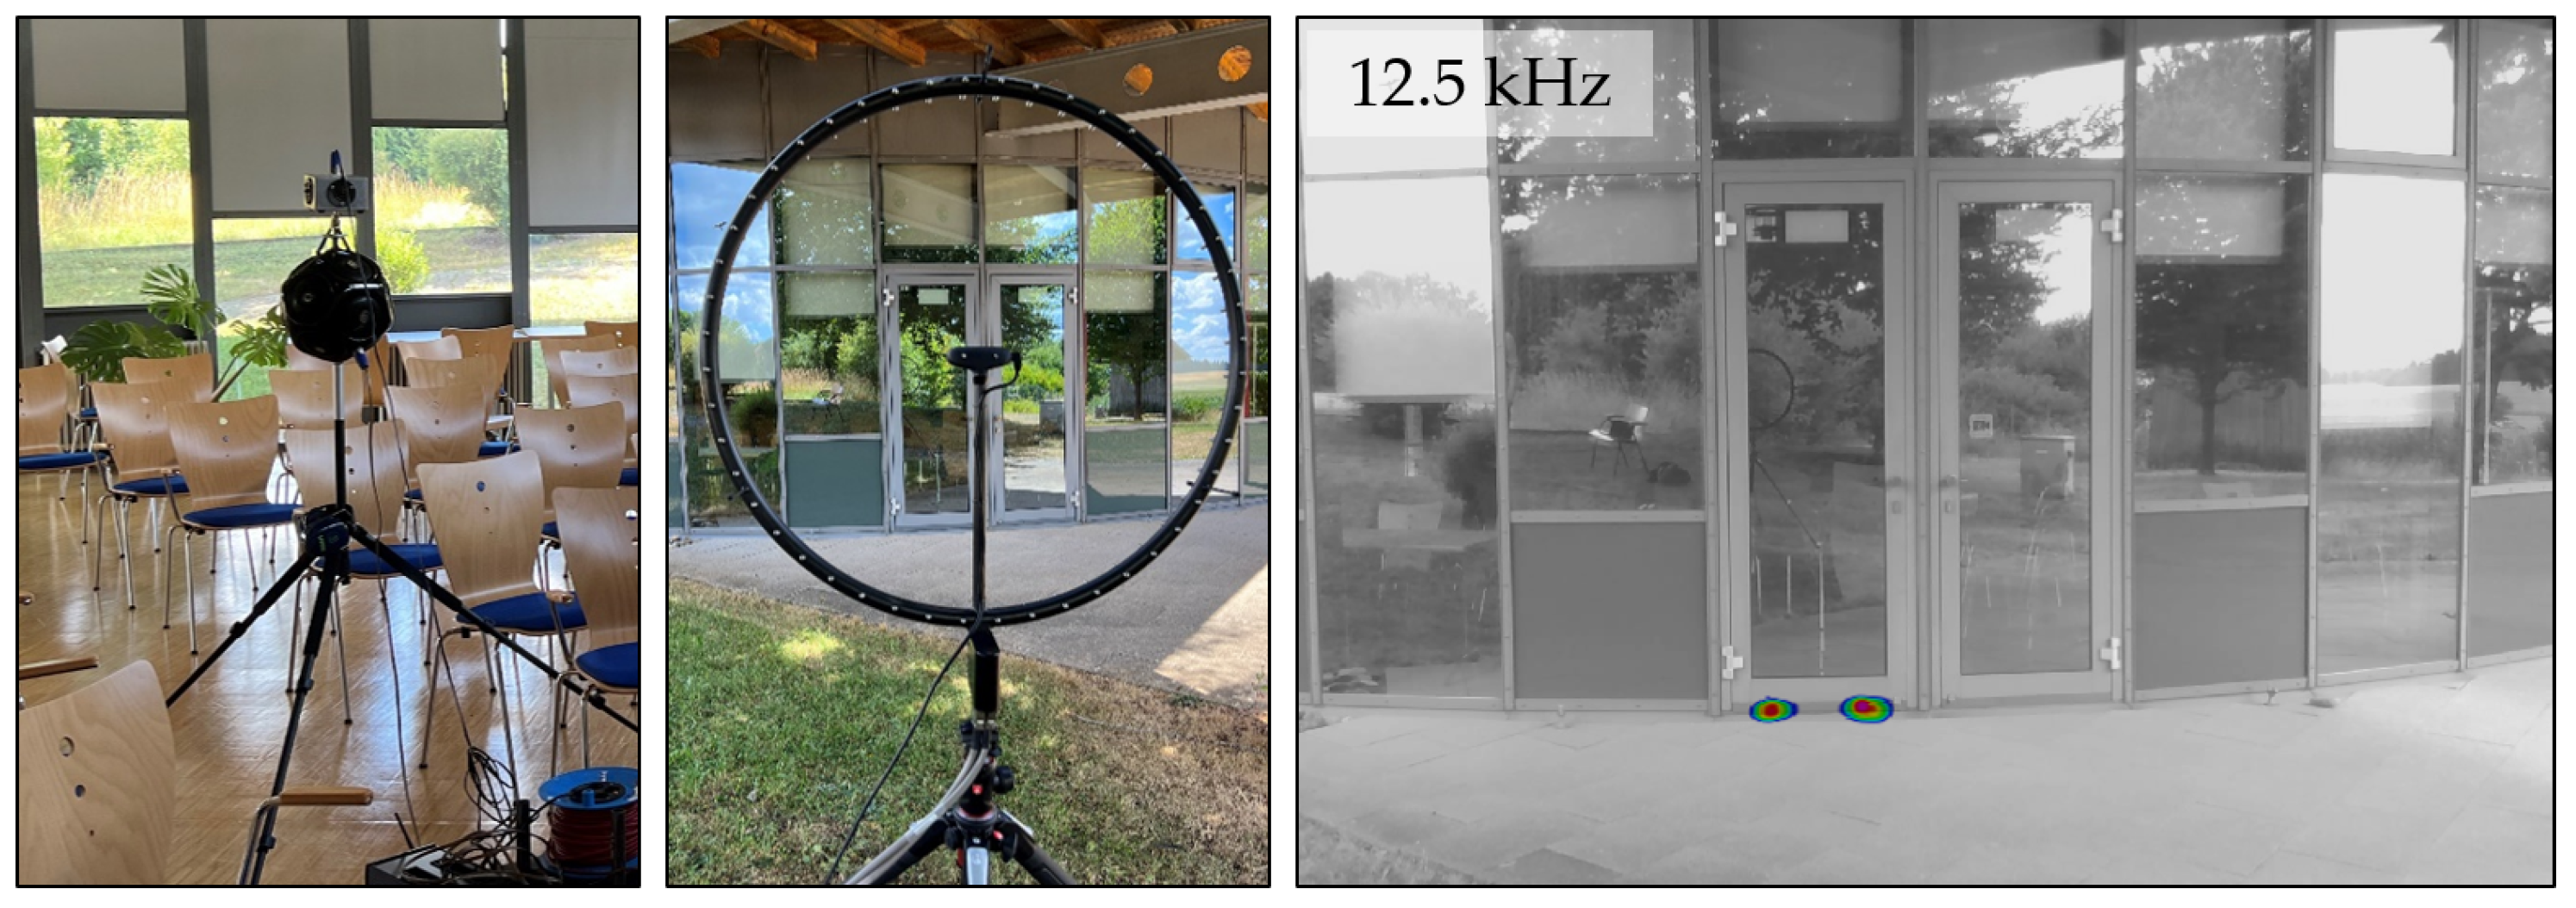
During the measurement campaign, an acoustic camera was used to capture acoustic data. The acoustic camera is a device engineered to make sound waves visible to the human eye. The primary function of an acoustic camera is to capture sound pressure variations over time and space, converting these into a form that can be visualized and interpreted. By using beamforming, the device synthesizes the data collected by its microphone array, enabling it to pinpoint the direction and relative intensity of sound sources. The resulting visualization takes the form of a sound map that is superimposed on a visual image of the area being surveyed, which highlights the spatial distribution of sound intensity, thereby identifying the locations of sound-emitting objects (Figure 2, right).
The experimental setup included a pair of speakers placed inside the building (Figure 2, left) on one side of the wall and the acoustic camera positioned externally (Figure 2, center) on the opposite side. A high-frequency speaker, operating with a frequency range of 15 to 120 , and a low-frequency dodecahedron speaker, covering 0.05 to 16 , ensured the generation of sound waves that penetrated through wall leaks, detectable by the acoustic camera as discrete sound sources from the wall’s exterior. The computer-generated white noise signal was emitted inside at a sound pressure level of 85 dB for a duration of 4 . The arrangement of the acoustic camera and speakers was kept stationary during the measurement of each room. The measurement campaign encompassed a total of 57 acoustic measurements across 36 investigated rooms. Some rooms featuring façades on different sides of the building necessitated multiple measurements to ensure thorough coverage.
The microphone array used in these experiments is the “Acoustic Camera Array Ring48 AC Pro” from the company gfai tech GmbH. It is characterized by its ring configuration, consisting of 48 equally spaced microphones arranged in a circle with a diameter of . This particular geometry was selected for its reduced sensitivity regarding the accuracy of the focal distance compared to other array configurations [31]. Such a feature is helpful for measurements of non-homogeneous outside façades. The array was designed to capture a wide range of frequencies, ranging from 164 to 20.000 . However, for applications where sound source localization is more important than the absolute measurement of sound pressure levels, the manufacturer indicates the feasibility of extending this range up to 60 . This broad frequency range is crucial for accurately identifying and analyzing the diverse acoustic signatures associated with different types of leakages in building envelopes.
An optical camera was placed at the center of the microphone array to capture a visual image of the surroundings being measured. This camera offers a resolution of 1920 × 1080 pixels. Along with the acoustic data, this visual documentation provided a comprehensive dataset for analyzing the presence and characteristics of air leakages in the building complex.
In each room, one person was responsible for setting up the loudspeaker, and the other focused on positioning the acoustic camera towards the room’s façade. Communication between the team members, e.g., signaling the start of the measurements, was managed through hand signals or via mobile phones. Following an initial evaluation of the collected data, obvious causes for the most prominent acoustic signals were sought. Detailed notes on the measurement procedures, the environmental conditions, and any notable findings were meticulously recorded on a protocol sheet. This careful documentation facilitated the seamless transition to the subsequent room’s measurement setup.
All acoustic signals captured during the measurement campaign were sampled at a high frequency of 192 and digitized at a resolution of 32 bits. Data analysis was conducted using the software NoiseImage [32]. This high-resolution data capture ensures the accuracy and reliability of the measurements, facilitating detailed analysis of the acoustic characteristics of air leakages.
While we were able to reduce the disturbing influence of external sound sources in the past by recording reference signals next to the speaker inside the building [27], we did not do so in this study for efficiency and time-saving reasons.
2.3. Acoustic Air Leakage Detection
The utilization of beamforming in acoustic air leakage detection shows the integration of advanced signal processing techniques with practical building diagnostics. Beamforming is a signal processing method that differentiates sound sources based on their directional origins by utilizing a microphone array. This technique focuses on scanning a target point (denoted as ) across a predefined grid on the object under inspection. The operation of beamforming in the context of acoustic air leakage detection involves computing a time function, , for each focus point, as described by the following equation [33]:
In this process, the time signals from individual microphones, , are superimposed with a specific time delay, , which corresponds to the sound wave’s travel time from the focus point on the building’s façade to the microphone. Subsequently, the time-corrected signals from all microphones are summed and divided by the total number of microphones, M, yielding a time signal for each focus point.
Following the temporal alignment of the microphone signals, the next step involves calculating the effective sound pressure, , at each focus point:
Here, n represents the total number of discrete time samples, and is the time at the sample index k. The individual sound pressure values, derived from the microphone array signals, are mapped onto the pixels of the optical camera image capturing the same scene. This mapping is achieved by superimposing the acoustic values, , as colors onto the optical camera image. Such a visualization technique offers a clear and intuitive representation of sound sources. Further information on this operating principle is outlined in Refs. [27,33,34].
This acoustic method does not rely on temperature or pressure differences in the building envelope, unlike the well-established infrared thermography method for visualizing leaks.
2.4. Evaluation and Categorization of Acoustic Signals
The measurement campaign carried out indicates that sound sources signaling potential leaks are usually detected in the spectral range from 800 to 25 with the equipment provided. There are 16 third-octave frequency bands within this range. In each of these bands, only the highest dB of the recorded sound pressure levels (hereafter referred to as peaks) are superimposed on the visual image. Due to the occurrence of sound peaks at different locations in different frequency bands, indicating potential leaks at different locations, it is rarely possible to image all leaks at the same time. Typically, a sequence of images across different frequency bands is required to illustrate all potential leakages found in the building envelope.
This is demonstrated in Figure 3, which presents Room 206 (Building D, east façade), showcasing 15 out of the 16 examined third-octave frequency bands. In this representation, the highest sound peaks are highlighted for each frequency band, with the value being individually adjusted to ensure optimal visualization. In order to understand the necessity of depicting the entire range of frequency bands, we will examine the top edge of the first window from the left. There, the sound peaks are only evident in frequency bands 2, 3.2, 6.3, 8, and 10 . Conversely, at the top of the fourth window frame from the left, the sound peaks are only visible at the frequency bands of 0.8, 1.3, 4, 5, 10, 16, and 20 .
Not every sound peak is necessarily indicative of a leak; they can also be caused by sound reflections or structure-borne noise, such as vibration, which can cause locally high sound levels. The sound peak on the pane from the fourth window from the left in the 10 frequency band in Figure 3 is clearly at an implausible location for a leak and is more likely caused by the vibration of the pane.
Nevertheless, in many instances, visual inspection at the location of the sound peaks confirmed credible causes of air leakage. In some rooms, a blower door and smoke stick were used to definitively confirm a leakage at the location of a sound peak.
However, often, the cause of a sound peak could not be clearly confirmed due to limited time resources. These peaks, therefore, required a subjective assessment of their plausibility as being leakage-related, which is described below.
Assessing individual peaks across all 16 third-octave frequency bands in all 57 measurements (totaling 912 analyzed frequency bands) necessitated the manual adjustment of the signal’s peak value in the NoiseImage software [32]. This adjustment enabled the signal peak to be depicted as the most compact area possible, pinpointing the precise source location. It can be assumed that the spatial resolution of this method depends on the wavelength and is, therefore, more reliable at higher frequencies than at lower ones. The peak position is then utilized to assess the plausibility of a leak as the source of the sound at that particular location. Table 1 outlines the four evaluation categories along with their respective color codes and scores.
The precise localization of a large number of sound peaks is a laborious manual process, and the evaluation categories are based on subjective criteria with fuzzy boundaries. Both tasks are, therefore, currently time-consuming and error-prone. Nevertheless, the method enables the documentation of the rating on the façade representation using the corresponding color code, as shown in Figure 3. This visualization can be used to identify potential leakage points on the façade for inspection and possible sealing. However, this process currently requires multiple images for different third-octave frequency bands.
The multi-frequency assessment score (MFAS) is introduced as a quantitative measure of the airtightness of a room. It is calculated as the sum of the acoustic assessment scores (AASs) (see Table 1) corresponding to the highest color codes in each third-octave frequency band. This calculation rule is admittedly arbitrary. Other options, such as adding the number of peaks occurring for each third-octave band rather than the maximum color code occurrence, seemed to give less reproducible results. Therefore, the simplest possible definition of “multi-frequency score” was chosen.
2.5. Evaluation of Spectral Properties
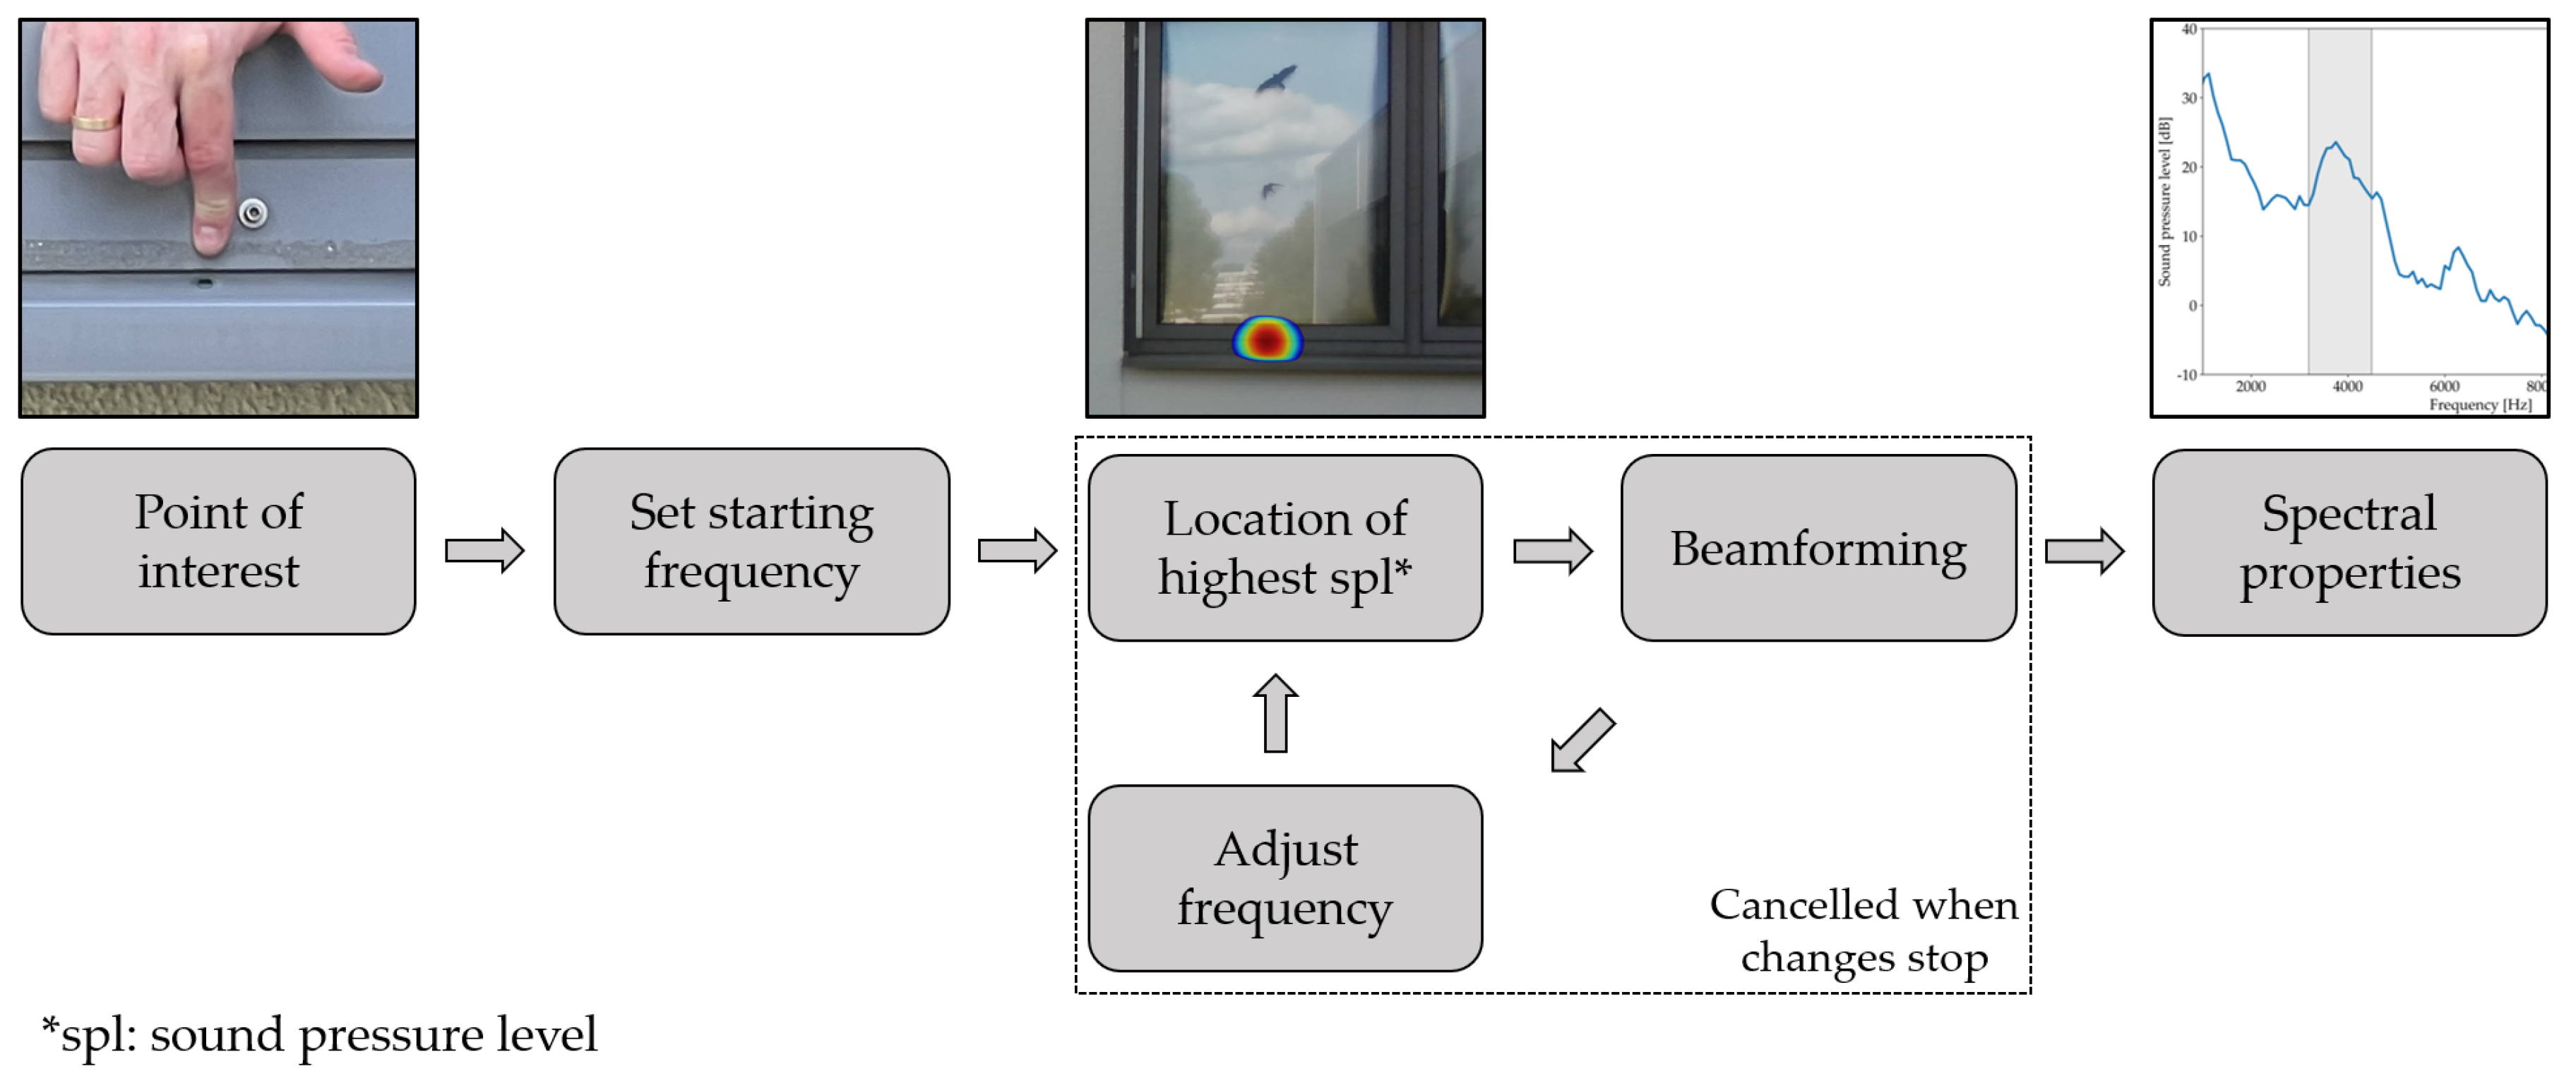
In order to obtain the spectral characteristics of a point of interest (e.g., a potential leak) within the acoustic image, an iterative process is required. The first step is to analyze the sound pressure level across the entire recorded image. This involves examining individual frequency ranges, usually in one-third octave band intervals. After the frequency range has been found in which the sound pressure level at the location of a point of interest is the highest or can be best distinguished from the rest, the beamforming method is used to obtain its spectrum. The next step is to adjust the examined frequency range so that the peak sound pressure level of this point falls exactly within the limits of the frequency. With the new frequency range, the location of the highest sound pressure level may also change. If this happens, the beamforming method is applied to the new point. The resulting spectrum will then be looked at once again, and the frequency limits will be adjusted accordingly. This iterative process is stopped whenever the point with the highest sound pressure level changes by less than 5 pixels as a result of the frequency range adjustment; otherwise, the process will get caught in an infinite loop. The whole process is graphically illustrated in Figure 4.
3. Results and Discussion
3.1. Examples of Detected Air Leakages
Our investigation led to the identification of various air leakages across more than 30 rooms, demonstrating the potential of the beamforming method to locate possible leakages but also illustrating the challenges associated with the method. This section highlights specific examples of detected leakages, emphasizing the method’s practical application.
The first example shows a substantial leakage in the cladding seal at the top of a window, as shown in Figure 5. The seal was severely damaged, facilitating mold growth within the cavity of the insulated glass, allowing a twig to penetrate several centimeters deep into the cladding. This example demonstrates the strengths of the beamforming method, as the leak, which caused significant damage to the building, was quickly and accurately detected by the acoustic camera and, unlike conventional methods, did not require blower door testing to locate the leakage.
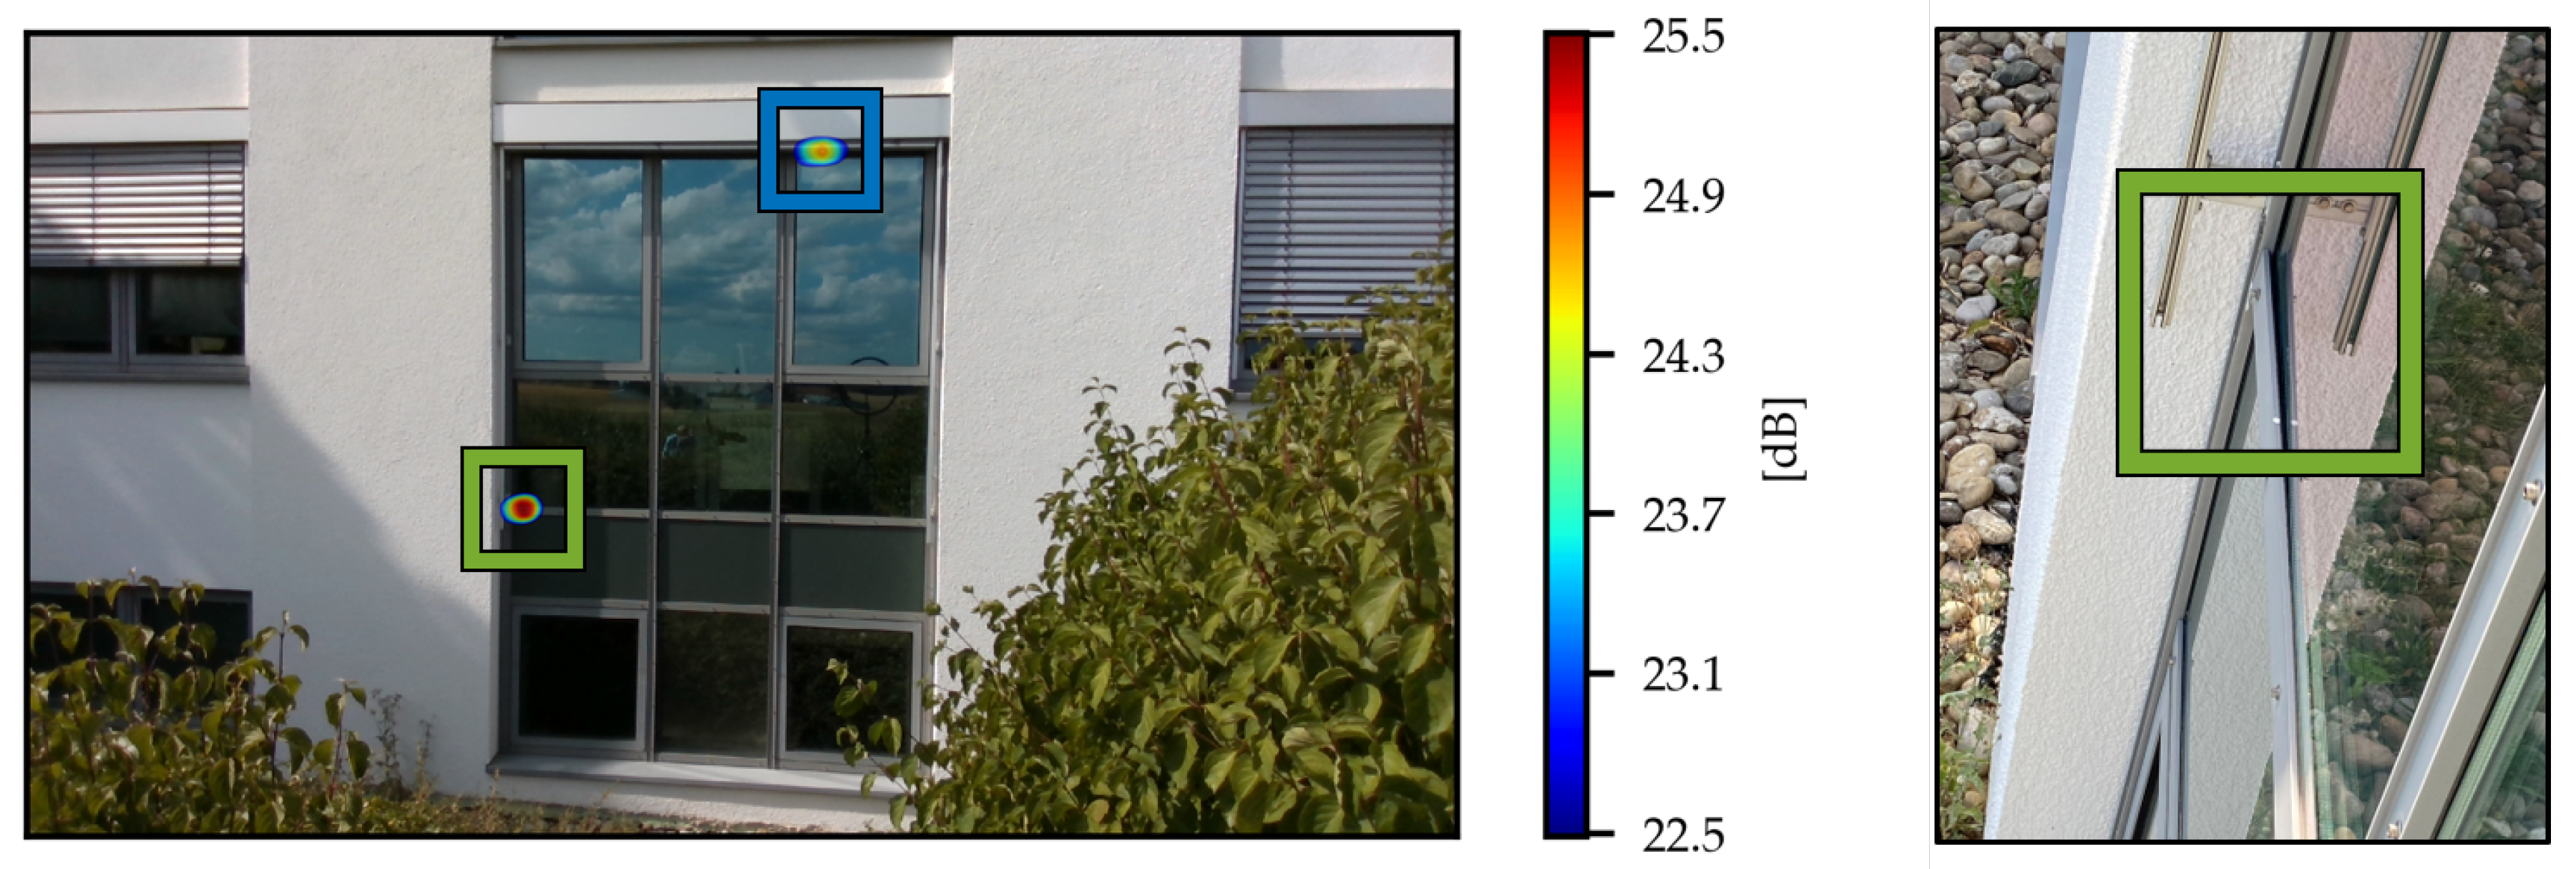
Figure 6 shows a second example of detected leaks located on a large window front. The more prominent one (in green), located in the center left of the front, was caused by a protruding window panel and the seal underneath it.
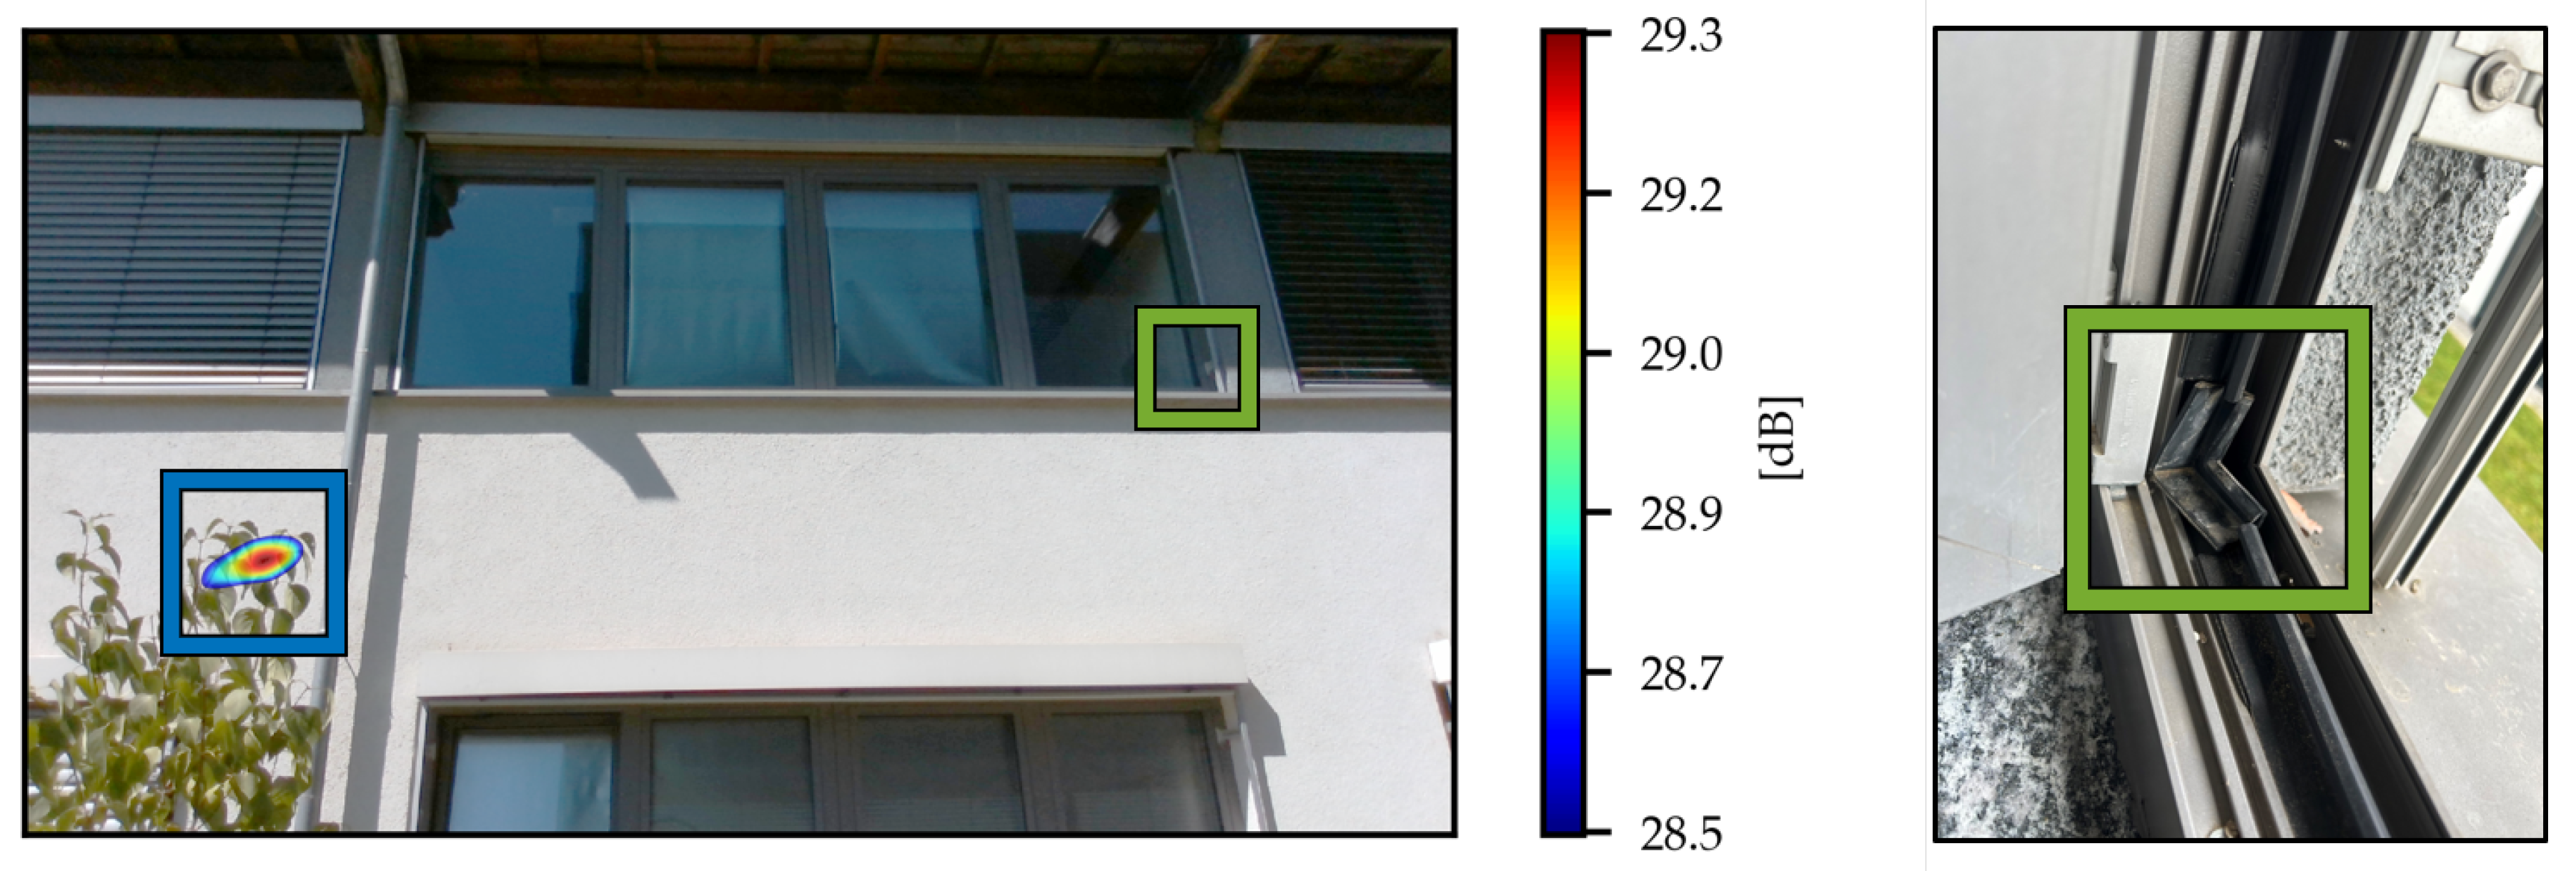
The third example shown in Figure 7 illustrates a notable challenge associated with the acoustic measurement method. Although visual inspection suggested the presence of several potential leaks, including a broken window seal on the examined façade (in green), these were not detectable in any of the frequency ranges examined. However, these suspected leaks were not confirmed through alternative verification methods either. Instead, the method was sensitive to other sources of sound, notably the rustling of leaves (in blue), which represent the point of highest sound pressure level over a wide bandwidth.
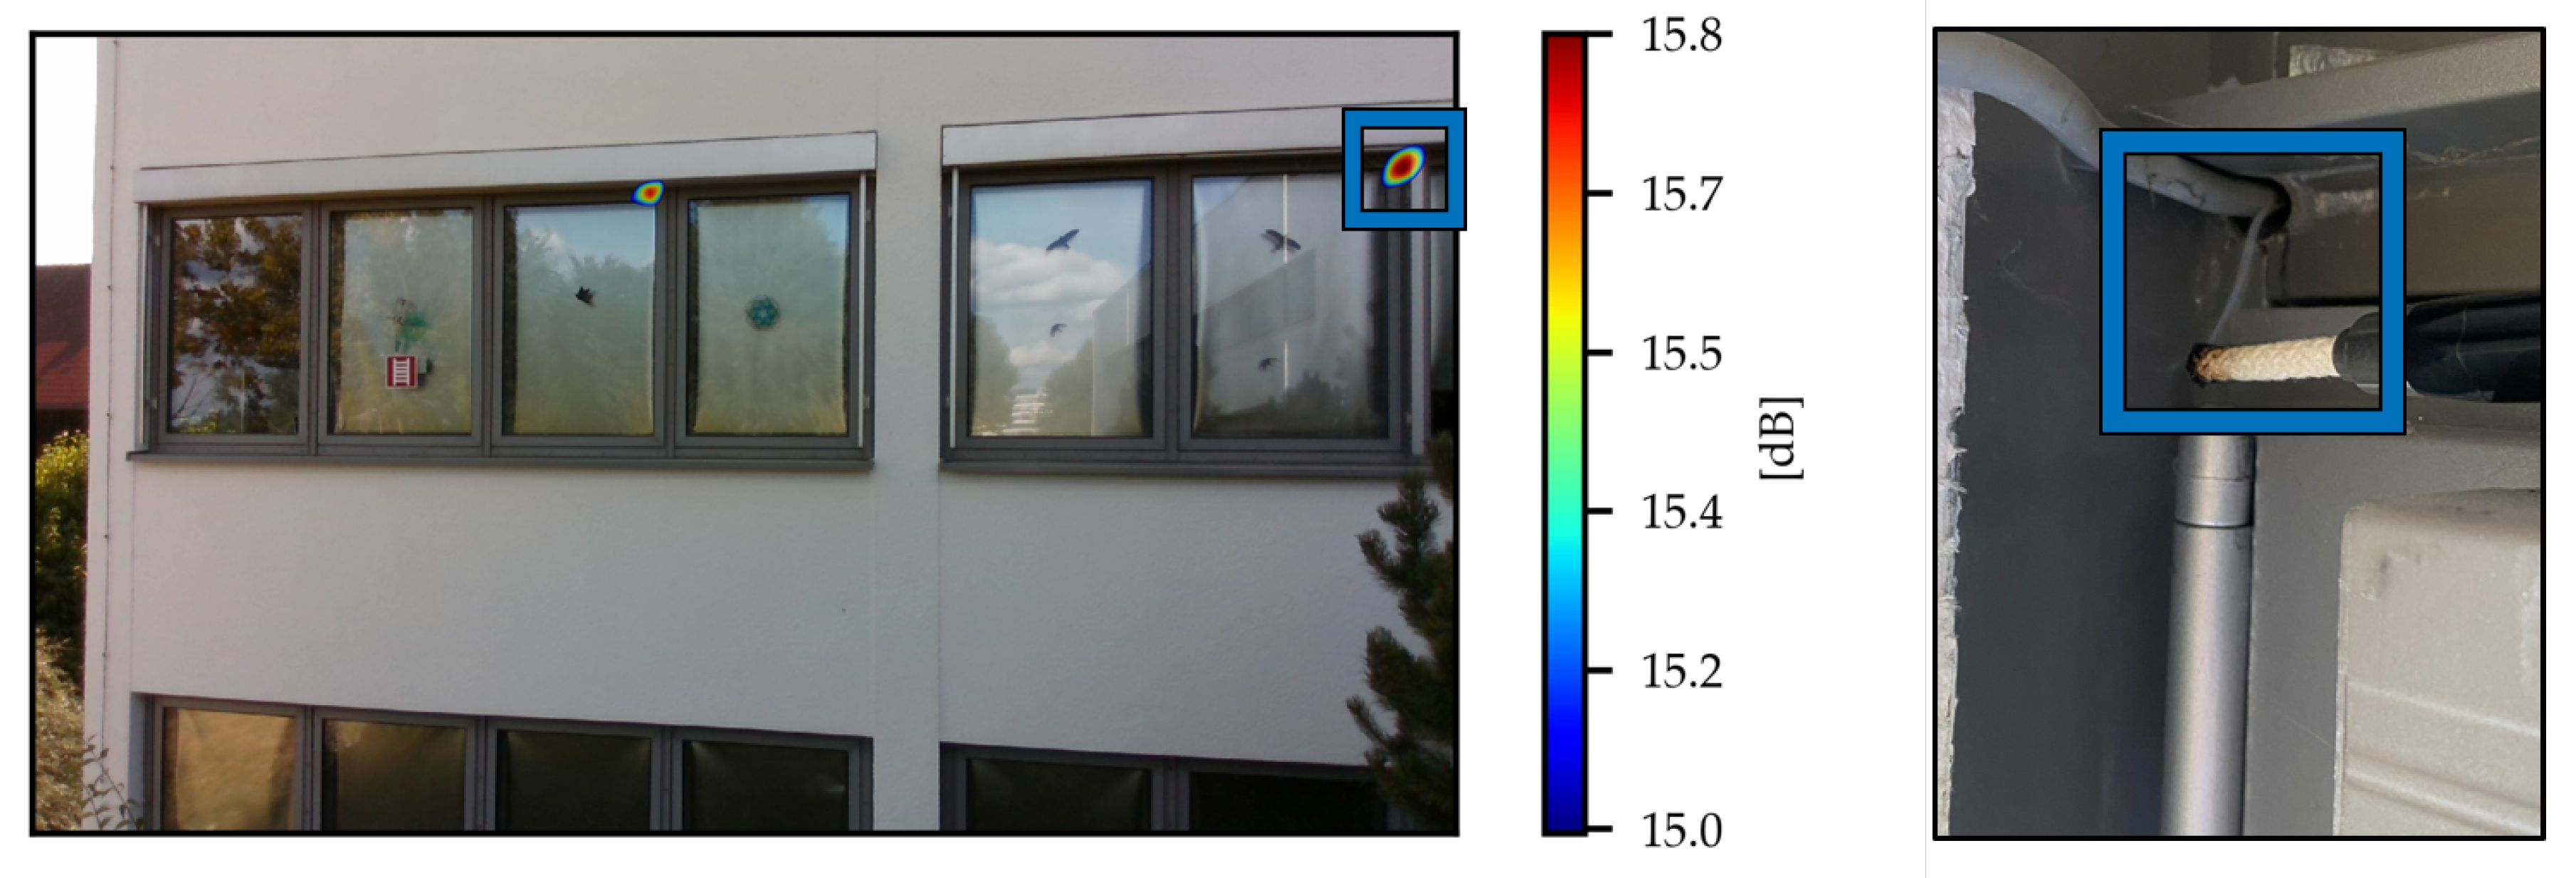
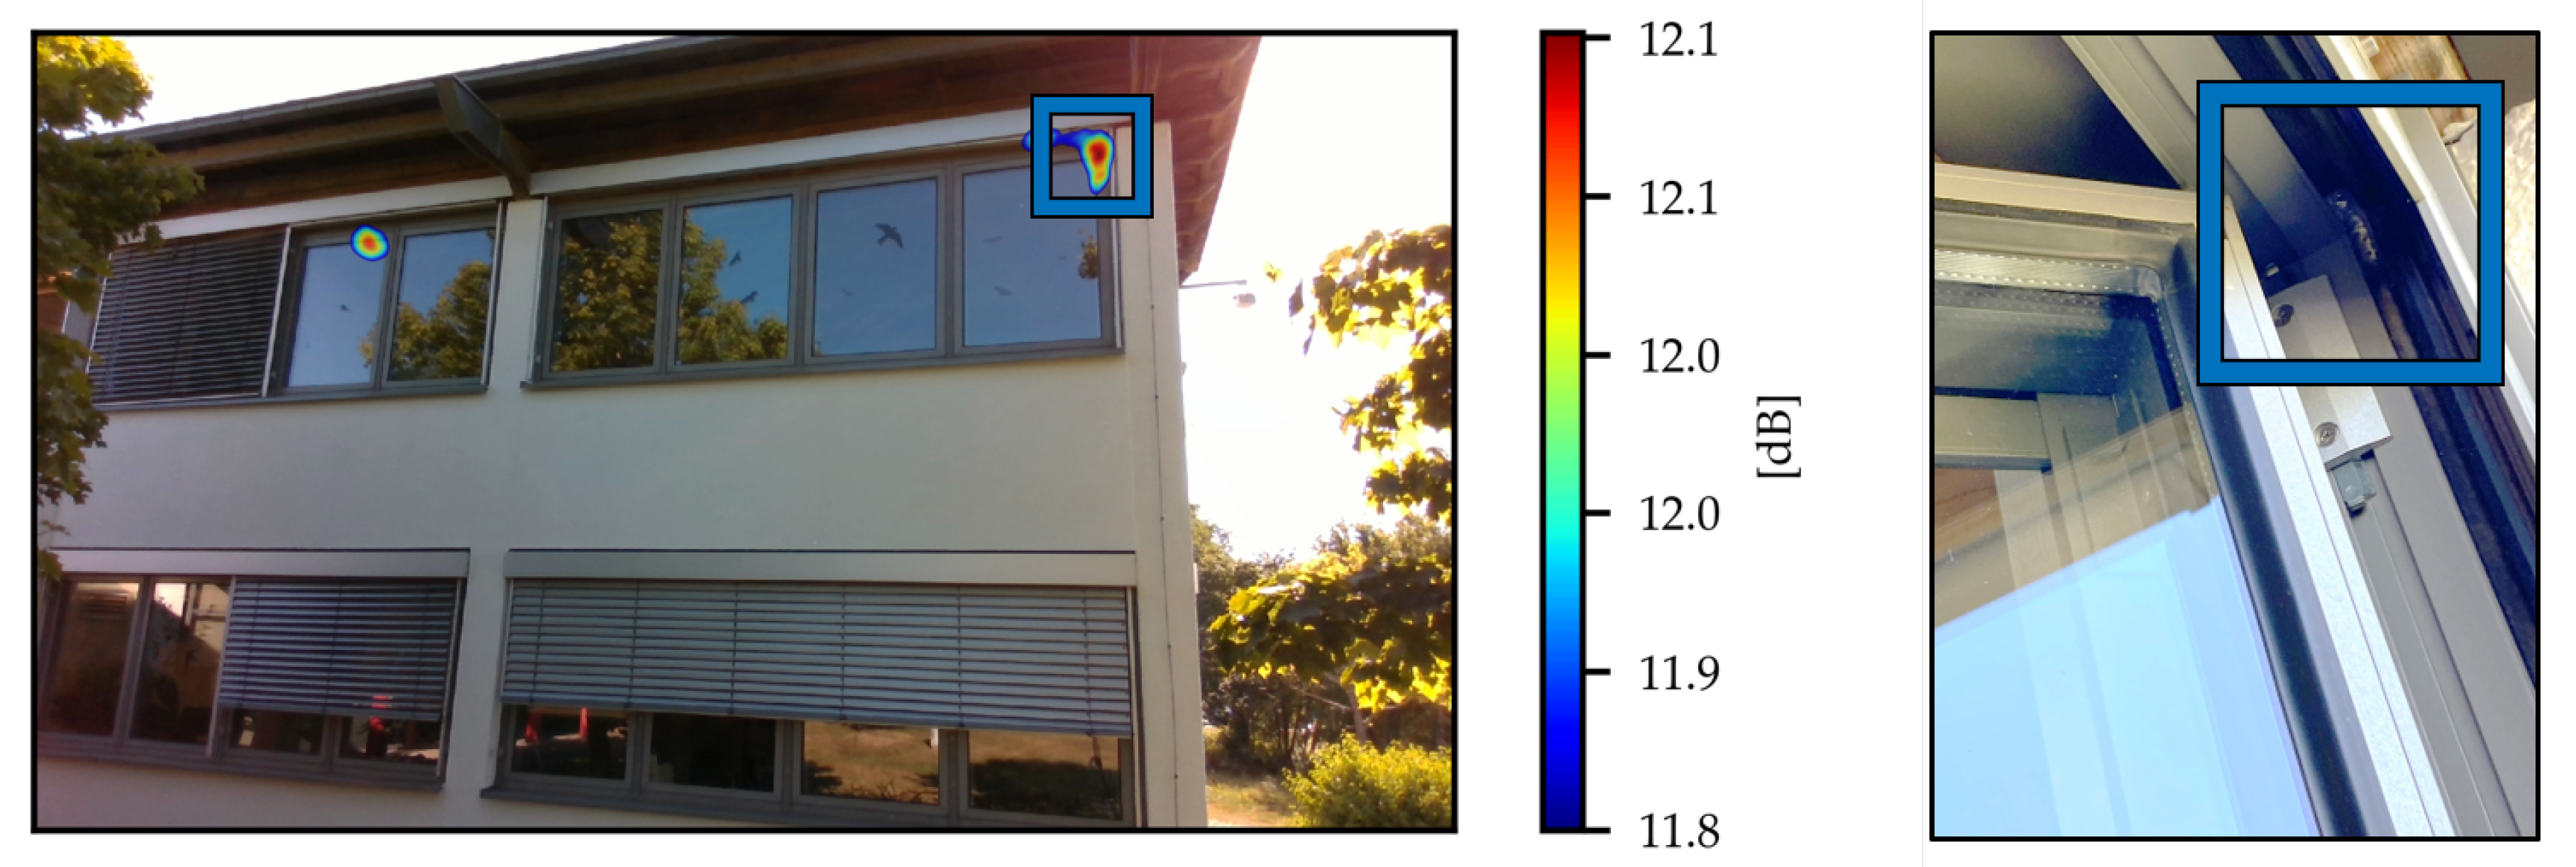
In Figure 8 and Figure 9, two additional points of interest were identified as leaks using visual inspection. In the first case, the leakage is an improperly sealed cable penetration caused by a shutter cable. By using blower door testing and a smoke stick, it was verified that this penetration was an air leak. In the case of Figure 9, the presence of mold at the top corner of the window seal was a clear indication of a leak.
3.2. Evaluation of the Acoustic Signals of the Measured Rooms and Buildings
Table 2, Table 3 and Table 4 provide an overview of the evaluations for the building envelopes of the test site, representing all measured rooms/façades of buildings D, E, and A. The color codes represent the highest color code assigned in each third-octave band and correspond to the AAS (see Table 1), which are cumulatively represented in the MFAS. In the second column, labeled “Note”, we indicate the compass direction of the façade (if the room has more than one façade) or any special features of the measurement, such as floor numbers or repetitions.
This overview serves to demonstrate whether the applied acoustic method succeeded in detecting any distinctions among the various buildings. This is evident both visually in the distribution of the color codes from Table 2, Table 3 and Table 4, as well as in the frequency distribution shown in Table 5. As anticipated, Building D, identified as the most problematic by the building owner, demonstrates the highest values in the MFAS. A high score indicates robust acoustic evidence of leakage and, consequently, a lower rating for airtightness. Table 5 presents the frequency distribution of this numerical assessment of façades.
In the analysis of acoustic signals across 912 frequency bands, we identified a notable prevalence of signals indicative of a high probability of leakage, classified with an ASS of 3, in 322 cases. The primary contributors to this high score were signals detected around window frames. Furthermore, an ASS of 2 was assigned in 128 cases, while a score of 1 was observed 39 times, and a score of 0, indicating no detected leakage, was recorded in 432 instances. However, it is important to underscore that the 322 cases of ASS 3 do not correspond directly to 322 separate leaks. This discrepancy arises because multiple probable leaks may occur simultaneously within a single acoustic image. Conversely, a single leak might also occur across several frequency bands.
3.3. Examples of the Spectral Properties of Leakages
In this section, the spectral properties of the first three leakages shown in Section 3.1 are presented. We utilize the beamforming algorithm, as detailed previously in Section 2.5 and demonstrated in Figure 4, to extract the sound spectra at specific points.
In Figure 11, Figure 12 and Figure 13, the sound pressure level is plotted over a frequency spectrum ranging from 1 to 12.5 . The color of each plot matches the color of the annotations made on the related photographs, providing a visual correlation between the acoustic data and the physical locations of interest. Specifically, the frequency ranges highlighted in grey correspond to those used in the visual overlays presented in Figure 5, Figure 6 and Figure 7. For example, in Figure 12, which corresponds to Figure 6, “Potential leakage 1” (Pl1) represents the sound pressure level curve of the blue mark situated at the top right of the window front. Similarly, the spectrum of “Potential leakage 2” (Pl2) corresponds to the green mark in the image and the close-up shown in the right section of Figure 6.
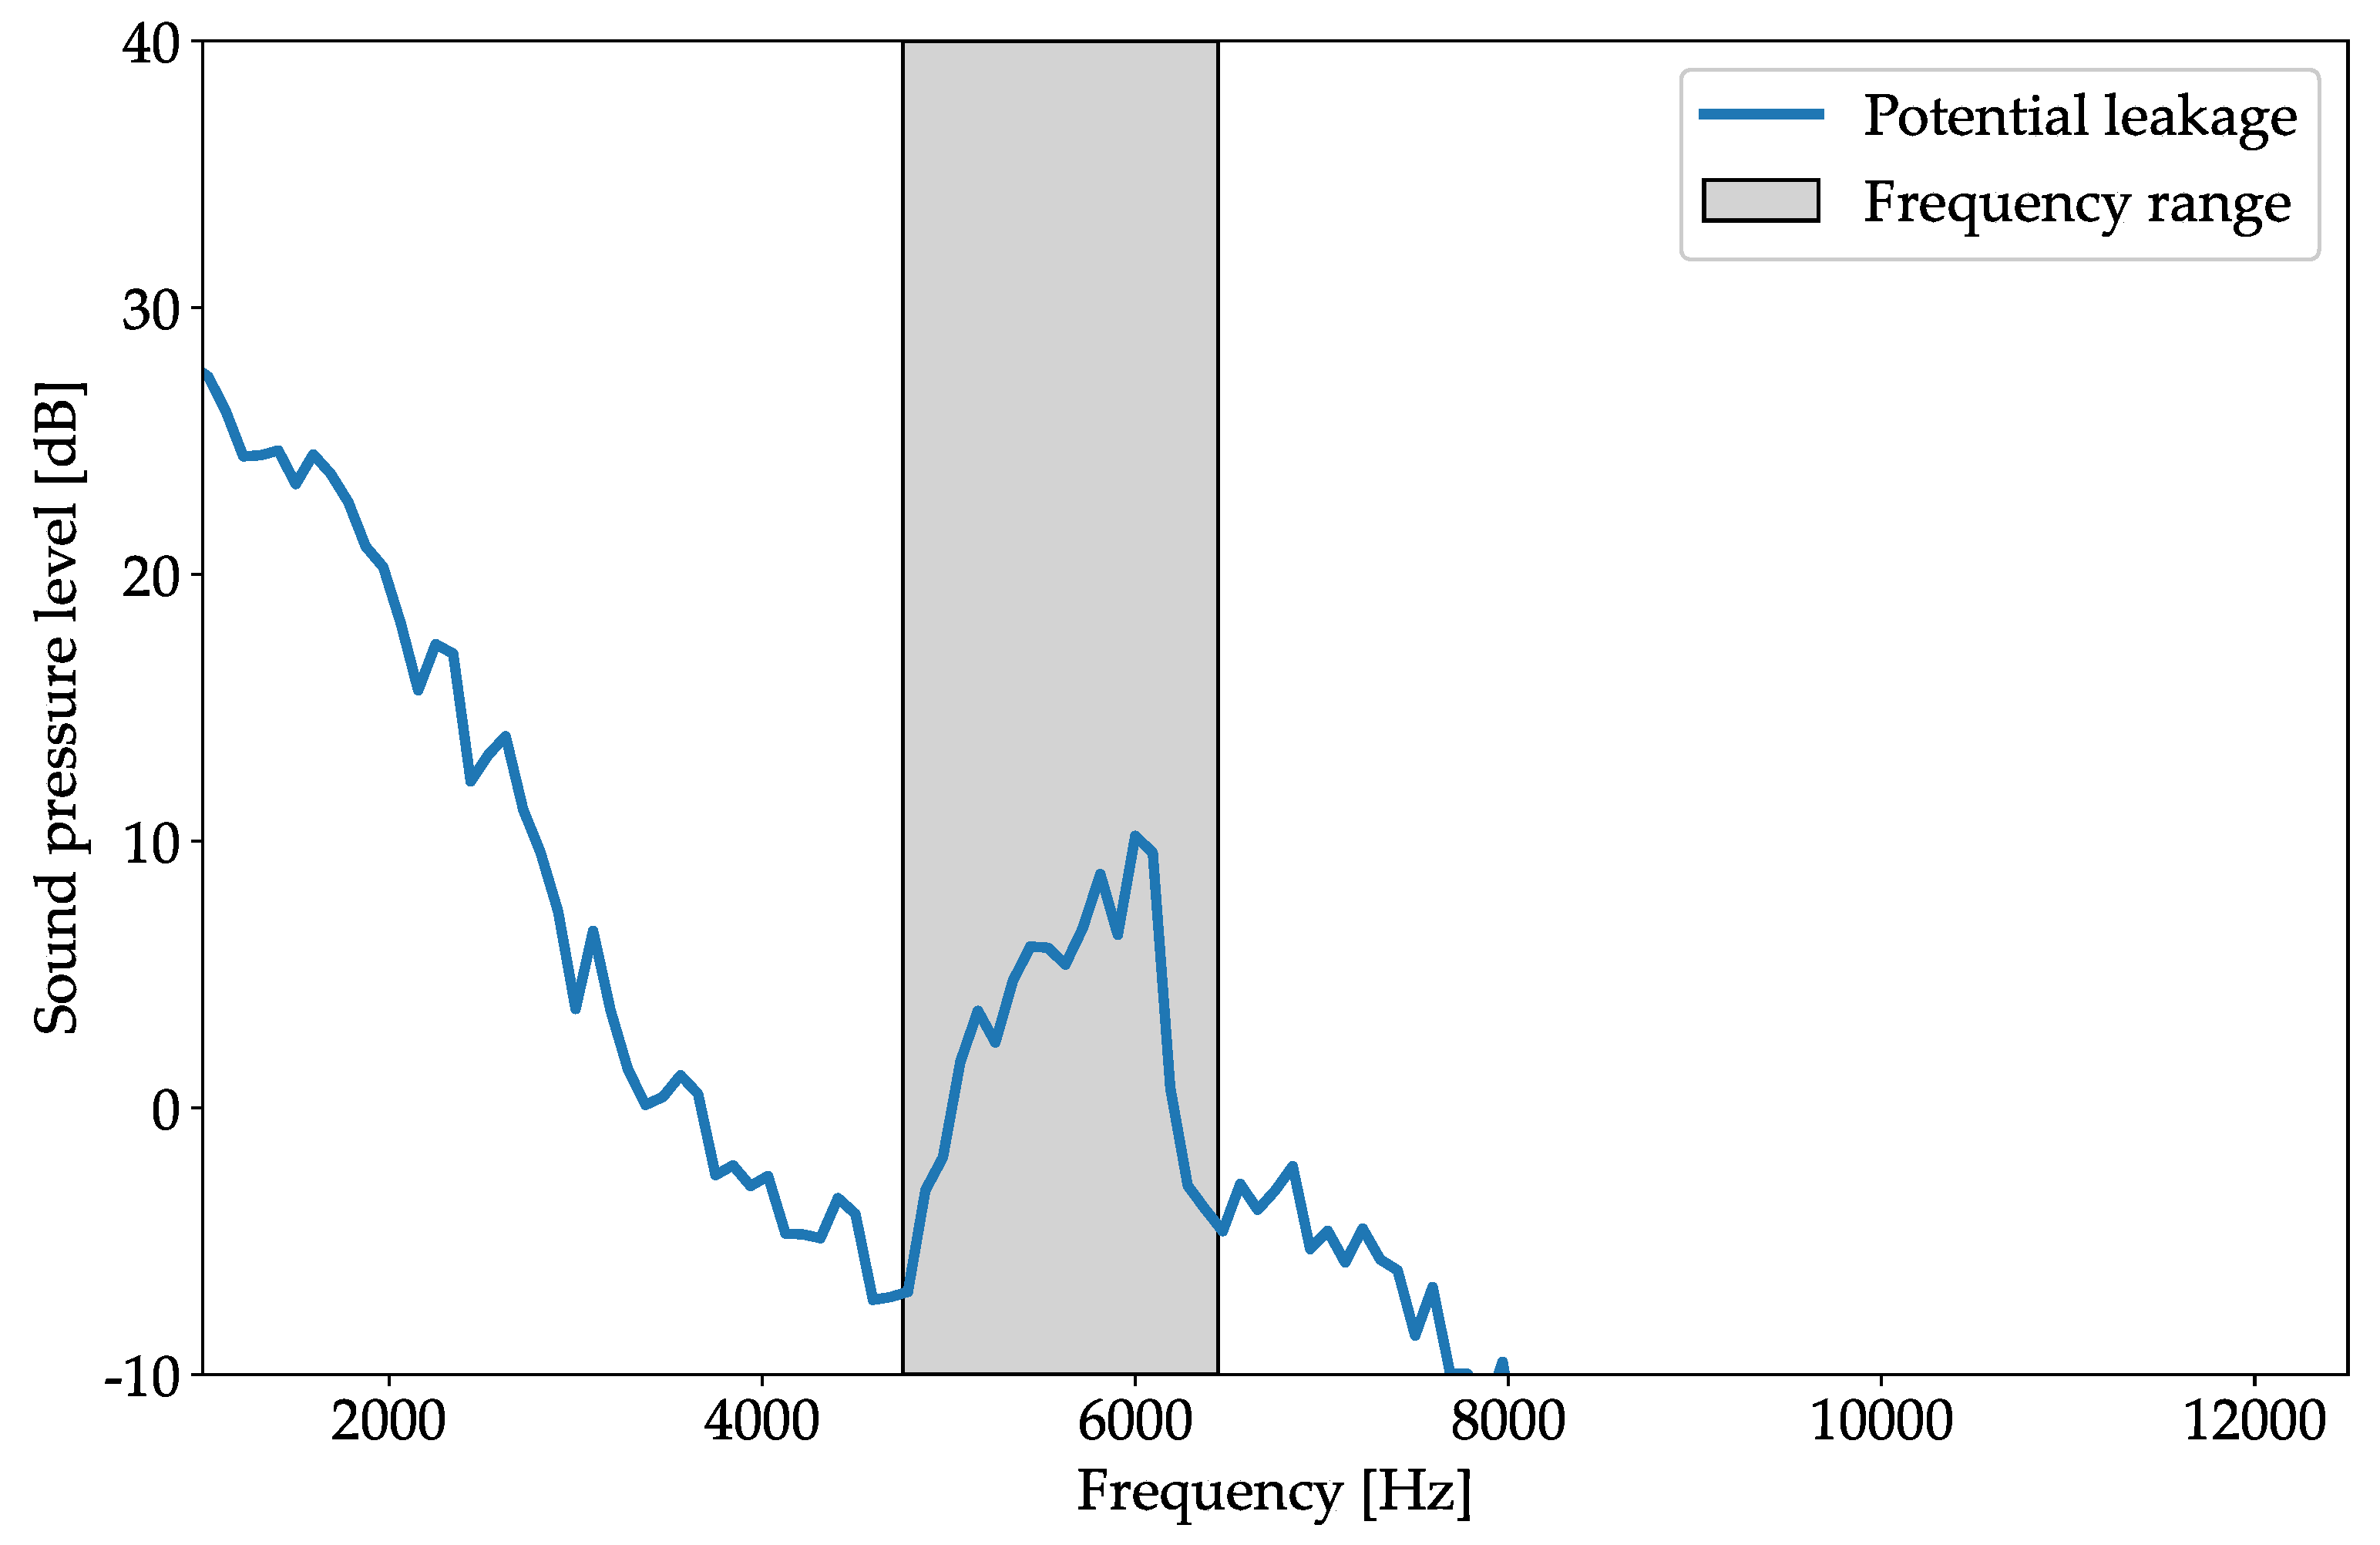
Figure 11 shows the sound pressure level curve at the specific location where a hole, roughly the size of a twig, can be found in the seal of a window panel. Notably, the curve shows a steep increase in the sound pressure level in the range from 4.2 to 6.0 , with a total increase of over 10 dB. Such an increase in sound pressure level enables the identification of the potential leak in the spectrum. This detection is confined to the specified frequency range; beyond these parameters, the area in question does not demonstrate any notable deviations from the overall acoustic landscape.
Figure 12 shows two curves of the sound pressure level. The grey highlighted frequency range is based on the curve of Pl1, meaning the boundaries of the frequency range only approximately encompass the peak limits of Pl2. These two potential leaks can be traced back to different origins. While Pl1 results from a failure in the actual window seal, Pl2 is caused by the protruding paneling of the window front. A comparative analysis of the curves within the selected frequency range shows divergent behaviors. Pl1 shows the presence of three sharp maxima and Pl2 of only one broad maximum, which may offer valuable clues about the type or severity of the leakage. Though a comprehensive exploration has yet to be conducted, these variations in spectral patterns suggest the potential of using spectral shapes as indicators of different types of leakages.
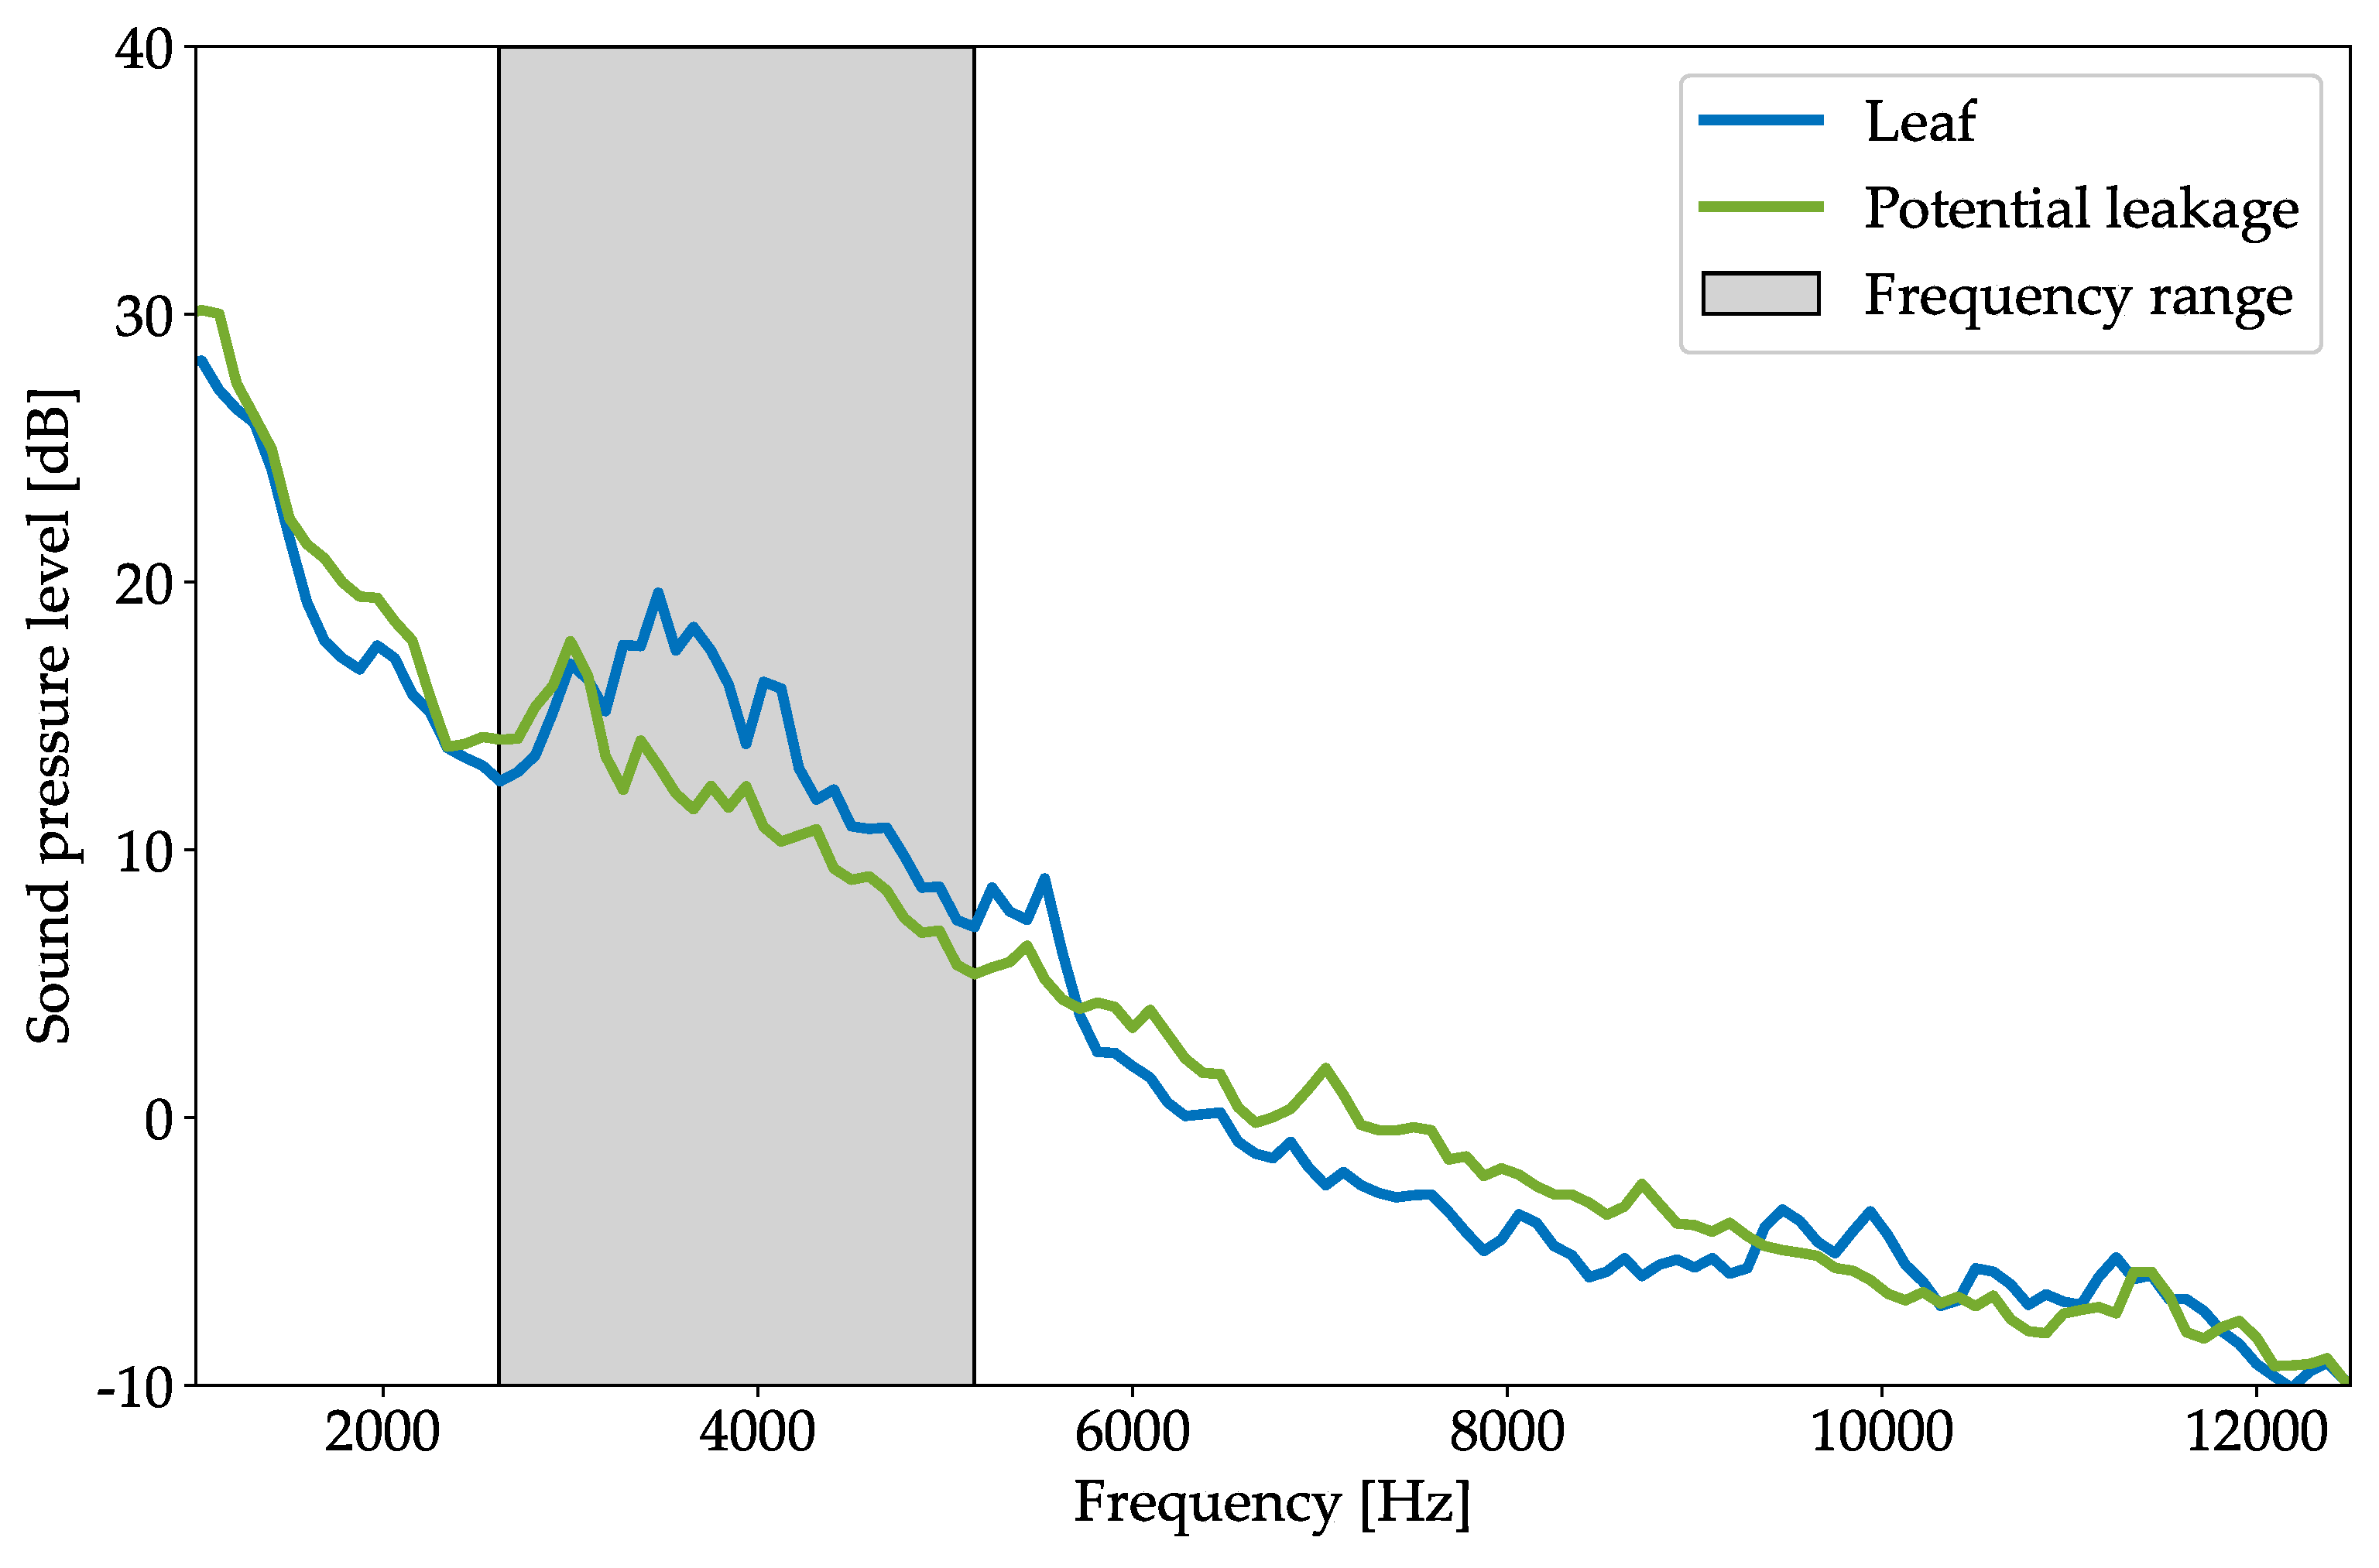
Figure 13 highlights the challenges associated with the acoustic method. In this example, two sound pressure level curves are shown. However, only one corresponds to a potential leak through a fractured window seal, whereas the other curve originates from the ambient noise of leaves rustling in the wind. This disturbing noise reveals two major problems: first, ambient noise in a recorded image can obscure the acoustic signature of potential leaks, complicating their detection. Second, a peak in the blue curve can be observed at roughly , which is similar to those associated with actual leakages. Although the peak’s prominence is reduced compared to previous findings, it should be noted that such acoustic behavior may not be solely a characteristic of leak-induced signals. Consequently, further investigation is essential to refine the acoustic method’s accuracy and reliability, particularly in environments with significant background noise.
4. Conclusions
To our knowledge, this measurement campaign is the most extensive field study of the acoustic detection of air leakage in building envelopes. The method was successfully demonstrated on the façades of multi-story buildings of different ages and heterogeneous envelope structures, confirming the basic functionality of the method for large buildings and proving the significant potential of this methodology.
Furthermore, this field study provides valuable insights into the practicality, speed, and clarity of acoustic signal interpretation alongside the wider applicability of the method. A considerable number of potential leaks were localized and visualized over large areas, many of which were confirmed as plausible by visual inspection. Specifically, in selected rooms where smoking sticks were deployed, some of the identified leaks were verified. The results indicate that a significant number of potential leaks can be detected, confirming the basic functionality of the method for large buildings. By using this method, it was also possible to distinguish between the airtightness characteristics of the different buildings. In addition, an examination of the spectra at leakage points suggests that spectral information can be used to infer leakage characteristics such as type or severity. For the first time, this work demonstrates the potential of the acoustic beamforming method to detect unknown leaks on large façades without the use of the fan pressurization method.
Further research is needed to improve the reliability of leak detection, especially in distinguishing leaks from non-leak noises such as reflections and vibrations. In addition, our aim is a more detailed analysis of leak size and nature of the leaks found, thus enabling the comprehensive (and possibly an automatable leakage) assessment and quantifiability of detected leaks. For this reason, the ongoing joint research project Q-Leak (see funding section below) involves the development of a dedicated test facility for analyzing leaks under controlled laboratory conditions, intending to systematically examine how the acoustic signatures of different leaks vary with their type and size. Key areas of interest include (a) the impact of measurement configurations (such as the viewing angle and air exchange rate), (b) the role of operating across different spectral ranges (audible to ultrasonic, narrowband, or broadband), and the exploration of diverse loudspeaker signals (including noise, frequency sweeps, and music), and (c) the possible correlations of the acoustic signature (spectrum and sound directionality) of leakages with different leakage paths, materials, and sizes. In addition to the greater automation and simpler visualization of leaks, improvements to the measurement technology are also planned in the project. This includes the development of a suitable ultrasonic transmitter to extend the applicable frequency range, as well as an investigation of a combination of infrared thermography with the existing acoustic method to improve the reliability of leak detection.
With further development, the acoustic beamforming method promises to be used effectively and in a time-saving manner in several areas of the construction industry. This technology holds significant potential for a wide array of stakeholders focused on the energy optimization and renovation of buildings, including the housing industry, building owners, service providers, energy consultants, and manufacturers of airtightness measurement equipment. One of the key advantages of acoustic methods over traditional blower door tests is their independence from closed volumes, enabling their application in both new construction and the refurbishment of existing buildings. For new buildings, this method could serve as a tool for ensuring the airtightness of prefabricated cladding elements and conducting quality testing prior to building acceptance. Furthermore, the technology offers the ability to assess the need for the refurbishment of existing buildings, allowing for the prioritization of leaks according to their potential energy impact and facilitating cost-effective upgrades. The acoustic method has the potential to reduce lengthy pressurized leak detection to a series of much less invasive short-term measurements. This is particularly advantageous for renovations in occupied buildings. Moreover, in the case of serial refurbishment, there is also the advantage that the airtightness of façcade elements can be checked prior to final installation, thereby saving time and costs while minimizing inconvenience to residents.
5. Patents
The patents DE 10 2022 116 711 and DE 10 2023 100 701, registered by the German Aerospace Center (DLR), are closely related to these results.
Author Contributions
Conceptualization, B.S., M.D. and B.K.; methodology, B.S., M.D. and B.K.; software, M.D. and B.K.; formal analysis, B.S., M.D. and B.K.; investigation, B.S. and B.K.; data curation, B.S. and M.D.; writing—original draft preparation, B.S., M.D. and B.K.; visualization, B.S. and M.D.; project administration, B.S. and B.K.; funding acquisition, B.S. and B.K. All authors have read and agreed to the published version of the manuscript.
Funding
This work is mainly part of the research project “Pilotanwendung von Gebäudetomograph-Messmethoden an einem Institut der Innovationsallianz Baden-Württemberg (Gtom-innBW)”, which was funded by the Ministry of Economic Affairs, Labour and Tourism Baden-Württemberg under the grant number WM3-4332-157/64. The analysis of the spectra is part of the ongoing joint research project “Development of a combined method of acoustics and infrared thermography for quantitative evaluation of the airtightness of building envelopes and locating leaks (Q-Leak)”, conducted by the German Aerospace Center (DLR) with its project partners Gesellschaft zur Förderung angewandter Informatik e.V. (GFaI), SONOTEC GmbH, Ecoworks GmbH, Bower Door GmbH, alstria office REIT-AG. This project is funded by the German Federal Ministry for Economic Affairs and Climate Action (BMWK) under the grant number 03EN1079A.
Data Availability Statement
The raw data supporting the conclusions of this article will be made available by the authors upon request.
Acknowledgments
The authors thank the “Hahn-Schickard-Gesellschaft für angewandte Forschung e.V.” in Villingen-Schwenningen, Germany, for providing their office buildings as test cases. Additionally, the authors thank Dirk Döbler, Andy Meyer, and Alexander Jahnke from “GFaI—Gesellschaft zur Förderung angewandter Informatik e.V.” as well as Stefanie Rolfsmeier from Blower Door GmbH for fruitful discussions regarding these measurement results.
Conflicts of Interest
The authors declare no conflict of interest. The funders had no role in the design of the study; in the collection, analyses, or interpretation of data; in the writing of the manuscript; or in the decision to publish the results.
Abbreviations
The following abbreviations are used in this manuscript:
| AAS | Acoustic assessment score |
| MFAS | Multi-frequency assessment score |
| Pl | Potential leakage |
| UAV | Unmanned aerial vehicle |
References
- Hurel, N.; Leprince, V. VIP 46: Building Airtightness Impact on Energy Performance (EP) Calculations; AIVC Ventilation Information Papers. 2023. Available online: https://www.aivc.org/sites/default/files/VIP_46.pdf (accessed on 14 April 2024).
- Poza-Casado, I.; Meiss, A.; Padilla-Marcos, M.A.; Feijó-Muñoz, J. Airtightness and energy impact of air infiltration in residential buildings in Spain. Int. J. Vent. 2021, 20, 258–264. [Google Scholar] [CrossRef]
- Jokisalo, J.; Kurnitski, J.; Korpi, M.; Kalamees, T.; Vinha, J. Building leakage, infiltration, and energy performance analyses for Finnish detached houses. Build. Environ. 2009, 44, 377–387. [Google Scholar] [CrossRef]
- Kalamees, T. Air tightness and air leakages of new lightweight single-family detached houses in Estonia. Build. Environ. 2007, 42, 2369–2377. [Google Scholar] [CrossRef]
- Jones, B.; Das, P.; Chalabi, Z.; Davies, M.; Hamilton, I.; Lowe, R.; Mavrogianni, A.; Robinson, D.; Taylor, J. Assessing uncertainty in housing stock infiltration rates and & associated heat loss: English and UK case studies. Build. Environ. 2015, 92, 644–656. [Google Scholar] [CrossRef]
- ISO 9972:2015; Thermal Performance of Buildings—Determination of Air Permeability of Buildings—Fan Pressurization Method. International Organization for Standardization: Geneva, Switzerland, 2015.
- ASTM E1186-22; Standard Practices for Air Leakage Site Detection in Building Envelopes and Air Barrier Systems. American Society for Testing and Materials: West Conshohocken, PA, USA, 2022. [CrossRef]
- Barreira, E.; Almeida, R.M.; Moreira, M. An infrared thermography passive approach to assess the effect of leakage points in buildings. Energy Build. 2017, 140, 224–235. [Google Scholar] [CrossRef]
- Lerma, C.; Barreira, E.; Almeida, R.M. A discussion concerning active infrared thermography in the evaluation of Buildings Air Infiltration. Energy Build. 2018, 168, 56–66. [Google Scholar] [CrossRef]
- Mahmoodzadeh, M.; Gretka, V.; Wong, S.; Froese, T.; Mukhopadhyaya, P. Evaluating Patterns of Building Envelope Air Leakage with Infrared Thermography. Energies 2020, 13, 3545. [Google Scholar] [CrossRef]
- Kölsch, B.; Pernpeintner, J.; Schiricke, B.; Lüpfert, E. Air leakage detection in building façades by combining lock-in thermography with blower excitation. Int. J. Vent. 2023, 22, 357–365. [Google Scholar] [CrossRef]
- Ghazi, C.; Marshall, J. A CO2 Tracer-gas method for local air leakage detection and characterization. Flow Meas. Instrum. 2014, 38, 72–81. [Google Scholar] [CrossRef]
- Cardoso, V.E.M.; Pereira, P.F.; Ramos, N.M.M.; Almeida, R.M.S.F. The Impacts of Air Leakage Paths and Airtightness Levels on Air Change Rates. Buildings 2020, 10, 55. [Google Scholar] [CrossRef]
- Zheng, X.; Cooper, E.; Gillott, M.; Wood, C. A practical review of alternatives to the steady pressurisation method for determining building airtightness. Renew. Sustain. Energy Rev. 2020, 132, 110049. [Google Scholar] [CrossRef] [PubMed]
- Keast, D.N.; Pei, H.S. The use of sound to locate infiltration openings in buildings. In Proceedings of the ASHRAE-DOE Conference on the Thermal Performance of the Exterior Envelope of Buildings, Kissimmee, FL, USA, 3–5 December 1979. [Google Scholar]
- Sonoda, T.; Peterson, F. A sonic method for building air-leakage measurements. Appl. Energy 1986, 22, 205–224. [Google Scholar] [CrossRef]
- Iordache, V.; Catalina, T. Acoustic approach for building air permeability estimation. Build. Environ. 2012, 57, 18–27. [Google Scholar] [CrossRef]
- Catalina, T.; Iordache, V.; Iordache, F. Correlation between air and sound propagation to determine air permeability of buildings for single/double wood pane windows. Energy Build. 2020, 224, 110253. [Google Scholar] [CrossRef]
- Hassan, O.A. An alternative method for evaluating the air tightness of building components. Build. Environ. 2013, 67, 82–86. [Google Scholar] [CrossRef]
- Berardi, U.; Pouyan, S. Exploring acoustical approaches for pre-screening the airtightness of building enclosures. Proc. Meet. Acoust. 2018, 35, 040005. [Google Scholar] [CrossRef]
- Graham, R.W. Infrasonic Impedance Measurement of Buildings for Air Leakage Determination. Master’s Thesis, Syracuse University, Syracuse, NY, USA, 1977. [Google Scholar]
- Card, W.H.; Sallmann, A.; Graham, R.W.; Drucker, E.E. Infrasonic measurement of building air leakage: A progress report. In Building Air Change Rate and Infiltration Measurements; ASTM International: West Conshohocken, PA, USA, 1980; pp. 73–88. [Google Scholar] [CrossRef]
- Kölsch, B.; Walker, I.S.; Schiricke, B.; Delp, W.W.; Hoffschmidt, B. Quantification of air leakage paths: A comparison of airflow and acoustic measurements. Int. J. Vent. 2021, 22, 101–121. [Google Scholar] [CrossRef]
- Kölsch, B.; Tiddens, A.; Estevam Schmiedt, J.; Schiricke, B.; Hoffschmidt, B. Detection of air leakage in building envelopes using ultrasound technology. In Proceedings of the Whole Building Air Leakage: Testing and Bulding Performance Impacts, San Diego, CA, USA, 8–9 April 2018; ASTM Committee: Philadelphia, PA, USA, 2019; pp. 160–183. [Google Scholar] [CrossRef]
- Chiariotti, P.; Martarelli, M.; Castellini, P. Acoustic beamforming for noise source localization—Reviews, methodology and applications. Mech. Syst. Signal Process. 2019, 120, 422–448. [Google Scholar] [CrossRef]
- Raman, G.; Chelliah, K.; Prakash, M.; Muehleisen, R.T. Detection and quantification of building air infiltration using remote acoustic methods. In Proceedings of the INTER-NOISE and NOISE-CON Congress and Conference, Melbourne, Australia, 16–19 November 2014. [Google Scholar]
- Kölsch, B.; Schiricke, B.; Lüpfert, E.; Hoffschmidt, B. Detection of Air Leakage in Building Envelopes using Microphone Arrays. In Proceedings of the 41st AIVC/ASHRAE Conference, Air Infiltration and Ventilation Centre (AIVC), Athens, Greece, 13–15 September 2021. [Google Scholar]
- Holstein, P.; Bader, N.; Moeck, S.; Münch, H.J.; Döbler, D.; Jahnke, A. Akustische Verfahren zur Ermittlung der Luftdichtheit von Bestandsgebäuden. In Denkmal und Energie 2020; Springer: Wiesbaden, Germay, 2019; pp. 111–123. [Google Scholar] [CrossRef]
- Schiricke, B.; Kölsch, B. Acoustic method for measurement of airtightness—Field testing on three different existing office buildings in Germany. In Proceedings of the 43rd AIVC conference. Air Infiltration and Ventilation Centre (AIVC), Copenhagen, Denmark, 4–5 October 2023; pp. 53–62. [Google Scholar]
- Groesdonk, P.; Kölsch, B.; Schiricke, B.; Estevam Schmiedt, J.; Patel, N.; Hoffschmidt, B. Innovative contact-less measurement technologies for building energy performance assessment: A pilot study. J. Build. Perform. Simul. 2024. [Google Scholar]
- Döbler, D.; Heilmann, G.; Schröder, R. Investigation of the depth of field in acoustic maps and its relation between focal distance and array design. In Proceedings of the 37th International Congress and Exposition on Noise Control Engineering. Institute of Acoustics—Chinese Academy of Sciences, Shanghai, China, 26–29 October 2008. [Google Scholar]
- gfai tech GmbH. Software: NoiseImage, Version 4.13.4.17964; GmbH: Berlin, Germany,, 2021.
- Jaeckel, O. Strengths and weaknesses of calculating beamforming in the time domain. In Proceedings of the 8th Berlin Beamforming Conference, GFaI e.V., Berlin, Germany, 22–23 November 2006. [Google Scholar]
- Teutsch, H. Modal Array Signal Processing: Principles and Applications of Acoustic Wavefield Decomposition; Springer: Berlin/Heidelberg, Germany, 2007. [Google Scholar]
- Prignon, M.; Van Moeseke, G. Factors influencing airtightness and airtightness predictive models: A literature review. Energy Build. 2017, 146, 87–97. [Google Scholar] [CrossRef]
- Mélois, A.; Moujalled, B.; Guyot, G.; Leprince, V. Improving building envelope knowledge from analysis of 219,000 certified on-site air leakage measurements in France. Build. Environ. 2019, 159, 106145. [Google Scholar] [CrossRef]
Figure 1.
The building complex with labels and the approximate year of the most recent modification (photo: adapted with permission from Hahn-Schickard).
Figure 1.
The building complex with labels and the approximate year of the most recent modification (photo: adapted with permission from Hahn-Schickard).

Figure 2.
Illustration of the measurement setup. (left): Loudspeaker on the inside; (center): Microphone array on the outside; (right): The resulting image of a potential leakage detected.
Figure 2.
Illustration of the measurement setup. (left): Loudspeaker on the inside; (center): Microphone array on the outside; (right): The resulting image of a potential leakage detected.

Figure 3.
Representation of the evaluation of sound peaks using the example of Room 206 (east side) in Building D. The colors of circles align with the color code presented in Table 1.
Figure 3.
Representation of the evaluation of sound peaks using the example of Room 206 (east side) in Building D. The colors of circles align with the color code presented in Table 1.

Figure 4.
Schematic representation of the iteration process for the determination of the spectral properties of a point of interest.
Figure 4.
Schematic representation of the iteration process for the determination of the spectral properties of a point of interest.

Figure 5.
Room A-101. Photograph superimposed with the sound pressure level within the frequency range of 4.9 to 6.4 (left). Twig-sized hole in the window panel seal (right).
Figure 5.
Room A-101. Photograph superimposed with the sound pressure level within the frequency range of 4.9 to 6.4 (left). Twig-sized hole in the window panel seal (right).

Figure 6.
Room D-107. Photograph superimposed with the sound pressure level within the frequency range of 4.2 to 8.2 (left). Potential leakage due to protruding paneling and window seal (right).
Figure 6.
Room D-107. Photograph superimposed with the sound pressure level within the frequency range of 4.2 to 8.2 (left). Potential leakage due to protruding paneling and window seal (right).

Figure 7.
Room D-203. Photograph superimposed with the sound pressure level within the frequency range of 2.6 to 5.2 (left). Fractured seal in the corner of the window (right).
Figure 7.
Room D-203. Photograph superimposed with the sound pressure level within the frequency range of 2.6 to 5.2 (left). Fractured seal in the corner of the window (right).

Figure 8.
Room D-106. Photograph superimposed with the sound pressure level within the frequency range of 6.6 to 8.2 (left). On the right: Leaky cable entry (leak confirmed with smoke sticks and blower door) (right).
Figure 8.
Room D-106. Photograph superimposed with the sound pressure level within the frequency range of 6.6 to 8.2 (left). On the right: Leaky cable entry (leak confirmed with smoke sticks and blower door) (right).

Figure 9.
Room D-208. Photograph superimposed with the sound pressure level within the frequency range of 6.4 to 9.5 (left). Mold growth on window seal (right).
Figure 9.
Room D-208. Photograph superimposed with the sound pressure level within the frequency range of 6.4 to 9.5 (left). Mold growth on window seal (right).

Figure 10.
Room D-112. Photograph superimposed with the sound pressure level within the frequency range of 5.6 to 7.1 .
Figure 10.
Room D-112. Photograph superimposed with the sound pressure level within the frequency range of 5.6 to 7.1 .

Figure 11.
Spectral characteristics of a twig-sized hole in a window panel seal (see Figure 5). The marked peak is in the frequency range between and .
Figure 11.
Spectral characteristics of a twig-sized hole in a window panel seal (see Figure 5). The marked peak is in the frequency range between and .

Figure 12.
Spectral characteristics of two different leakages within a window front (see Figure 6). The marked peaks are in the frequency range between and .
Figure 12.
Spectral characteristics of two different leakages within a window front (see Figure 6). The marked peaks are in the frequency range between and .

Figure 13.
Spectral characteristics of a leaf rustling in the wind and a fractured window seal (see Figure 7). The marked peaks are in the frequency range between and .
Figure 13.
Spectral characteristics of a leaf rustling in the wind and a fractured window seal (see Figure 7). The marked peaks are in the frequency range between and .


Table 1.
Description of the color code for the evaluation of acoustic signals and their criteria.
| Colour Code | Acoustic Assessment Score (ASS) | Evaluation of Acoustic Signals | Description of Subjective Criteria |
|---|---|---|---|
 | 0 | Very unlikely leakage | The peak of a signal is at an implausible location (e.g., on a window pane, a façade panel, or outside the area under consideration) |
 | 1 | Unlikely leakage | Some indications that the signal is probably not caused by a leakage (e.g., the widespread shape of the sound source) or the peak of the signal is at a rather implausible location (e.g., close to a plausible location but just off the mark) |
 | 2 | Likely leakage | The peak of the signal is at a plausible location (e.g., the joints between different materials or a roof and wall) or even at a particularly plausible location but has a much weaker signal |
 | 3 | Very likely leakage | The peak of the signal is at a particularly plausible location (e.g., the seals of a door and window frames) |
Table 2.
Evaluation of acoustic signals in Building D; the example of Room 206 (east side) (compare Figure 3) is highlighted.
Table 2.
Evaluation of acoustic signals in Building D; the example of Room 206 (east side) (compare Figure 3) is highlighted.
| Room | Note | MFAS | Third-Octave Frequency Bands in kHz | |||||||||||||||
|---|---|---|---|---|---|---|---|---|---|---|---|---|---|---|---|---|---|---|
| D-112 | S | 12 | | | | | | | | | | | | | | | | |
| S (up) | 42 | | | | | | | | | | | | | | | | | |
| SSW | 15 | | | | | | | | | | | | | | | | | |
| SW (1) | 36 | | | | | | | | | | | | | | | | | |
| SW (2) | 39 | | | | | | | | | | | | | | | | | |
| NW | 28 | | | | | | | | | | | | | | | | | |
| D-112 | NW | 26 | | | | | | | | | | | | | | | | |
| Corridor | N (1) | 19 | | | | | | | | | | | | | | | | |
| N (2) | 27 | | | | | | | | | | | | | | | | | |
| D-109 | 24 | | | | | | | | | | | | | | | | | |
| D-108 | W | 31 | | | | | | | | | | | | | | | | |
| S | 35 | | | | | | | | | | | | | | | | | |
| D-107 | 36 | | | | | | | | | | | | | | | | | |
| D-106 | S | 36 | | | | | | | | | | | | | | | | |
| E | 36 | | | | | | | | | | | | | | | | | |
| D-103 | 19 | | | | | | | | | | | | | | | | | |
| D-211 | 29 | | | | | | | | | | | | | | | | | |
| D-210 | 18 | | | | | | | | | | | | | | | | | |
| D-209 | 33 | | | | | | | | | | | | | | | | | |
| D-208 | W | 29 | | | | | | | | | | | | | | | | |
| S | 37 | | | | | | | | | | | | | | | | | |
| D-207 | 33 | | | | | | | | | | | | | | | | | |
| D-206 | S | 33 | | | | | | | | | | | | | | | | |
| E | 38 | | | | | | | | | | | | | | | | | |
| D-205 | 29 | | | | | | | | | | | | | | | | | |
| D-204 | 19 | | | | | | | | | | | | | | | | | |
| D-203 | 29 | | | | | | | | | | | | | | | | | |
| D-202 | 37 | | | | | | | | | | | | | | | | | |
| D-201 | 23 | | | | | | | | | | | | | | | | | |
| Bridge | S | 19 | | | | | | | | | | | | | | | | |
| N (1) | 18 | | | | | | | | | | | | | | | | | |
| N (2) | 21 | | | | | | | | | | | | | | | | | |
Table 3.
Evaluation of acoustic signals in Building E.
| Room | Note | MFAS | Third-Octave Frequency Bands in kHz | |||||||||||||||
|---|---|---|---|---|---|---|---|---|---|---|---|---|---|---|---|---|---|---|
| Office 2 | 3rd floor | 14 | | | | | | | | | | | | | | | | |
| Office 1 | 2nd floor | 20 | | | | | | | | | | | | | | | | |
| Office | 2nd floor | 5 | | | | | | | | | | | | | | | | |
| Office | 1st floor | 8 | | | | | | | | | | | | | | | | |
| Meeting | 1st floor | 9 | | | | | | | | | | | | | | | | |
| Meeting 2 | 1st floor | 21 | | | | | | | | | | | | | | | | |
| Office 1 | 1st floor | 15 | | | | | | | | | | | | | | | | |
| Office | 1st floor | 24 | | | | | | | | | | | | | | | | |
| Meeting | 2nd floor | 10 | | | | | | | | | | | | | | | | |
| Office | 1st floor | 13 | | | | | | | | | | | | | | | | |
Table 4.
Evaluation of acoustic signals in Building A.
| Room | Note | MFAS | Third-Octave Frequency Bands in kHz | |||||||||||||||
|---|---|---|---|---|---|---|---|---|---|---|---|---|---|---|---|---|---|---|
| A-101 | SW (1) | 12 | | | | | | | | | | | | | | | | |
| SW (2) | 26 | | | | | | | | | | | | | | | | | |
| NW | 27 | | | | | | | | | | | | | | | | | |
| NW | 9 | | | | | | | | | | | | | | | | | |
| A-103 | 16 | | | | | | | | | | | | | | | | | |
| A-201/1 | (1) | 3 | | | | | | | | | | | | | | | | |
| (2) | 13 | | | | | | | | | | | | | | | | | |
| A-201/2 | 13 | | | | | | | | | | | | | | | | | |
| A-201/3 | 15 | | | | | | | | | | | | | | | | | |
| A-202 | NW | 16 | | | | | | | | | | | | | | | | |
| SW (1) | 16 | | | | | | | | | | | | | | | | | |
| SW (2) | 19 | | | | | | | | | | | | | | | | | |
| SW (3) | 12 | | | | | | | | | | | | | | | | | |
| SW (4) | 11 | | | | | | | | | | | | | | | | | |
| A-102 | 8 | | | | | | | | | | | | | | | | | |
Table 5.
Overall assessment of the acoustic leakage analyses for the three buildings.
| No. of Measurements per Building | |||
|---|---|---|---|
| MFAS | D (1998) | A (1990) | E (2019) |
| very low (0–9) | 0 | 3 | 3 |
| low (10–19) | 8 | 10 | 4 |
| mid (20–29) | 10 | 2 | 3 |
| high (30–39) | 13 | 0 | 0 |
| very high (40–48) | 1 | 0 | 0 |
Disclaimer/Publisher’s Note: The statements, opinions and data contained in all publications are solely those of the individual author(s) and contributor(s) and not of MDPI and/or the editor(s). MDPI and/or the editor(s) disclaim responsibility for any injury to people or property resulting from any ideas, methods, instructions or products referred to in the content. |
© 2024 by the authors. Licensee MDPI, Basel, Switzerland. This article is an open access article distributed under the terms and conditions of the Creative Commons Attribution (CC BY) license (https://creativecommons.org/licenses/by/4.0/).
Share and Cite
MDPI and ACS Style
Schiricke, B.; Diel, M.; Kölsch, B. Field Testing of an Acoustic Method for Locating Air Leakages in Building Envelopes. Buildings 2024, 14, 1159. https://doi.org/10.3390/buildings14041159
AMA Style
Schiricke B, Diel M, Kölsch B. Field Testing of an Acoustic Method for Locating Air Leakages in Building Envelopes. Buildings. 2024; 14(4):1159. https://doi.org/10.3390/buildings14041159
Chicago/Turabian StyleSchiricke, Björn, Markus Diel, and Benedikt Kölsch. 2024. "Field Testing of an Acoustic Method for Locating Air Leakages in Building Envelopes" Buildings 14, no. 4: 1159. https://doi.org/10.3390/buildings14041159
Note that from the first issue of 2016, this journal uses article numbers instead of page numbers. See further details here.