

Spatiotemporal Characterization of Dengue Incidence and Its Correlation to Climate Parameters in Indonesia
 , ,
, ,
Abstract
:Simple Summary
Abstract
1. Introduction
2. Methodology
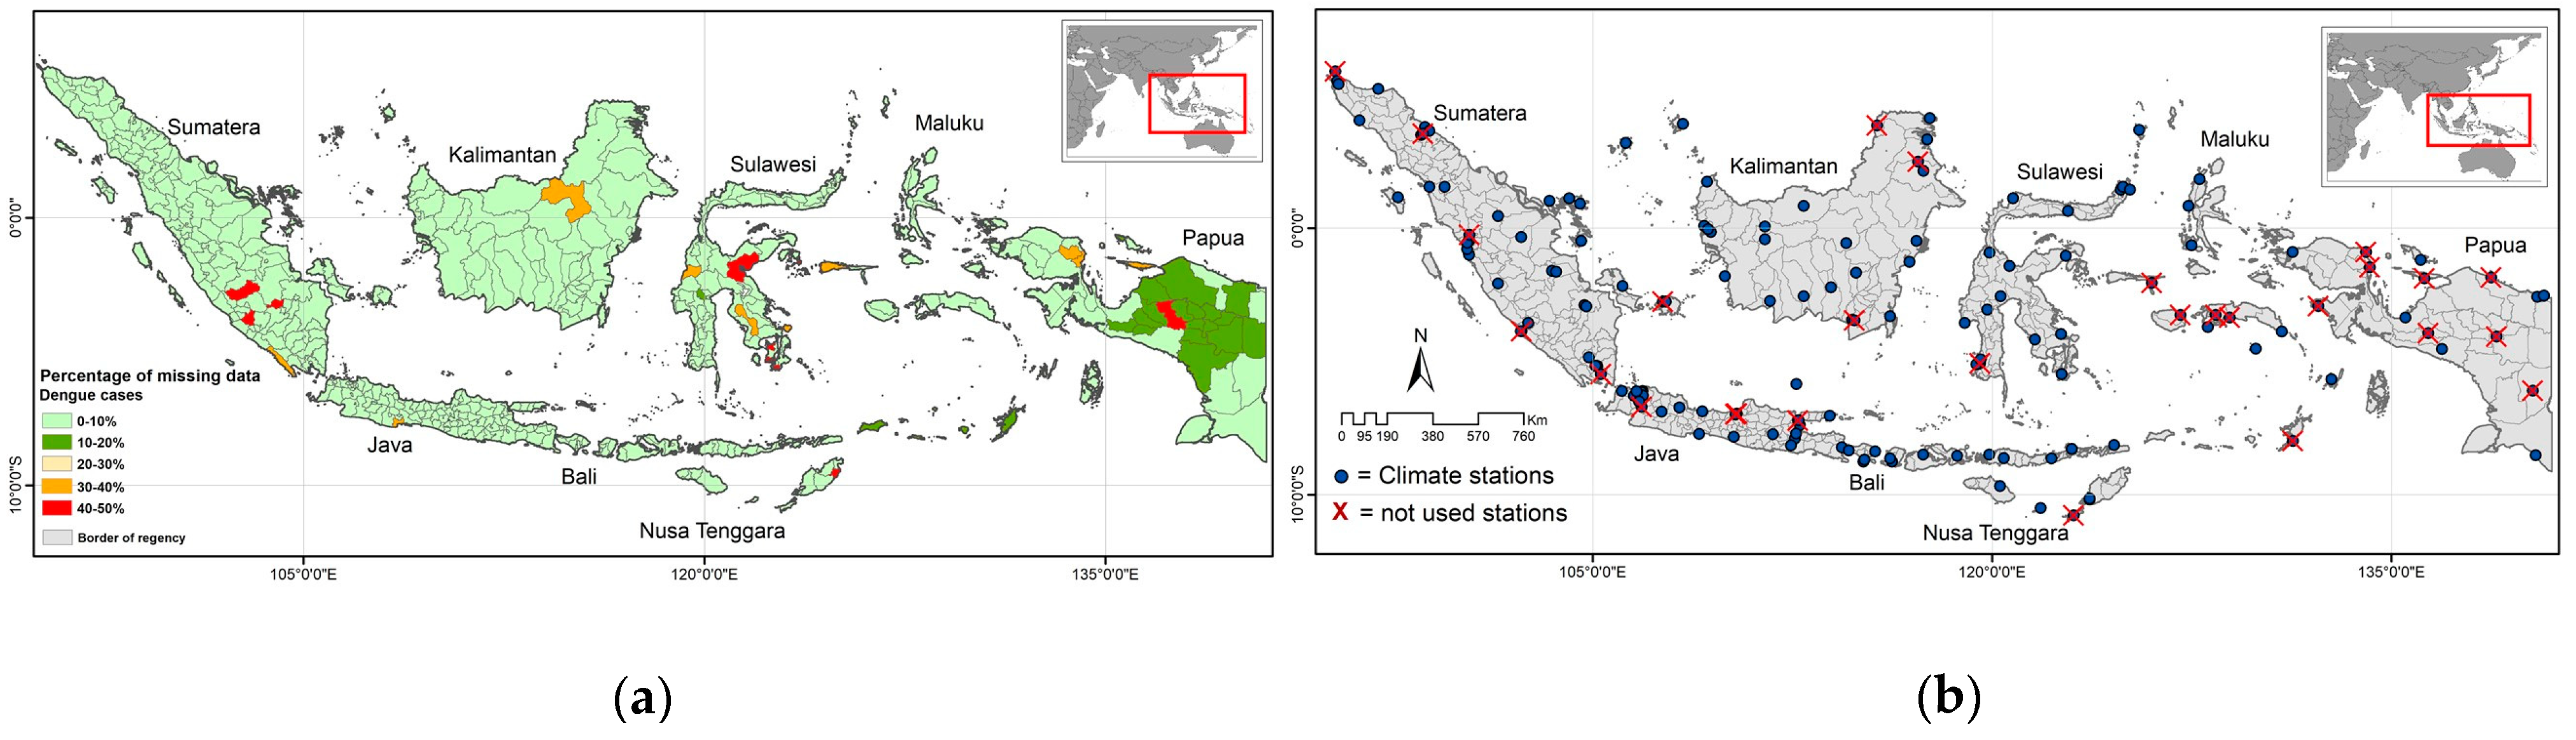
2.1. Study Area
2.2. Dengue Data
2.3. Climate Data
2.4. Substituting Missing Data
2.5. Cluster Analyses
2.6. Singular Value Decomposition (SVD)
3. Results
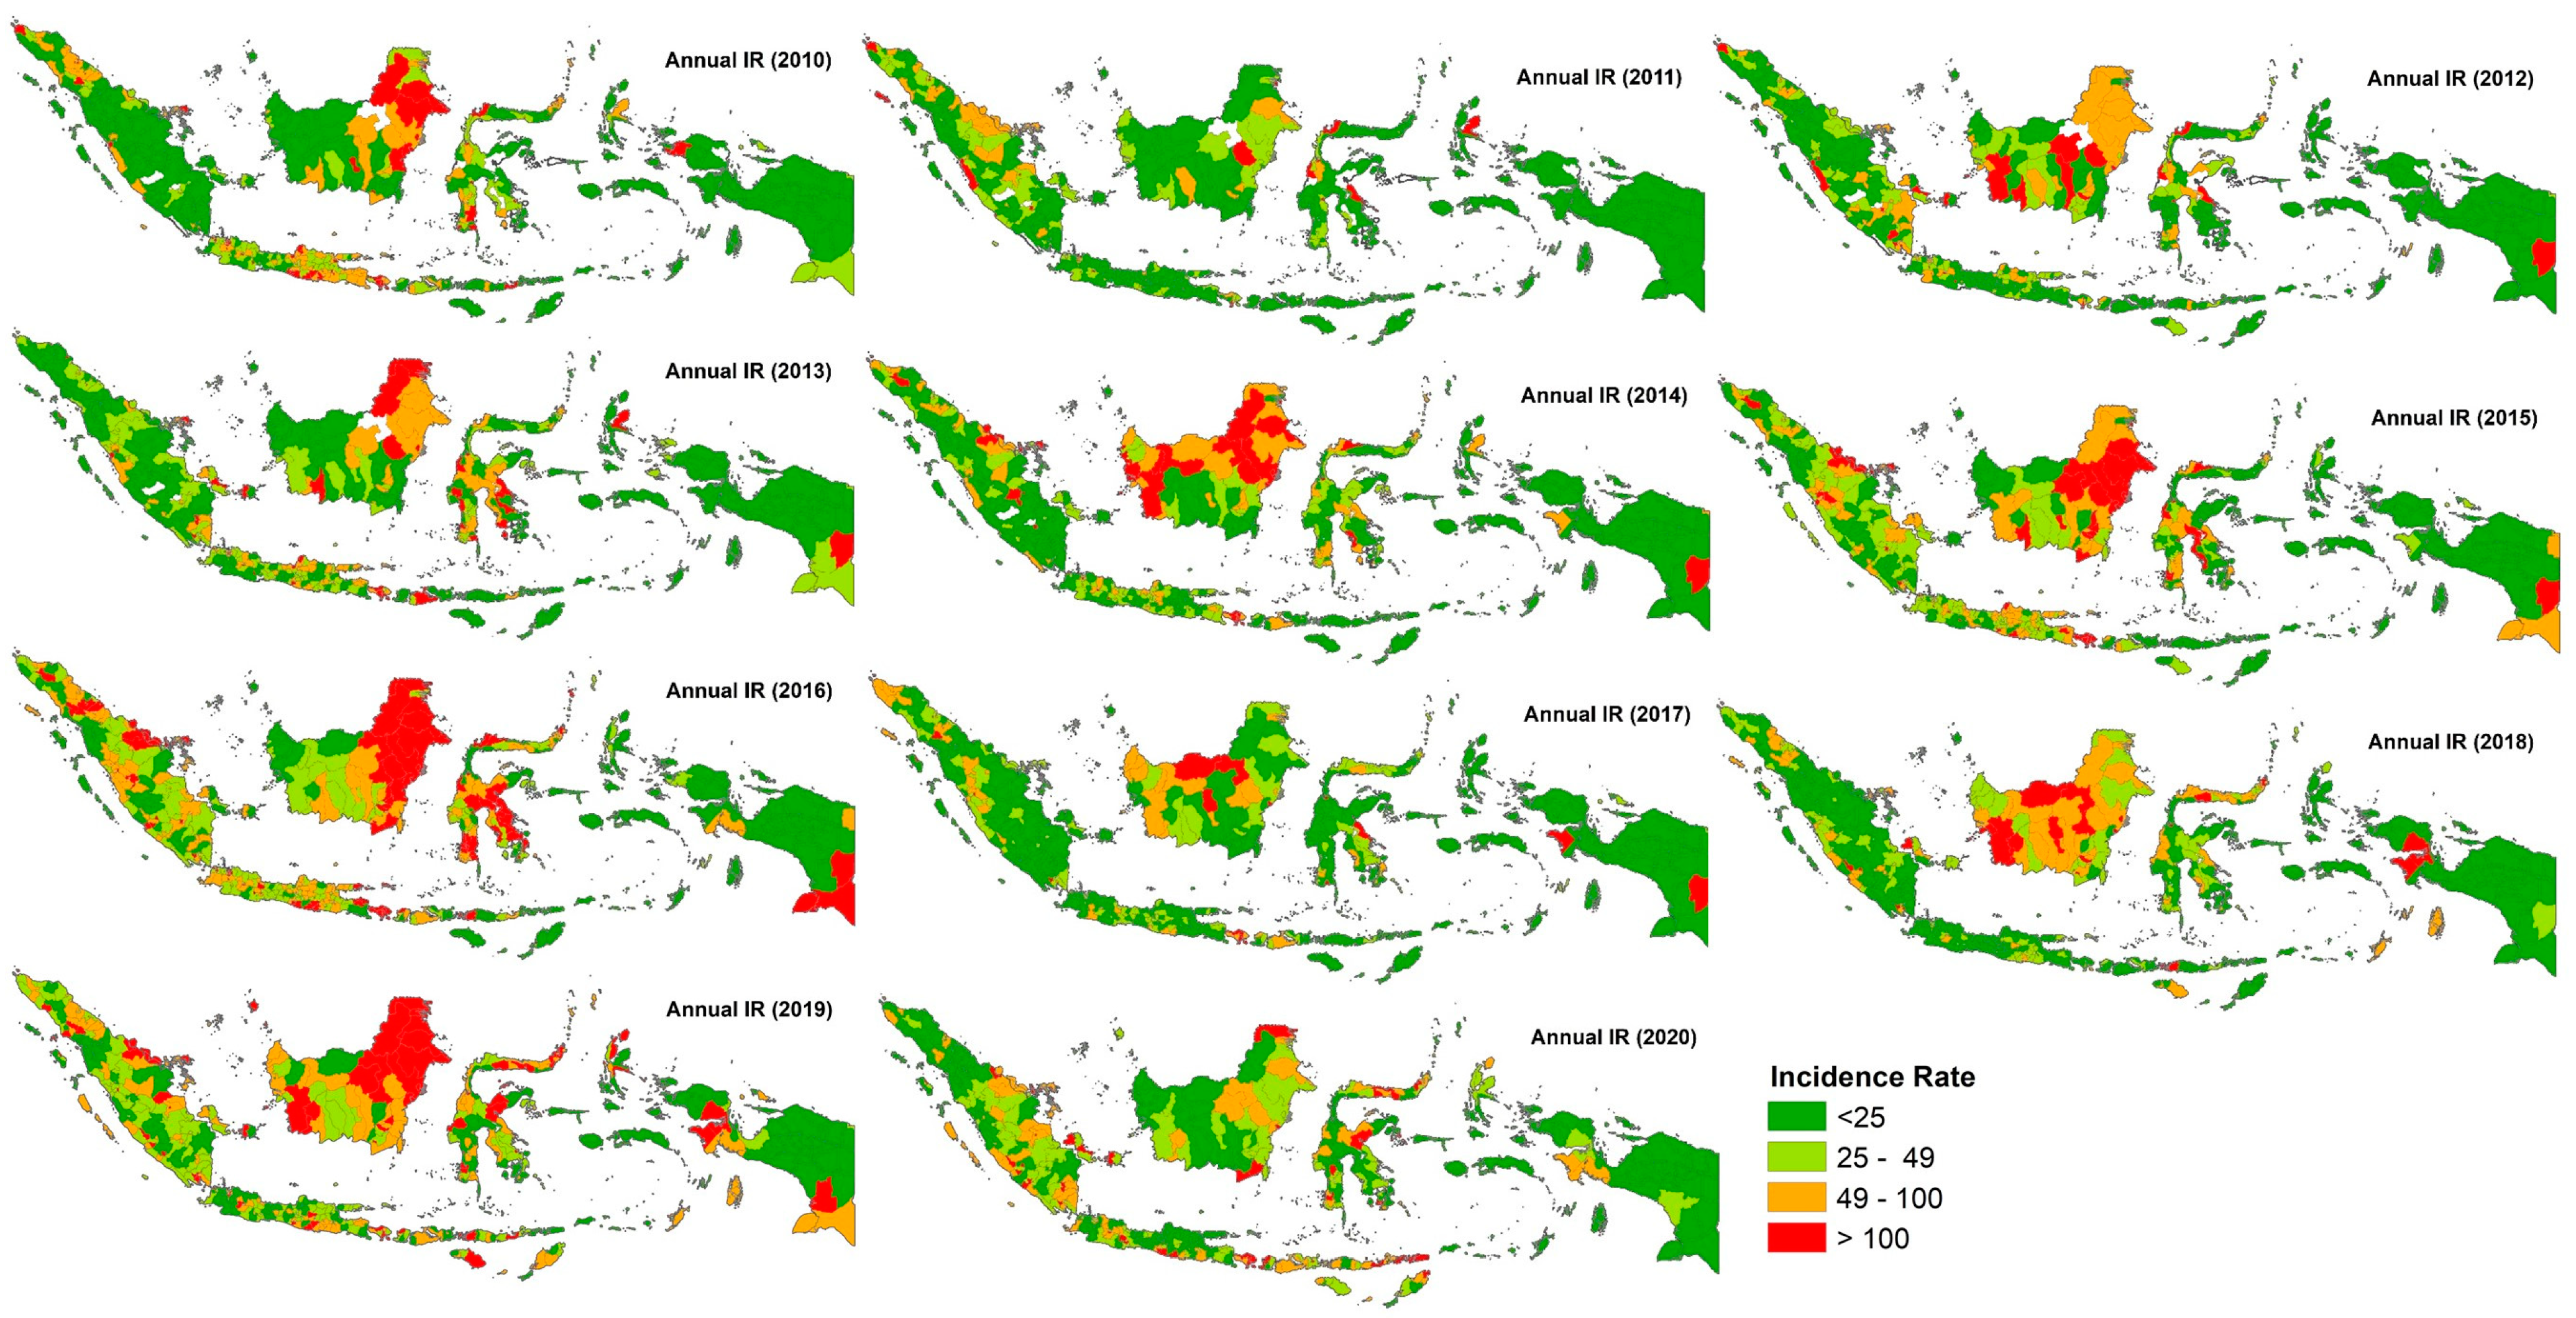
3.1. Epidemiology of Dengue Cases
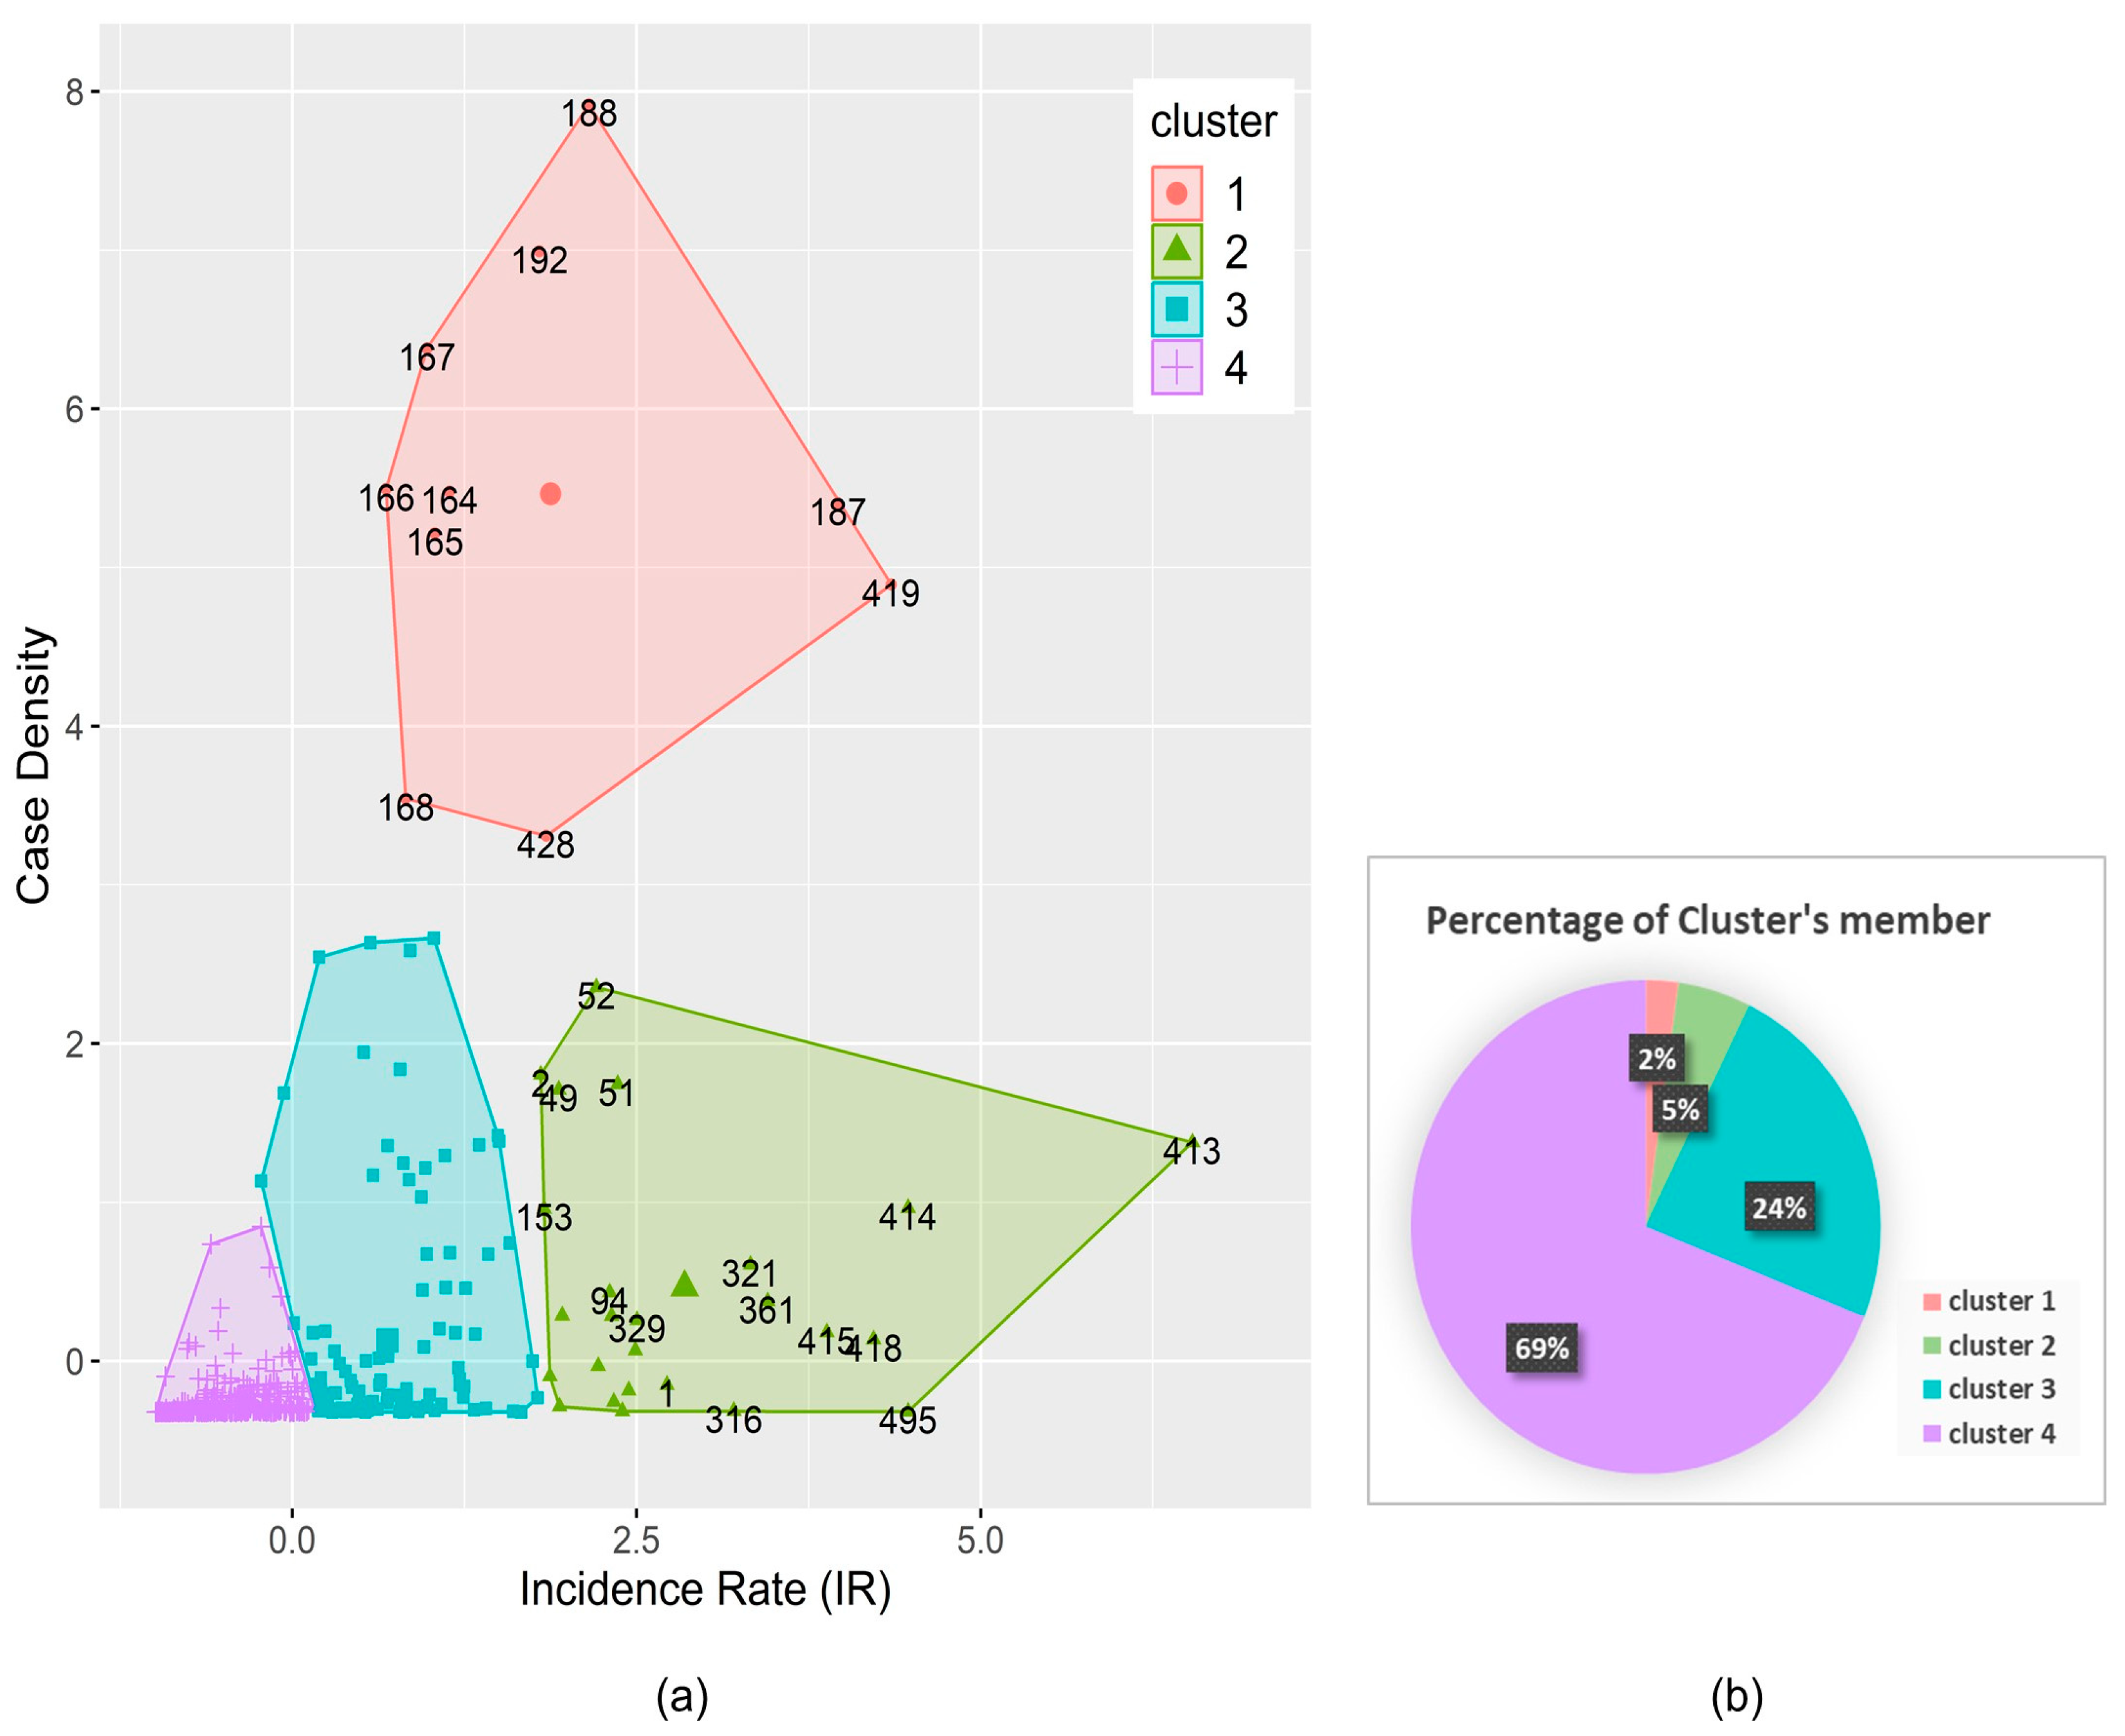
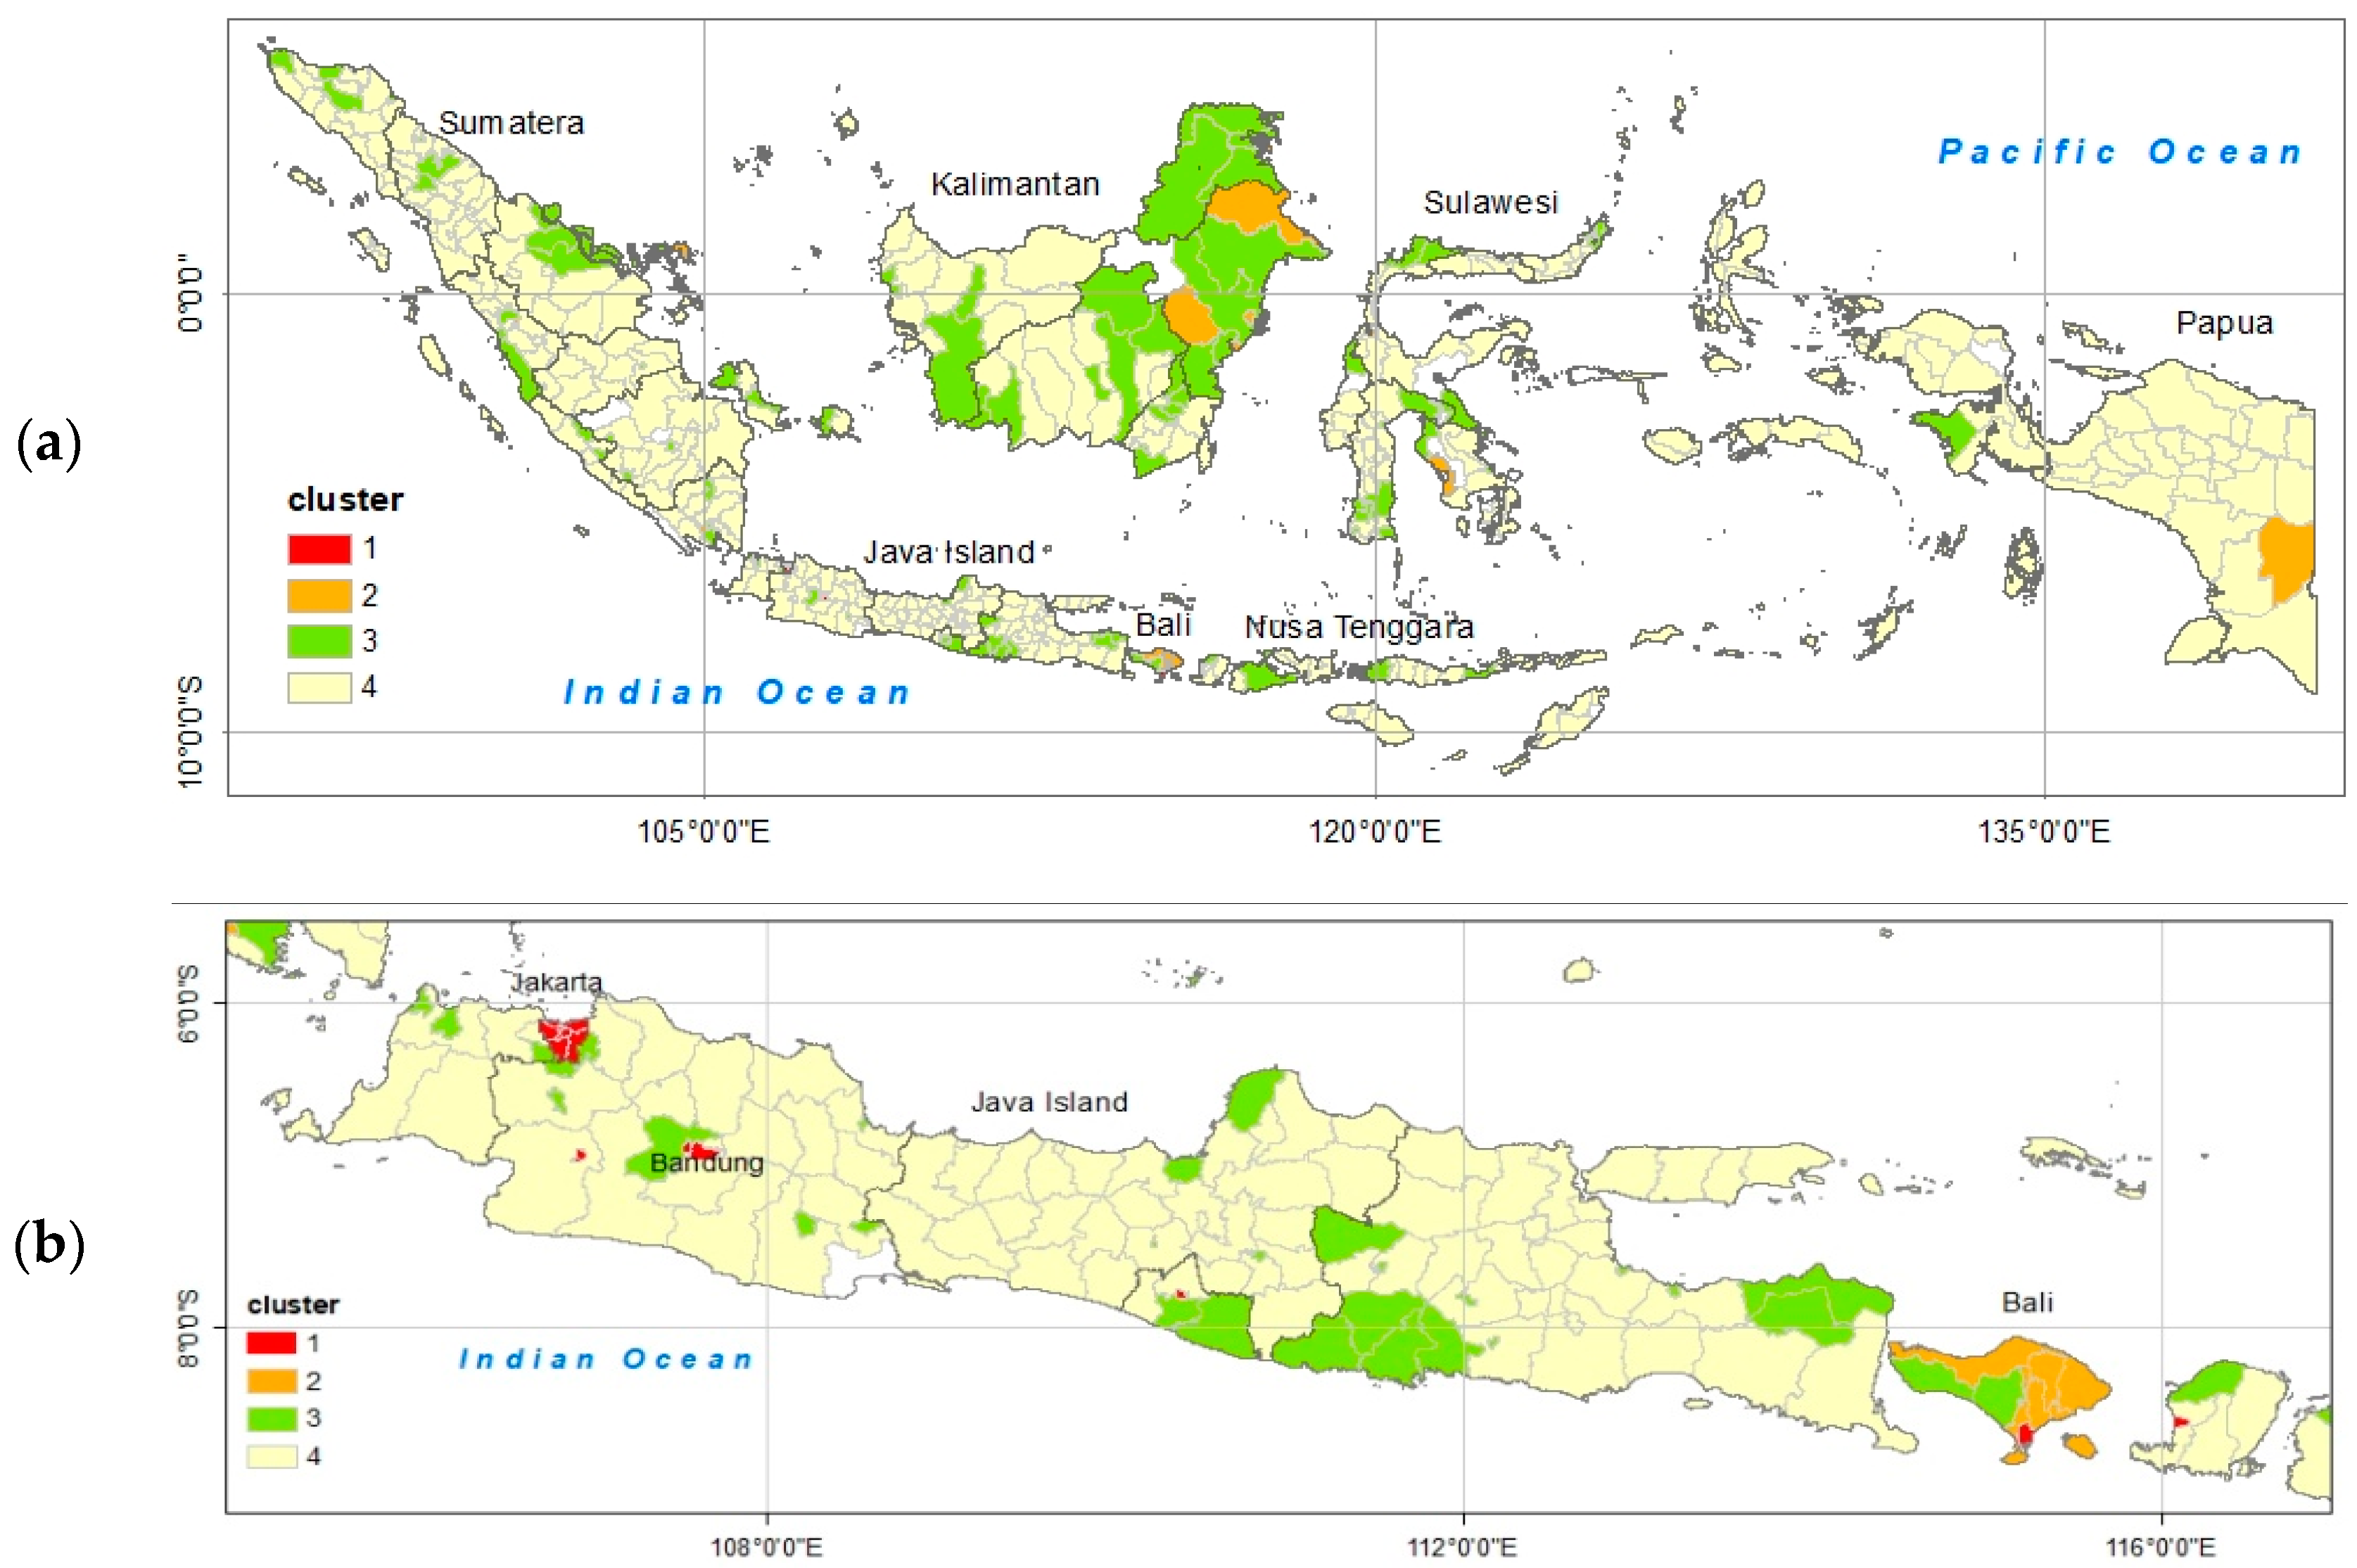
3.2. Determination of the Dengue Hotspot Areas
3.3. Spatiotemporal Distribution of Climate Parameters Strongly Correlated with Dengue Incidence
3.3.1. Variance and Coefficient Correlation
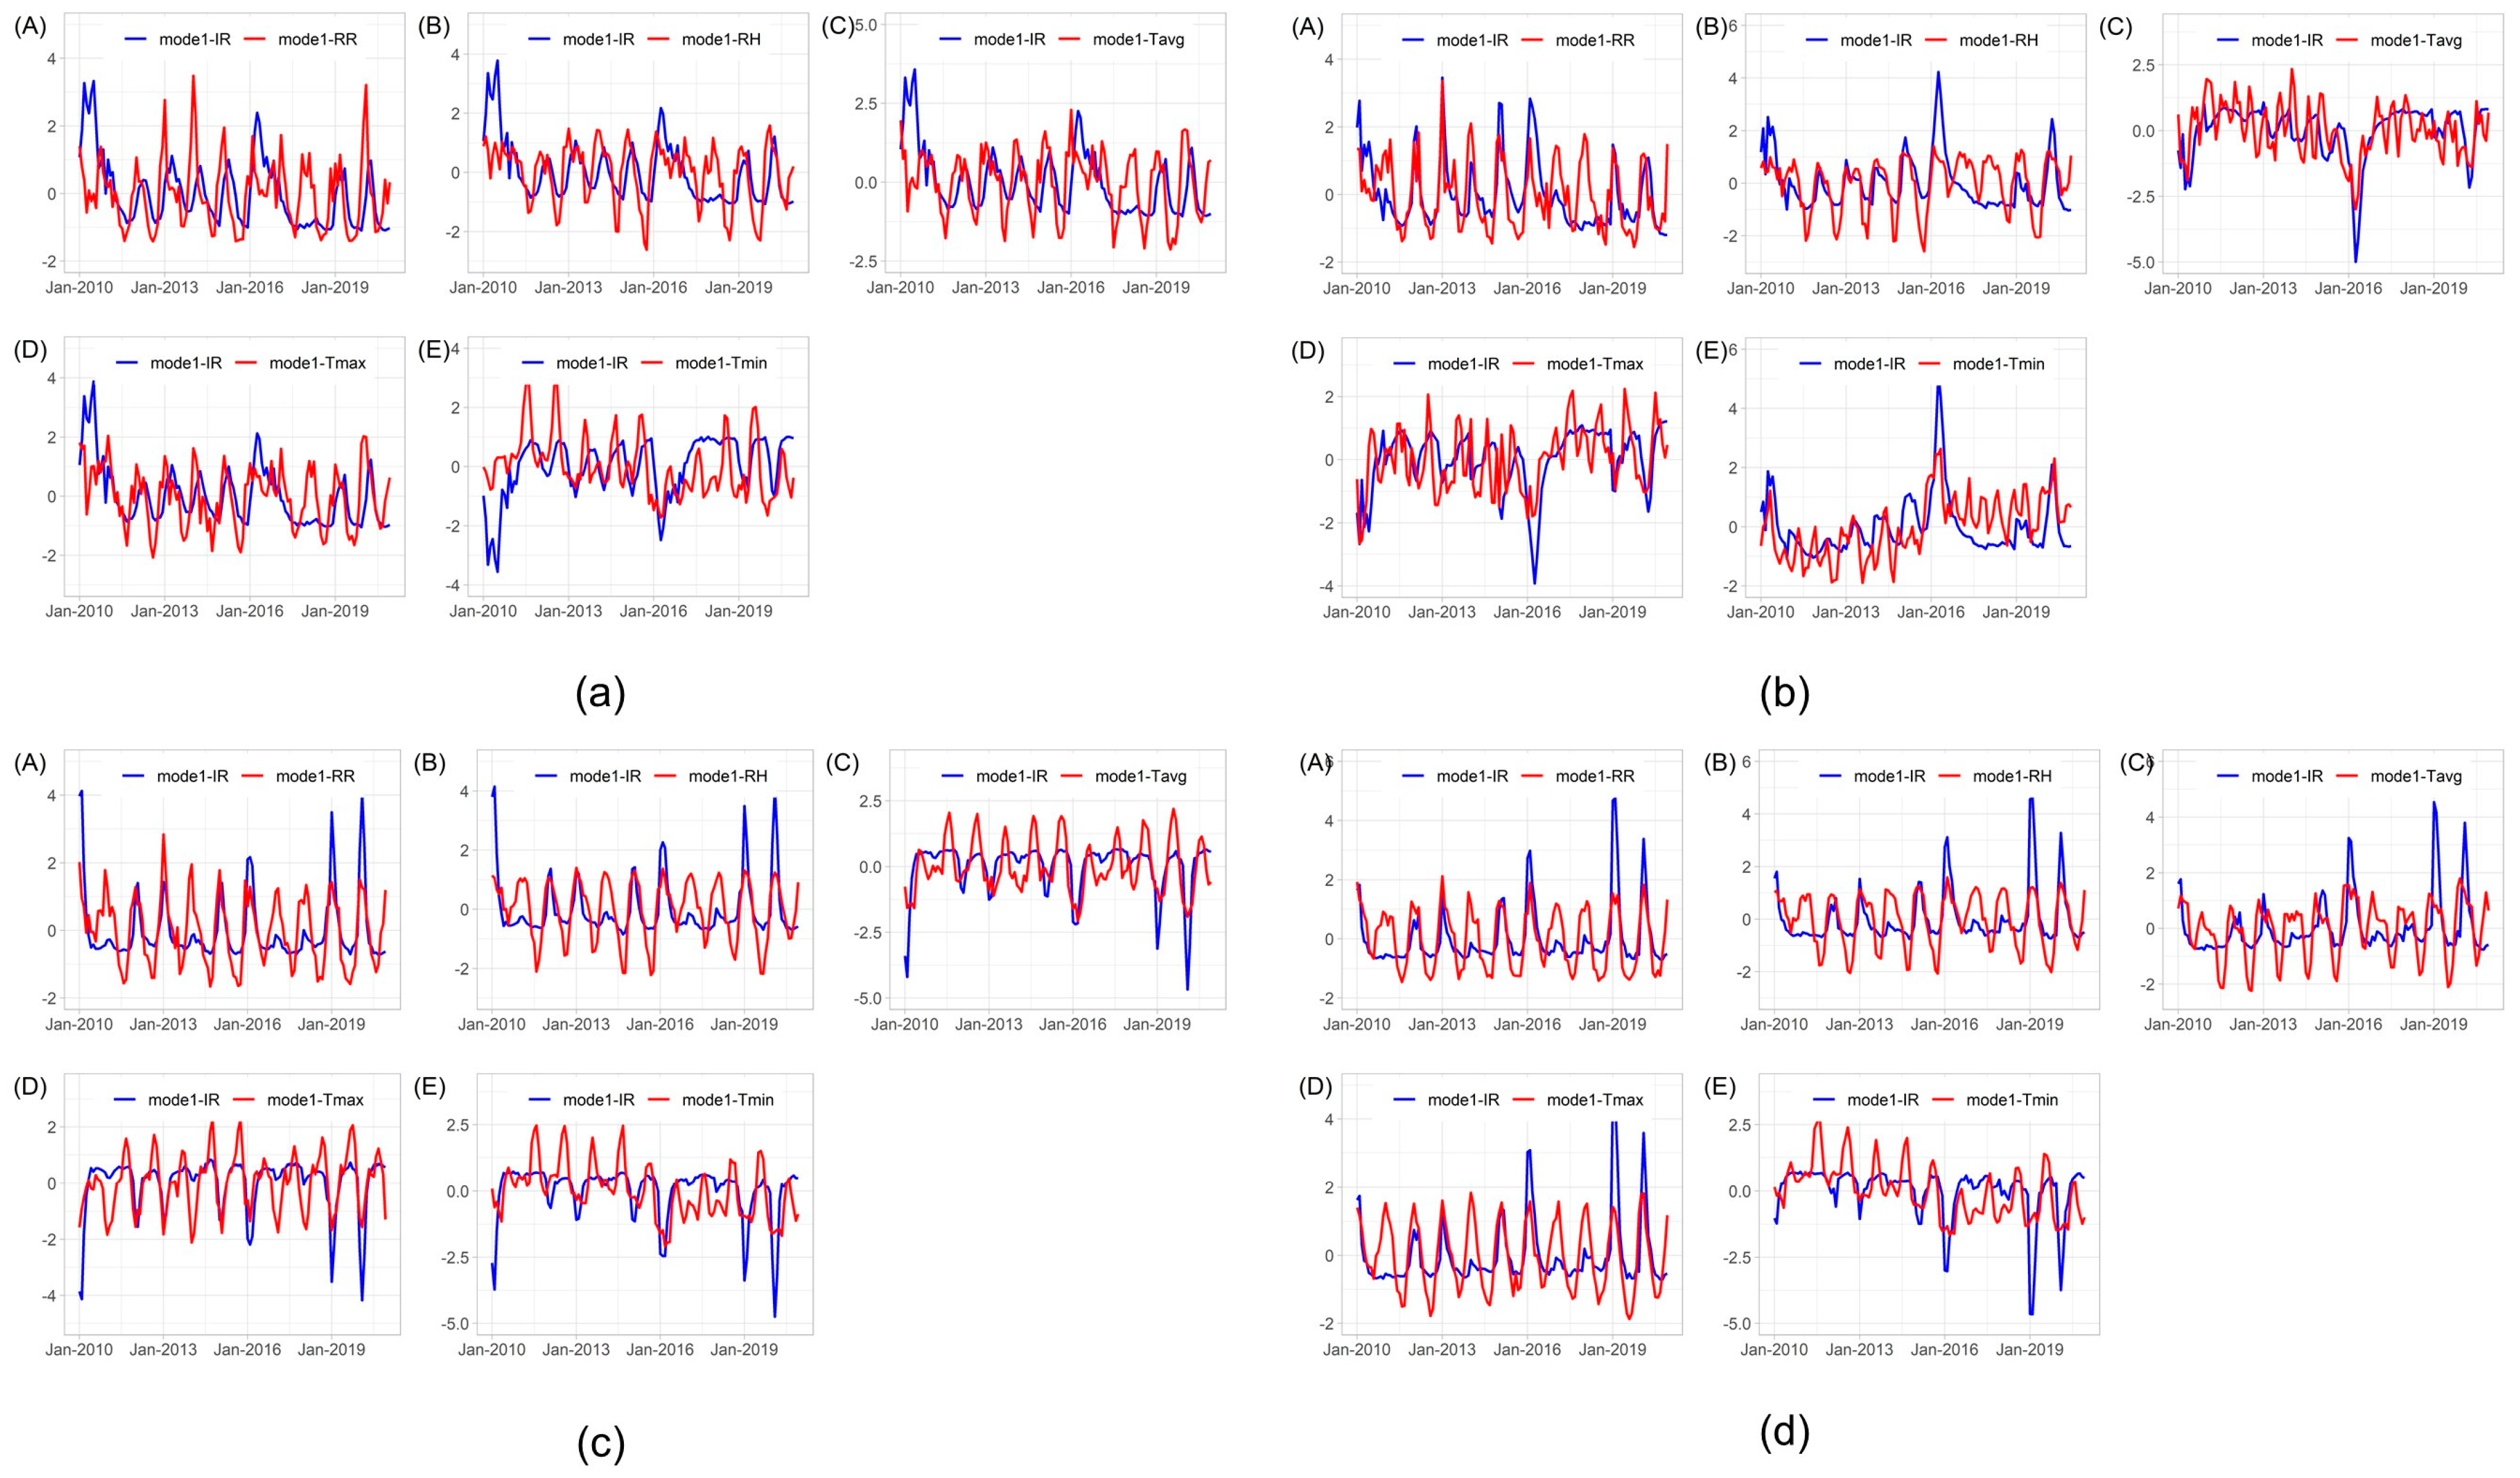
3.3.2. Time-Series Patterns of the Expansion Factors
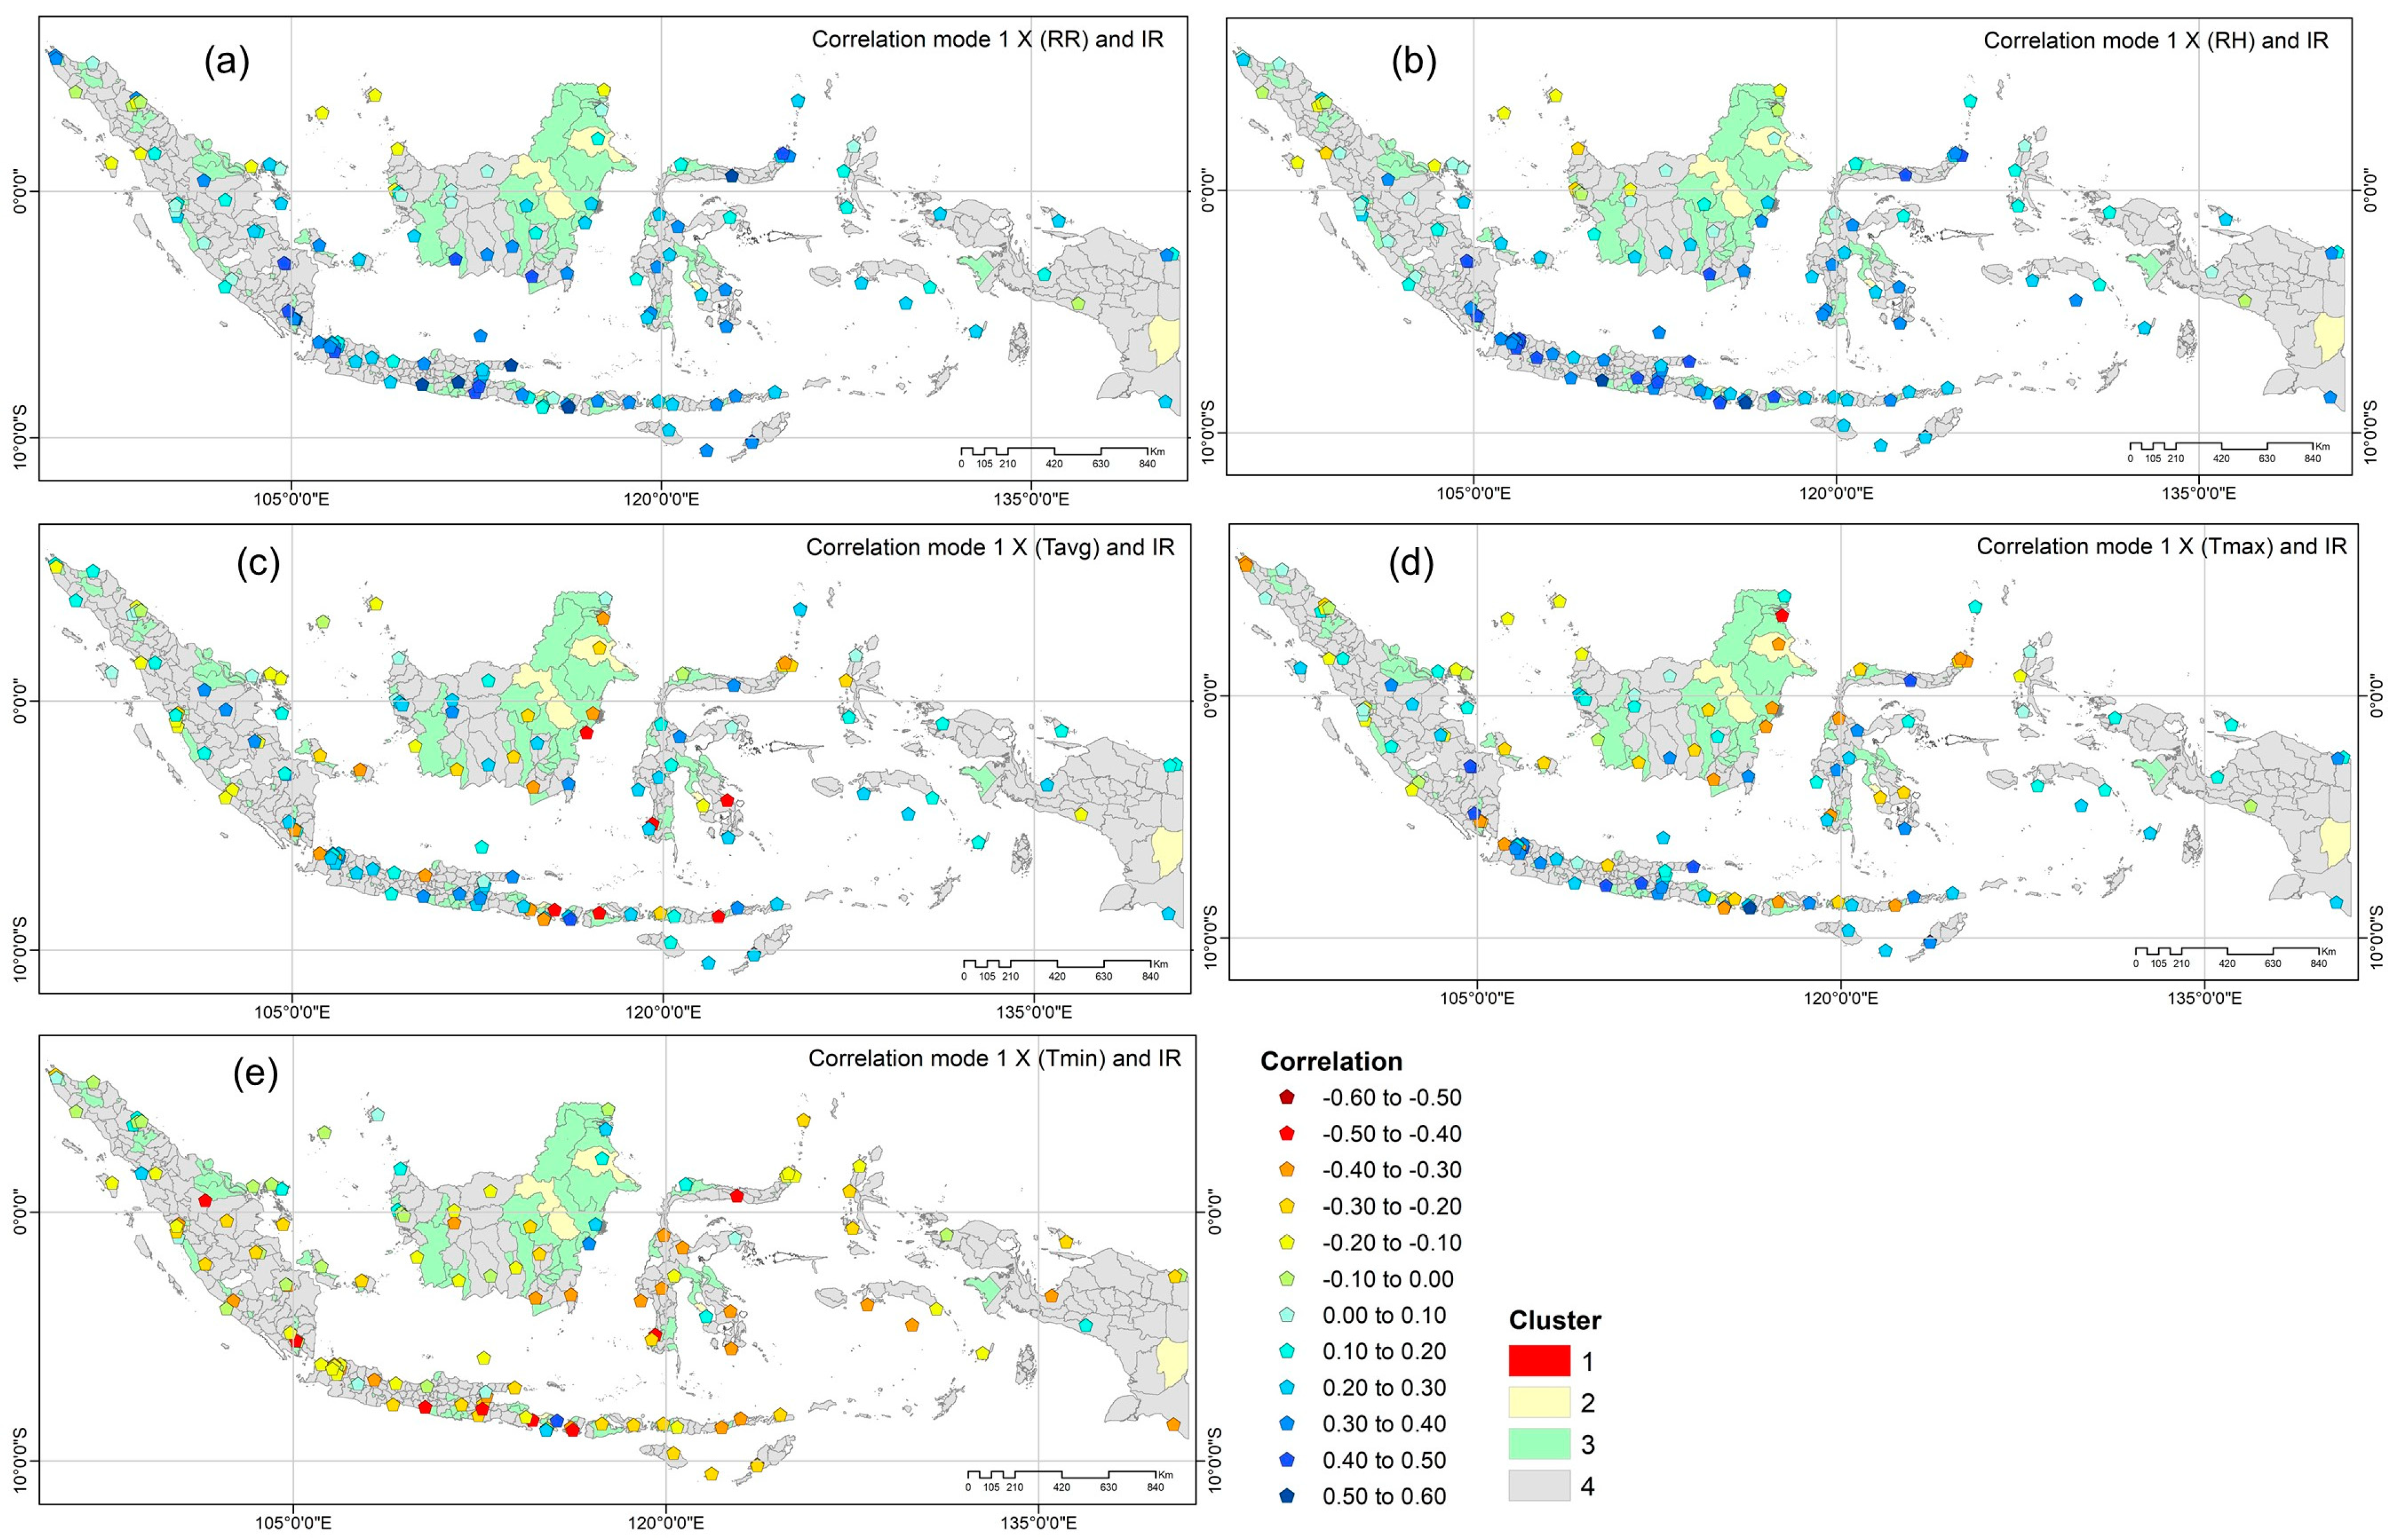
3.3.3. Spatial Distribution of Dominant Climate Parameters to Dengue Incidence
4. Discussion
4.1. Dengue Hotspot Areas
4.2. Climate Parameters Dominant in Influencing Dengue Incidence
5. Conclusions
Supplementary Materials
Author Contributions
Funding
Data Availability Statement
Acknowledgments
Conflicts of Interest
References
- WHO. Treatment, Prevention and Control Global Strategy for Dengue Prevention and Control 2012–2020; WHO: Geneva, Switzerland, 2012; ISBN 9789241504034. [Google Scholar]
- Ebi, K.L.; Nealon, J. Dengue in a Changing Climate. Environ. Res. 2016, 151, 115–123. [Google Scholar] [CrossRef] [PubMed]
- Harapan, H.; Michie, A.; Mudatsir, M.; Sasmono, R.T.; Imrie, A. Epidemiology of Dengue Hemorrhagic Fever in Indonesia: Analysis of Five Decades Data from the National Disease Surveillance. BMC Res. Notes 2019, 12, 4–9. [Google Scholar] [CrossRef] [PubMed]
- Johari, N.A.; Voon, K.; Toh, S.Y.; Sulaiman, L.H.; Yap, I.K.S.; Lim, P.K.C. Sylvatic Dengue Virus Type 4 in Aedes Aegypti and Aedes Albopictus Mosquitoes in an Urban Setting in Peninsular Malaysia. PLoS Negl. Trop. Dis. 2019, 13, e0007889. [Google Scholar] [CrossRef] [PubMed]
- Rodrigues, M.D.M.; Marques, G.R.A.M.; Serpa, L.L.N.; Arduino, M.D.B.; Voltolini, J.C.; Barbosa, G.L.; Andrade, V.R.; De Lima, V.L.C. Density of Aedes Aegypti and Aedes Albopictus and Its Association with Number of Residents and Meteorological Variables in the Home Environment of Dengue Endemic Area, São Paulo, Brazil. Parasites Vectors 2015, 8, 115. [Google Scholar] [CrossRef]
- Husnina, Z.; Clements, A.C.A.; Wangdi, K. Forest Cover and Climate as Potential Drivers for Dengue Fever in Sumatra and Kalimantan 2006–2016: A Spatiotemporal Analysis. Trop. Med. Int. Health 2019, 24, 888–898. [Google Scholar] [CrossRef] [PubMed]
- Haryanto, B. Indonesia Dengue Fever: Status, Vulnerability, and Challenges. Curr. Top. Trop. Emerg. Dis. Travel Med. 2018, 5, 81–92. [Google Scholar] [CrossRef]
- Lee, J.S.; Farlow, A. The Threat of Climate Change to Non-Dengue-Endemic Countries: Increasing Risk of Dengue Transmission Potential Using Climate and Non-Climate Datasets. BMC Public Health 2019, 19, 934. [Google Scholar] [CrossRef] [PubMed]
- Arcari, P.; Tapper, N.; Pfueller, S. Regional Variability in Relationships between Climate and Dengue/DHF in Indonesia. Singap. J. Trop. Geogr. 2007, 28, 251–272. [Google Scholar] [CrossRef]
- Barrera, R.; Amador, M.; MacKay, A.J. Population Dynamics of Aedes Aegypti and Dengue as Influenced by Weather and Human Behavior in San Juan, Puerto Rico. PLoS Negl. Trop. Dis. 2011, 5, e1378. [Google Scholar] [CrossRef]
- Hii, Y.L.; Zhu, H.; Ng, N.; Ng, L.C.; Rocklöv, J. Forecast of Dengue Incidence Using Temperature and Rainfall. PLoS Negl. Trop. Dis. 2012, 6, e1908. [Google Scholar] [CrossRef]
- Putra, P.S.; Nuraini, N. Modeling of Dengue Occurrences Early Warning Involving Temperature and Rainfall Factors. Asian Pac. J. Trop. Dis. 2017, 7, 385–390. [Google Scholar] [CrossRef]
- GFCS. Health Exemplar to the User Interface Platform of the Global Framework for Climate Services; WMO: Geneva, Switzerland, 2014. [Google Scholar]
- Siriyasatien, P.; Chadsuthi, S.; Jampachaisri, K.; Kesorn, K. Dengue Epidemics Prediction: A Survey of the State-of-the-Art Based on Data Science Processes. IEEE Access 2018, 6, 53757–53795. [Google Scholar] [CrossRef]
- Thomson, M.C.; Grace, D.; DeFries, R.; Jessica, C.; Metcalf, E.; Nissan, H.; Giannini, A. Climate Impacts on Disasters, Infectious Diseases and Nutrition. In Climate Information for Public Health Action; Thompson, M.C., Ed.; Routldge: New York, NY, USA, 2019. [Google Scholar]
- Acharya, B.K.; Cao, C.; Xu, M.; Khanal, L.; Naeem, S.; Pandit, S. Temporal Variations and Associated Remotely Sensed Environmental Variables of Dengue Fever in Chitwan District, Nepal. ISPRS Int. J. Geo-Inf. 2018, 7, 275. [Google Scholar] [CrossRef]
- Lowe, R.; Bailey, T.C.; Stephenson, D.B.; Graham, R.J.; Coelho, C.A.S.; Sá Carvalho, M.; Barcellos, C. Spatio-Temporal Modelling of Climate-Sensitive Disease Risk: Towards an Early Warning System for Dengue in Brazil. Comput. Geosci. 2011, 37, 371–381. [Google Scholar] [CrossRef]
- Stolerman, L.M.; Maia, P.D.; Nathan Kutz, J. Forecasting Dengue Fever in Brazil: An Assessment of Climate Conditions. PLoS ONE 2019, 14, e0220106. [Google Scholar] [CrossRef]
- Dickin, S.K.; Schuster-Wallace, C.J.; Elliott, S.J. Developing a Vulnerability Mapping Methodology: Applying the Water-Associated Disease Index to Dengue in Malaysia. PLoS ONE 2013, 8, e63584. [Google Scholar] [CrossRef] [PubMed]
- Tran, B.L.; Tseng, W.C.; Chen, C.C.; Liao, S.Y. Estimating the Threshold Effects of Climate on Dengue: A Case Study of Taiwan. Int. J. Environ. Res. Public Health 2020, 17, 1392. [Google Scholar] [CrossRef] [PubMed]
- Mamenun, M.; Koesmaryono, Y.; Hidayati, R.; Sopaheluwakan, A.; Dasanto, B.D. Kemajuan Penelitian Pemodelan Prediksi Demam Berdarah Dengue Menggunakan Faktor Iklim Di Indonesia: A Systematic Literature Review. Bul. Penelit. Kesehatan. 2021, 49, 231–246. [Google Scholar] [CrossRef]
- Nuraini, N.; Fauzi, I.S.; Fakhruddin, M.; Sopaheluwakan, A.; Soewono, E. Climate-Based Dengue Model in Semarang, Indonesia: Predictions and Descriptive Analysis. Infect. Dis. Model. 2021, 6, 598–611. [Google Scholar] [CrossRef]
- Hidayati, R.; Boer, R.; Koesmaryono, Y.; Kesumawati, U.; Manuwoto, S. Dengue Early Warning Model Using Development Stages of Aedes Aegypti. Biotropia 2012, 19, 30–41. [Google Scholar] [CrossRef]
- Fakhruddin, M.; Putra, P.S.; Wijaya, K.P.; Sopaheluwakan, A.; Satyaningsih, R.; Komalasari, K.E.; Mamenun; Sumiati; Indratno, S.W.; Nuraini, N.; et al. Assessing the Interplay between Dengue Incidence and Weather in Jakarta via a Clustering Integrated Multiple Regression Model. Ecol. Complex. 2019, 39, 100768. [Google Scholar] [CrossRef]
- Kesetyaningsih, T.W.; Andarini, S.; Sudarto, S.; Pramoedyo, H. The Minimum-Maximum Weather Temperature Difference Effect on Dengue in Sleman Regency of Yogyakarta, Indonesia. Walailak J. Sci. Technol. 2018, 15, 387–396. [Google Scholar] [CrossRef]
- Machado, N.G.; Neto, L.; Barbosa, J.; Octavio, L. Spatiotemporal Dengue Fever Incidence Associated with Climate in a Brazilian Tropical Region. Geographies 2023, 3, 673–686. [Google Scholar] [CrossRef]
- Aldrian, E.; Dwi Susanto, R. Identification of Three Dominant Rainfall Regions within Indonesia and Their Relationship to Sea Surface Temperature. Int. J. Climatol. 2003, 23, 1435–1452. [Google Scholar] [CrossRef]
- Putra, I.D.G.A.; Nimiya, H.; Sopaheluwakan, A.; Kubota, T.; Lee, H.S.; Pradana, R.P.; Alfata, M.N.F.; Perdana, R.B.; Permana, D.S.; Riama, N.F. Development of Climate Zones for Passive Cooling Techniques in the Hot and Humid Climate of Indonesia. Build. Environ. 2022, 226, 109698. [Google Scholar] [CrossRef]
- WMO. Guidelines on the Calculation of Climate Normals; WMO-No. 1203; WHO: Geneva, Switzerland, 2017; Volume 29. [Google Scholar]
- Supari; Tangang, F.; Juneng, L.; Aldrianc, E. Observed Changes in Extreme Temperature and Precipitation over Indonesia. Int. J. Climatol. 2016, 37, 1979–1997. [Google Scholar] [CrossRef]
- Phakhounthong, K.; Chaovalit, P.; Jittamala, P.; Blacksell, S.D.; Carter, M.J.; Turner, P.; Chheng, K.; Sona, S.; Kumar, V.; Day, N.P.J.; et al. Predicting the Severity of Dengue Fever in Children on Admission Based on Clinical Features and Laboratory Indicators: Application of Classification Tree Analysis. BMC Pediatr. 2018, 18, 109. [Google Scholar] [CrossRef] [PubMed]
- Pedersen, A.B.; Mikkelsen, E.M.; Cronin-Fenton, D.; Kristensen, N.R.; Pham, T.M.; Pedersen, L.; Petersen, I. Missing Data and Multiple Imputation in Clinical Epidemiological Research. Clin. Epidemiol. 2017, 9, 157–166. [Google Scholar] [CrossRef] [PubMed]
- Stephenson, C.; Coker, E.; Wisely, S.; LIang, S.; Dinglasan, R.R.; Lednicky, J.A. Imported Dengue Case Umbers and LOcal Climatic Patterns Are Associated with Dengue Virus TRansmission in Florida, USA. Insects 2022, 13, 163. [Google Scholar] [CrossRef]
- Wang, S.; Huang, G.H.; Lin, Q.G.; Li, Z.; Zhang, H.; Fan, Y.R. Comparison of Interpolation Methods for Estimating Spatial Distribution of Precipitation in Ontario, Canada. Int. J. Climatol. 2014, 34, 3745–3751. [Google Scholar] [CrossRef]
- Hadi, S.J.; Tombul, M. Comparison of Spatial Interpolation Methods of Precipitation and Temperature Using Multiple Integration Periods. J. Indian Soc. Remote Sens. 2018, 46, 1187–1199. [Google Scholar] [CrossRef]
- Pablo de Amorim, B.; Franke, J.; da Anunciação, Y.M.T.; Weiss, H.; Bernhofer, C. Comparison of Spatial Interpolation Methods for the Estimation of Precipitation Distribution in Distrito Federal, Brazil. Theor. Appl. Climatol. 2016, 123, 335–348. [Google Scholar] [CrossRef]
- Lugner, M.; Gudbjörnsdottir, S.; Sattar, N.; Svensson, A.M.; Miftaraj, M.; Eeg-Olofsson, K.; Eliasson, B.; Franzén, S. Comparison between Data-Driven Clusters and Models Based on Clinical Features to Predict Outcomes in Type 2 Diabetes: Nationwide Observational Study. Diabetologia 2021, 64, 1973–1981. [Google Scholar] [CrossRef] [PubMed]
- Bjornsson, H.; Venegas, S.A. A Manual for EOF and SVD Analyses of Climatic Data. CCGCR Rep. 1997. No. 97-1. pp. 1–52. Available online: https://geog.mcgill.ca/gec3/wp-content/uploads/2009/03/Report-no.-1997-1.pdf (accessed on 10 October 2021).
- Haryanto, S.; Hayati, R.F.; Yohan, B.; Sijabat, L.; Sihite, I.F.; Fahri, S.; Meutiawati, F.; Halim, J.A.N.; Halim, S.N.; Soebandrio, A.; et al. The Molecular and Clinical Features of Dengue during Outbreak in Jambi, Indonesia in 2015. Pathog. Glob. Health 2016, 110, 119–129. [Google Scholar] [CrossRef] [PubMed]
- Anyamba, A.; Chretien, J.P.; Britch, S.C.; Soebiyanto, R.P.; Small, J.L.; Jepsen, R.; Forshey, B.M.; Sanchez, J.L.; Smith, R.D.; Harris, R.; et al. Global Disease Outbreaks Associated with the 2015–2016 El Niño Event. Sci. Rep. 2019, 9, 1930. [Google Scholar] [CrossRef] [PubMed]
- Das, B.; Mohanty, S.; Swabhiman, G. Aedes: What Do We Know about Them and What Can They Transmit? In Vectors, and Vector-Borne Zoonotic Diseases; Savić, S., Ed.; Intechopen: London, UK, 2019; p. 132. ISBN 978-1-83962-045-4. [Google Scholar]
- Fauzi, I.S.; Fakhruddin, M.; Nuraini, N.; Wijaya, K.P. Comparison of Dengue Transmission in Lowland and Highland Area: Case Study in Semarang and Malang, Indonesia. Commun. Biomath. Sci. 2019, 2, 23. [Google Scholar] [CrossRef]
- Wang, C.; Jiang, B.; Fan, J.; Wang, F.; Qiyong, L. A Study of the Dengue Epidemic and Meteorological Factors in Guangzhou, China, by Using a Zero-Inflated Poisson Regression Model. Asia Pac. J. Public Health 2014, 1, 48–57. [Google Scholar] [CrossRef]
- Morin, C.W.; Comrie, A.C.; Ernst, K. Climate and Dengue Transmission: Evidence and Implications. Environ. Health Perspect. 2013, 121, 1264–1272. [Google Scholar] [CrossRef]

| Cluster | Mode | SCF (%) | Correlation (r) * | ||||||||
|---|---|---|---|---|---|---|---|---|---|---|---|
| RR | RH | Tavg | Tmax | Tmin | RR | RH | Tavg | Tmax | Tmin | ||
| Cluster 1 | Mode 1 | 95.0 | 98.7 | 88.3 | 92.7 | 79.4 | 0.24 (0.005) | 0.47 (0.00) | 0.33 (0.00) | 0.46 (0.00) | 0.24 (0.005) |
| Mode 2 | 3.8 | 0.9 | 9.5 | 4.0 | 12.0 | 0.19 (0.026) | 0.40 (0.00) | 0.31 (0.00) | 0.23 (0.007) | 0.20 (0.022) | |
| Accum. SCF mode 1–2 | 98.8 | 99.6 | 97.8 | 96.7 | 91.4 | ||||||
| Cluster 2 | Mode 1 | 69.6 | 73.2 | 69.5 | 56.6 | 79.6 | 0.54 (0.00) | 0.49 (0.00) | 0.54 (0.00) | 0.51 (0.00) | 0.49 (0.00) |
| Mode 2 | 15.3 | 13.4 | 20.8 | 28.1 | 15.2 | 0.39 (0.00) | 0.49 (0.00) | 0.42 (0.00) | 0.53 (0.00) | 0.45 (0.00) | |
| Accum. SCF mode 1–2 | 84.9 | 86.6 | 90.3 | 84.7 | 94.8 | ||||||
| Cluster 3 | Mode 1 | 84.0 | 90.3 | 59.6 | 79.6 | 80.5 | 0.57 (0.00) | 0.54 (0.00) | 0.57 (0.00) | 0.54 (0.00) | 0.48 (0.00) |
| Mode 2 | 5.8 | 4.2 | 26.2 | 8.7 | 12.9 | 0.47 (0.00) | 0.59 (0.00) | 0.60 (0.00) | 0.49 (0.00) | 0.65 (0.00) | |
| Accum. SCF mode 1–2 | 89.8 | 94.5 | 85.8 | 88.3 | 93.4 | ||||||
| Cluster 4 | Mode 1 | 82.3 | 86.1 | 69.1 | 69.0 | 83.9 | 0.58 (0.00) | 0.53 (0.00) | 0.45 (0.00) | 0.54 (0.00) | 0.49 (0.00) |
| Mode 2 | 4.0 | 5.1 | 13.3 | 14.7 | 7.5 | 0.53 (0.00) | 0.56 (0.00) | 0.46 (0.00) | 0.50 (0.00) | 0.63 (0.00) | |
| Accum. SCF mode 1–2 | 86.3 | 91.2 | 82.5 | 83.7 | 91.4 | ||||||
Disclaimer/Publisher’s Note: The statements, opinions and data contained in all publications are solely those of the individual author(s) and contributor(s) and not of MDPI and/or the editor(s). MDPI and/or the editor(s) disclaim responsibility for any injury to people or property resulting from any ideas, methods, instructions or products referred to in the content. |
© 2024 by the authors. Licensee MDPI, Basel, Switzerland. This article is an open access article distributed under the terms and conditions of the Creative Commons Attribution (CC BY) license (https://creativecommons.org/licenses/by/4.0/).
Share and Cite
Mamenun; Koesmaryono, Y.; Sopaheluwakan, A.; Hidayati, R.; Dasanto, B.D.; Aryati, R. Spatiotemporal Characterization of Dengue Incidence and Its Correlation to Climate Parameters in Indonesia. Insects 2024, 15, 366. https://doi.org/10.3390/insects15050366
Mamenun, Koesmaryono Y, Sopaheluwakan A, Hidayati R, Dasanto BD, Aryati R. Spatiotemporal Characterization of Dengue Incidence and Its Correlation to Climate Parameters in Indonesia. Insects. 2024; 15(5):366. https://doi.org/10.3390/insects15050366
Chicago/Turabian StyleMamenun, Yonny Koesmaryono, Ardhasena Sopaheluwakan, Rini Hidayati, Bambang Dwi Dasanto, and Rita Aryati. 2024. "Spatiotemporal Characterization of Dengue Incidence and Its Correlation to Climate Parameters in Indonesia" Insects 15, no. 5: 366. https://doi.org/10.3390/insects15050366