Abstract
A sponge city is an established urban stormwater management approach that effectively reduces urban runoff and pollutant discharges. In order to plan and design, estimate costs, and evaluate the performance of urban sponge city systems, it is essential to calculate the storage scale. In this context, a sponge city storage scale and calculation method based on a multifactor spatial overlay was designed, utilising the starting area of the Dafeng Hi-tech Development Zone in Yancheng City, China, as an illustrative example. The indicators for assessing the impact of sponge city systems on river plain networks are constructed based on four aspects: land planning, building density, water surface rate and green space rate. The relative importance of each indicator was determined based on the necessity of controlling runoff from land parcels and the appropriateness of facility construction. The annual runoff control rate of the 39 low-impact development control units in the study area was calculated using ArcGIS through multifactor spatial overlay mapping and weighting. The results showed that (1) the Geographic Information System (GIS)overlay technology can effectively assist in the decomposition of LID scales; (2) data can be derived, including the design storage volume and other basic control scale indicators for each unit. The study results are expected to serve as a reference for the preparation of special low-impact development plans in the river plain network area of China and the promotion of the construction of a sustainable blue–green system in the city.
1. Introduction
Rapid urbanisation and global climate change pose significant challenges to urban stormwater management. Urbanisation and population growth increase urban runoff and impact the natural environment’s storage capacity, with extensive impermeable pavements replacing permeable vegetated surfaces, greatly reducing rainwater infiltration, leading to an increase in urban runoff and placing greater pressure on traditional stormwater management systems [1,2]. To address the growing need for urban stormwater management resulting from urbanisation and climate change, sponge city projects are proposed and constructed. The sponge city concept integrates low-impact development (LID)/green infrastructure, midway drainage network optimisation and flood control systems, providing a comprehensive and systematic solution to improve the water ecology of a city through infiltration, retention, detention, purification, reuse and discharge [3,4]. The Chinese government stated that 70 percent of rainwater is expected to be recycled through sponge cities [5].
Low-impact development (LID) constitutes the source part of the sponge city concept, which is widely employed as an approach to urban stormwater management [6]. A sponge city restores the natural state of soil by enhancing its infiltration capacity and slowing or reducing runoff, thereby alleviating the pressures associated with urbanisation and stormwater management [7]. Sponge cities have shown promise in increasing stormwater infiltration and storage, effectively reducing runoff and pollutant discharges [8,9]. They can also be used as an alternative to mitigate urban water-related hazards, especially urban flooding [10,11,12]. There are two main measures needed for implementing a sponge city to control runoff. The first is to use permeable features, such as lawns and gardens, to increase the city’s infiltration capacity. The second is to direct runoff from impervious surfaces to permeable surfaces or detention facilities. These measures divert the stormwater runoff to catch basins for subsequent use. The key components of sponge city infrastructure are green roofs, rain gardens, vegetated swales, permeable pavements, infiltration trenches, rain barrels and detention basins [13].
Determining the size of sponge city facilities is a crucial step in the planning process of urban low-impact development systems. This has a significant impact on the evaluation of system performance, cost estimation and design layout. If the scale of the sponge city facilities is too small, they will not be able to fully utilise their storage function and achieve the desired results. Conversely, if the facilities are designed on too large a scale, their efficiency will be reduced, construction costs will increase, and there may be idle facilities, increased energy consumption, and higher operating costs. Regular maintenance is crucial for sponge city facilities to avoid impaired function and resource wastage [14]. Therefore, it is important to rationalise the layout and allocation of these facilities to fully utilise their capacity within a certain cost range [15].
At present, computer simulation models are mainly used to assist in sponge city planning and design, for example, the Storm Water Management Model (SWMM) [16]. Duarte et al. [17] combined the genetic algorithm NSGA-II with the SWMM model to obtain the optimal LID unit area and aquifer thickness considering different rainfall conditions and cost-effectiveness. Due to the fact that urban surface pollution is affected by rainfall characteristics, surface features and other factors, the simulation is difficult, and some existing models lack accuracy and applicability [18,19], while others vary in functionality and lack a comprehensive LID model [20]. Similar models are the Model for Urban Stormwater Improvement (MUSIC) [21] and Rainwater+ [22]. Furthermore, scholars have researched the optimisation of layout for sponge city facilities. She et al. [23] conducted multi-objective optimisation using an annealing algorithm. They selected runoff, pollutant emissions, construction and operation costs, and environmental benefits as optimisation objectives to calculate the optimal sponge city layout design scheme. This scheme can significantly reduce runoff, pollutant emissions, and operation costs. Cheng et al. [24] optimised the wetland space of sponge cities using genetic algorithms with the objectives of wetland potential, pollution removal maximisation, and input cost minimisation. However, most existing studies have focused on the benefits of combining various sponge city facilities and determining the optimal ratio of these facilities within a specific scale [25,26,27]. Fewer studies have explored the calculation of the appropriate scale for sponge city facilities. In addition, the current LID design still uses manual adjustment on a unit scale, which greatly increases the costs and workloads [28].
Mapping analysis originated in the late 19th and early 20th centuries. Charles Eliot was the first to use this method for landscape resource analysis in park system planning for the Greater Boston area in the United States [29]. In the 1980s, the development of digital technology led to the use of the traditional stacked map method on computers. This made the operation more convenient and scientific and helped people interpret, recognise and design the landscape environment more effectively. Digital overlays can be created by superimposing two or more groups of digitised element files of the same area and scale, resulting in a new data layer that combines the attributes of the original layer. Geographic Information Systems (GISs) are largely derived from the overlay method, while the development of GIS technology has significantly improved this method. GISs can handle vector maps, gridded images and other data and have powerful map and attribute data processing capabilities [30]. GIS-based overlay analyses have proven the effectiveness of the method in a variety of fields. Sing et al. [31] developed thematic maps of seven factors affecting groundwater potential, such as altitude, geology, slope, soil type, etc., and identified groundwater potential zones using a weighted overlay of the seven thematic maps according to the importance of each factor. Barakat et al. [32] developed site suitability maps of quarry sites using a weighted raster overlay of GISs and classified three zones as unsuitable, moderately suitable and most suitable to assess the potential of quarry aggregate resources. Zumara et al. [33] used a GIS-based weighted overlay technique to derive eight factors for assessing soil erosion levels, identifying potential geological stages of erosion.
The decomposition of the low-impact development storage scale is determined by the number of urban parcels and the scale of regional low-impact development facilities. Differences between urban parcels, such as natural conditions, planning and construction conditions and socio-economic conditions, can be quantified using technical means. This can be analysed using digital superimposed maps of the relevant impact factors, combined with the raster calculation function to assign weights to the relevant factors. Simultaneously, it can be combined with the raster calculation function to assign weights, reclassify and perform algebraic calculations of the relevant factors. The final decomposition results can also be displayed in data visualisation, making digital stacked diagram technology more applicable to scale decomposition research for low-impact development systems.
Therefore, this paper uses the Dafeng Hi-tech Development Zone in Yancheng City as a case study to calculate the design storage scale of a low-impact development system based on meteorological conditions and spatial data. The objective of the study was twofold: (1) To derive design rainfalls and construct scale decomposition impact indicators and (2) to decompose the scale of the system by means of GIS multifactor spatial overlay techniques.
The research highlights of this study are as follows: (1) We summarised the total annual runoff control rate and its design rainfall derivation method in sponge city design in river plain network areas. (2) We adopted the multifactor spatial superposition method for the scale decomposition of low-impact development facilities. (3) We facilitated the scale decomposition of a sponge city based on ArcGIS digital overlay technology. The study can serve as a reference for planning and designing low-impact development systems in river plain network areas. This can aid in building a sustainable blue–green system in the city and enhance the scientificity of planning and design. The paper is organised as follows: Section 2 presents the study area, data and the main methodology. The results are presented in Section 3. Finally, a discussion and conclusion are presented in Section 4.
2. Materials and Methods
2.1. Study Area
The plain river network area is characterised by a high urban water surface rate, flat terrain and a high degree of urbanisation. The storage scale indicators of low-impact development facilities in this area are significantly different from those in hilly and mountainous landscapes, etc. The Dafeng Hi-Tech Development Zone in Yancheng City, Jiangsu Province, is a representative of a plain river network area in China and was selected as the study area for the present study.
The starting area of Dafeng Hi-tech Development Zone is located in the Lixia River Plain, with a flat topography, a dense water network and abundant water resources, which is a typical river plain network geomorphology. The area is influenced by the oceanic warm and humid monsoon climate, with rain and heat in the same season and abundant rainfall, with an average annual rainfall of about 1000 mm. The study area is delineated as the north to 332 Provincial Highway, the south to Liuyu Road, the west to Jingyi Road, and the east to Jingwu Road, with a total area of 576.5 hm2, as shown in Figure 1. According to the Control Detailed Planning for the Start-up Area of Dafeng High-Tech Zone, the planned land in the study area mainly includes second-class residential land. (This is a type of urban residential land. This type of land is widely distributed and represents the principal type of residential land. It is characterised by multi-storey, medium-height and high-height unit-type residential buildings, which are accompanied by complete supporting facilities and a complete layout.) It also includes industrial land. (Industrial land is defined as land used for independently established factories, workshops, handicraft workshops, production sites for construction and installation, and slag (ash) discharge sites.) Furthermore, it includes office land (land for non-profit-making facilities of party and government organs, social organisations, institutions, mass self-government organisations, etc.) and green land, of which industrial land accounts for 50%. In the underlay planning, the water surface rate of the study area is 5.6%, and the proportion of green space is 22% (Figure 2). However, without adopting the low-impact development system design, the integrated runoff coefficient of the site is about 0.61, which is an area-weighted average of the runoff coefficients for different land types across the catchment. The total annual runoff control rate is 35%. The total annual runoff control rate (TARC) is a measure of the effectiveness of stormwater management on a site and indicates the proportion of the total annual rainfall on the site that is controlled by natural and engineered means. The control indicators are much lower than the requirements for low-impact development construction in Dafeng City (Table 1).
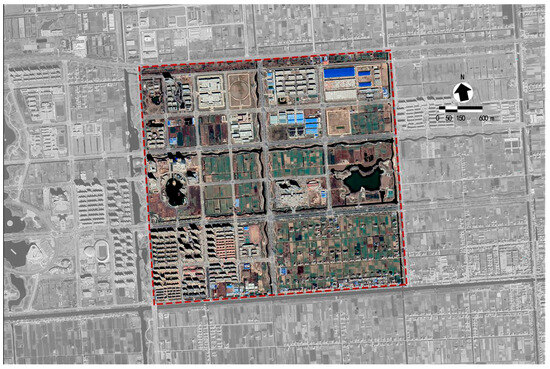
Figure 1.
Satellite image of the current situation in the starting area of Dafeng High-tech Development Zone in Yancheng City.
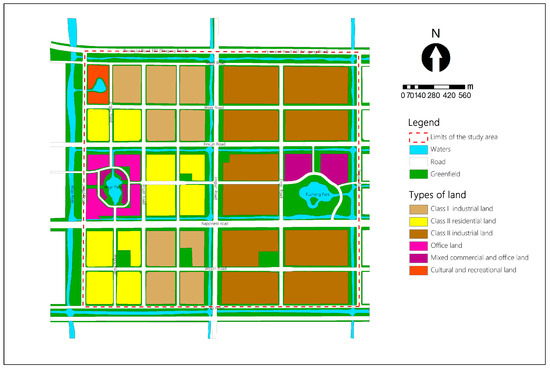
Figure 2.
Yancheng Dafeng High-Tech Zone urban detailed land use plan.

Table 1.
Different annual runoff control rates and corresponding designed rainfall depths in the study area.
In terms of the delineation of control units, there are difficulties in using elevation as a criterion for the delineation of drainage zones because the study area is located in a river plain network area with flat topography. Therefore, in terms of catchment area delineation, this study is mainly based on urban municipal roads, river network water systems and other factors.
2.2. Data Sources and Processing
In this study, 24 h daily value rainfall data from Jiangsu Dafeng station (station no. 58158) from January 1990 to January 2020 over 30 years in the “Daily Value Dataset of Surface Climatological Data of China (V3.0)” were used for the calculations. The relevant data were obtained through the meteorological data network of the China Meteorological Administration (CMA), and a total of 1933 valid 24 h daily rainfall data values were obtained after excluding rainfall events smaller than 2.1 mm. This dataset provides rainfall information for this study, which can be used to assess the rainfall situation and water management needs in the study area. Based on the control plots in the study area, this calculation divides the study area into 39 control units (Figure 3).
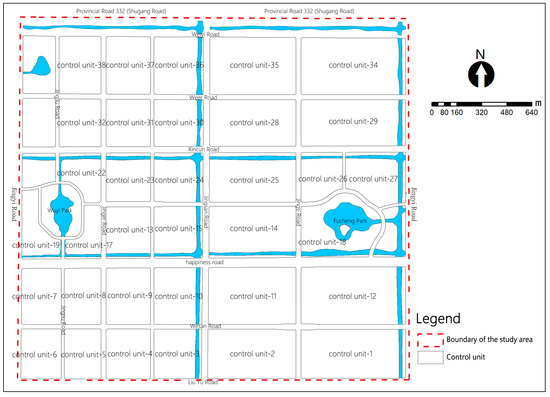
Figure 3.
Low-impact development control unit division in the starting area of Yancheng Dafeng High-tech Zone.
2.3. Methods
The study employs a multifactor spatial overlay analysis to assess and decompose the scale of low-impact development systems, taking into account multiple impact factor weights. Geospatial analysis and raster calculation functions were used to perform spatial superposition, weight assignment, reclassification and Boolean calculations on the impact factors. The results of the analyses were presented through visualisation to provide information for decision-making. In the context of software selection, this study primarily utilised ArcGIS version 10.3, developed by Environmental Systems Research Institute, Inc. (ESRI), Washington, USA. In determining the scale of the low-impact development system, it was first necessary to take into account the natural geographic location and climatic conditions of the city in order to specify the total runoff control scale. Secondly, according to the determination of the overall scale, the overall control scale was decomposed step by step into different levels of control units, and the design volume and proportion of the annual runoff control rate of each level of control unit were determined by considering the current situation and planning characteristics of each level. Again, at the site level, the type and proportion of the low-impact development technical measures adopted for each control unit were determined according to the design scale of the control unit at the upper level. Finally, a bottom-up calibration was conducted to verify that the upper-level system sizing requirements were met.
2.3.1. Storage Criteria and Design Rainfall
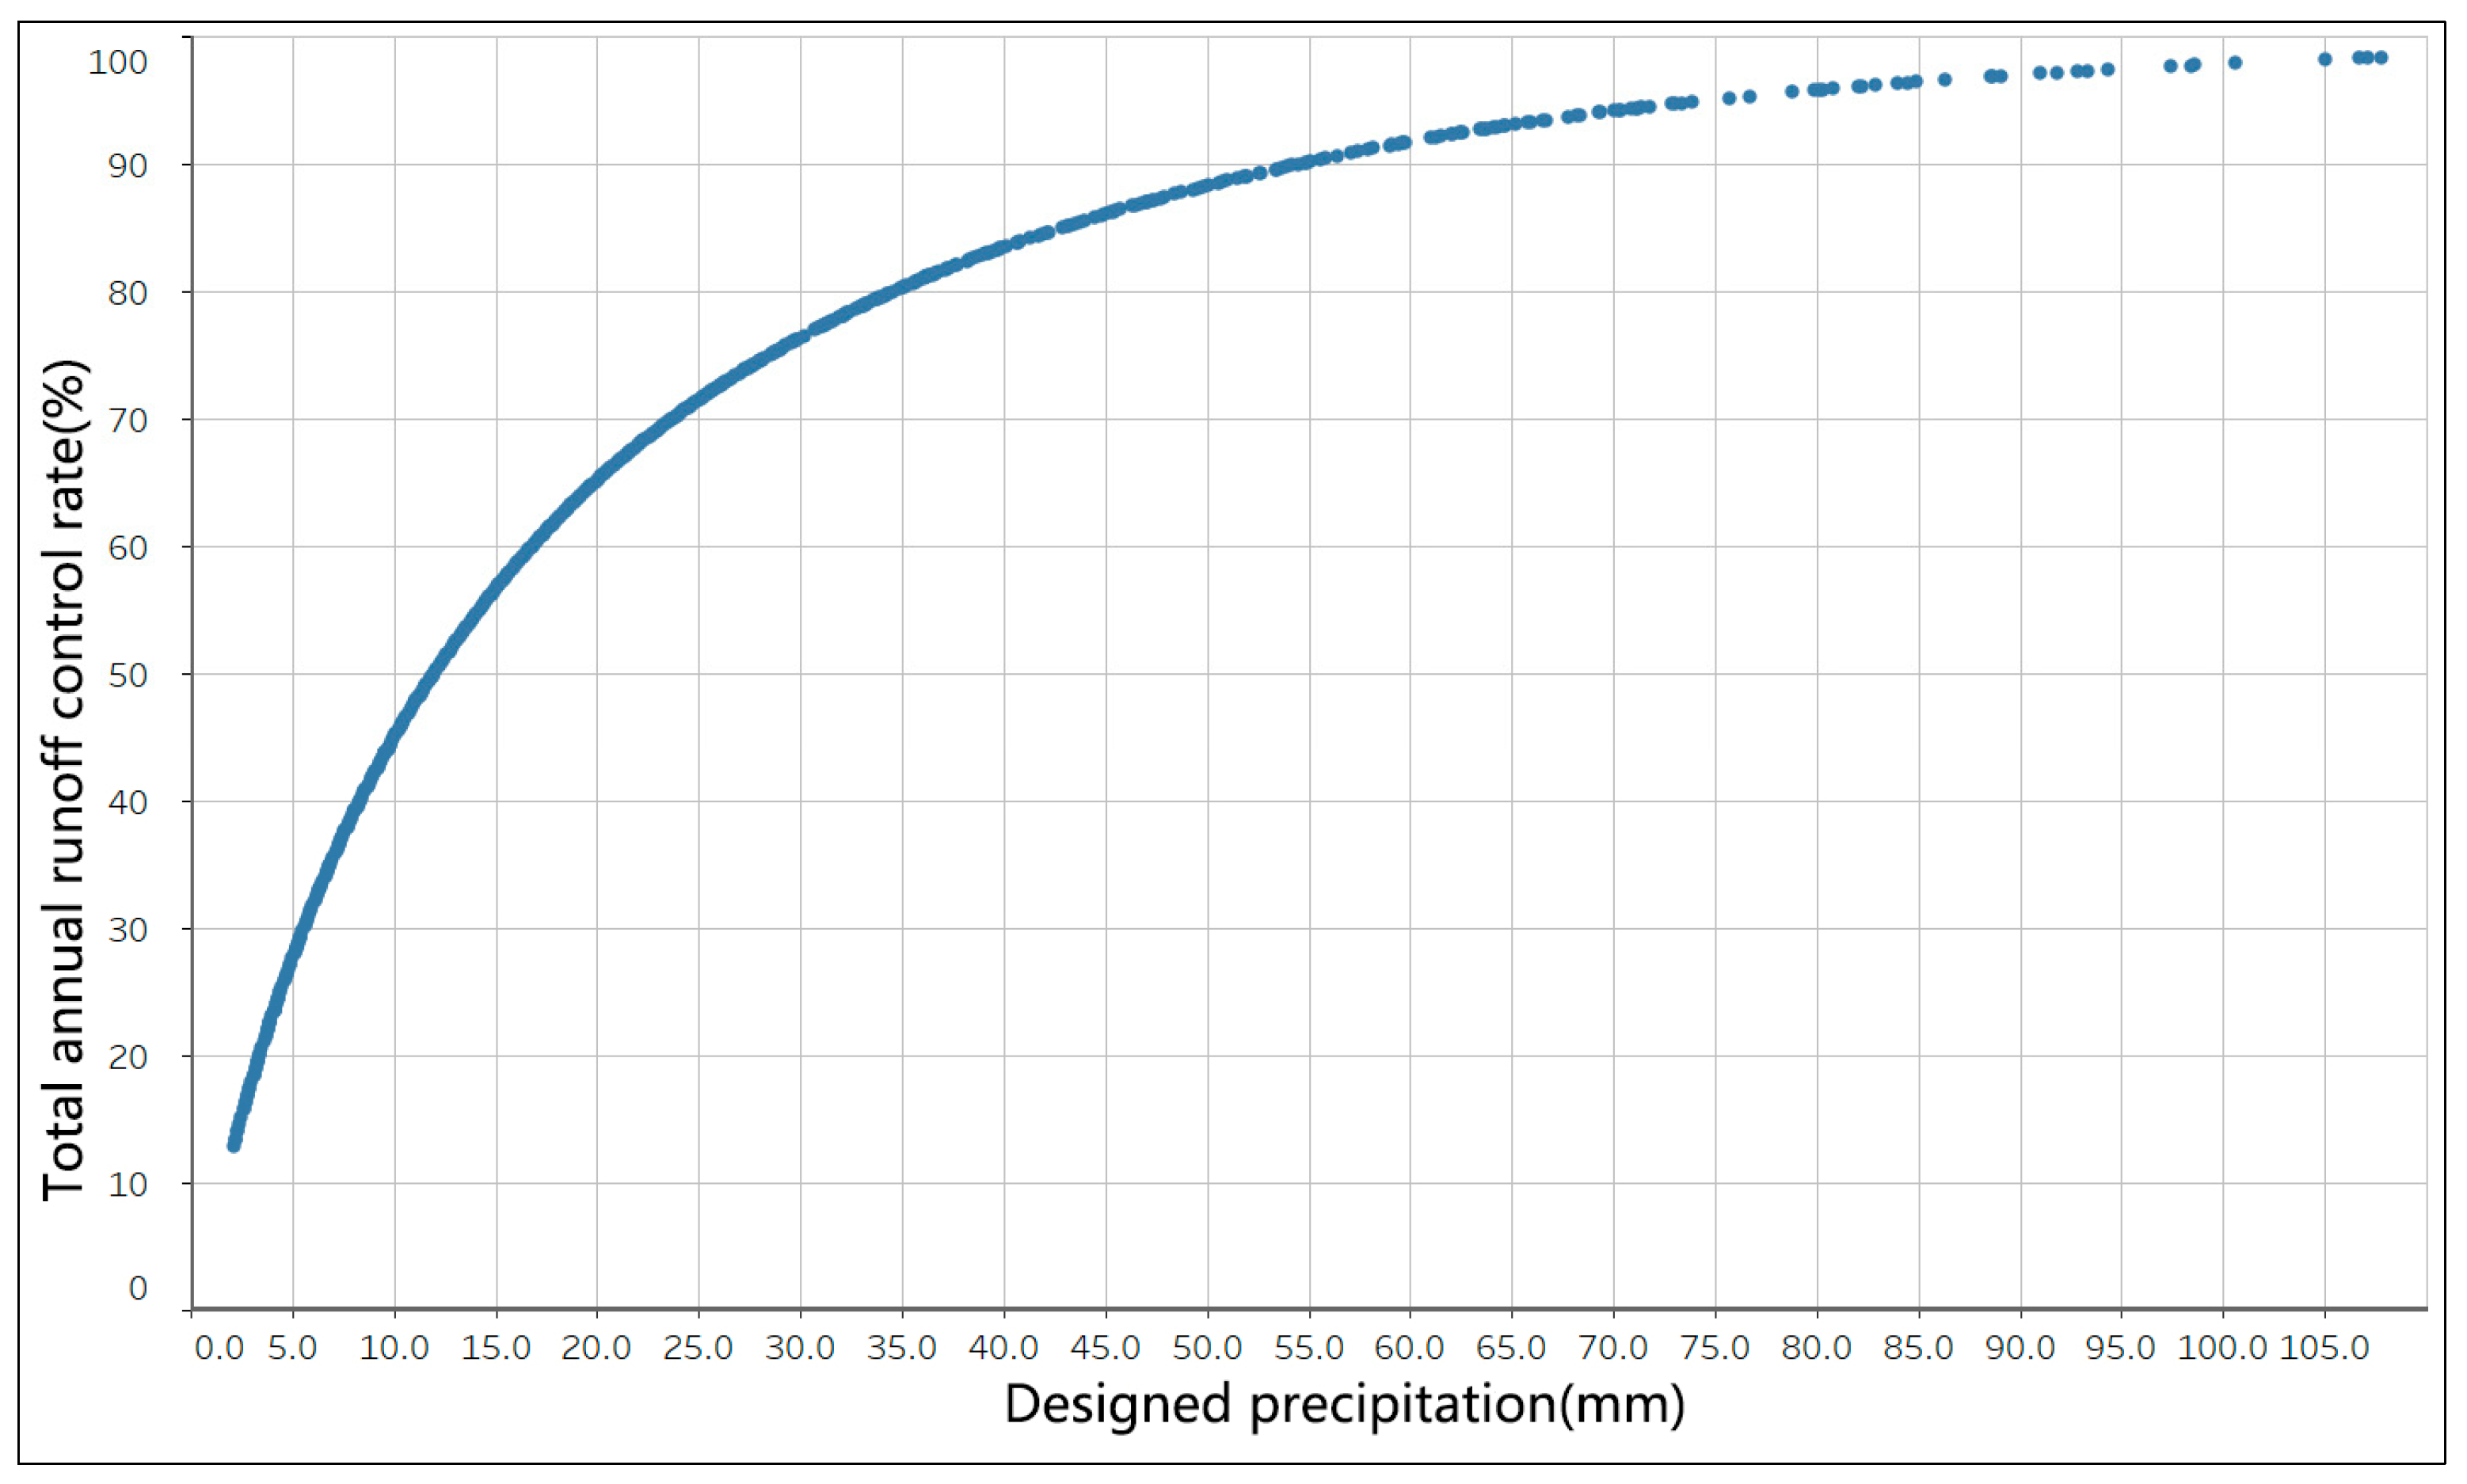
According to the Ministry of Housing and Construction’s Technical Guidelines for Sponge City Construction—Low-Impact Development Stormwater System Construction, Dafeng is located in Zone IV, which requires the total annual runoff control rate to be in the range of 70% ≤ α ≤ 85%. In order to determine the correspondence between the design rainfall and the annual runoff control rate, in this study, the day-by-day rainfall data of Dafeng district were counted. Based on the statistical results, we derived the relationship between different annual total runoff control rates and design rainfall in Dafeng District. Figure 4 demonstrates the curve between the annual runoff control rate and design rainfall. From the figure, it can be seen that as the total annual runoff control rate increases, the corresponding design rainfall increases.
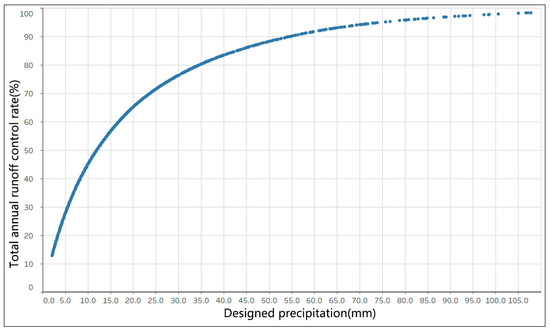
Figure 4.
Relationship between annual runoff control rate and design rainfall in Dafeng.
A high total annual runoff control rate implies that a larger design scale of low-impact development is required to achieve greater ecological benefits, but it also increases the cost of the facility. Therefore, in determining the range of values for the annual runoff control rate and design rainfall, the actual site conditions need to be considered. By analysing the graph of the relationship between the annual runoff control rate and the design rainfall, we can see that in the study area, the maximum design rainfall corresponding to meeting the 70% ≤ α ≤ 85% annual runoff control rate criterion is 43 mm, and the minimum design rainfall is 24 mm.
2.3.2. Determination of Total Design Storage Scale
In this paper, the volume method formula V = 10HφF was used to calculate the total volume of design storage, V. According to the derivation in the previous section, the design rainfall, H, was determined to be 24–43 mm, and the integrated rainfall runoff coefficient, φ, and weighted superposition of the rainfall runoff coefficients of the planning subsurface of each parcel were assigned according to the design scale of the low-impact development of different planning levels (Table 2), which resulted in the integrated rainfall runoff coefficient of the study area being 0.514. Referring to the Building Drainage Design Code (GB50014), the rainfall runoff coefficients for roads, green areas, water surfaces and construction sites are 0.9, 0.15, 1.0 and 0.5, respectively, and based on the proportion of the area of each subsurface (17%, 22%, 5.6% and 55.4%) and the total area of the study area (576.5 hm2), the interval of the total scale of the study area for designing the storage was calculated to be 71,117 to 127,418 m3.
Table 2.
Reference values of the runoff coefficients of the different underlying surface types. Data Source: Code for Building Drainage Design.
2.3.3. Decomposition of the Scale of Low-Impact Development Systems
The study used the method of level-by-level decomposition and tier progression to calculate the scale indicators of low-impact development system, decompose the annual control runoff rate and design the storage volume. This calculation example was based on the urban area scale, and we directly divided the control units at the parcel level to describe the indicator decomposition process for a single parcel-level control unit as an example, to determine the appropriate control indicators at different levels, and to provide accurate guidance for the planning and design of low-impact development systems.
- Impact Factor
Land use, groundwater conditions, topographic features, construction costs and stormwater reuse are key factors in determining a potential sponge city [34]. In this study, the scale of the study area, water environment problems and planning control conditions were considered comprehensively, and the feasibility of the construction of sponge city facilities on the land parcels was combined to construct sponge city scale decomposition indexes for the study area.
- i.
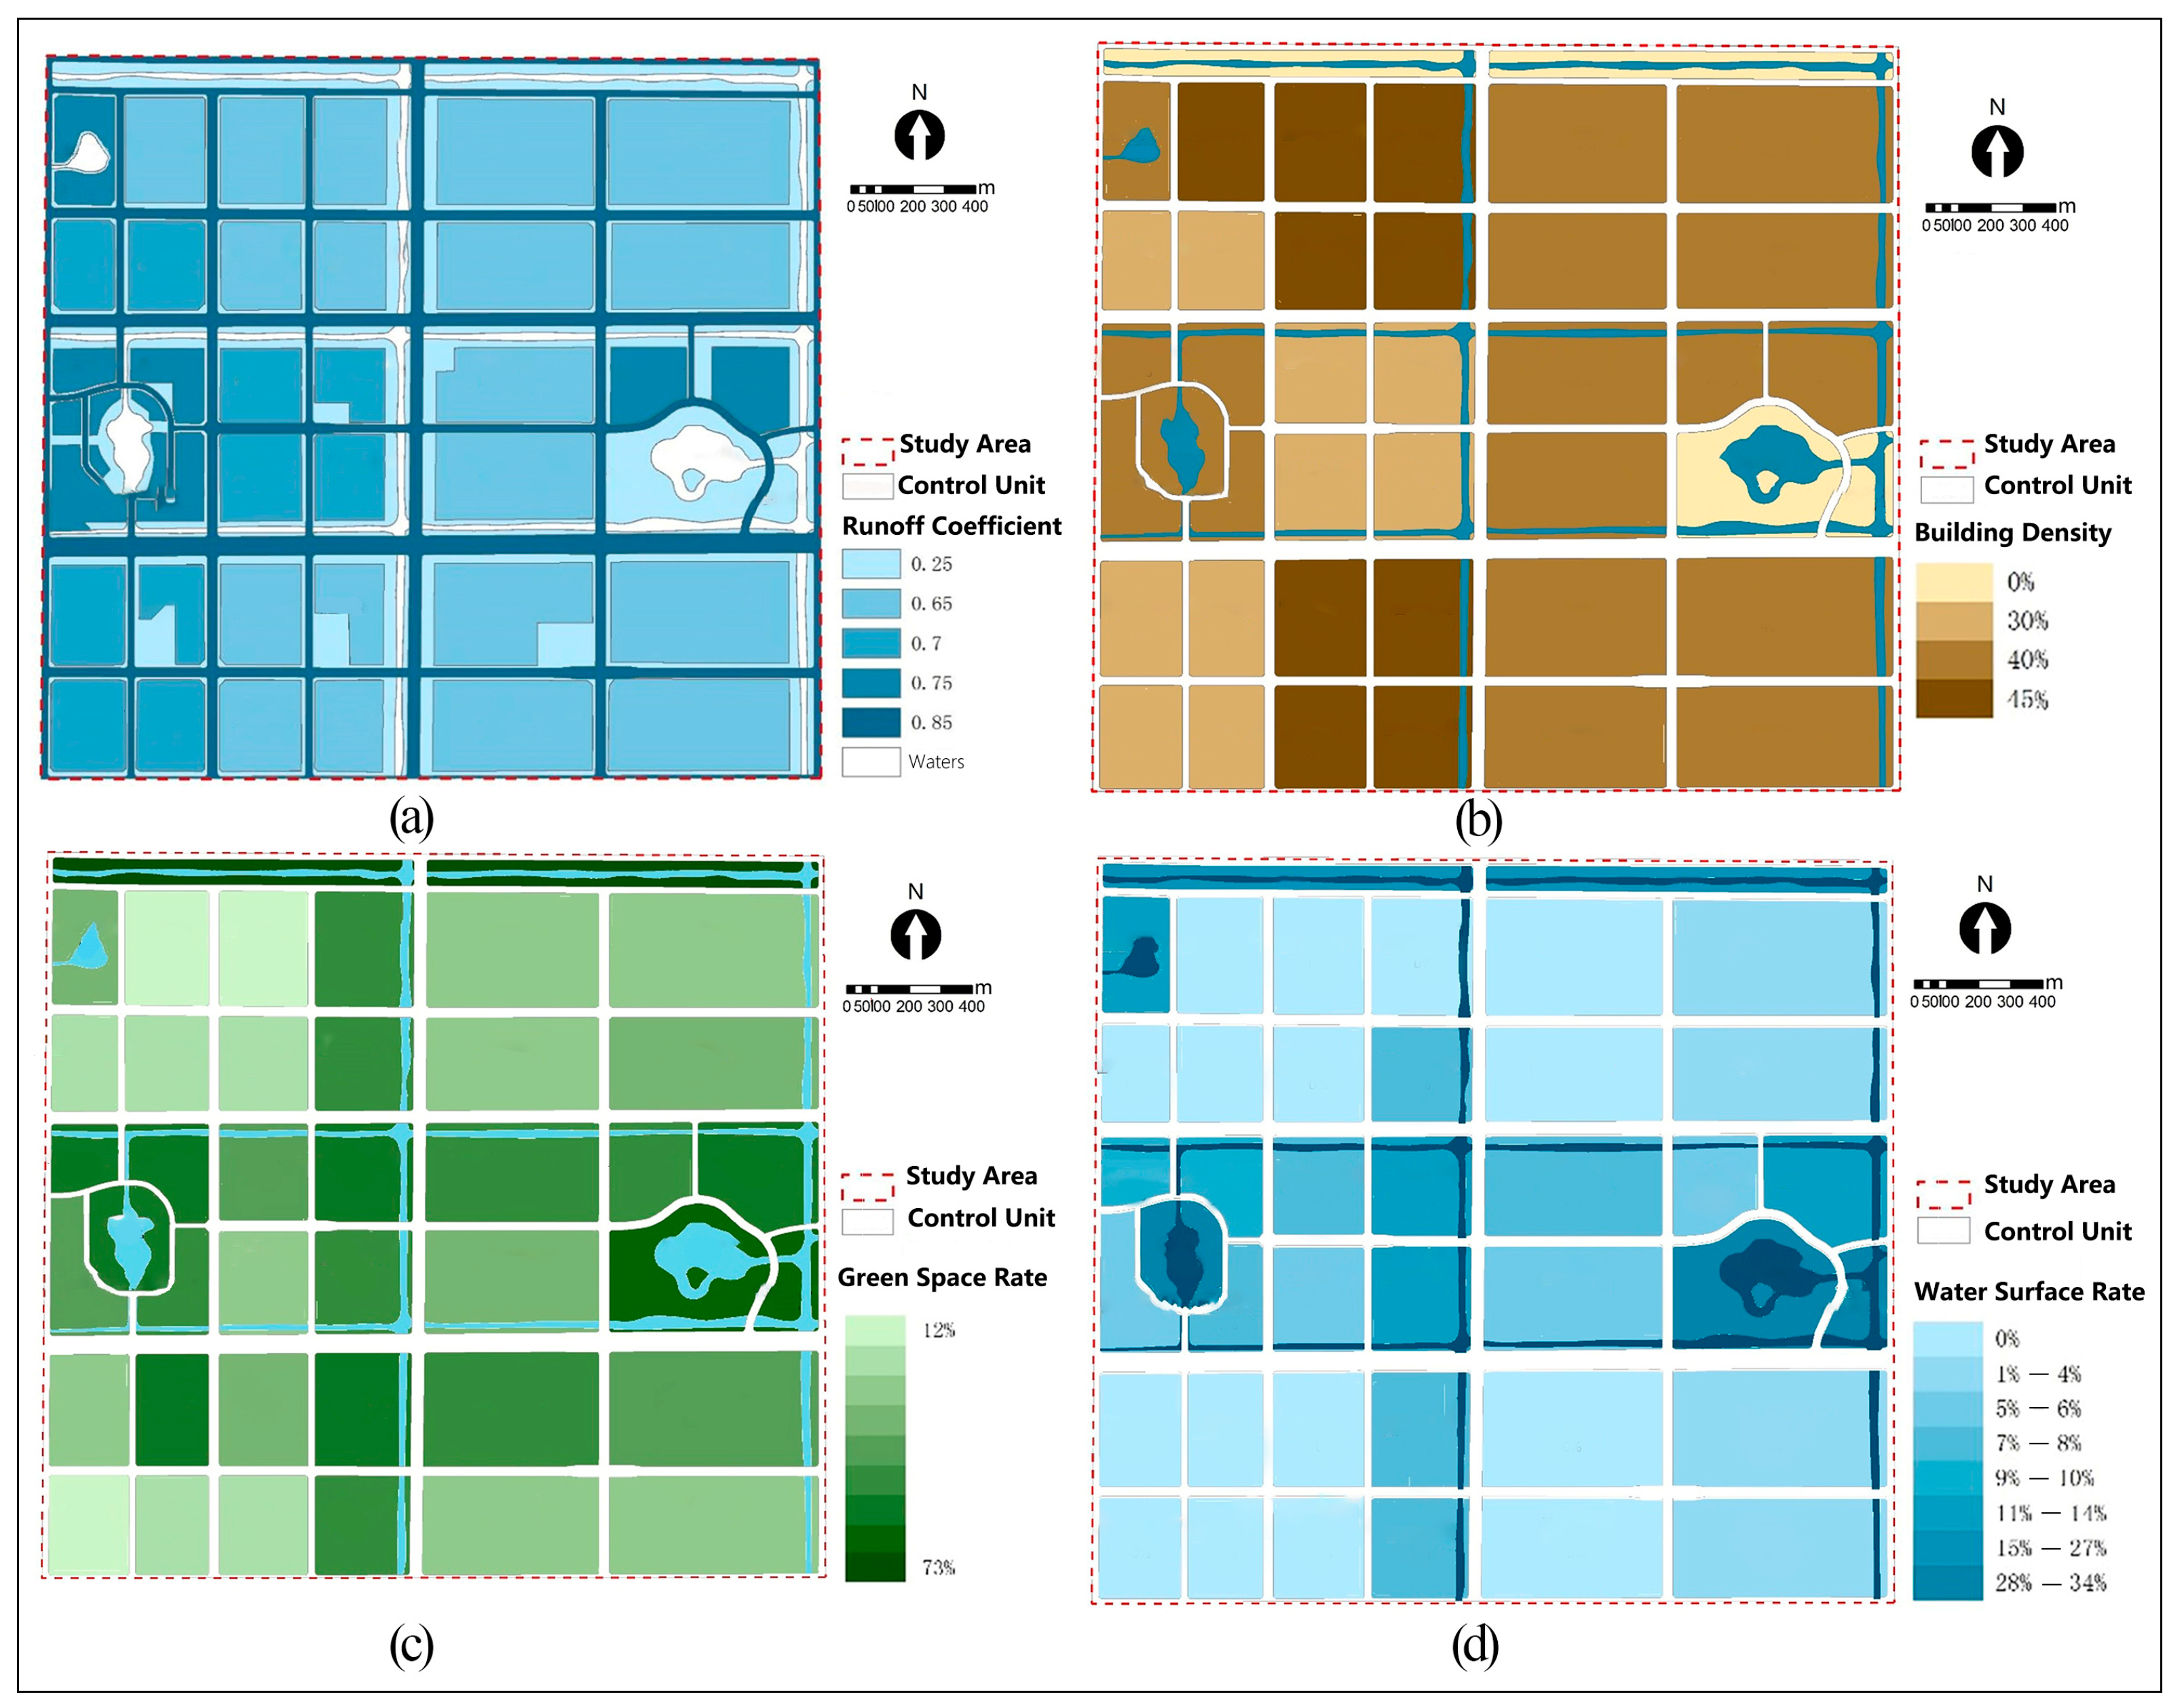
- The nature of the site: Different site properties and the composition of the subsurface determine the amount of surface flow but also reflect the urgency of the site to undergo runoff treatment. The greater the surface runoff, the greater the amount of rainwater to be treated, and the greater the demand for low-impact development facilities, the greater the regional distribution of runoff control rate and storage volume, also corresponding to more treatment. According to the satellite remote sensing of the study area and land use planning maps of the various types of land subsurface analyses, combined with the “Outdoor Drainage Design Code” for the different ground runoff coefficients in the table, an analysis of the study area in terms of the planning and the integrated runoff coefficients for various land types was conducted (Figure 5a).
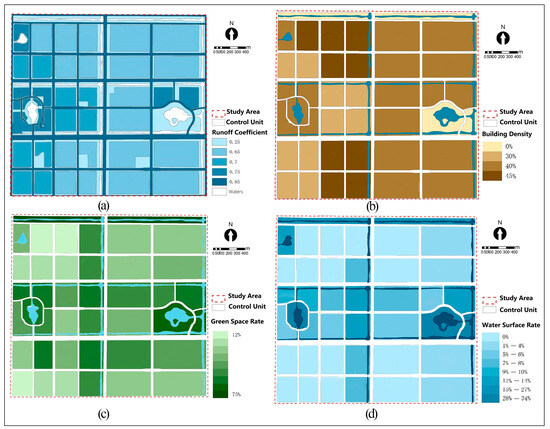 Figure 5. Results of the impact factor evaluation for the scale decomposition of low-impact development in the control unit of the study area, representing the (a) runoff coefficient, (b) building density, (c) green space rate and (d) water surface rate, respectively.
 - ii.
- Building density: Building density refers to the proportion (%) of the total basal area of all buildings occupying the land area within a certain plot. The building density, floor area ratio and green space rate determine the development intensity of a parcel in terms of the low-impact development of urban construction. The higher the building density, the higher the amount of low-impact development of urban runoff control faced by the parcel. Based on the building density regulations for each site in the Dafeng Hi-tech Zone Start-up Area Detailed Control Plan, we determined the building density distribution at each site (Figure 5b). As the architectural plan is not available for some of the parcels, some of the building densities were calculated using the maximum value of the control plan. According to the provisions of the control regulations, the building density requirement for residential land is ≤30%, the building density control requirement for public facility land is 40%, the building density control requirement for Class I industrial land is 45% and the building density control requirement for Class II industrial land is 40%.
- iii.
- Water surface rate: The water surface rate refers to the ratio between the water surface area and the total area of the land parcel in the region. The water surface rate is a direct response to the plot under the surface of the rainwater storage capacity. The more developed the water system, the higher the water surface rate is, and the plot can accept a design with more storage volume. On the other hand, from the point of view of the appropriateness of low-impact development of urban construction, the higher the water surface rate of the plot plan, the more conducive to the design and arrangement of storage sponge water bodies, and the more suitable they are for the construction of low-impact development facilities. We determined the distribution of the water surface rate for each site according to the water system plan in the Control Detailed Plan for the Start-up Area of Dafeng High-Tech Zone (Figure 5c). The highest water surface rate at the site was for control units 18 and 20, with water surface rates of 34% and 31%, respectively.
- iv.
- Green space rate: The green space ratio is the ratio of the green space area at a site to the total area of the regional parcel. For the low-impact development of urban construction, a higher proportion of green space in the plot is more favourable for the design and layout of a low-impact development system, and it can also facilitate the role of the green urban stormwater infrastructure medium. Based on the “Dafeng City High-tech Zone Start-up Area Control Detailed Planning” in the study area, compared to the green area proportion of the control, the green area ratio of each plot is shown in Figure 5d. Control unit-16, control unit-18, control unit-10 and control unit-8 have the highest green area ratios, which are, respectively, 66%, 66%, 45% and 41%.
- Grading and Weighting
In order to assess the appropriateness of the construction of low-impact development systems in the control unit, we need to consider the necessity and appropriateness of the construction of each specific low-impact development system in the study area. Through expert scoring and comparative analysis, we assigned values to the relevant impact elements in the study area (Table 3) and rated them according to a scale of 1–5, where 5 indicates the most necessary and the most appropriate construction, and so on (Table 4). Finally, a weighted overlay was created based on the weights of each impact element to derive the score for the necessity and implementability of low-impact development and construction for each control unit.
Table 3.
Necessity and suitability weights for decomposing the design scale of sponge cities in the study area.
Table 4.
Study area sponge city scale decomposition impact factor weights.
By applying the ArcGIS spatial overlay and reclassification method, we assigned values and rasterized each influence element. A weighted overlay analysis was performed according to Table 4 to obtain a final grading map of the construction necessity and adaptability of the control unit (Figure 6). This grading map serves as the basis for the scale decomposition of the low-impact development system of the control unit and provides a reference for rationally determining the design volume and the annual runoff control rate of the control unit at all levels.
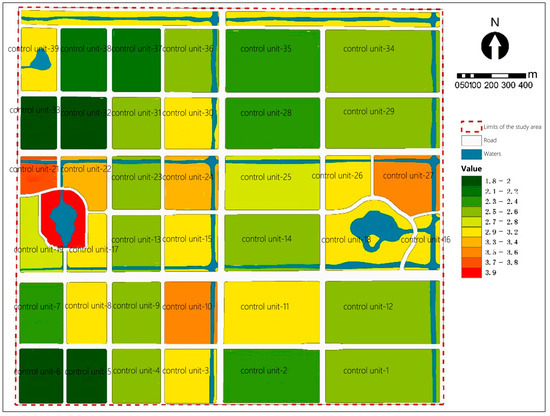
Figure 6.
Scoring the necessity and adaptability of sponge cities in the control units of the study area.
3. Results
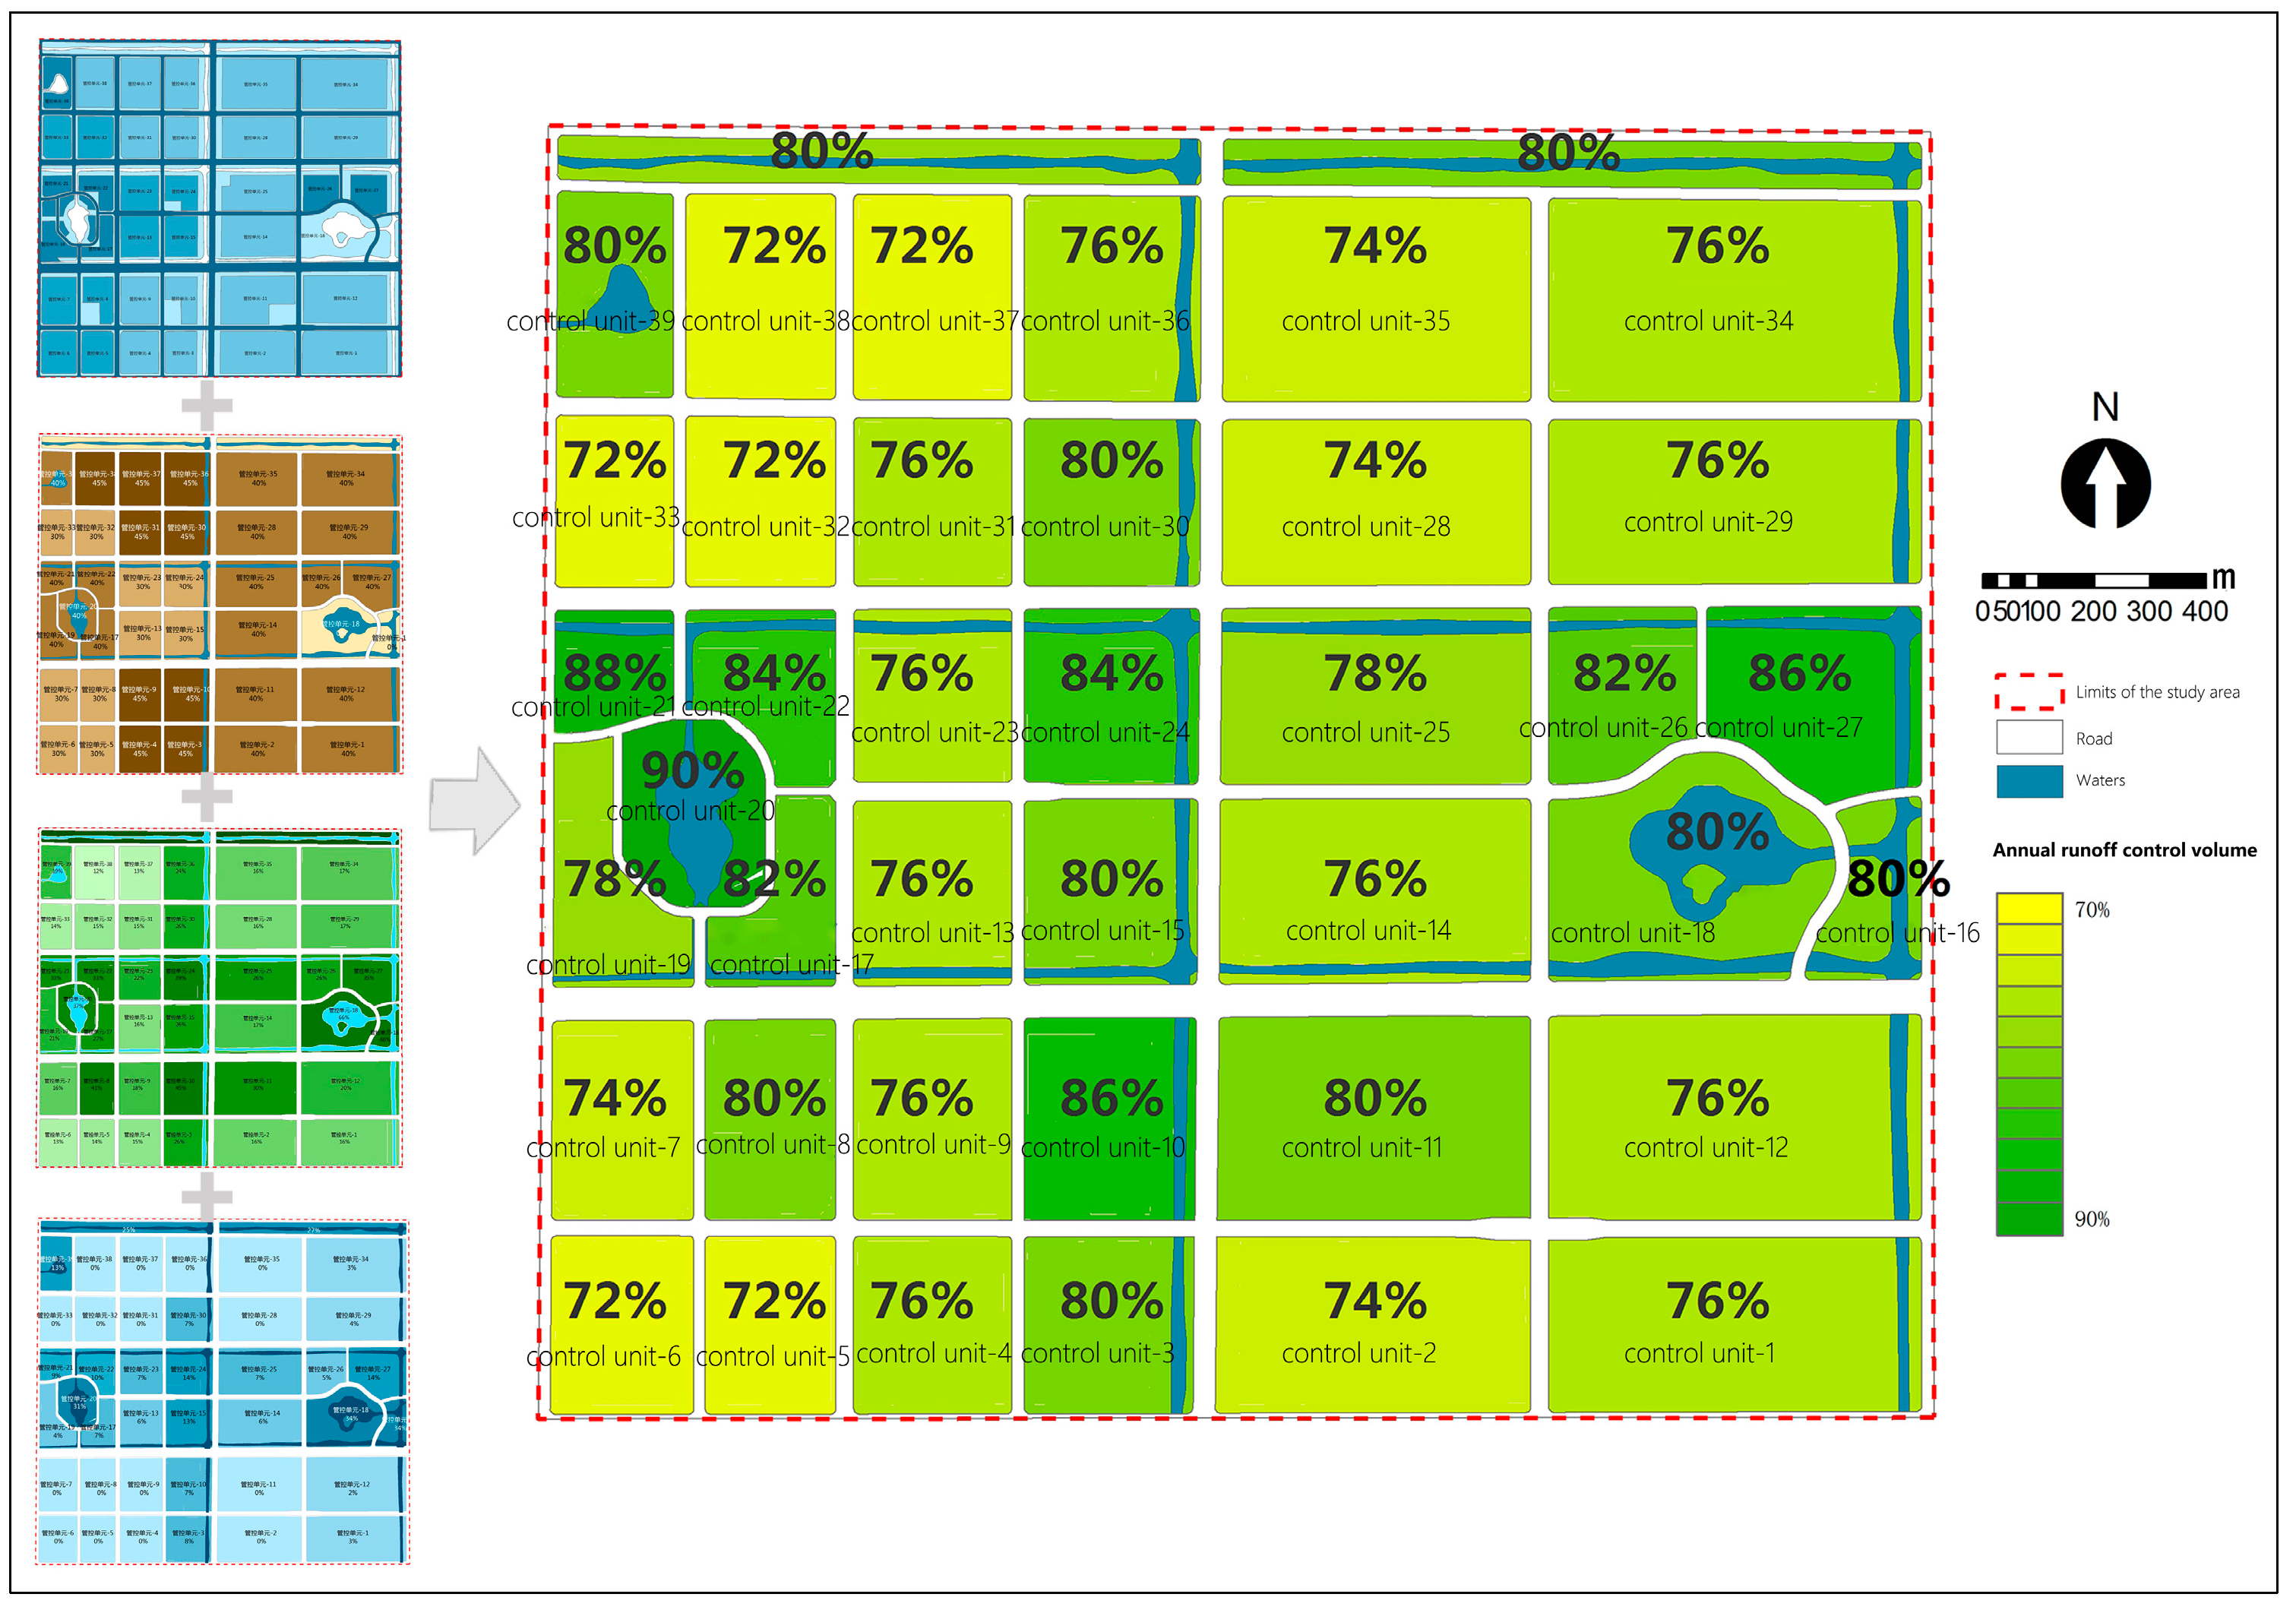
Based on comprehensive consideration of the factors of construction necessity and suitability, we decomposed the indicators of annual runoff control rate and design storage volume according to the distribution of the assignment range for each control unit. Considering the climate zoning of the study area, the total annual runoff control rate requirement ranges from 70% to 85%. We used a total annual runoff control rate of 80% as the baseline value and adjusted it according to the weighted superposition scores of each control unit (Table 5), with an adjustment range of ±10%, to obtain the decomposition results of the annual runoff control of each control unit, as shown in Figure 7.
Table 5.
Annual runoff control rate adjustment range of the study area.
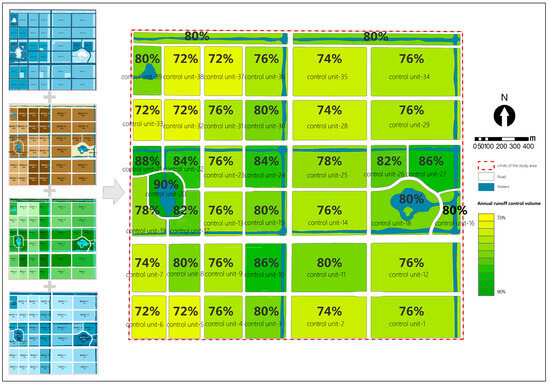
Figure 7.
Results of the decomposition of the annual runoff control for each control unit in the study area.
After the total annual runoff control rate and design storage volume targets were broken down for each control unit, we calibrated the design total control rate for each control unit through weighted calculations. After calibration, the total annual runoff control rate target for each control unit in the study area was 81.5%. The relevant result meets the target requirement of Dafeng District regarding the total annual runoff control rate, and the scale decomposition target of each control unit was met.
From calculations, the total design storage size of the low-impact development system in the Dafeng Hi-tech Development Zone ranges from 71,117 to 127,418 m3. In this study, the total design size was disaggregated using a multifactor spatial superposition approach by considering four influencing factors, namely the nature of the site’s land use, the density of buildings, the water surface rate, and the green space rate. The results of the study show that the total annual runoff control rate is the highest in control unit-20, control unit-21, control unit-10 and control unit-27, reaching 90%, 88%, 88%and 86%, respectively. In terms of the design storage volume index, control unit-27, control unit-24 and control unit-34 bear the largest storage scales, which are 5638.82 m3, 4968.10 m3 and 3878.09 m3, respectively.
Based on the results of the scale calculation and disaggregation, it is possible to take into account the hydrological performance of the parcel features, the water–green coupling and the economic costs in the planning and design of the subsequent low-impact development system.
4. Discussion
4.1. Application of Storage Scale Assessment in Sponge City Planning and Design
The appropriate storage scale for a sponge system is one that allows for the effective planning and design of the infrastructure required to solve an important problem. A sponge city design storage scale that is too small will not allow for the full utilisation of the facilities designed to facilitate seepage, stagnation, storage and other sustainable functions. This will result in a failure to meet the requirements of sponge city construction. Conversely, a scale that is too large will reduce the efficiency of the sponge facilities while increasing the cost of the facilities. Consequently, this paper is primarily based on the three principles of sponge city indicator control: balanced and efficient, economic, and reasonable. It explores the decomposition process and methods of sponge city planning and design scale. The concept of scale decomposition entails the division of the total sponge system size and objectives into a number of subscale objectives with the objective of achieving more precise metrics, improved layout and enhanced implementation control.
The formulation of sponge city planning and design objectives is a continuous process that occurs at all levels of urban planning and design, from general planning and detailed planning to site design and implementation. From general planning to site design and implementation, the determination of the design scale of the sponge system must be gradually broken down from the scale of the city’s general planning to the scale of each city subdistrict and site. The design scale of the sponge system must also be determined at the scale of the city’s master plan, which is then divided into various city subdistricts with parcel-level implementation.
Storage scale assessments can be applied at three different stages in sponge city planning and design:
4.1.1. Urban Master Planning
At the stage of urban master planning, based on the climate and hydrological conditions of the city, sponge system planning must determine the overall scale of the facility and specify the annual runoff control rate, corresponding design rainfall and runoff control volume based on climate zoning.
4.1.2. Detailed Urban Control Planning
At the stage of detailed urban control planning, it is necessary to decompose the runoff control volume target determined in the urban master plan into each land use control unit of the control plan. This should be carried out hierarchically, based on constraints such as area, the composition of the subsurface, the nature of the land use, construction attributes, and the distribution of green space.
4.1.3. Site Design
At the stage of site design, it is necessary to select and implement low-impact development technology measures in a clear and systematic manner. This involves determining the scale and proportion of each low-impact development technology facility based on the area and nature of the site. The objective is to achieve the rainwater control target of a sponge system in the upper plan.
4.2. Comparison of Storage Scale Assessment Methods
Existing methods for the scale calculation of low-impact development systems include analytical hierarchy processes (AHPs) [23,24] and models combining algorithm optimisation [22,35,36]. AHPs quantify the benefits of different LID unit combinations by constructing a judgement matrix and comparing the importance coefficients of each factor. Common models include the Storm Water Management Model (SWMM) and the genetic algorithm NSGA-II. In comparison, these are significantly different from the overlay method in terms of the calculation methods and results (Table 6).
Table 6.
Comparison of different scale calculation methods.
It can be seen that the overlay method can effectively deal with unit attribute data through the overlay analysis function of GIS, which is easy to calculate and has good visible effect. However, the overlay method still has some limitations. The current design of the overlay method can not directly derive the combination of facilities, and the element values used for the overlay lack of precision. Future research could focus on the combination of modelling and overlay method to obtain more accurate rainfall and runoff, so as to better calculate the scale of sponge city.
5. Conclusions
In summary, this study validates a method and process of calculating and decomposing the scale of low-impact development facilities in the plains river network area, using the Dafeng Hi-Tech Development Zone as an example. The study presents a summary of the derivation of the total annual runoff control rate and its design rainfall, as well as the calculation method for the total annual runoff storage volume. In the scale decomposition of low-impact development facilities, a multifactor spatial overlay approach was adopted to assist in the scale decomposition process with the help of ArcGIS digital overlay technology. Future studies can further subdivide the weight allocation of the impact factors and combine digital technologies such as hydrological modelling and intelligent algorithms in order to improve the accuracy of the scale calculation of low-impact development facilities.
In future planning and design applications, assessment-based low-impact development scale calculations can be employed to more accurately control the scale of low-impact development facilities at different scales. These calculations can be used as a site design control condition to directly influence the layout of sponge facilities. Furthermore, based on a combination of different algorithms and models, the intelligent layout of sponge facilities can be well realised. Concurrently, the scale assessment data can be employed as design data to assess and evaluate the performance of sponge facilities following their design.
Author Contributions
Conceptualization, M.X. and Y.C.; methodology, M.X.; software, M.X.; validation, D.H.; formal analysis, M.X.; investigation, M.X.; resources, Y.C.; data curation, M.X.; writing—original draft preparation, M.X.; writing—review and editing, D.H.; visualisation, M.X.; supervision, Z.D.; project administration, Y.C.; funding acquisition, Y.C. All authors have read and agreed to the published version of the manuscript.
Funding
This research was funded by the National Natural Science Foundation of China, grant number 51838003.
Data Availability Statement
Data are available in a publicly accessible repository that is not issued here. Publicly available datasets were analysed in this study. These data can be found at [https://data.cma.cn, accessed on 1 January 2021, https://earth.google.com, accessed on 1 January 2021].
Conflicts of Interest
The authors declare no conflicts of interest.
References
- Ayda, B.A.; Goshime, D.W.; Finsa, M.M.; Ayalew, A.T. Urban Stormwater Management under Various Runoff Conditions for Arba Minch Town of Southern Ethiopia. Nat. Hazard. Res. 2024, 14, 9813. [Google Scholar] [CrossRef]
- Hou, J.; Mao, H.; Li, J.; Sun, S. Spatial Simulation of the Ecological Processes of Stormwater for Sponge Cities. J. Environ. Manag. 2019, 232, 574–583. [Google Scholar] [CrossRef] [PubMed]
- Yin, D.; Chen, Y.; Jia, H.; Wang, Q.; Chen, Z.; Xu, C.; Li, Q.; Wang, W.; Yang, Y.; Fu, G.; et al. Sponge City Practice in China: A Review of Construction, Assessment, Operational and Maintenance. J. Clean. Prod. 2021, 280, 124963. [Google Scholar] [CrossRef]
- Chen, H.; Chang, X.Y.; She, N. An Overview of Methods of Calculating Storage Volume for Low Impact Development and Other Stormwater Facilities. IOP Conf. Ser. Earth Environ. Sci. 2019, 344, 012145. [Google Scholar] [CrossRef]
- Chan, F.K.S.; Griffiths, J.A.; Higgitt, D.; Xu, S.; Zhu, F.; Tang, Y.-T.; Xu, Y.; Thorne, C.R. “Sponge City” in China—A Breakthrough of Planning and Flood Risk Management in the Urban Context. Land Use Policy 2018, 76, 772–778. [Google Scholar] [CrossRef]
- Eckart, K.; McPhee, Z.; Bolisetti, T. Performance and Implementation of Low Impact Development—A Review. Sci. Total Environ. 2017, 607, 413–432. [Google Scholar] [CrossRef] [PubMed]
- Suresh, A.; Pekkat, S.; Subbiah, S. Quantifying the Efficacy of Low Impact Developments (LIDs) for Flood Reduction in Micro-Urban Watersheds Incorporating Climate Change. Sustain. Cities Soc. 2023, 95, 104601. [Google Scholar] [CrossRef]
- Chen, J.; Liu, Y.; Gitau, M.W.; Engel, B.A.; Flanagan, D.C.; Harbor, J.M. Evaluation of the Effectiveness of Green Infrastructure on Hydrology and Water Quality in a Combined Sewer Overflow Community. Sci. Total Environ. 2019, 665, 69–79. [Google Scholar] [CrossRef] [PubMed]
- Yang, W.; Brüggemann, K.; Seguya, K.D.; Ahmed, E.; Kaeseberg, T.; Dai, H.; Hua, P.; Zhang, J.; Krebs, P. Measuring Performance of Low Impact Development Practices for the Surface Runoff Management. Environ. Sci. Ecotechnol. 2020, 1, 100010. [Google Scholar] [CrossRef]
- Hu, M.; Zhang, X.; Li, Y.; Yang, H.; Tanaka, K. Flood Mitigation Performance of Low Impact Development Technologies under Different Storms for Retrofitting an Urbanized Area. J. Clean. Prod. 2019, 222, 373–380. [Google Scholar] [CrossRef]
- Ma, X.; Liang, Z.; Li, J.; Fu, C.; Song, W.; Du, X.; Zhou, Y.; Liu, F. Gravity Driven Membrane Bioreactor Simulates the Effect of Permeable Brick on Pollution Reduction of Rainwater Runoff in Low Impact Development (LID). J. Water Process Eng. 2024, 58, 104881. [Google Scholar] [CrossRef]
- Guo, X.; Guo, Q.; Zhou, Z.; Du, P.; Zhao, D. Degrees of Hydrologic Restoration by Low Impact Development Practices under Different Runoff Volume Capture Goals. J. Hydrol. 2019, 578, 124069. [Google Scholar] [CrossRef]
- Ben-Daoud, A.; Ben-Daoud, M.; Moroșanu, G.A.; M’Rabet, S. The Use of Low Impact Development Technologies in the Attenuation of Flood Flows in an Urban Area: Settat City (Morocco) as a Case. Environ. Chall. 2022, 6, 100403. [Google Scholar] [CrossRef]
- Qiao, X.-J. Maintenance of Low Impact Development Facilities: A Case Study of Pilot Sponge Cities in China. J. Clean. Prod. 2023, 425, 139008. [Google Scholar] [CrossRef]
- Macro, K.; Matott, L.S.; Rabideau, A.; Ghodsi, S.H.; Zhu, Z. OSTRICH-SWMM: A New Multi-Objective Optimization Tool for Green Infrastructure Planning with SWMM. Environ. Model. Softw. 2019, 113, 42–47. [Google Scholar] [CrossRef]
- Yang, B.; Zhang, T.; Li, J.; Feng, P.; Miao, Y. Optimal Designs of LID Based on LID Experiments and SWMM for a Small-Scale Community in Tianjin, North China. J. Environ. Manag. 2023, 334, 117442. [Google Scholar] [CrossRef]
- Duarte Lopes, M.; Barbosa Lima Da Silva, G. An Efficient Simulation-Optimization Approach Based on Genetic Algorithms and Hydrologic Modeling to Assist in Identifying Optimal Low Impact Development Designs. Landsc. Urban Plan. 2021, 216, 104251. [Google Scholar] [CrossRef]
- Zhang, B.; Li, J.; Li, Y. Study on Urban Storm Water and Non-Point Source Simulation under Different Development Patterns. Environ. Sci. Technol. 2017, 40, 87–95. [Google Scholar]
- Nguyen, T.T.; Ngo, H.H.; Guo, W.; Wang, X.C.; Ren, N.; Li, G.; Ding, J.; Liang, H. Implementation of a Specific Urban Water Management—Sponge City. Sci. Total Environ. 2019, 652, 147–162. [Google Scholar] [CrossRef]
- Kaykhosravi, S.; Khan, U.T.; Jadidi, A. A Comprehensive Review of Low Impact Development Models for Research, Conceptual, Preliminary and Detailed Design Applications. Water 2018, 10, 1541. [Google Scholar] [CrossRef]
- Idros, N.; Sidek, L.M.; Rahim, N.A.A.M.; Noh, N.M.; Abdelkader, A.M.; Mohiyaden, H.A.; Basri, H.; Zawawi, M.H.B.; Ahmed, A.N. Stormwater Characterisation and Modelling for Sungai Air Hitam in Selangor, Malaysia Using Model for Urban Stormwater Improvement Conceptualisation (Music). Ecol. Indic. 2024, 160, 111850. [Google Scholar] [CrossRef]
- Chen, Y.; Samuelson, H.W.; Tong, Z. Integrated Design Workflow and a New Tool for Urban Rainwater Management. J. Environ. Manag. 2016, 180, 45–51. [Google Scholar] [CrossRef]
- She, L.; Wei, M.; You, X. Multi-Objective Layout Optimization for Sponge City by Annealing Algorithm and Its Environmental Benefits Analysis. Sustain. Cities Soc. 2021, 66, 102706. [Google Scholar] [CrossRef]
- Cheng, H.; Kim, S.; Hyun, J.H.; Choi, J.; Cho, Y.; Park, C. A Multi-Objective Spatial Optimization of Wetland for Sponge City in the Plain, China. Ecol. Eng. 2024, 198, 107147. [Google Scholar] [CrossRef]
- Li, Q.; Wang, F.; Yu, Y.; Huang, Z.; Li, M.; Guan, Y. Comprehensive Performance Evaluation of LID Practices for the Sponge City Construction: A Case Study in Guangxi, China. J. Environ. Manag. 2019, 231, 10–20. [Google Scholar] [CrossRef]
- Liang, C.; Zhang, X.; Xu, J.; Pan, G.; Wang, Y. An Integrated Framework to Select Resilient and Sustainable Sponge City Design Schemes for Robust Decision Making. Ecol. Indic. 2020, 119, 106810. [Google Scholar] [CrossRef]
- Randall, M.; Sun, F.; Zhang, Y.; Jensen, M.B. Evaluating Sponge City Volume Capture Ratio at the Catchment Scale Using SWMM. J. Environ. Manag. 2019, 246, 745–757. [Google Scholar] [CrossRef]
- Xia, J.; Zhang, Y.; Xiong, L.; He, S.; Wang, L.; Yu, Z. Opportunities and Challenges of the Sponge City Construction Related to Urban Water Issues in China. Sci. China-Earth Sci. 2017, 60, 652–658. [Google Scholar] [CrossRef]
- Eliot, C.W. Charles Eliot, Landscape Architect; Reprint edition; University of Massachusetts Press: Amherst, MA, USA, 1999; ISBN 978-1-55849-212-7. [Google Scholar]
- Guo, Q.; Liu, M. Dynamic Assessment of Eco-Civilization in Guangdong Province Based on Geographic Information System (GIS) and Analytic Hierarchy Process (AHP). Heliyon 2023, 9, e22579. [Google Scholar] [CrossRef]
- Sing, N.M.M.N.; Halim, M.A.; Hashim, N.I.; Hashim, N.; Naharudin, N.; Rasam, A.R.A. Identification of Groundwater Potential Zones in Langkawi through Remote Sensing and Geographic Information System (GIS) Techniques. In Proceedings of the 2020 IEEE 10th International Conference on System Engineering and Technology (ICSET), Shah Alam, Malaysia, 9 November 2020; pp. 26–31. [Google Scholar]
- Barakat, A.; Ouargaf, Z.; Touhami, F. Identification of Potential Areas Hosting Aggregate Resources Using GIS Method: A Case Study of Tadla-Azilal Region, Morocco. Environ. Earth Sci. 2016, 75, 774. [Google Scholar] [CrossRef]
- Zumara, R.; Nasher, N.M.R. Soil Erodibility Mapping of Hilly Watershed Using Analytical Hierarchy Process and Geographical Information System: A Case of Chittagong Hill Tract, Bangladesh. Heliyon 2024, 10, e26728. [Google Scholar] [CrossRef] [PubMed]
- Zhang, X.; Jia, H. Low Impact Development Planning through a Comprehensive Optimization Framework: Current Gaps and Future Perspectives. Resour. Conserv. Recycl. 2023, 190, 106861. [Google Scholar] [CrossRef]
- Wan, S.; Xu, L.; Qi, Q.; Yang, H.; Zhou, Y. Building a Multi-Objective Optimization Model for Sponge City Projects. Urban Clim. 2022, 43, 101171. [Google Scholar] [CrossRef]
- Gao, J.; Li, J.; Ji, J.; Liu, K.; Jiang, C. Multi-Objective Optimization of Sponge Facility Layout in Built-up Urban Areas. Ecohydrol. Hydrobiol. 2024, 24, 11–24. [Google Scholar] [CrossRef]


Disclaimer/Publisher’s Note: The statements, opinions and data contained in all publications are solely those of the individual author(s) and contributor(s) and not of MDPI and/or the editor(s). MDPI and/or the editor(s) disclaim responsibility for any injury to people or property resulting from any ideas, methods, instructions or products referred to in the content. |
© 2024 by the authors. Licensee MDPI, Basel, Switzerland. This article is an open access article distributed under the terms and conditions of the Creative Commons Attribution (CC BY) license (https://creativecommons.org/licenses/by/4.0/).