Article

Assessing the Impacts of Mulching-Induced Warming Effects on Machine-Picked Cotton Zones

1
Key Laboratory of Oasis Eco-Agriculture, Xinjiang Production and Construction Corps, College of Agriculture, Shihezi University, Shihezi 832003, China
2
The 7th Division Agricultural Science Research Institute, Huyanghe 834032, China
3
College of Agriculture, Shihezi University, Shihezi 832003, China
4
Wulanwusu Agro-Meteorological Station, Shawan 832100, China
*
Author to whom correspondence should be addressed.
Atmosphere 2024, 15(6), 619; https://doi.org/10.3390/atmos15060619
Submission received: 27 March 2024 / Revised: 10 May 2024 / Accepted: 17 May 2024 / Published: 21 May 2024
(This article belongs to the Section Biometeorology)

Abstract

:
The 20th century saw notable fluctuations in global temperatures, which significantly impacted agricultural climate zones across the Earth. Focusing on Xinjiang, China, a leading region in machine-picked cotton production, we identified several key thermal indicators influencing the yield, including the sum of active temperatures ≥ 10 °C, the mean temperature in July, the climatological growing season length, the April–May sum of active temperatures, the last frost day, and the defoliant spray time. Using meteorological data from 58 weather stations in Xinjiang, we examined the spatiotemporal trends of these indicators during the 1981–2020 period. Additionally, we attempted to determine the effects of plastic mulching on the sowing area and the zoning area of machine-picked cotton in different suitable zones based on these indicators. In conclusion, the overall thermal resources in Xinjiang are exhibiting an upward trend and show a distribution pattern of “more in the south of Xinjiang than in the north of Xinjiang, and more in the plains and basins than in the mountains”. Under the plastic-mulching mechanism, the zoning area of the suitable zone has increased by 15.7% (2.15 × 10³ km2), suggesting that climate warming and the widespread application of mulching technology provide unexplored potential for the most suitable regions for machine-picked cotton in Xinjiang, while the 14.5% (0.26 × 10³ km2) and 7.8% (0.17 × 10³ km2) reductions in the unsuitable and less suitable zones, respectively, suggest that the planting areas of machine-picked cotton in both the less suitable and unsuitable zones, particularly with the existing regional planning, continue to demonstrate an irrational expansion. Therefore, to sustain Xinjiang’s cotton industry’s resilience and productivity, policymakers need to prioritize proactive land management and sustainable land allocation practices in response to changing climate patterns to optimize cotton production.

1. Introduction

The Sixth Assessment Report by the Intergovernmental Panel on Climate Change (IPCC) highlighted that according to the “Climate Change 2023” report released by the IPCC, the global average temperature has risen by 1.11 ± 0.13 °C compared to the pre-industrial period (1850–1900). Although the La Niña event in 2021 brought temporary cooling, the trend in climate warming remains unaltered [1]. Even though a growing average temperature is a globally observed phenomenon, distinct geographical features can cause varying intensities in local temperature change trends [1,2,3]. This is particularly crucial for the agricultural sector to bear in mind during strategic planning [4,5].
Heat accumulation fuels crop growth and development, yield potential, water absorption, and resilience to stress [6,7]. In light of the substantial challenges that global climatic shifts pose to agriculture, many studies have highlighted alterations in crop production potential [8,9,10,11], shifts in phenology [12], and transitions in suitable crop zones [13]. The most common climate indices used to assess these changes are typically the sums of active temperatures during key crop-development stages. Additionally, for crop sensitivity to low temperatures, the occurrence of frost and the length of frost-free periods (i.e., growing season length) are important climate indicators that affect agricultural production. Comprehensive data related to the temporal and spatial distributions of these climate indices are vital in the study of the impact of climate change on agricultural production.
The in-depth examination of these agricultural climate indicators assists in addressing critical questions such as the following: (i) Will climate warming lead to the uneven distribution of heat during cotton plants’ growing period, thereby impacting cotton plants’ growth and development? (ii) Will climate warming delay or advance frost dates, resulting in changes in the actual growing season for cotton plants? (iii) What spatiotemporal patterns will climate indicators take on in the context of climate warming, and what implications could they bear for the currently suitable cotton regions? (iv) How can we develop strategies to mitigate the impacts of climate change by considering the climatic suitability zones for cotton production?
Studies have found that climate warming is responsible for the northward migration of agricultural climate zones in China, the prolongation of growing seasons, and the expansion of areas conducive to thermophilic crops [14,15]. Nonetheless, notable regional disparities exist in the effects of climate change and their impacts on agriculture [16]. Some studies suggest that the sum of active temperatures ≥ 10 °C, the mean temperature of the warmest month (July), and the frost-free period are the main meteorological indicators influencing cotton plants’ growth and development. In recent decades, Xinjiang has witnessed a clear upward trend in the annual average temperature and the mean temperature of the hottest month (July), along with a substantial increase in the sum of active temperatures ≥0 °C and a marked prolongation of the frost-free period [17,18,19]. Based on these indicators, Xinjiang’s cotton plants’ growing region has been further divided into suitable cotton areas, less suitable cotton areas, and risky cotton areas [20,21,22]. Recent studies have shown that because it is influenced by changes in heat resources, the area of suitable cotton regions in Xinjiang has gradually increased, while the areas of less suitable and unsuitable cotton regions have decreased. At the same time, the areas of mid-mature and early–mid-mature cotton regions in Southern Xinjiang have been continuously expanding, while the areas of early-ripening and unsuitable cotton regions have decreased [23,24,25]. However, in actual production, due to the complexity of cotton varieties, there are cases of unreasonable selection regarding the maturity of varieties and the blind expansion of planting areas in some regions, which have a significant impact on the quality and yield of cotton [21,22,26]. Thus, investigating the repercussions of climate change on the adaptability of cotton cultivation holds substantial importance for the resolution of these issues.
The aforementioned studies provide a theoretical basis and scientific evidence for climate suitability zoning for cotton cultivation in Xinjiang; however, it is important to acknowledge the limitations of these studies, which are highlighted below:
(1)
Insufficient attention given to the climatic resource necessities of machine-harvested cotton: Xinjiang ranks highest in terms of the mechanization level of cotton cultivation (National Bureau of Statistics data in 2023: the mechanized harvesting rate of cotton in Xinjiang has exceeded 81%, accounting for over 80% of national total production). The aforementioned studies mainly divide the suitable areas for cotton cultivation based on factors such as the length of the growing season, the average July temperature, and the sum of active temperatures above a certain threshold; however, the specific climate resource requirements of machine-harvested cotton have not been adequately considered. It is necessary to develop targeted subsidiary indicators in order to divide the suitable regions for machine-harvested cotton cultivation in Xinjiang.
(2)
Deficit of quantitative research investigating the effects of mulching-induced warming on the suitability regions for varied-maturity cotton: According to statistics, as of 1994, 96.67% of the total sowing area in Xinjiang adopted mulching cultivation for cotton [27]. Mulching not only increases the soil temperature and moisture retention but also compensates for the temperature conditions required for cotton growth [27,28,29,30]. Both global climate warming and the use of mulching techniques in cotton cultivation can affect the heat conditions required for cotton plants’ growth, which may influence the planting regions for cotton; however, most of the current research focuses on the suitability zoning of Xinjiang cotton under the background of global warming [23,24,31].
In summary, it is necessary to address the limitations by conducting further research on the climate resource requirements of machine-harvested cotton and the quantitative effects of mulching-induced warming on the suitability zones for different-maturity cotton. This could lay the groundwork for a more in-depth and precise understanding of the climate suitability zoning of cotton cultivation in Xinjiang. Such research can assist agricultural planners in better adapting to climate change and formulating appropriate crop cultivation strategies.
Our work is unique and significant in the following aspects: (i) We utilized meteorological data from 57 observation stations in Xinjiang with an 80% assurance rate and applied ArcGIS meteorological interpolation software for small-scale grid interpolation. This resulted in more accurate and fine-grained interpolation results. (ii) We took into consideration the specific climate resource requirements of machine-harvested cotton and the effects of mulching on cotton plants’ growth. The incorporation of auxiliary meteorological indicators for machine-harvested cotton, while accounting for the compensating effects of mulching-induced warming, helped us delve into the characteristics of climate suitability zoning for machine-harvested cotton in Xinjiang with a more scientific approach.

2. Data Sources and Processing Methods

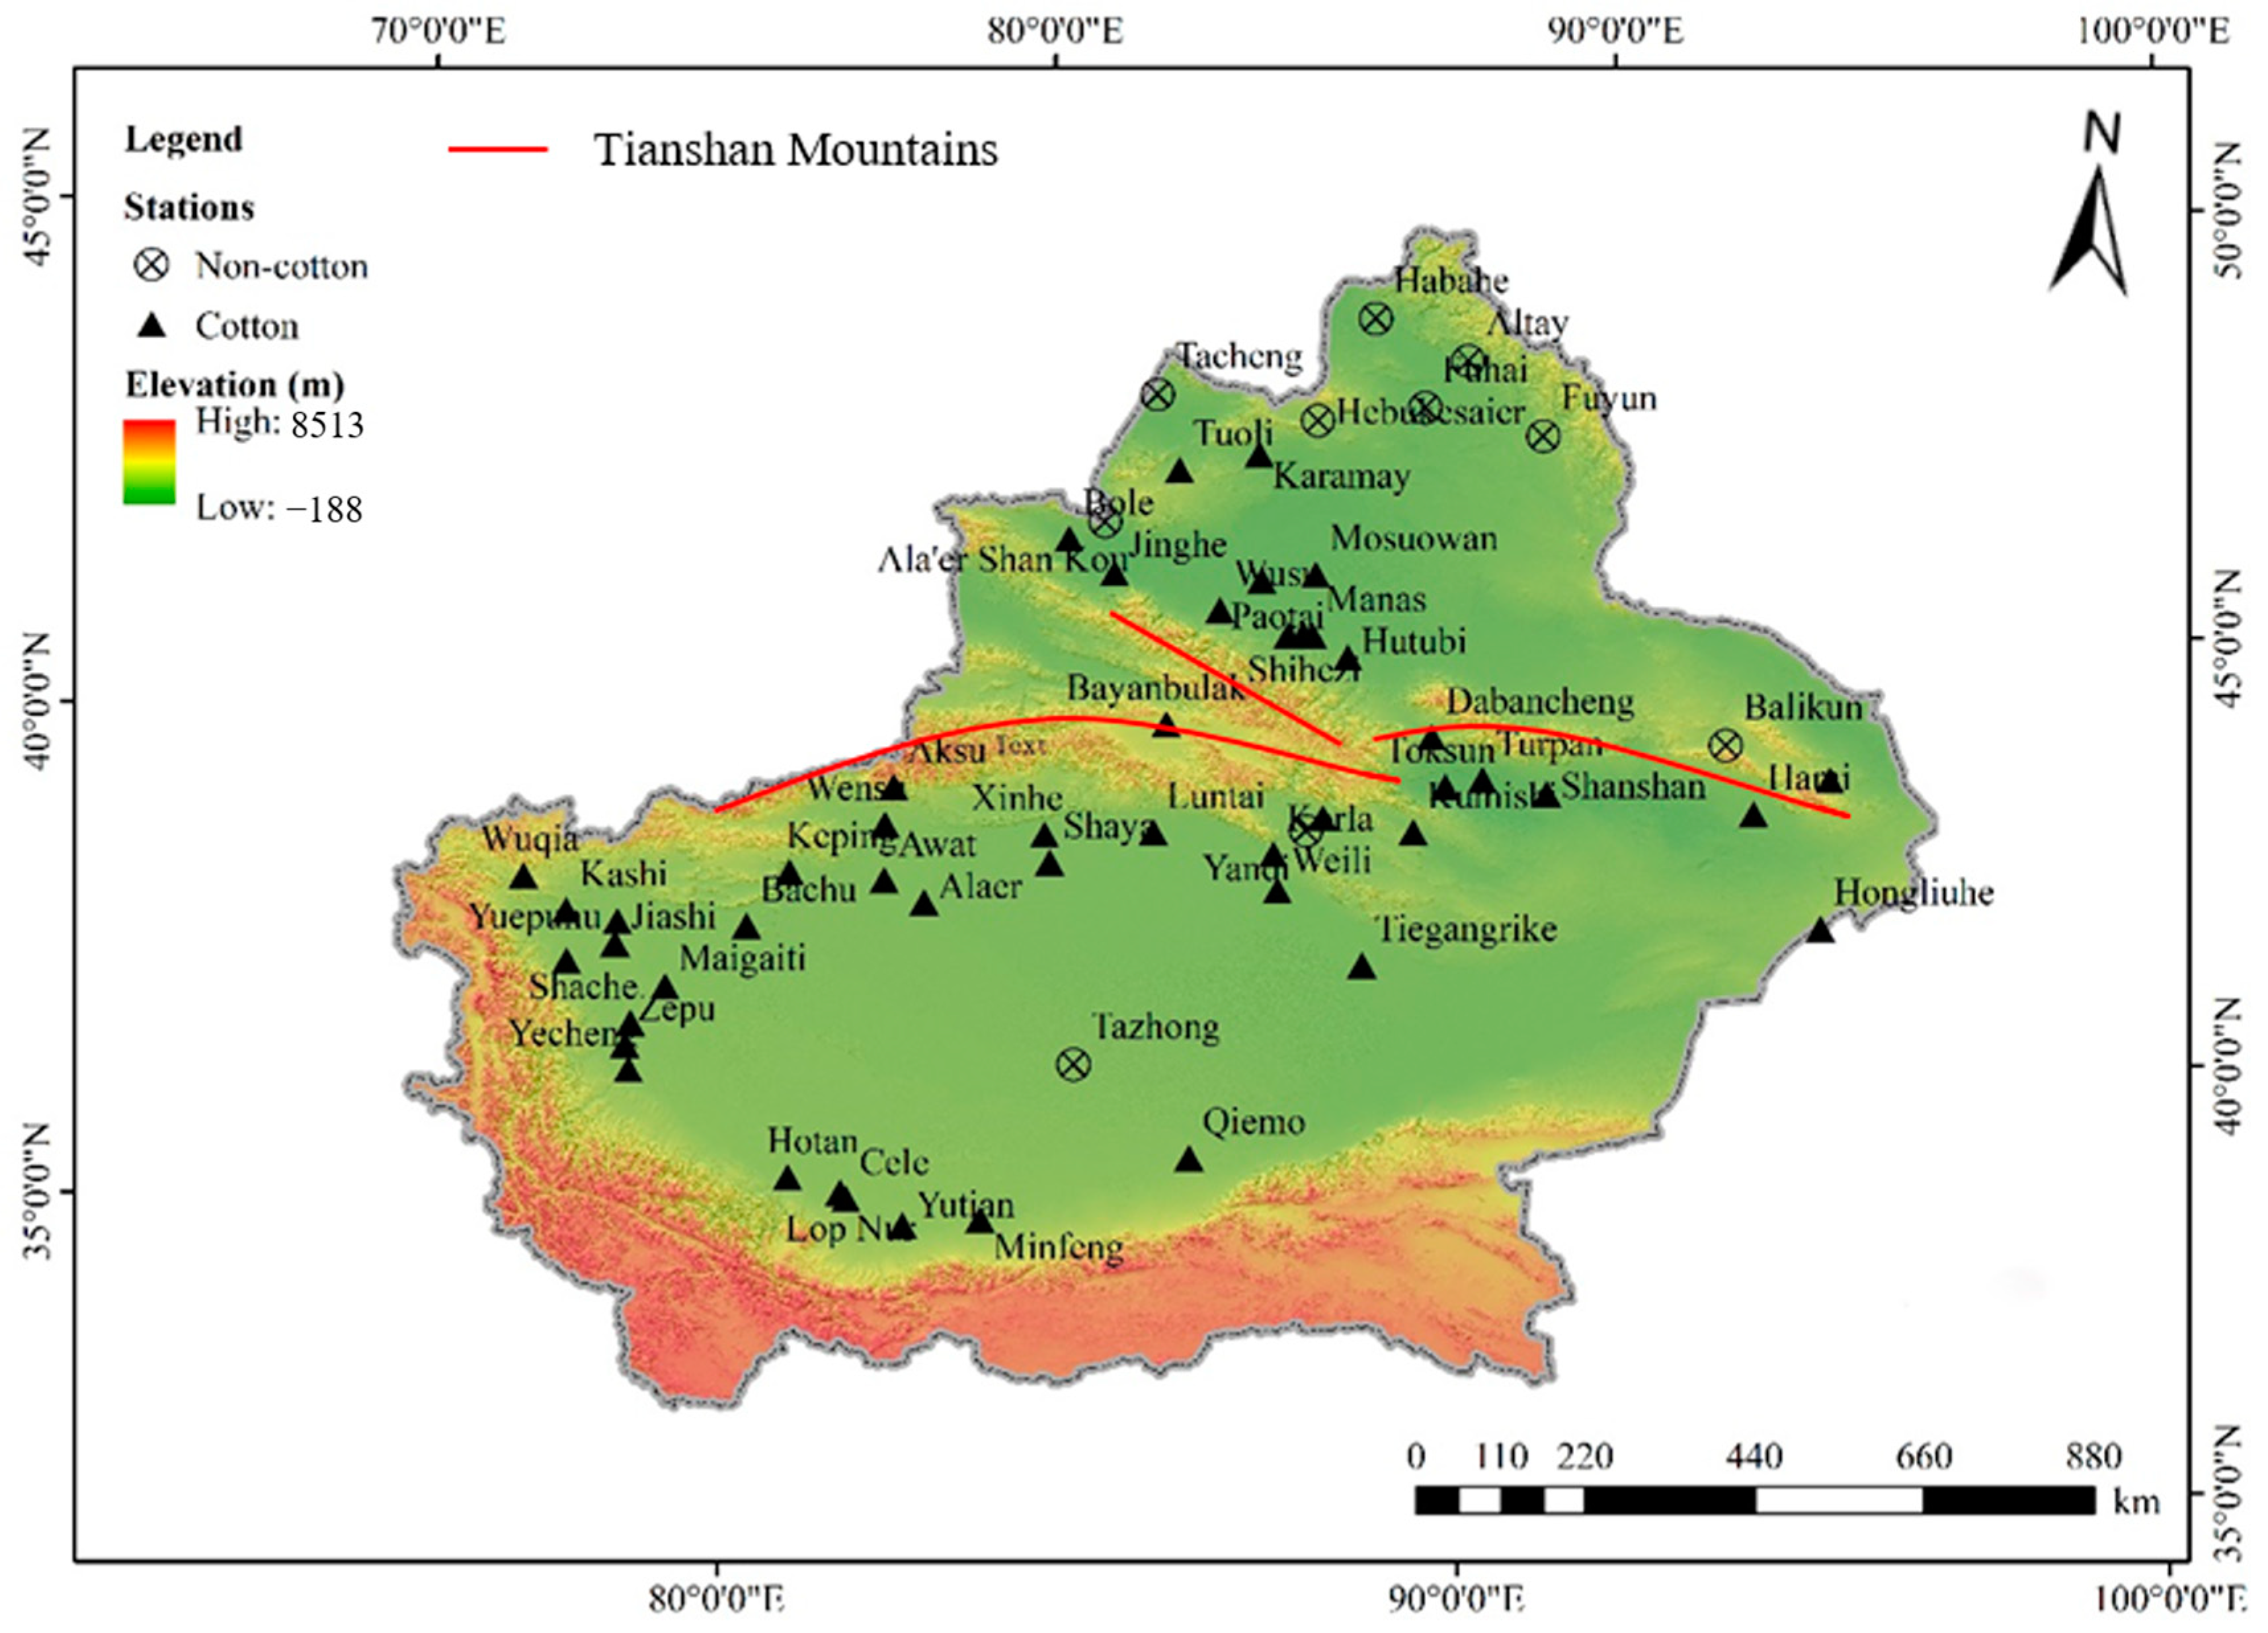
2.1. Overview of the Study Area and Data Sources

The Xinjiang Uygur Autonomous Region is located in the hinterland of the Eurasian continent (34°25′–49°11′ N, 70°40′–96°18′ E), covering an area of approximately 1.66 × 10⁶ km2, which accounts for one-sixth of China’s total land area. It was an important passage of the ancient Silk Road. The region boasts a varied topography, frequently characterized as a landscape of ‘three mountains and two basins’. From north to south, these include the Altai Mountains, Junggar Basin, eastern Tianshan Mountains, Tarim Basin, and the Kunlun Mountains. Divided by the eastern Tianshan Mountains, Xinjiang is further classified into Southern Xinjiang and Northern Xinjiang (Figure 1).
The region experiences a temperate continental climate characterized by dryness, abundant heat, and significant diurnal temperature variations. These climatic conditions are favorable for cotton cultivation, making Xinjiang the largest production area for high-quality commercial cotton in China.
This study utilized meteorological data, including the average, maximum, and minimum temperatures, from 54 weather stations in Xinjiang, spanning from 1981 to 2020. Stations located in mountainous areas were excluded (Figure 1). The dataset represents the average daily air temperature values at 2 m above the ground level. We sourced our data from the China Meteorological Administration Data Sharing Service System (http://data.cma.cn/, accessed on 28 May 2023), with all chosen stations providing complete daily observational records for the duration of the study period. Digital elevation model (DEM) data were obtained from the GeoSpatial Cloud website (http://www.gscloud.cn/, accessed on 25 May 2023), including a Xinjiang digital elevation model with a resolution of 90 m × 90 m. We chose to use the Beijing-1954 geographic coordinate system and the Beijing-1954 Gauss–Krüger regional coordinate system, because they are widely accepted in large-scale mapping projects in China and are suitable for the mid-latitude region in our study to accurately preserve the shape and area of large-scale geographic features.

2.2. Research Methods

2.2.1. Calculation Methods for Meteorological Indices

The sum of active temperatures ≥ 10 °C (SAT) is the sum of active temperatures ≥ 10 °C over a period. In our research, we calculated the sum of active temperatures ≥ 10 °C during the cotton plants’ growing period, as well as in April–May. The calculation is as follows:
S A T = a b T i 10 ,       T i 10
where the following is the case:
“a” and “b” represent the start and end dates, respectively, for calculating the accumulated temperatures. When calculating the accumulated temperature during April–May, “a” is 1 April, and “b” is 31 May. When calculating the accumulated temperatures during the growth period, “a” and “b” denote the start and end dates, respectively, of the daily average temperature ≥ 10 °C within the cotton plants’ growing season, which are determined using a 5-day sliding average method.
Ti” represents the daily average temperature, °C.
The duration of the climatic growing season is determined by counting the days from the last frost day to the first frost day. Frost days are defined as days when the minimum daily temperature (Tmin) is ≤0 °C. The last frost day is defined as the latest day of the year before 15 July when Tmin is ≤0 °C. Similarly, the first frost day is the earliest date after 15 July when Tmin is ≤0 °C.
The defoliant should be sprayed within 3–7 days after cotton boll opening. We believe that the optimal defoliant spraying time is a day within this 3–7-day window that meets two conditions: a minimum temperature surpassing 12 °C and a daily mean temperature exceeding 18 °C.

2.2.2. Probability of Exceedance

The exceedance probability refers to the likelihood of a specific meteorological variable, like rainfall, temperature, or sunlight, exceeding a predetermined threshold within a set time period [32]. Calculating the exceedance probabilities of meteorological variables is important for assessing and predicting suitable conditions for crop growth and development. When analyzing agricultural climate issues using long-term climate data, it is recommended to use a minimum exceedance probability of 80% [33,34,35]. In this study, we used the “Extremes” package in the R language (R version 4.3.1) to calculate the 80% exceedance probability of climate elements for the period 1981–2020.

2.2.3. Calculation of the Heat Compensation Value under Plastic Film Mulching

Plastic film mulching in cotton fields can provide warming effects, especially during the seedling and budding stages of cotton plants’ growth. To measure the warming effects of plastic film coverings, researchers designed a calculation method to estimate the effective accumulated temperature compensation value under plastic film coverings by using the temperatures recorded during the seedling and budding stages [30,36].
The calculation method includes the following steps:
(1)
Based on the accumulated temperature values required for the seedling stage and the budding stage ≥10 °C the number of days from seedling emergence (NL1) and budding (NL2) in Xinjiang each year was estimated.
(2)
The number of days (Nm1 and Nm2) for mulched cotton during the seedling and budding stages was estimated based on the daily average temperature and the corresponding number of days for the open-field cotton using a trial calculation method. The calculation formula is as follows:
N m = i = 1 N n T i + 4.4921 K + 15 N L 1 0.0975 K j = 1 N L T j
where the following is the case:
K is the compensation coefficient for the heat accumulation of plastic-film-mulched cotton and the effective temperature. The unit (°C·d)/(°C·d) can be omitted. For the seedling stage, K = 0.843, and for the budding stage, K = 0.207. NL and Nm represent the number of days for open-field cotton and plastic-film-mulched cotton, respectively, during a specific growth stage, measured in days. Ti and Tj represent the daily average temperatures of cotton plants grown in the open and under a plastic film cover, respectively, during specific growth stages (seedling and budding stages), °C.
(3)
The equation for estimating the heat compensation value of the effective temperatures during the seedling and budding stages of plastic-film-mulched cotton (ΔATM1 and ΔATM2) based on the number of days (Nm1 and Nm2) is as follows:
Δ A T M = K 4.4921 N m 0.0975 k = 1 N m   T i
where the following is the case:
ΔATM is the heat compensation value of the effective temperature of plastic-film-mulched cotton, °C·d.
(4)
The equation for estimating the total heat compensation value of the effective temperatures during the seedling and budding stages (ΣATM) is as follows:
ΣATM = ΔATM1 + ΔATM2
where the following is the case:
ΣATM is the total heat compensation value of the effective temperature during a specific growth stage of plastic-film-mulched cotton, °C·d.

2.2.4. Zoning Indicators

The cumulative effective temperature ≥ 10 °C during the April–May period and within the growing season is an important indicator for assessing the suitability of an area for cotton cultivation. It is positively correlated with bud formation and the pre-frost flower yield. A higher cumulative temperature indicates a longer cotton plant growth period and higher yields of buds and flowers before the frost period. The absence of frost is a key factor limiting the length of the cotton plant growing season. The average temperature in July also plays an important role in the formation of high-quality fiber growth. The optimal timing for defoliant application, apart from being a factor limiting the growth and development time of cotton plants, also helps reduce impurities during mechanical harvesting, thus being a critical factor for the maturity and harvesting quality of mechanically harvested cotton [3].
Referring to the “Technical Specifications for Machine-Harvested Long Staple Cotton Operations (DB 65/T 2266–2019)” [37] proposed by the Xinjiang Academy of Agricultural Sciences, the main indicators (Table 1) and auxiliary indicators (Table 2) for zoning machine-harvested cotton in Xinjiang have been established.

2.3. Data Processing

2.3.1. Interpolation Methods

In this study, we employed the mixed interpolation simulation method to enhance the preciseness of spatial interpolation. This method is based on MLR (multiple linear regression) and IDW (inverse distance weighting). Compared to other commonly used interpolation methods, such as inverse distance weighting, spline interpolation, nearest neighbor, and the trend surface method, the mixed interpolation simulation approach rectifies the residuals throughout the interpolation process, thus allowing for heightened accuracy in spatial interpolation. It has been widely used in recent years for fine-scale crop climate suitability zoning.
Specifically, statistical tests were first conducted on the observed data and calculated zoning indicators. Subsequently, these zoning indicators were treated as dependent variables, and MLR was performed using independent variables such as the longitude, latitude, and elevation derived from DEM (digital elevation model) data to establish a geographic spatial model. The expression is as follows:
Y = Y λ , φ , h + ε = a 0 + a 1 λ + a 2 φ + a 3 h + a 4 λ φ + a 5 φ h + a 6 λ h + a 7 λ 2 + a 8 φ 2 + a 9 h 2 + ε
where the following is the case:
Y represents the predicted value of the zoning indicator at the grid point; λ, φ, and h represent the longitude, latitude, and altitude of the grid point, respectively; ε represents the residual in the MLR equation; and a0–a9 represent the undetermined coefficients.
After establishing the geographic spatial model, the dependent variable was interpolated to 1 km × 1 km grid points using this model and a raster calculator, and the residuals of the dependent variable were computed. Then, IDW was used to perform local interpolation on these residuals, and the interpolated residuals were added to the dependent variable to obtain new fitted values, namely the spatial prediction values of the zoning indicators. IDW interpolation is a spatial deterministic interpolation method. The basic principle is that the similarity of nearby areas is always higher than the similarity of relatively distant areas based on the decay law of distances from sample points; the spatial distances are weighted [3]. When the weight is >1, non-linear distance decay interpolation is calculated, and when the weight = 1, linear distance decay interpolation is calculated. It can be represented by the following equation:
Y ^ = λ i y x i = i = 1 n   1 / d i m × y x i i = 1 n   1 / d i m
where the following is the case:
Y is the spatial estimated value of the climate zoning indicators at grid point y(xi), y(xi) is the meteorological observation value corresponding to the xi-th observation station of each climate zoning indicator, n is the number of sample points used for interpolation, di is the distance value between the grid point to be estimated and the i-th meteorological observation station within the area, and λi is the weight, which is the power exponent of the reciprocal of the distance between the interpolation point and the observation point.
Finally, using these spatial predictions, grid maps of the zoning indicators during the 1981–2020 period were generated, with a resolution of 1 km × 1 km. Throughout the study, the processing of raster data was carried out using ArcGIS 10.8 (Esri, Redlands, CA, USA).

2.3.2. Trend Detection

The temporal variability of climate indicators is represented using linear trend estimation. The significance of the changes is assessed using the non-parametric Mann–Kendall test, and the statistical significance assessment adopts Sen’s method [38].

2.3.3. Objective Weight Determination

Utilizing the entropy method, weights are assigned to the mechanized cotton zoning indicators. The entropy method analyzes the weights of indicators by calculating the dominance value of each indicator in the system to determine the final state of the system and allocate weights based on the size of the information provided [39]. The smaller the entropy value of an indicator, the higher the level of order exhibited by the system on that indicator, and thus the higher the weight of that indicator in the comprehensive assessment. The calculation formulae mainly used when applying the entropy method to analyze the weights of various indicators in the system are shown in Equations (7) to (11):
A = x 11 x 12 x 1 n x 21 x 22 x 2 n x m 1 x m 2 x m n ( i = 1,2 , , m ; j = 1,2 , n )
In Equation (7), A is the matrix of graded assignment data for evaluation indicators; xij represents the graded assignments of various evaluation indicators; n is the number of evaluation indicators; and m is the number of samples participating in the dominance weight calculation.
y i j = x i j x i j m i n x i j m a x x i j m i n
In Equation (8), yij represents the values corresponding to different evaluation indicators for each sample obtained after standardizing data matrix A.
E j = 1 ln ( m ) i = 1 m   1 + y i j y i l n ( 1 + y i j y i )
y i = i = 1 m   1 + y i j
In Equation (9), Ej represents the entropy value of each evaluation indicator.
w j = 1 E j n j = 1 n   E j .
In Equation (11), wj represents the weights of each evaluation indicator calculated using the entropy weight method.

2.3.4. Climate Suitability Zoning

These weights, in conjunction with the sum product method, facilitate a spatial overlay of each indicator’s grid maps. This methodology culminates in the derivation of a climatic suitability distribution map. With the support of GIS spatial analysis techniques, cotton planting distribution data in Xinjiang (Figure 2) were used to mask the distribution map of climate suitability; a refined and quantitative zoning map of climate suitability for machine-picked cotton planting in Xinjiang and the Xinjiang Production and Construction Corps was created.
According to research, it has been suggested that 1990 marked a turning point in temperature variation and the widespread adoption of plastic film technology [40]. Therefore, meteorological data from 1990 to 2020 were used in combination with the warming effect of plastic film for the zoning analysis.

3. Results and Analysis

3.1. Zoning Indicator Interpolation and Weighting

3.1.1. Zoning Indicators’ Interpolation

This study established a geographic relationship model based on MLR by conducting statistical tests on observational data. It predicted the zoning indicator values by using variables such as the longitude, latitude, and altitude, and modeled items with significant regression coefficients. The results indicate that the geographical relationship models for the zoning indicators pass the significance test at a significance level of 0.001, and the coefficient of determination of the equations are between 0.8 and 0.9, indicating a good regression trend and correlation in the models (Table 3).

3.1.2. Zoning Indicators’ Weights

The use of information entropy reveals the relative importance of each zoning indicator in the model. Higher weights indicate a stronger influence on the zoning model, while lower weights suggest a relatively weaker impact. The results show a greater emphasis on the annual temperature conditions, including the accumulated temperature (weight of 0.33) and the frost-free period (weight of 0.26), along with some consideration given to the timing of crop management practices, such as leaf removal-agent application (Table 4). Through the calculation of information entropy and weight allocation, we gain a deeper understanding of the influence of each indicator on the judgment of the agricultural system status, providing a reliable basis for zoning decisions.

3.2. Spatial and Temporal Distribution of Heat Indicators

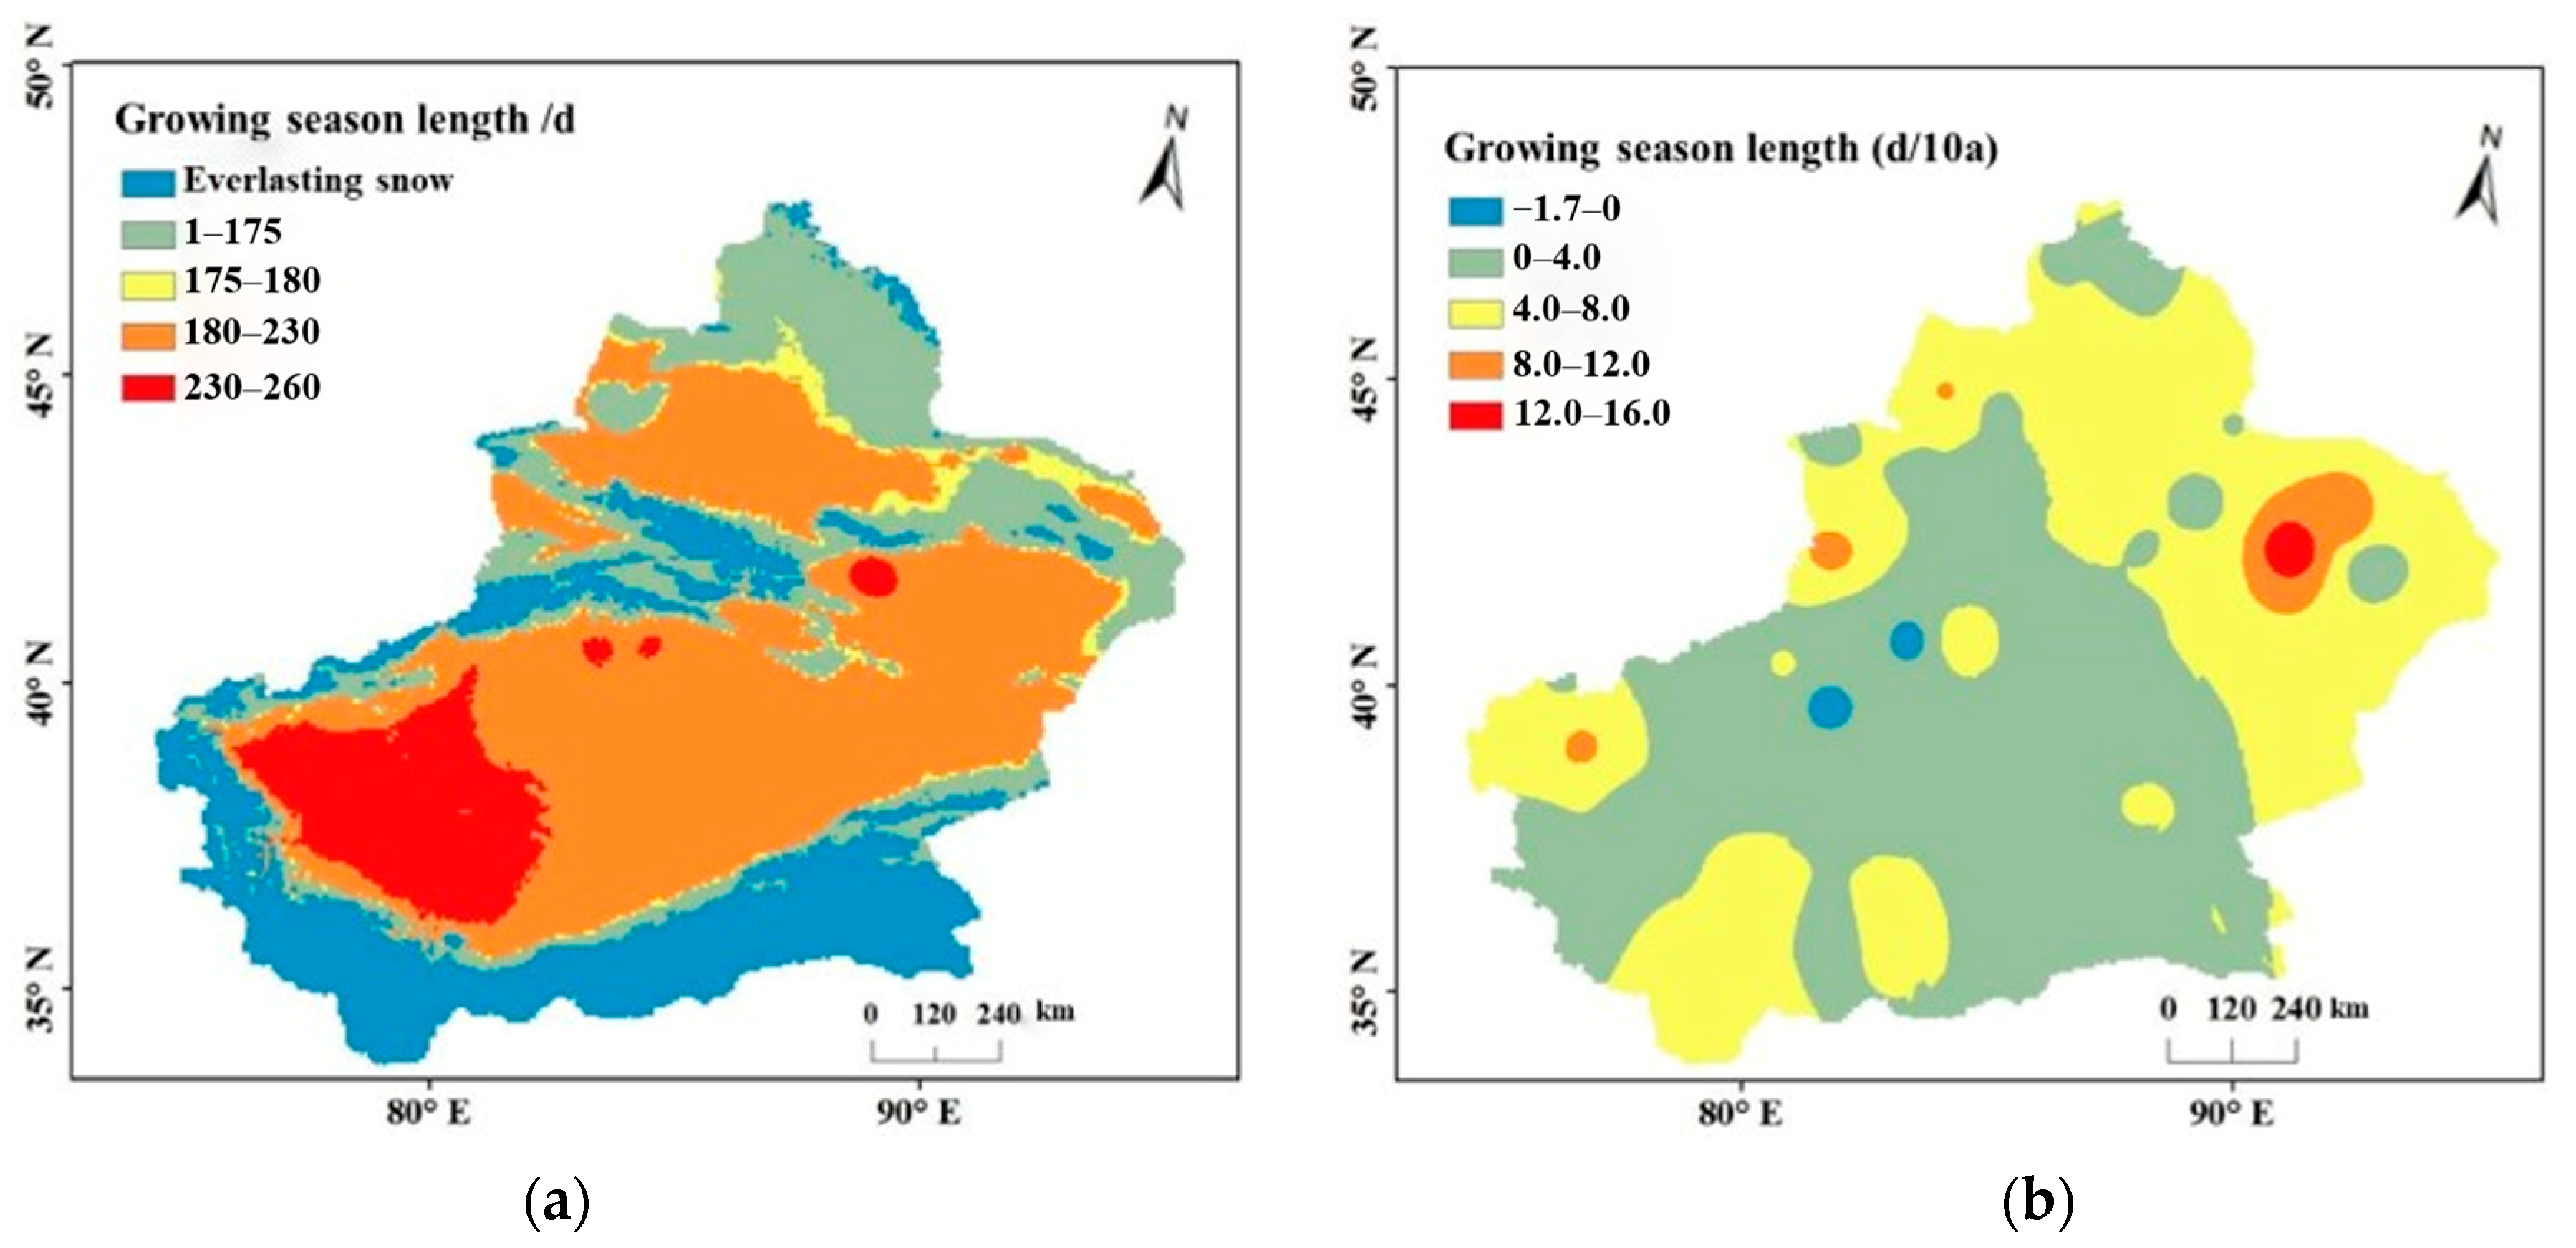
3.2.1. Length of Growing Season

The length of the growing season in Xinjiang tends to decrease as both the latitude and elevation increase. Regions with longer growing seasons are mainly distributed in the central and western parts of the Turpan Basin and the Tarim Basin, typically ranging from 230.0 to 260.0 d. In most of Southern Xinjiang, the Junggar Basin, and the Ili River Valley, the length of the growing season ranges from 180.0 to 230.0 d. The shortest growing seasons are found in the high-altitude areas of the Altai Mountains, Tianshan Mountains, and Kunlun Mountains (above 4000 m), where the length of the growing season is basically zero, insufficient to meet the heat requirements for cotton plant growth (Figure 3a).
From 1981 to 2020, the growing season length was observed to increase at 96% of meteorological stations across Xinjiang, averaging an extension of 4.5 d (Figure 3b). The Shisanjianfang region had the fastest growth rate for the length of the growing season, with an increase of 12.0–16.0 d/10a (p < 0.01), accumulating a total extension of 49.2–65.6 d over 40 years. Most areas in Southern Xinjiang increase at a rate of 0.0–4.0 d/10a, with a cumulative extension of 0.0–16.4 d over 41 years. In most areas of Northern Xinjiang, the rate of increase was 4.0–8.0 d/10a, with a cumulative extension of 16.4–32.8 d over 40 years. Additionally, in Alar and Kuche, where heat resources are abundant, the growing season length is minimal and shortens at a rate of 0.0–1.7 d/10a, resulting in a cumulative reduction of 0.0–7.0 d over 40 years.

3.2.2. Sum of Active Temperatures ≥ 10 °C

The spatial distribution of the sum of active temperatures ≥ 10 °C shows the overall pattern of “more in Southern Xinjiang than in Northern Xinjiang, more in plains and basins than in mountainous areas” (Figure 4a). Due to the influence of elevation and latitude, the sum of active temperatures ≥ 10 °C decreases with an increasing elevation and latitude. The areas with the highest sums of active temperatures ≥ 10 °C are mainly located in the central and western parts of the Tarim Basin in Southern Xinjiang, with the Turpan and Hami Basins having sums of active temperatures ≥ 4500 °C, indicating abundant heat resources. In Northern Xinjiang, except for the Karamay area, which has a sum of active temperatures ≥ 4500 °C, most of the Junggar Basin has sums of active temperatures between 3800 and 4500 °C. In the high-altitude areas of the Altai Mountains, Tianshan Mountains, and Kunlun Mountains, with elevations above 4000 m, the sum of active temperatures ≥ 10 °C is zero.
About 96% of the stations show an increasing trend in the sum of active temperatures ≥ 10 °C, with an average increase of 105.8 °C (Figure 4b). The stations with the fastest growth rates are Shisanjianfang and Yining, with increases of 300.0–337.2 °C·d/10a (p < 0.01), accumulating a total increase of 1230.0–1381.7 °C over 40 years. In Southern Xinjiang, except for the Kuche and Keping areas, which decrease at rates of 0.0–50.8 °C·d/10a, most areas show increases at rates of 0.0–100.0 °C·d/10a, resulting in a cumulative increase of 0.0–410 °C over 40 years. In Northern Xinjiang, except for the northern slopes of the Tianshan Mountains, which show an increase of 0.0–100.0 °C·d, the central and eastern parts of the Junggar Basin show increases at rates of 100.0–200.0 °C·d/10a, resulting in a cumulative increase of 410.0–820.0 °C over 40 years.

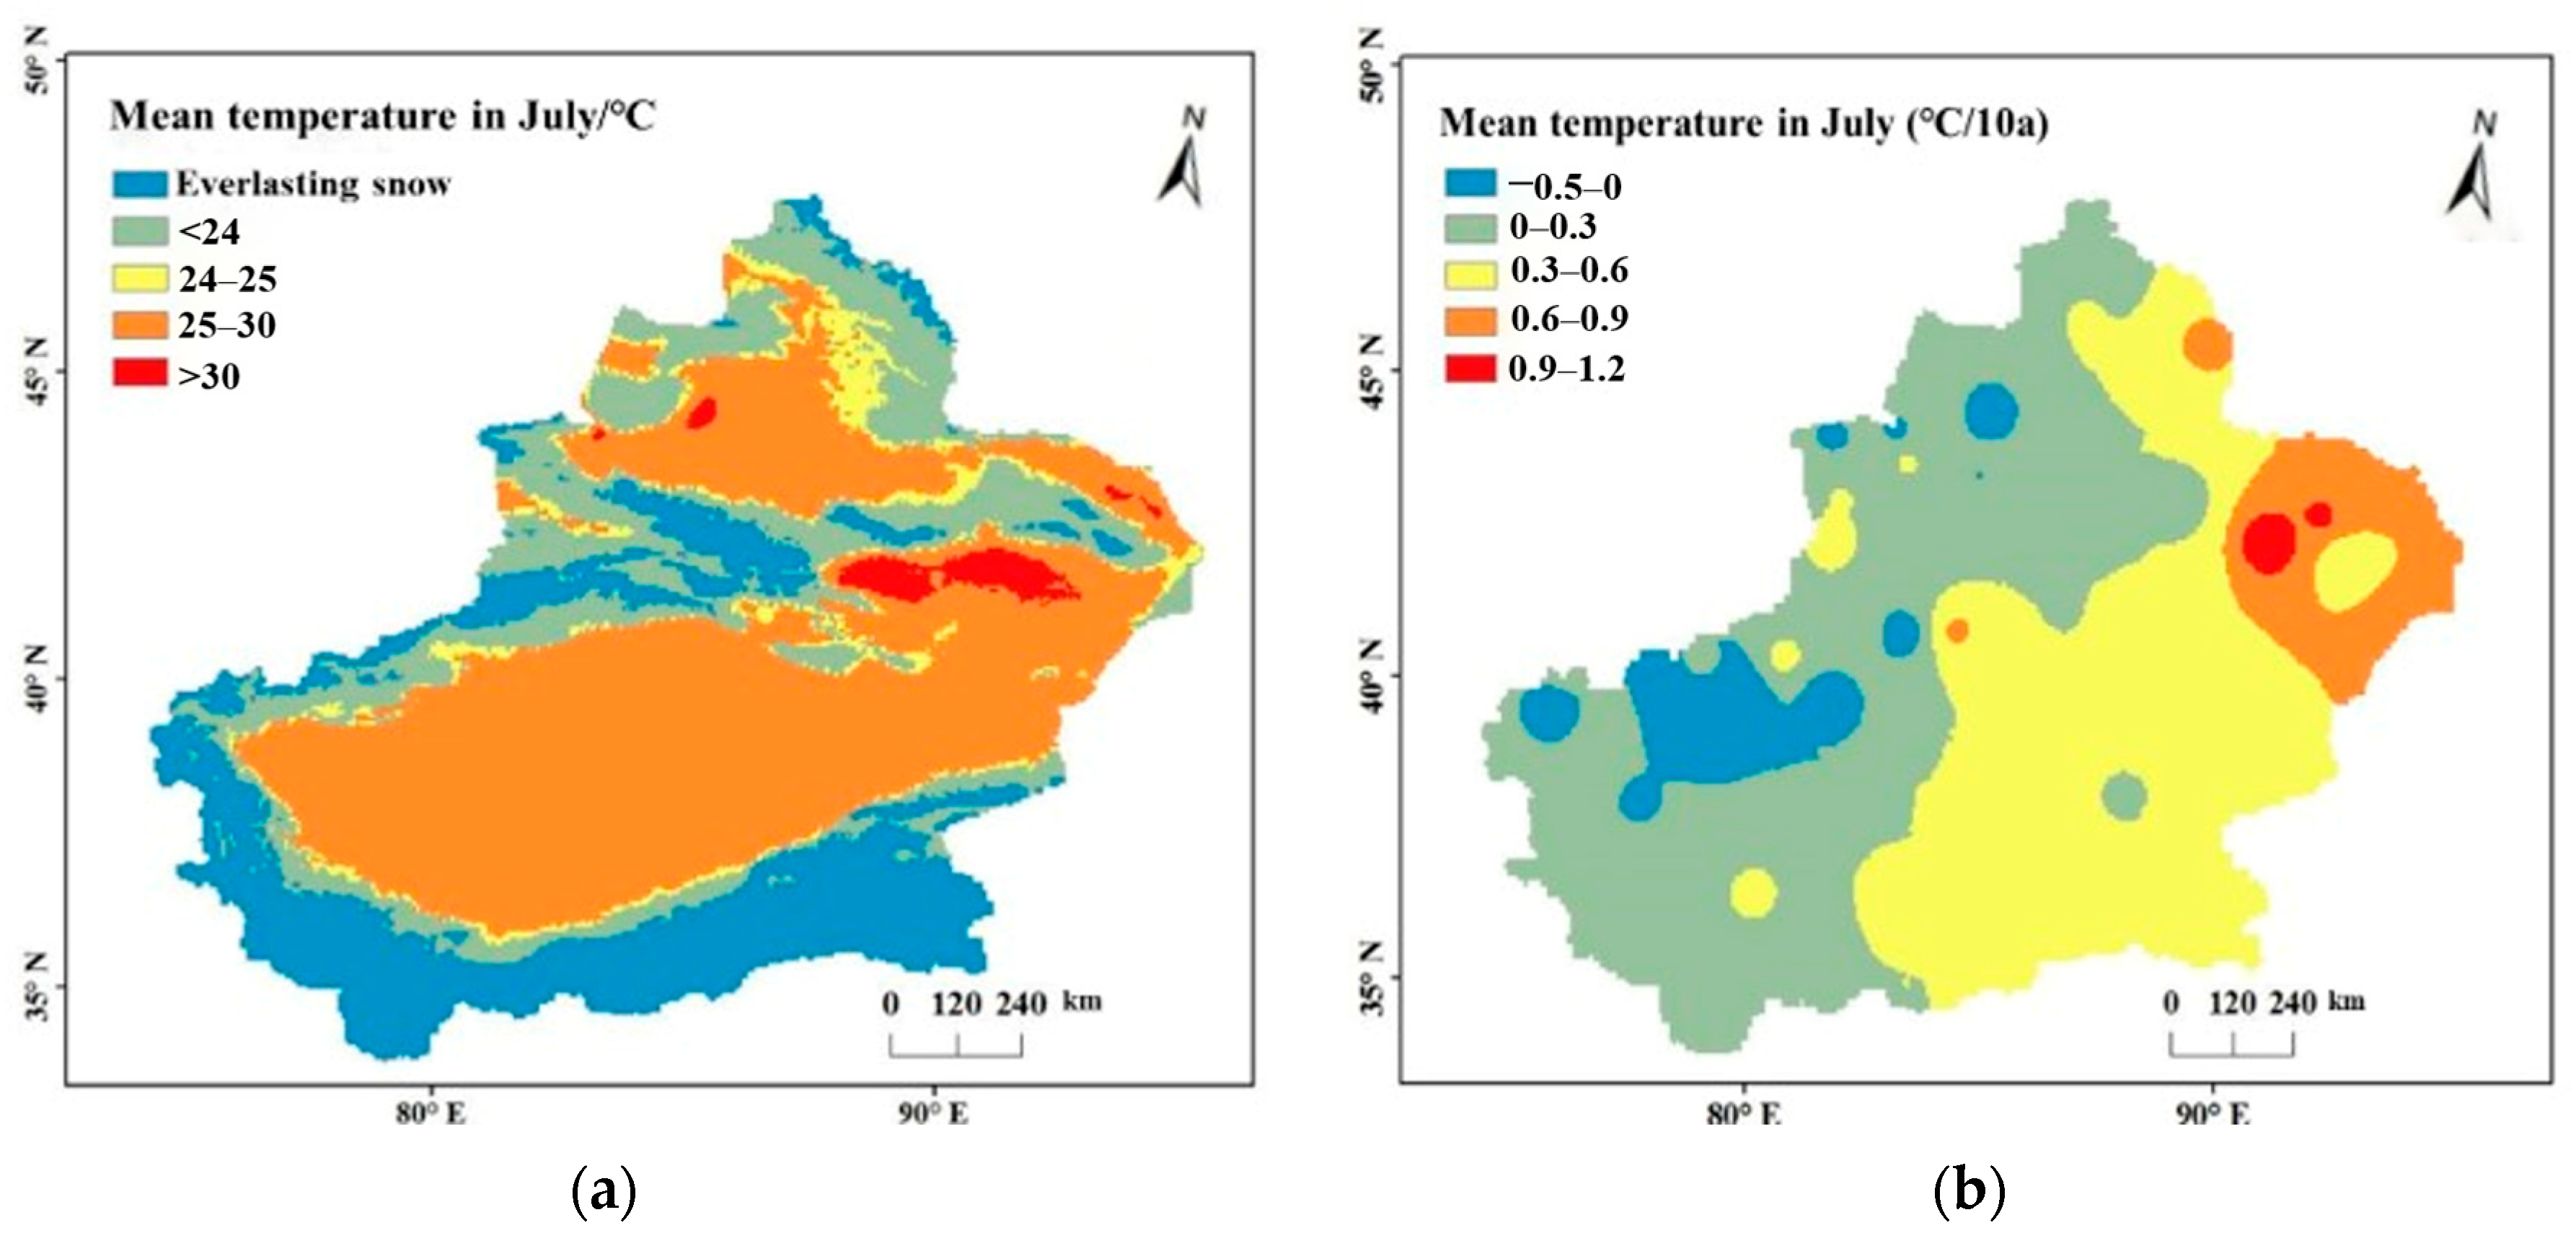
3.2.3. Average Temperature in July

There is little difference in the average temperature in July between Southern and Northern Xinjiang (Figure 5a). The Karamay area as well as the Turpan and Hami Basins have temperatures exceeding 30 °C, while most areas in Southern and Northern Xinjiang have average temperatures in July between 25 and 30 °C. In high-altitude and cold regions, such as the Altai Mountains, Tianshan Mountains, and Kunlun Mountains, the average temperature in July is below 0 °C.
Around 80% of the stations show an increasing trend in the average temperature in July, with an average increase of 0.4 °C (Figure 5b). The Shisanjianfang region has the fastest growth rate for the average temperature in July, reaching 0.9–1.2 °C/10a (p < 0.01), with a cumulative increase of 3.7–4.9 °C over 40 years. In Southern Xinjiang, except for the Kuche, Wuqia, Bachu, Keping, Alar, and Shache areas, which decrease at rates of 0.0–0.5 °C/10a, most areas show an increasing trend. The rate of change in the central and western parts of the Tarim Basin is smaller than that in the eastern region, reaching 0.0–0.3 °C/10a (p < 0.01), resulting in a cumulative increase of 0.0–1.2 °C over 40 years. In Northern Xinjiang, except for the Alashankou, Karamay, Wensu, and Wusu areas, which decrease at rates of 0.0–0.5 °C/10a, most areas show an increase at a rate of 0.0–0.3 °C/10a (p < 0.01), resulting in a cumulative increase of 0.0–1.2 °C over 40 years.

3.2.4. Last Frost Date

The spatial distribution of the last frost date in Xinjiang shows an overall pattern of “earlier in Southern Xinjiang than in Northern Xinjiang, earlier in plains and basins than in mountainous areas”. The earliest last frost date is mainly found in the Turpan Basin and the central and western parts of the Tarim Basin (Figure 6a), generally occurring in mid- to late March. In most areas of the Junggar Basin and the Ili River Valley, it occurs in mid- to late April. In the central and western parts of the Tarim Basin, it occurs earlier than in the eastern region. In the high-altitude and cold regions of the Altai Mountains, Tianshan Mountains, and Kunlun Mountains, frost occurs throughout the year due to the higher elevation.
Except for the Kuche station, where the last frost date is delayed at a rate not exceeding 0.1 d/10a (p < 0.01), 96% of the meteorological stations show an advancing trend, averaging an advancement of 12.3 d (Figure 6b). The Shisanjianfang region has the largest advancement, reaching 5.5–7.7 d/10a (p < 0.01), with a cumulative advancement of 22.6–31.6 d over 40 years. In Southern Xinjiang, the last frost date advances at a rate of 1.5–3.5 d/10a, resulting in a cumulative advancement of 6.2–14.4 d over 40 years. In Northern Xinjiang, the last frost date advances at a rate of 1.5–5.5 d/10a, resulting in a cumulative advancement of 6.2–22.6 d over 40 years.

3.2.5. Sum of Active Temperatures ≥ 10 °C in April–May

The regions with the highest sum of active temperatures ≥ 10 °C in April–May are mainly distributed in Southern Xinjiang, most areas of the Turpan and Hami Basins, and the western part of the Junggar Basin (Figure 7a). In most areas of the Junggar Basin in Northern Xinjiang, the sum of active temperatures ≥ 10 °C in April–May ranges from 400 to 500 °C. In the high-altitude and cold regions of the Altai Mountains, Tianshan Mountains, and Kunlun Mountains, the sum of active temperatures ≥ 10 °C in April–May is almost zero.
Around 96% of the stations show an increasing trend in the sum of active temperatures ≥ 10 °C in April–May, with an average increase of 19.1 °C (Figure 7b). The Shisanjianfang region has the fastest growth rate, reaching 60.0–75.4 °C·d/10a (p < 0.01), with a cumulative increase of 246.0–309.1 °C over 40 years. In Southern Xinjiang, except for Kuche, which decreases at a rate of 0.0–2.7 °C·d/10a, most areas show increases at rates of 0.0–20.0 °C·d/10a (p < 0.01), resulting in a cumulative increase of 0.0–82.0 °C over 40 years. In Northern Xinjiang, the areas with the highest growth rate for the sum of active temperatures above 10 °C in April–May are mainly located in the northern slope of the Tianshan Mountains and the southern part of the Junggar Basin, reaching 20.0–40.0 °C·d/10a (p < 0.01), resulting in a cumulative increase of 82.0–164.0 °C over 40 years.

3.2.6. Defoliant Spray Time

The spatial distribution of the latest timing for defoliant application shows an overall pattern of “earlier in Northern Xinjiang than in Southern Xinjiang, earlier in mountainous areas than in plains and basins” (Figure 8a). In the Junggar Basin of Northern Xinjiang, the latest timing for defoliant application is mainly concentrated in early September. In the Turpan Basin, Hami Basin, and the central and western parts of the Tarim Basin, the latest timing for defoliant application is in late September. Due to the higher elevation and perennial frost, the areas of the Altai Mountains, Tianshan Mountains, and Kunlun Mountains have the earliest timing for defoliant application.
In Xinjiang, 88% of the meteorological stations show a trend of delayed timing for defoliant application, with an average delay of 3.0 d (Figure 8b). Among them, the regions with the highest rates of delay are Shisanjianfang, Zhaosu, and Tashikuergan, reaching 6.0–8.4 d/10a (p < 0.01), with a cumulative delay of 24.6–34.4 d over 40 years. The Wuqia, Hami, Keping, and Alar regions show a trend of earlier timing for defoliant application, reaching 0.0–1.7 d/10a (p < 0.01), resulting in a cumulative advancement of 0.0–7.0 d over 40 years. In most areas of Northern Xinjiang, the timing for defoliant application is delayed at a rate of 2.0–4.0 d/10a, resulting in a cumulative delay of 8.2–16.4 d over 40 years.

3.3. Mechanized Cotton Planting Suitability Zoning in Xinjiang

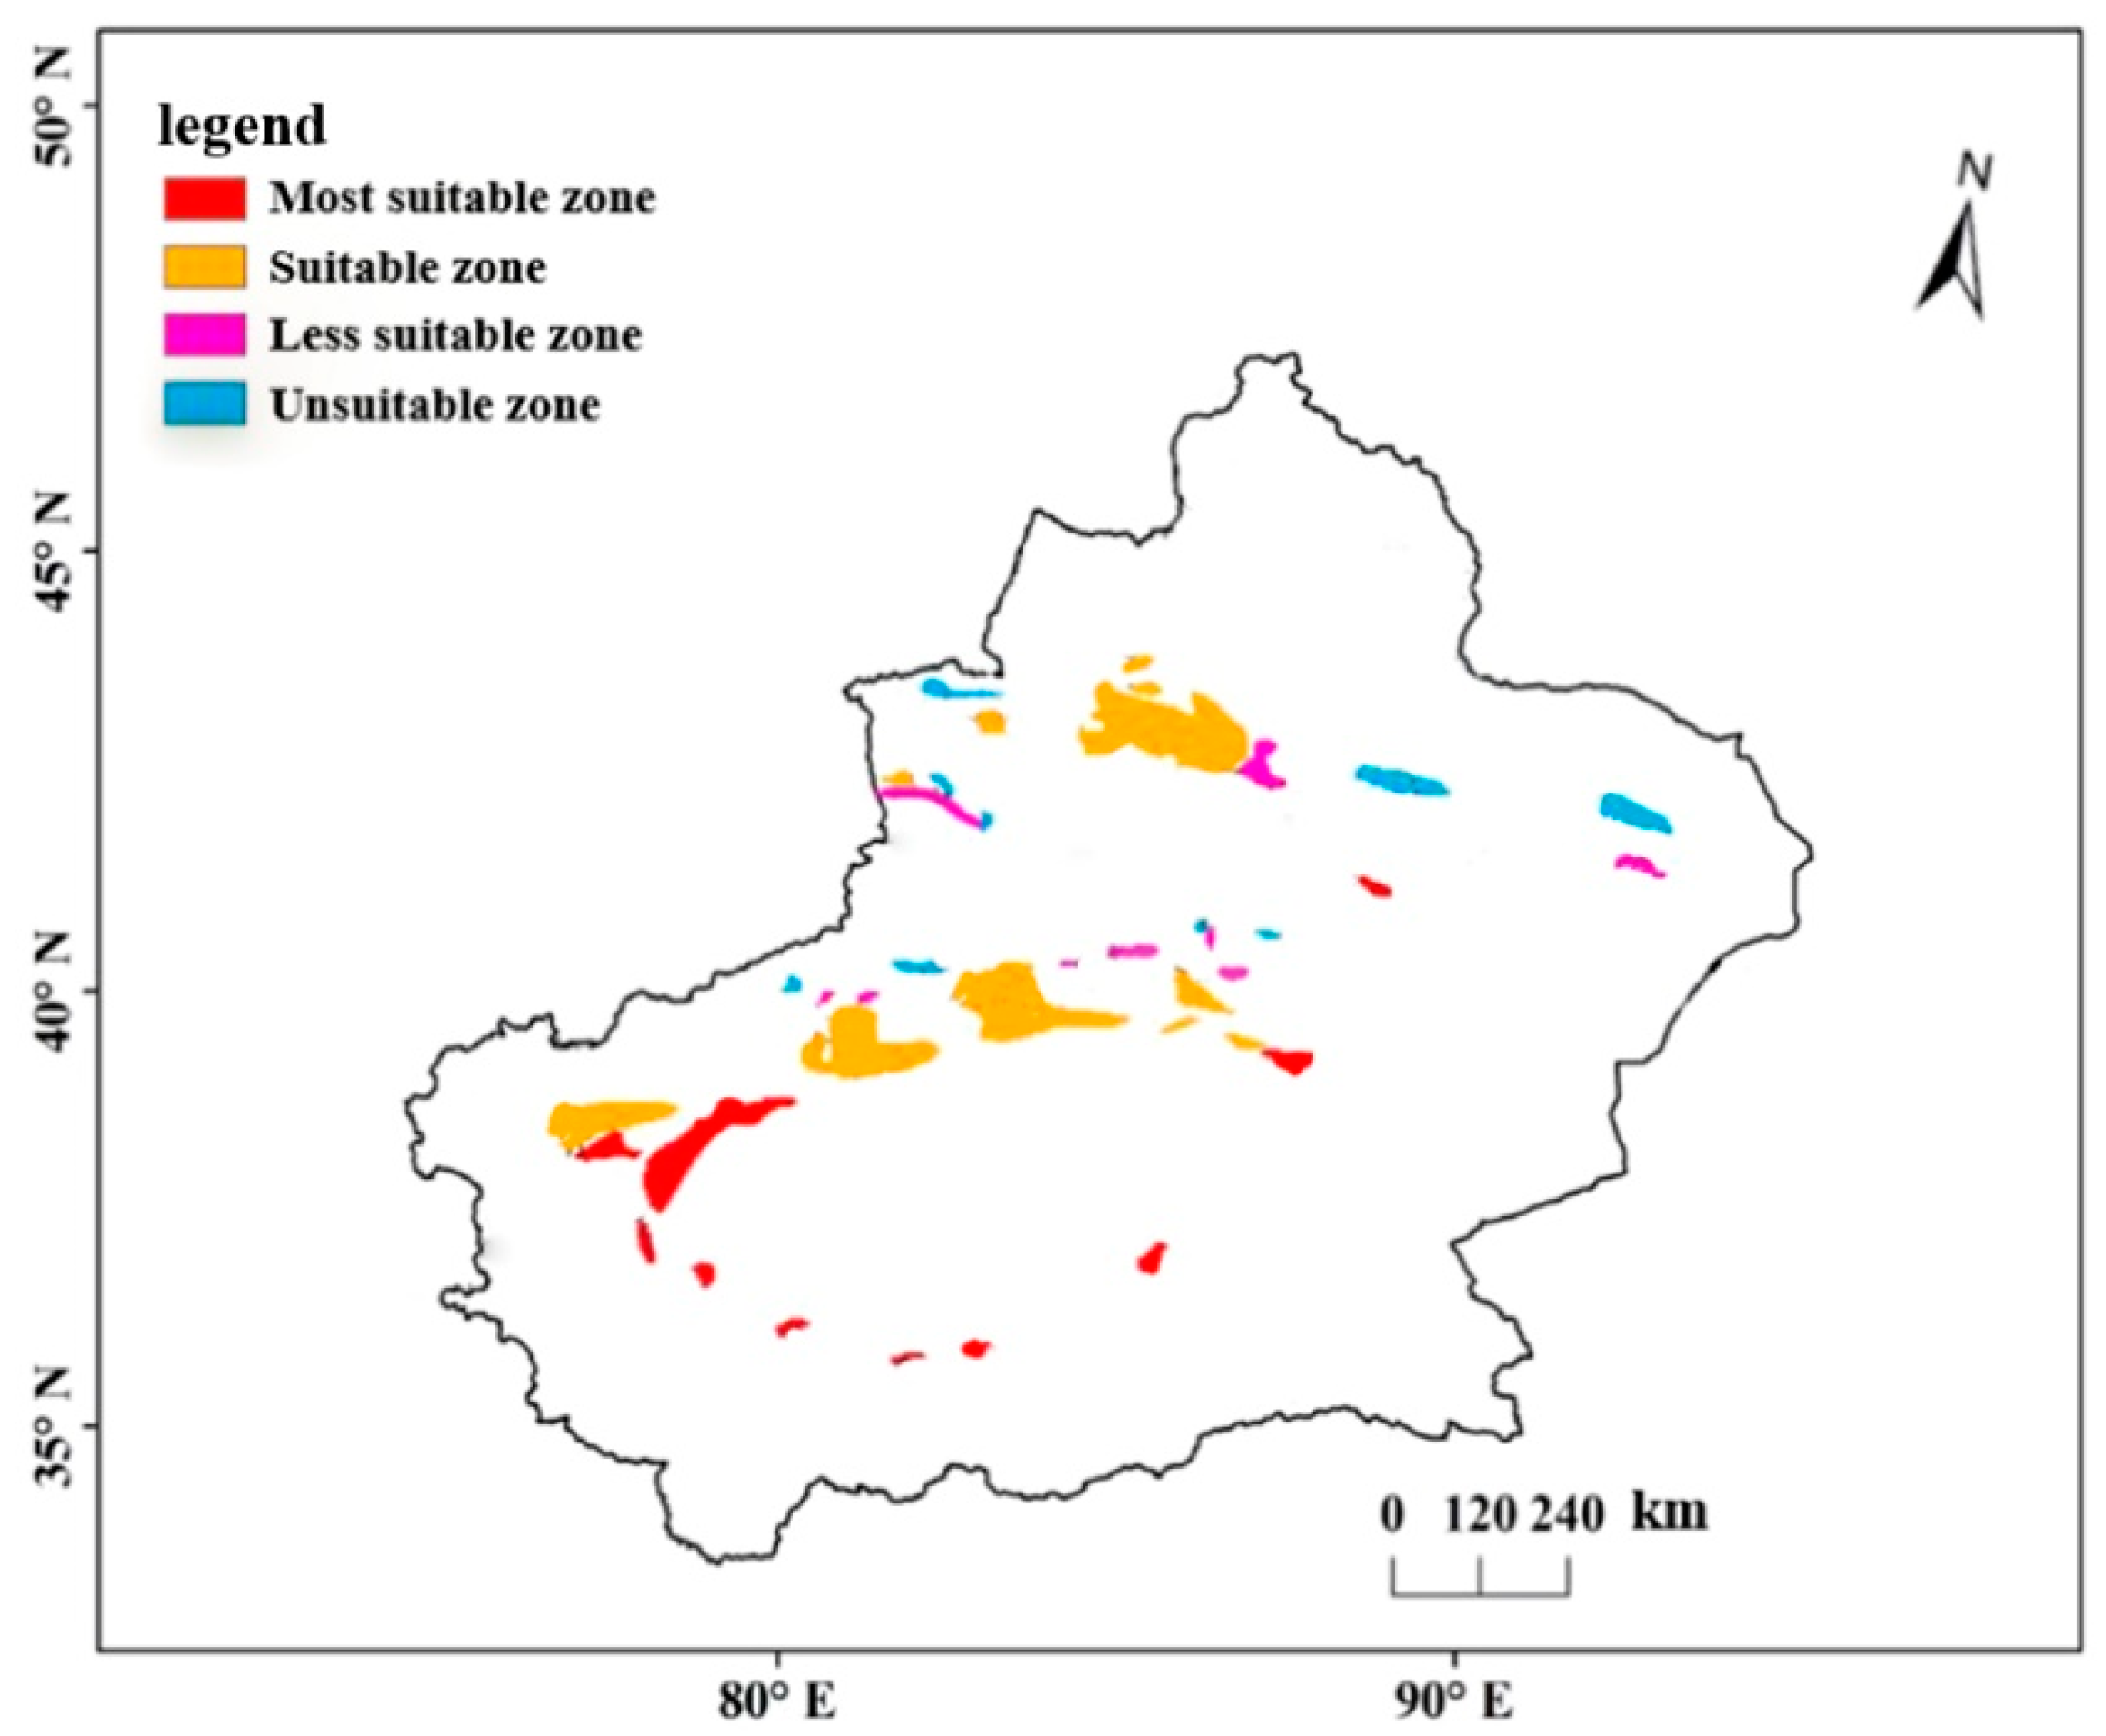
3.3.1. Results of Mechanized Cotton Planting Suitability Zoning in Xinjiang

The area of the most suitable zone for mechanized cotton planting in Xinjiang is 3.86 × 10³ km2, accounting for 18% of the total mechanized cotton planting area in Xinjiang. It is mainly distributed in areas such as Bachu, Shache, Pishan, Minfeng, Hetian, Yutian, Yutian, and Tiegangrike in Southern Xinjiang. The area of the suitable zone for mechanized cotton planting is 13.66 × 10³ km2, accounting for 63.6% of the total mechanized cotton planting area in Xinjiang. The suitable zone covers a large proportion and includes both Southern and Northern Xinjiang, mainly distributed in cities such as Karamay, Wusu, Shihezi, Bole, Kuqa, Kuche, Aksu, Alar, and the eastern part of Kashgar. The area of the less suitable zone is 1.79 × 10³ km2, accounting for 8.3% of the total mechanized cotton planting area in Xinjiang. It is mainly distributed in areas such as Hami, Caijiahu, Urumqi, and the southern part of Yining. The area unsuitable for mechanized cotton planting totals 2.17 × 10³ km2, accounting for 10.1% of Xinjiang’s entire mechanized cotton cultivating region. It is predominantly located in locations like Wenquan, Qitai, Balikun, Baicheng, and Yanqi (Table 5; Figure 9). As an outcome, the data results for each zone are as follows:
(1) Most suitable zone for mechanized cotton planting in Xinjiang:
The most suitable zone has a growing season length greater than 200 d, with an average temperature in July exceeding 30 °C, the sum of active temperatures above 10 °C exceeding 3800 °C, a final frost date in mid–late March, and an average sunshine duration of around 2700 h. The favorable natural environment can meet the temperature requirements for the growth and development of cotton plants. For a longer growing season in this zone, the recommendation is to plant medium- to late-maturing varieties. The final frost date in Southern Xinjiang is earlier than in Northern Xinjiang, usually in mid- to late March, which is conducive to the timely sowing of cotton. The average temperature in July in this area is above 25 °C, promoting the normal development of cotton bolls. The sum of active temperatures above 10 °C in April–May exceeds 500 °C, which can meet the requirements for cotton boll formation. Moreover, due to the abundant heat resources in this area, the first frost date is relatively late, allowing for a delayed timing for defoliant application, which is important for improving the cotton yield and quality.
(2) Suitable zone for mechanized cotton planting in Xinjiang:
The suitable zone has a wide distribution in both Southern and Northern Xinjiang, with no significant differences in sunshine conditions but variations in the other heat indices. In the Northern Xinjiang region, the final frost date is later than in Southern Xinjiang (generally after April), resulting in a later planting time for cotton. The average sunshine duration is around 2680 h, which is not significantly different from that of Southern Xinjiang and can meet the normal requirements of cotton plants. In the western part of the Tarim Basin in Southern Xinjiang, the average July temperature is slightly lower than that in the western part of the Junggar Basin, and the sum of active temperatures above 10 °C is higher than that in Northern Xinjiang, which is conducive to the normal growth and development of cotton plants. In most areas of the Junggar Basin in Northern Xinjiang, the growing season length is less than 200 d; therefore, it is recommended to plant cotton varieties with shorter growth periods, such as medium- and early-maturing cotton. Due to the lower heat resources in Northern Xinjiang and the earlier first frost date compared to Southern Xinjiang, the timing for defoliant application is earlier in Northern Xinjiang.
(3) Less suitable zone for mechanized cotton planting in Xinjiang:
The less suitable zone has a growing season length less than 200 d, with a final frost date generally in mid–late April. Most areas in this region have a sum of active temperatures above 10 °C in April–May between 400 and 500 °C, which can basically meet the temperature requirements for cotton boll formation. The average July temperature in most areas is between 25 and 30 °C, promoting the development of cotton bolls. Given that the climate conditions in this region can meet the normal growth and development of cotton plants and considering the rational utilization of heat resources in Xinjiang to improve the cotton quality, it is suggested to plant early-maturing or extra-early-maturing cotton in this zone.
(4) Unsuitable zone for mechanized cotton planting in Xinjiang:
The unsuitable zone has an average sunshine duration of 2600 h, but the growing season length is less than 180 d, with a sum of active temperatures above 10 °C between 3300 and 3700 °C in April–May, which does not meet the heat requirements for cotton plants’ growth; also, it is prone to spring frost damage. It is recommended to plant other cash crops in this region.

3.3.2. Changes in the Zoning of Machine-Picked Cotton under a Mulching-Induced Warming Mechanism

The widespread application of mulching film cotton technology in the early 1990s has had a significant impact on the entire cotton plant growing region of Xinjiang. This article qualitatively analyzes the changes in the zoning areas of different suitable zones for cotton and the sowing area during the 1990–2020 period based on cotton zoning indicators and temperature compensation values for mulching film. The aim is to explore the influence of mulching film technology on the zoning area for cotton.
Based on the “Xinjiang Statistical Yearbook” and the “Xinjiang Production and Construction Corps Statistical Yearbook”, we compared the cotton sowing area data from 1981 to 1989 with that of 1990–2020 (Table 6). The results show that after 1990, the sowing area in the most suitable and suitable zones expanded significantly, with the most suitable zone experiencing the largest increase, nearly doubling. The sowing areas in the less suitable and unsuitable zones decreased, indicating that planting activities are increasingly concentrating in the more suitable regions.
Further research into the impacts of factors, including the warming effect of plastic film covering on the area zoned for mechanical cotton picking from 1990 to 2020, reveals that the sowing area in the most suitable zone aligns with the zoned area, demonstrating that the land and thermal resources of this region are being fully utilized (Table 7). The zoned area in the suitable zone has increased compared to the sowing area, suggesting that the potential for regional cotton planting can be further exploited due to mulching. Meanwhile, the decrease in the zoned area relative to the sowing area is more pronounced in the less suitable and unsuitable zones, indicating that the thermal resources in these regions may not be sufficient to support such a scale of planting, and that the scale of planting should be further restricted.

4. Discussion

The Xinjiang region is influenced by its unique topography of “three mountains and two basins”, resulting in a spatial distribution pattern of heat resources (the sum of active temperatures ≥ 10 °C, the average temperature in July, and the length of the growing season) that is generally more abundant in the southern part of Xinjiang, as well as in the plains and basins rather than the mountainous areas. The latest spraying time for a defoliant and the occurrence of the first frost reflect a spatial distribution characteristic of “earlier in Northern Xinjiang and in mountainous areas compared to plains and basins.”
The study has also identified that due to global climate warming, the last frost dates in most areas of Xinjiang have advanced between 1981 and 2020. The sum of active temperatures ≥ 10 °C during the entire cotton plant growth period as well as the duration of the emergence and flowering stages in April–May and the length of the growing season have also increased. This change means that cotton may have more time, better heat conditions, and better areas to grow.
With the warming climate, the heat resources in Xinjiang have improved, resulting in an increasing cultivated area for the most suitable cotton zone (variety: mid-maturity cotton) and the suitable cotton zone (variety: mid–early-maturity cotton), while the area for the unsuitable cotton zone (variety: extra-early-maturity cotton) has decreased. Similar conclusions were drawn by Li et al. [23], who also noted a decreasing trend for the less suitable cotton zone (variety: early-maturity cotton) and the unsuitable cotton zone. The observed increase in the cultivated area for the suitable cotton zone and the decrease in the area for the less suitable cotton zone and unsuitable cotton zone in this study are consistent with the changes in cotton zoning reported by Mai et al. [15]. The study also found that compared to 1981–1989, the sowing area for the most suitable cotton zone increased by 160.4%, and the sowing area for the suitable cotton zone increased by 25.2% during the 1990–2020 period. Meanwhile, the sowing areas for the less suitable cotton zone and unsuitable cotton zone decreased by 10.5% and 5.7%, respectively. Overall, the total sowing area increased by 169.5% during the period. It is worth noting that in addition to the increasing heat resources in Xinjiang after 1990, the rapid development of the cotton industry, the construction of cotton infrastructure, as well as investments in the cotton fields play a significant role in the expansion of the sowing area [41,42]; however, stimulated by market demand and policies, the less suitable cotton zone and risky cotton zone also expanded rapidly, leading to poorer cotton yields and lower profitability, affecting the overall benefits of the Xinjiang cotton region [43]. In particular, since China’s accession to the World Trade Organization (WTO) in 2001, there has been a blind and unreasonable expansion of cotton zones, which has posed severe challenges and impacts on imported cotton and the international market for Xinjiang cotton.
It is worth noting that the extensive use of mulching film technology in the 1990s [44] may have limited but significant positive effects on the expansion of mechanized cotton zones. To better demonstrate the impact of mulching film’s temperature increase effect on zoning and sowing areas, we compared the zoning results from 1990 to 2020 with the actual sowing areas. It was found that under the mechanism of mulching film’s temperature increase effect, the cotton-plantable area in the less suitable zone and unsuitable zone decreased, while the plantable area in the suitable cotton zone increased. This trend is similar to the changing trend of the plantable areas in cotton zones under the background of climate warming studied by Shkolnik et al. [13] and Li et al. [45] (comparing 1990–2015 with 1960–1989); however, for the mid-maturity cotton zone, which has the highest heat demand, the planting boundary and plantable area remain unaffected by the mulching film’s temperature increase effect. This is possibly because the temperature compensation effect of mulching film primarily affects the early stages of cotton plant growth (seedling and budding stages), and there is an upper limit to the compensation of effective air temperature [30]. Despite the mulching film’s temperature increase effect, the most suitable cotton zone has abundant heat resources, but they are not enough to expand the plantable area. Furthermore, the results of the study lead to two key conclusions: (1) the zoning area for the suitable cotton zone (15.81 × 10³ km2) is greater than the sowing area (13.66 × 10³ km2), indicating that climate warming and the widespread application of mulching film technology have provided untapped potential for the expansion of mechanized cotton production in Xinjiang; (2) the zoning areas for the less suitable cotton zone and unsuitable cotton zone (1.53 × 10³ km2 and 2.00 × 10³ km2, respectively) are smaller than the sowing areas (1.79 × 10³ km2 and 2.17 × 10³ km2, respectively), indicating that the current expansion of mechanized cotton zones in the less suitable and unsuitable zones may be unreasonable and should be reduced.
In terms of zoning indicators, this study considered the characteristics of heat demand during the entire cotton plant growth period in Xinjiang for mechanized cotton. The indicators included the last frost date (related to the emergence stage), the April–May sum of active temperatures (related to the budding stage), the average temperature in July (related to flowering), the latest spraying time for a defoliant (related to cotton quality), the length of the growing season (related to the length of the cotton plant growth period), and the sum of active temperatures ≥ 10 °C (related to maturity and the suitability of heat resources for planting). These indicators can meet the requirements for local cotton zoning in Xinjiang. Additionally, considering the impact of the mulching film’s temperature increase effect on the suitable habitat for mechanized cotton, the mulching film temperature increase formula referred to the research results of Qiao et al. [40]. Through trial calculations based on daily average temperatures during the seedling and budding stages of field-grown cotton and the duration of these stages, the formula estimates the number of days of seedling and budding stages for mulching film cotton and calculates the compensation value for an effective air temperature. The formula takes into account the influence of temperature changes on the soil temperature and has been validated through multiple years and trial sites [44]; however, to ensure the timeliness and accuracy of the formula, further validation with experimental data is needed in the future.
It should be noted that the cultivation and distribution of cotton are not only influenced by climate factors mainly related to heat conditions but also closely related to soil, irrigation conditions, planting techniques, production costs, and market conditions [46,47]. Therefore, based on this research, it is crucial to comprehensively consider the integrated impact of natural, social, and economic factors on cotton production in order to develop more suitable cotton zoning and development plans that align with local agricultural production realities. This will be one of the key areas of future research on the development of the cotton industry in Xinjiang.

5. Conclusions

Based on the heat demand characteristics of machine-picked cotton, we analyzed how heat resources changed over time and space in Xinjiang, China, using grid-based calculations from 1981 to 2020. This included factors like the sum of active temperatures ≥ 10 °C, the growing season length, the average temperature in July, the frost-free period, the sum of active temperatures ≥ 10 °C in April–May, and the latest date of defoliant application. Furthermore, we investigated both climate warming and the impact of mulching technology on suitable and cultivating areas for machine-picked cotton. We arrived at the following major conclusions:
(1)
The heat resources in Xinjiang exhibited a spatial distribution pattern of “more in the southern part than the northern part, and more in the plains and basins than in the mountains”. The latest date of defoliant application and the occurrence of the frost-free period showed a spatial distribution pattern of “earlier in Northern Xinjiang than Southern Xinjiang, and earlier in mountain areas than plains and basins”. Under global climate warming, the frost-free period in most parts of Xinjiang advanced, the latest date of defoliant application was postponed, and the growing season lengthened from 1981 to 2020. In addition, the cumulative ≥ 10 °C temperature in April–May, the sum of active temperatures ≥ 10 °C during the entire growth period, and the average temperature in July significantly increased.
(2)
Compared with 1981–1989, there were varying trends in the planting areas of different suitable regions during the years 1990–2020. In the context of climate warming, stimulated by market demand and policy guidance, the planting area of machine-picked cotton in the most suitable region in Xinjiang increased by 160.43%, the area in the suitable region increased by 25.21%, and the areas in the less suitable and unsuitable regions decreased to different degrees. As a result, the total planting area increased by 169.49%; however, there are hidden risks of unreasonable regional planning and blind expansion.
(3)
Mulching technology has a limited but positive effect on the expansion of suitable areas for machine-picked cotton in Xinjiang. During the years 1991–2020, the warming effect of plastic film had little impact on the cultivable area in the most suitable cotton region, while the cultivable area in the suitable region expanded by 15.7% compared to the planting area, suggesting that the warming climate and the extensive application of mulching technology still provide untapped potential for the suitable cotton region of Xinjiang, and it is recommended to expand the cotton planting area in the suitable zone. On the other hand, the cultivable areas in the less suitable and unsuitable regions decreased by 14.5% and 7.8%, respectively, suggesting that the planting areas of machine-picked cotton in both less suitable and unsuitable zones, particularly with the existing regional planning, continue to demonstrate an irrational expansion.
(4)
Finally, these findings reveal the heat demand of machine-picked cotton and the distribution of heat resources in Xinjiang, aiding in more effective resource allocation and cultivation strategy development in similar regions. Insights into the impact of climate warming on planting areas and the positive effects of mulching technology underscore opportunities and challenges for cotton production in Xinjiang and other regions experiencing similar climatic shifts. The increase in planting areas in suitable regions emphasizes the importance of integrating agricultural policies with climate adaptation strategies. Principles regarding heat resource management and cultivation practices in Xinjiang can serve as a foundation for enhancing agricultural resilience and productivity in analogous regions worldwide. To maintain the resilience and productivity of the cotton industry in Xinjiang, proactive land management strategies are of utmost importance to optimize cotton production in response to changing climate patterns. Therefore, policymakers need to prioritize sustainable land allocation practices, ensuring reasonable land distribution appropriate to the prevailing climatic conditions in order to support the sustainable growth of the cotton industry.

Author Contributions

Conceptualization, Y.D. and X.L.; methodology, Y.D., H.Z., G.L. and M.Y.; software, Y.D., H.Z. and G.L.; validation, G.L., M.Y. and X.L.; formal analysis, Y.D. and H.Z., and G.L.; investigation, H.Z., G.L. and M.Y.; resources, Y.D. and G.L.; data curation, Y.D., H.Z. and M.Y.; writing—original draft preparation, Y.D.; writing—review and editing, Y.D. and X.L.; visualization, H.Z. and G.L.; supervision, X.L.; project administration, X.L.; funding acquisition, X.L. All authors have read and agreed to the published version of the manuscript.

Funding

This research received no external funding.

Institutional Review Board Statement

Not applicable.

Informed Consent Statement

Not applicable.

Data Availability Statement

The datasets of the current study are available from the corresponding author on reasonable request. The data are not publicly available due to privacy.

Conflicts of Interest

The authors declare no conflicts of interest.

References

  1. IPCC. Summary for Policymakers. In Climate Change 2021: The Physical Science Basis; Contribution of Working Group I to the Sixth Assessment Report of the Intergovernmental Panel on Climate Change, Masson-Delmotte, V., Zhai, P., Pirani, A., Connors, S.L., Péan, C., Berger, S., Caud, N., Chen, Y., Goldfarb, L., Gomis, M.I., Eds.; Cambridge University Press: Cambridge, UK, 2021; in press. [Google Scholar]
  2. Terando, A.; Easterling, W.E.; Keller, K.; Easterling, D.R. Observed and Modeled Twentieth-Century Spatial and Temporal Patterns of Selected Agro-Climate Indices in North America. J. Clim. 2012, 25, 473–490. Available online: https://journals.ametsoc.org/view/journals/clim/25/2/2011jcli4168.1.xml (accessed on 10 May 2023). [CrossRef]
  3. Kukal, M.S.; Irmak, S.U.S. Agro-Climate in 20th Century: Growing Degree Days, First and Last Frost, Growing Season Length, and Impacts on Crop Yields. Sci. Rep. 2018, 8, 6977. [Google Scholar] [CrossRef] [PubMed]
  4. Quaye, F.; Nadolnyak, D.; Hartarska, V. Climate change impacts on farmland values in the Southeast United States. Sustainability 2018, 10, 3426. [Google Scholar] [CrossRef]
  5. Jiang, T.C.; Wang, B.; Xu, X.J.; Cao, Y.X.; Liu, D.L.; He, L.; Jing, N.; Ma, H.J.; Chen, S.; Zhao, K.F.; et al. Identifying sources of uncertainty in wheat production projections with consideration of crop climatic suitability under future climate. Agric. For. Meteorol. 2022, 319, 108933. [Google Scholar] [CrossRef]
  6. Liu, G.; Mai, J. Habitat shifts of Jatropha curcas L. in the Asia-Pacific region under climate change scenarios. Energy 2022, 251, 123885. [Google Scholar] [CrossRef]
  7. Skaggs, K.E.; Irmak, S. Long-term trends in air temperature distribution and extremes, growing degree days, and spring and fall frosts for climate impact assessments on agricultural practices in Nebraska. J. Appl. Meteorol. Climatol. 2012, 51, 2060–2073. [Google Scholar] [CrossRef]
  8. Li, S.; Shi, X.; Lu, J.; Chen, F.; Chu, Q. Climate warming and crop management: A comprehensive analysis of changes on distribution of suitable areas for double rice. Agronomy 2022, 12, 993. [Google Scholar] [CrossRef]
  9. Edmar, I.E.; Fischer, G.; Velthuizen, H.V.; Walter, C.; Ewert, F. Global hot-spots of heat stress on agricultural crops due to climate change. Agric. For. Meteorol. 2013, 170, 206–215. [Google Scholar] [CrossRef]
  10. Zhao, C.; Liu, B.; Piao, S.; Wang, X.; Lobell, D.B.; Huang, Y.; Asseng, S. Temperature increase reduces global yields of major crops in four independent estimates. Proc. Natl. Acad. Sci. USA 2017, 114, 9326–9331. [Google Scholar] [CrossRef]
  11. Li, S.; Lu, Z.; Zhao, J.; Luo, M.; Chen, F.; Chu, Q. Changes in planting methods will change the potential distribution of rice in South China under climate warming. Agric. For. Meteorol. 2023, 331, 109355. [Google Scholar] [CrossRef]
  12. Hatfield, J.L.; Prueger, J.H. Temperature extremes: Effect on plant growth and development. Weather Clim. Extrem. 2015, 10, 4–10. [Google Scholar] [CrossRef]
  13. Shkolnik, I.M.; Pigol’tsina, G.B.; Efimov, S.V. Agriculture in the arid regions of Eurasia and global warming: RCM ensemble projections for the middle of the 21st century. Russ. Meteorol. Hydrol. 2019, 44, 540–547. [Google Scholar] [CrossRef]
  14. Deng, Z.Y.; Zhang, Q.; Pu, J.Y. The impact of climate warming on crop planting and production in northwestern China. Acta Ecol. Sin. 2008, 28, 3760–3768. Available online: https://kns.cnki.net/kcms/detail/detail.aspx?FileName=STXB200808033&DbName=CJFQ2008 (accessed on 10 May 2023).
  15. Mai, J.F.; Liu, G.L. Modeling and predicting the effects of climate change on cotton-suitable habitats in the Central Asian arid zone. Industial Crops Prod. 2023, 191, 115838. [Google Scholar] [CrossRef]
  16. Chen, P.X.; Mao, W.Y. GIS-based spatial interpolation of air temperature in Xinjiang. Arid Land Geogr. 2012, 35, 438–445. [Google Scholar] [CrossRef]
  17. Li, J.L.; Zhang, S.Q.; Pu, Z.C.; Wang, M.Q.; Wang, S.L.; Zhao, S.Q. Refined spatio-temporal variation analysis of temperature in Xinjiang in recent 50 years. J. Beijing Norm. Univ. (Nat. Sci.) 2013, 36, 229–237. [Google Scholar] [CrossRef]
  18. Pu, Z.C.; Zhang, S.Q.; Li, J.L.; Wang, M.Q. Spatiotemporal change of duration and sum of active temperaturess of temperature≥ 0 °C in Xinjiang in recent 50 years. Arid Zone Res. 2013, 30, 781–788. [Google Scholar] [CrossRef]
  19. Zhang, S.Q. The impact of global warming on frost-free periods from 1961 to 2010 in Xinjiang. Resour. Sci. 2013, 35, 1908–1916. Available online: https://api.semanticscholar.org/CorpusID:202171632 (accessed on 11 May 2023).
  20. Xinjiang Agricultural Association. Cotton-planting areas division and corresponding countermeasures in north Xinjiang. Xinjiang Agric. Sci. 1995, 32, 5–8. Available online: https://kns.cnki.net/kcms/detail/detail.aspx?FileName=XJNX501.001&DbName=CJFQ1995 (accessed on 10 May 2023).
  21. Yao, Y.S. New discussion on cotton-planting areas division in Xinjiang. China Cotton 2001, 28, 2–5. Available online: https://kns.cnki.net/kcms/detail/detail.aspx?FileName=ZMZZ200102000&DbName=CJFQ2001 (accessed on 10 May 2023).
  22. Huang, Z.K.; Cui, D.C. Ecological regionalization of cotton production in China. Cotton Sci. 2002, 14, 185–190. Available online: https://kns.cnki.net/kcms/detail/detail.aspx?FileName=MHXB200203013&DbName=CJFQ2002 (accessed on 10 May 2023).
  23. Li, L.; Wu, H.; Gao, Y.; Zhang, S. Predicting Ecologically Suitable Areas of Cotton Cultivation Using the MaxEnt Model in Xinjiang, China. Ecologies 2023, 4, 654–670. [Google Scholar] [CrossRef]
  24. Pu, Z.C.; Zhang, S.Q.; Bin, J.; Dou, X.Y. The influence of climate warming on the zoning of cotton cultivation in Wuchang area of Xinjiang. Adv. Clim. Chang. Res. 2012, 8, 257–264. [Google Scholar] [CrossRef]
  25. Zhang, S.Q.; Pu, Z.C.; Li, J.L.; Li, X.J.; Ji, R.C.; Wang, M.Q.; Li, Y. Changes in zoning of cotton cultivation in southern Xinjiang under the background of climate warming. Chin. J. Agrometeorol. 2015, 36, 594–601. Available online: https://kns.cnki.net/kcms/detail/detail.aspx?FileName=ZGNY201505009&DbName=CJFQ2015 (accessed on 10 May 2023).
  26. Mauget, S.A.; Adhikari, P.; Leiker, G.; Baumhardt, R.L.; Thorp, K.R.; Ale, S. Modeling the effects of management and elevation on West Texas dryland cotton production. Agric. For. Meteorol. 2017, 247, 385–398. [Google Scholar] [CrossRef]
  27. Dai, L. The initiation and promotion of cotton planting and plastic film mulching in northern Xinjiang. Xinjiang Local Chrononicles 1995, 42–43. Available online: https://kns.cnki.net/kcms/detail/detail.aspx?FileName=XJDF199504019&DbName=CJFQ1995 (accessed on 10 May 2023).
  28. Gao, H.; Yan, C.; Liu, Q.; Ding, W.; Chen, B.; Li, Z. Effects of plastic mulching and plastic residue on agricultural production: A meta-analysis. Sci. Total Environ. 2019, 651, 484–492. [Google Scholar] [CrossRef] [PubMed]
  29. Zhumilaiti, T.; Lin, T.; Yan, C.R.; Dilimaimaiti, D.; Deng, F.N.; Wu, F.Q.; Kong, S.; Tang, Q.X. Effects of plastic film mulching duration on water and heat, cotton water consumption, and yield of cotton fields in Xinjiang. Trans. Chin. Soc. Agric. Eng. 2018, 34, 113–120. [Google Scholar] [CrossRef]
  30. Xiao, M.; Zhong, J.; Zhao, L. Studies on the correlation between cotton soil temperature and air temperature, and the compensating action of soil temperature increase in the mulched cotton field on effective air accumulation temperature. J. Xinjiang Agric. Univ. 1998, 1, 5–9. Available online: https://kns.cnki.net/kcms/detail/detail.aspx?FileName=XJNY804.001&DbName=CJFQ1998 (accessed on 10 May 2023).
  31. Li, Y.C.; Xie, G.H.; Li, X.J.; Yao, Y.L. Cotton zoning in Aksu area of Xinjiang based on GIS. China J. Agrometeorol 2007, 28, 450–452. Available online: https://kns.cnki.net/kcms/detail/detail.aspx?FileName=ZGNY200704027&DbName=CJFQ2007 (accessed on 10 May 2023).
  32. Hu, L.T.; Hu, Q.; Pan, X.B.; Ma, X.Q.; Xu, L.; Wang, X.R.; Zhang, H. Effects of global warming and plastic mulching on cotton-planting zoning with different matures in Xinjiang. Trans. Chin. Soc. Agric. Eng. (Trans. CSAE) 2019, 35, 90–99. [Google Scholar] [CrossRef]
  33. Liu, S.J.; Zhou, G.S.; Fang, S.B. Apreliminary study of the northern planting boundary of rubber tree cultivation in China. Acta Ecol. Sin. 2016, 36, 1272–1280. [Google Scholar] [CrossRef]
  34. Chu, Z.; Guo, J.P.; Zhao, J.F. Impacts of projected climate change on agricultural climate resources in Northeast China. Acta Geogr. Sin. 2017, 72, 1248–1260. [Google Scholar] [CrossRef]
  35. He, L.; Mao, L.X. Change of soybean climatic suitability in Northeast China under climate change. Chin. J. Eco-Agric. 2023, 31, 690–698. [Google Scholar] [CrossRef]
  36. Xiao, M.; Zhong, J.P.; Li, B.C.; Zhao, L. The effect and pattern of soil temperature increase in cotton field mulched with plastic film and the modification on the GOSSYM simulation model. J. Xinjiang Agric. Univ. 1997, 20, 32–39. Available online: https://kns.cnki.net/kcms/detail/detail.aspx?FileName=XJNY704.008&DbName=CJFQ1997 (accessed on 10 May 2023).
  37. DB 65/T 2266-2019; The Cultivation Technique Rules for Mechanically Harvested of Upland Cotton Cultivars. Available online: https://www.waitang.com/report/201600.html (accessed on 10 May 2023).
  38. Salmi, T.; Määttä, A.; Ruoho-Airola, P.; Tuija, T.; Amnell, T. Detecting Trends of Annual Values of Atmospheric Pollutants by the Mann-Kendall Test and Sen’s Solpe Estimates the Excel Template Application MAKESENS. Publications on Air Quality. 2002, p. 31. Available online: https://www.researchgate.net/publication/259356944 (accessed on 10 May 2023).
  39. De Martino, A.; De Martino, D. An introduction to the maximum entropy approach and its application to inference problems in biology. Heliyon 2018, 4, e00596. [Google Scholar] [CrossRef]
  40. Qiao, D.; Bao, L.L.; Lin, T.; Lin, T.; Tang, Q.X. Analysis of the Application and Contribution of Mulching Technology in Typical Mulching Areas of Xinjiang. J. Anhui Agric. Sci. 2023, 51, 226–230. [Google Scholar] [CrossRef]
  41. China’s Historical Review: 60 Years of Development and Retrospect on Xinjiang Cotton Industry. Available online: https://www.sohu.com/a/457450257_501405 (accessed on 26 March 2021).
  42. Xinjiang Statistical Yearbook. 2022. Available online: https://tjj.xinjiang.gov.cn/tjj/tjnj/jump.shtml (accessed on 1 May 2023).
  43. Shi, X.; Wang, C.; Zhao, J.; Wang, K.; Chen, F.; Chu, Q. Increasing inconsistency between climate suitability and production of cotton (Gossypium hirsutum L.) in China. Ind. Crops Prod. 2021, 171, 113959. [Google Scholar] [CrossRef]
  44. Zhao, L.; Zhong, J.P.; Zhao, F.Q.; Bi, S.J.; Duan, R.P.; Liu, Z.Y. GOSSYM and applications under the condition of north Xinjiang cotton region. J. Xinjiang Agric. Univ. 1999, 22, 43–50. Available online: https://kns.cnki.net/kcms/detail/detail.aspx?FileName=XJNY901.008&DbName=CJFQ1999 (accessed on 10 May 2023).
  45. Li, J.L.; Pu, Z.C.; Zhang, S.Q.; Wang, M.Q.; Li, X.J.; Xu, W.X. Impact of climate change on cotton-planting zoning in North Xinjiang during 1961–2012. Cotton Sci. 2015, 27, 22–30, (In Chinese with English abstract). [Google Scholar]
  46. Ndamani, F.; Watanabe, T. Developing indicators for adaptation decision-making under climate change in agriculture: A proposed evaluation model. Ecol. Indic. 2017, 76, 366–375. [Google Scholar] [CrossRef]
  47. Li, N.; Yao, N.; Li, Y.; Chen, J.Q.; Liu, D.L.; Biswas, A.; Li, L.C.; Wang, T.X.; Chen, X.G. A meta-analysis of the possible impact of climate change on global cotton yield based on crop simulation approaches. Agric. Syst. 2021, 193, 103221. [Google Scholar] [CrossRef]
Figure 1. Research area diagram.
Atmosphere 15 00619 g001
Figure 2. Cotton planting distribution map in Xinjiang.
Atmosphere 15 00619 g002
Figure 3. Spatial distribution (a) and temporal trend (b) of growing season length.
Atmosphere 15 00619 g003
Figure 4. Spatial distribution (a) and temporal trend (b) of summed active temperatures.
Atmosphere 15 00619 g004
Figure 5. Spatial distribution (a) and temporal trend (b) of the mean temperature in July.
Atmosphere 15 00619 g005
Figure 6. Spatial distribution (a) and temporal trend (b) of the last frost day.
Atmosphere 15 00619 g006
Figure 7. Spatial distribution (a) and temporal trend (b) of April–May summed active temperatures.
Atmosphere 15 00619 g007
Figure 8. Spatial distribution (a) and temporal trend (b) of defoliant spray time.
Atmosphere 15 00619 g008
Figure 9. Machine-picked cotton distribution map in Xinjiang.
Atmosphere 15 00619 g009
Table 1. Primary indicators for mechanized cotton zoning.
RegionalizationCrop VarietyClimatological Growing Season Length (d) Mean Temperature
in July (°C)
Sum of Active Temperatures ≥ 10 °C
Most suitable zoneMedium maturing≥200≥30≥4500
Suitable zoneMedium–early maturing180–20026–303800–4500
Less suitable zoneEarly maturing175–18024–263600–3800
Unsuitable zoneExtra-early maturing165–17523–243200–3600
Table 2. Auxiliary indicators for mechanized cotton zoning.
RegionalizationLast Frost Day (d) April–May Sum Active Temperatures (°C)Defoliant Spray Time (d)
Most suitable zoneBefore 1 April>500After 18 September
Suitable zone1–10 April400–50010–18 September
Less suitable zone11–20 April350–40027 August–9 September
Unsuitable zoneAfter 20 April<350Before 27 August
Table 3. Geospatial model of zoning indicators and geographical factors in Xinjiang during the years 1981–2020.
Zoning IndicatorsGeographical Relationship ModelCorrelation CoefficientF-Value
Sum of active temperatures ≥ 10 °C−0.041φh − 2.779φ2 + 10,606.1820.935347.56
Climatological growing season length−0.02φh − 0.074φλ + 531.2910.80297.46
Mean temperatures in July−1.666 × 10⁻⁴φh − 7.676 × 10⁻³φ2 + 46.070.905227.335
Defoliant spray time−0.001φh − 0.039φ2 + 348.7960.853133.605
April–May sum active temperatures −0.007φh − 0.565φ2 + 1731.550.895204.101
Last frost day0.049φλ + 0.001φh − 105.2280.830117.011
Note: In the chart model, φ represents latitude, λ represents longitude, and h represents elevation.
Table 4. Based on combination weights of machine-derived cotton zoning indicators, the analytic hierarchy process, and the entropy weight method.
Regional IndicatorSum of Active Temperatures ≥ 10 °CClimatological Growing Season LengthMean Temperature in JulyDefoliant Spray TimeApril–May Sum of Active TemperaturesLast Frost Day
Weight0.330.260.160.070.080.1
Table 5. Machine-picked cotton area and proportion in Xinjiang.
RegionalizationArea (×103 km2)Proportions of the Total Area (%)
Most suitable zone3.9218.0
Suitable zone13.6663.6
Less suitable zone2.008.3
Unsuitable zone2.1710.1
Table 6. Change in each cotton region in Xinjiang from 1981 to 2020.
RegionalizationArea/(×103 km2)Percentage of Increasing Area (%)
1981–19891990–2020Increasing Area
Most suitable zone1.393.922.23160.4
Suitable zone10.9113.662.7525.2
Less suitable zone2.001.79−0.21−10.5
Unsuitable zone2.302.17−0.13−5.7
Table 7. Change in each machine-picked cotton region in Xinjiang from 1990 to 2020.
RegionalizationArea/(×103 km2)Percentage of Increasing Area (%)
1990–2020Plastic Mulching on Increasing TemperatureIncreasing Area
Most suitable zone3.923.9200.0
Suitable zone13.6615.812.1515.7
Less suitable zone1.791.53−0.26−14.5
Unsuitable zone2.172.00−0.17−7.8
Disclaimer/Publisher’s Note: The statements, opinions and data contained in all publications are solely those of the individual author(s) and contributor(s) and not of MDPI and/or the editor(s). MDPI and/or the editor(s) disclaim responsibility for any injury to people or property resulting from any ideas, methods, instructions or products referred to in the content.

