Article

COVID-19 Lockdown Air Pollution Reduction: Did It Impact the Number of COPD Hospitalizations?

1
Department of Internal Medicine, Faculty of Medicine, University of Novi Sad, 21000 Novi Sad, Serbia
2
Institute for Pulmonary Diseases of Vojvodina, 21204 Sremska Kamenica, Serbia
3
Faculty of Medicine, University of Novi Sad, 21000 Novi Sad, Serbia
4
Department of Psychology, College of Human Development, 11000 Belgrade, Serbia
5
Department of Pharmacology, Toxicology and Clinical Pharmacology, Faculty of Medicine, University of Novi Sad, 21000 Novi Sad, Serbia
6
Department of Social Pharmacy, Faculty of Pharmacy, University of Business Academy, 21000 Novi Sad, Serbia
7
Department of Biomedical Sciences, College of Vocational Studies for the Education of Preschool Teachers and Sports Trainers, 24000 Subotica, Serbia
8
Department of Higher Medical School, Academy of Applied Studies Belgrade, 11000 Belgrade, Serbia
9
Department of General Medicine and Geriatrics, Faculty of Medicine, University of Novi Sad, 21000 Novi Sad, Serbia
10
Health Center “Novi Sad”, 21000 Novi Sad, Serbia
11
Department of Hygiene, Faculty of Medicine, University of Novi Sad, 21000 Novi Sad, Serbia
12
Institute of Public Health of Vojvodina, 21000 Novi Sad, Serbia
13
Research Center on Environmental and Occupational Health, School of Public Health, Université Libre de Bruxelles (ULB), 1050 Brussels, Belgium
*
Author to whom correspondence should be addressed.
Atmosphere 2024, 15(5), 593; https://doi.org/10.3390/atmos15050593
Submission received: 28 March 2024 / Revised: 1 May 2024 / Accepted: 10 May 2024 / Published: 13 May 2024
(This article belongs to the Special Issue Exposure Assessment of Air Pollution (2nd Edition))

Abstract

:
In addition to the detrimental health consequences, the early stages of the COVID-19 pandemic have yielded unforeseen benefits in terms of reducing air pollution emissions. This study investigated air pollution changes in Novi Sad, Serbia, during the COVID-19 lockdown (March–June 2020) and their correlation with acute exacerbations of chronic obstructive pulmonary disease (AECOPD) hospitalizations. Using quasi-Poisson generalized linear models (GLM) and distributed lag non-linear models (DLNM), we examined the relationship between the number of AECOPD hospitalizations and the concentrations of selected air pollutants (PM10, PM2.5, SO2, and NO2) from March to June of 2019, 2020, and 2021. During the COVID-19 lockdown, significant reductions in most air pollutant concentrations and the number of AECOPD hospitalizations were observed. However, neither the study year nor its interaction with air pollutant concentration significantly predicted AECOPD hospitalizations (p > 0.05). The 95% confidence intervals of the relative risks for the occurrence of AECOPD hospitalizations at each increase in the examined air pollutant by 10 μg/m3 overlapped across years, suggesting consistent effects of air pollution on the risk of AECOPD hospitalizations pre-pandemic and during lockdown. In conclusion, reduced air pollution emissions during the COVID-19 lockdown did not lead to a statistically significant change in the number of AECOPD hospitalizations.

1. Introduction

The Coronavirus Disease 2019 (COVID-19) pandemic has emerged as the most significant global concern for humanity in recent decades. In spite of the severe health implications, the early stages of the COVID-19 pandemic yielded unforeseen benefits in terms of mitigating air pollution emissions and curbing energy usage [1,2]. This was due to the implementation of self-isolation and social distancing measures, movement restrictions, and a reduction in traffic and industrial activity, all in order to prevent the transmission of the infection [3]. Hence, one study determined that during the COVID-19 lockdown in India, PM10 (particulate matter ≤10 μm in diameter) concentrations decreased by 55%, PM2.5 (particulate matter ≤2.5 μm in diameter) concentrations decreased by 49%, NO2 (nitrogen dioxide) concentrations decreased by 60%, and SO2 (sulfur dioxide) concentrations decreased by 19% [4]. Similar findings regarding the decline in particulate and gaseous air pollutant concentrations were observed in studies conducted in Thailand [5], Egypt [6], China [7], and Serbia [8]. The health benefits of such reduced air pollution emissions on the decrease in overall morbidity and mortality were promptly demonstrated by several studies [8,9,10].
Air pollution is currently the most significant external risk factor for human health globally, contributing to the onset of numerous chronic diseases in adults and children (mainly respiratory, cardiovascular, neuro-degenerative and malignant diseases) [11]. Additionally, it can exacerbate existing chronic conditions and lead to acute episodes, ultimately resulting in adverse health outcomes. Exposure to air pollution can affect the onset and progression of chronic obstructive pulmonary disease (COPD) [12]. While various toxic substances contribute to air pollution, studies have identified particulate matter (PM) and gaseous pollutants (such as SO2, ozone (O3), and NO2) as primary contributors to the development of acute exacerbations of chronic obstructive pulmonary disease (AECOPD). The short-term exposure to these pollutants leads to increased emergency medical service interventions, outpatient visits, hospitalizations, and ultimately, a rise in COPD-related mortality [12,13,14,15,16]. COPD ranks third among all causes of death attributable to air pollution [17]. The mechanisms through which air pollutants contribute to AECOPD development involve inducing oxidative stress and inflammation in the airways, airway hyperreactivity, and a reduction in the effectiveness of local protective mechanisms [18]. Therefore, any intervention aimed at reducing air pollution concentrations could potentially have a beneficial impact on the morbidity and mortality associated with AECOPD.
Considering this, the primary objective of our study was to determine whether there was a reduction in air pollution emissions on the territory of the City of Novi Sad, Serbia, during the initial months of the COVID-19 pandemic (lockdown period), as well as whether exposure to air pollution in that period affected the risk for the development of AECOPD hospitalizations of non-infectious etiology.

2. Materials and Methods

This time-series is part of a larger research project examining the impact of air pollution and meteorological factors on the frequency, mortality, and clinical course of non-infectious AECOPD hospitalizations of patients from the City of Novi Sad, Serbia, who were treated at the Institute for Pulmonary Diseases of Vojvodina (IPDV).

2.1. Study Time Frame

The first case of COVID-19 infection in the Republic of Serbia was recorded on 6 March 2020, followed shortly thereafter by the implementation of a lockdown period aimed at preventing the spread of the COVID-19 infection. The lockdown period lasted until June 2020. Considering the objectives of this study, we collected average daily concentrations of selected air pollutants and the number of AECOPD hospitalizations of non-infectious etiology that were realized at the IPDV during the period from March to June 2020 (during the COVID-19 lockdown), as well as during the same period in 2019 (the pre-pandemic year) and 2021 (the second pandemic year without a lockdown).

2.2. Study Population

The study sample consisted of hospitalizations of patients with non-infective AECOPD that occurred during the aforementioned time period at IPDV. IPDV is a reference healthcare, educational, and research institution serving all patients residing in the territory of the City of Novi Sad. Inclusion study criteria were: residency of hospitalized patients within the territory of the City of Novi Sad, previous diagnosis of COPD, hospitalization due to AECOPD, and based on laboratory and bacteriological analyses upon admission, it was assessed that AECOPD was caused by a non-infective agent.

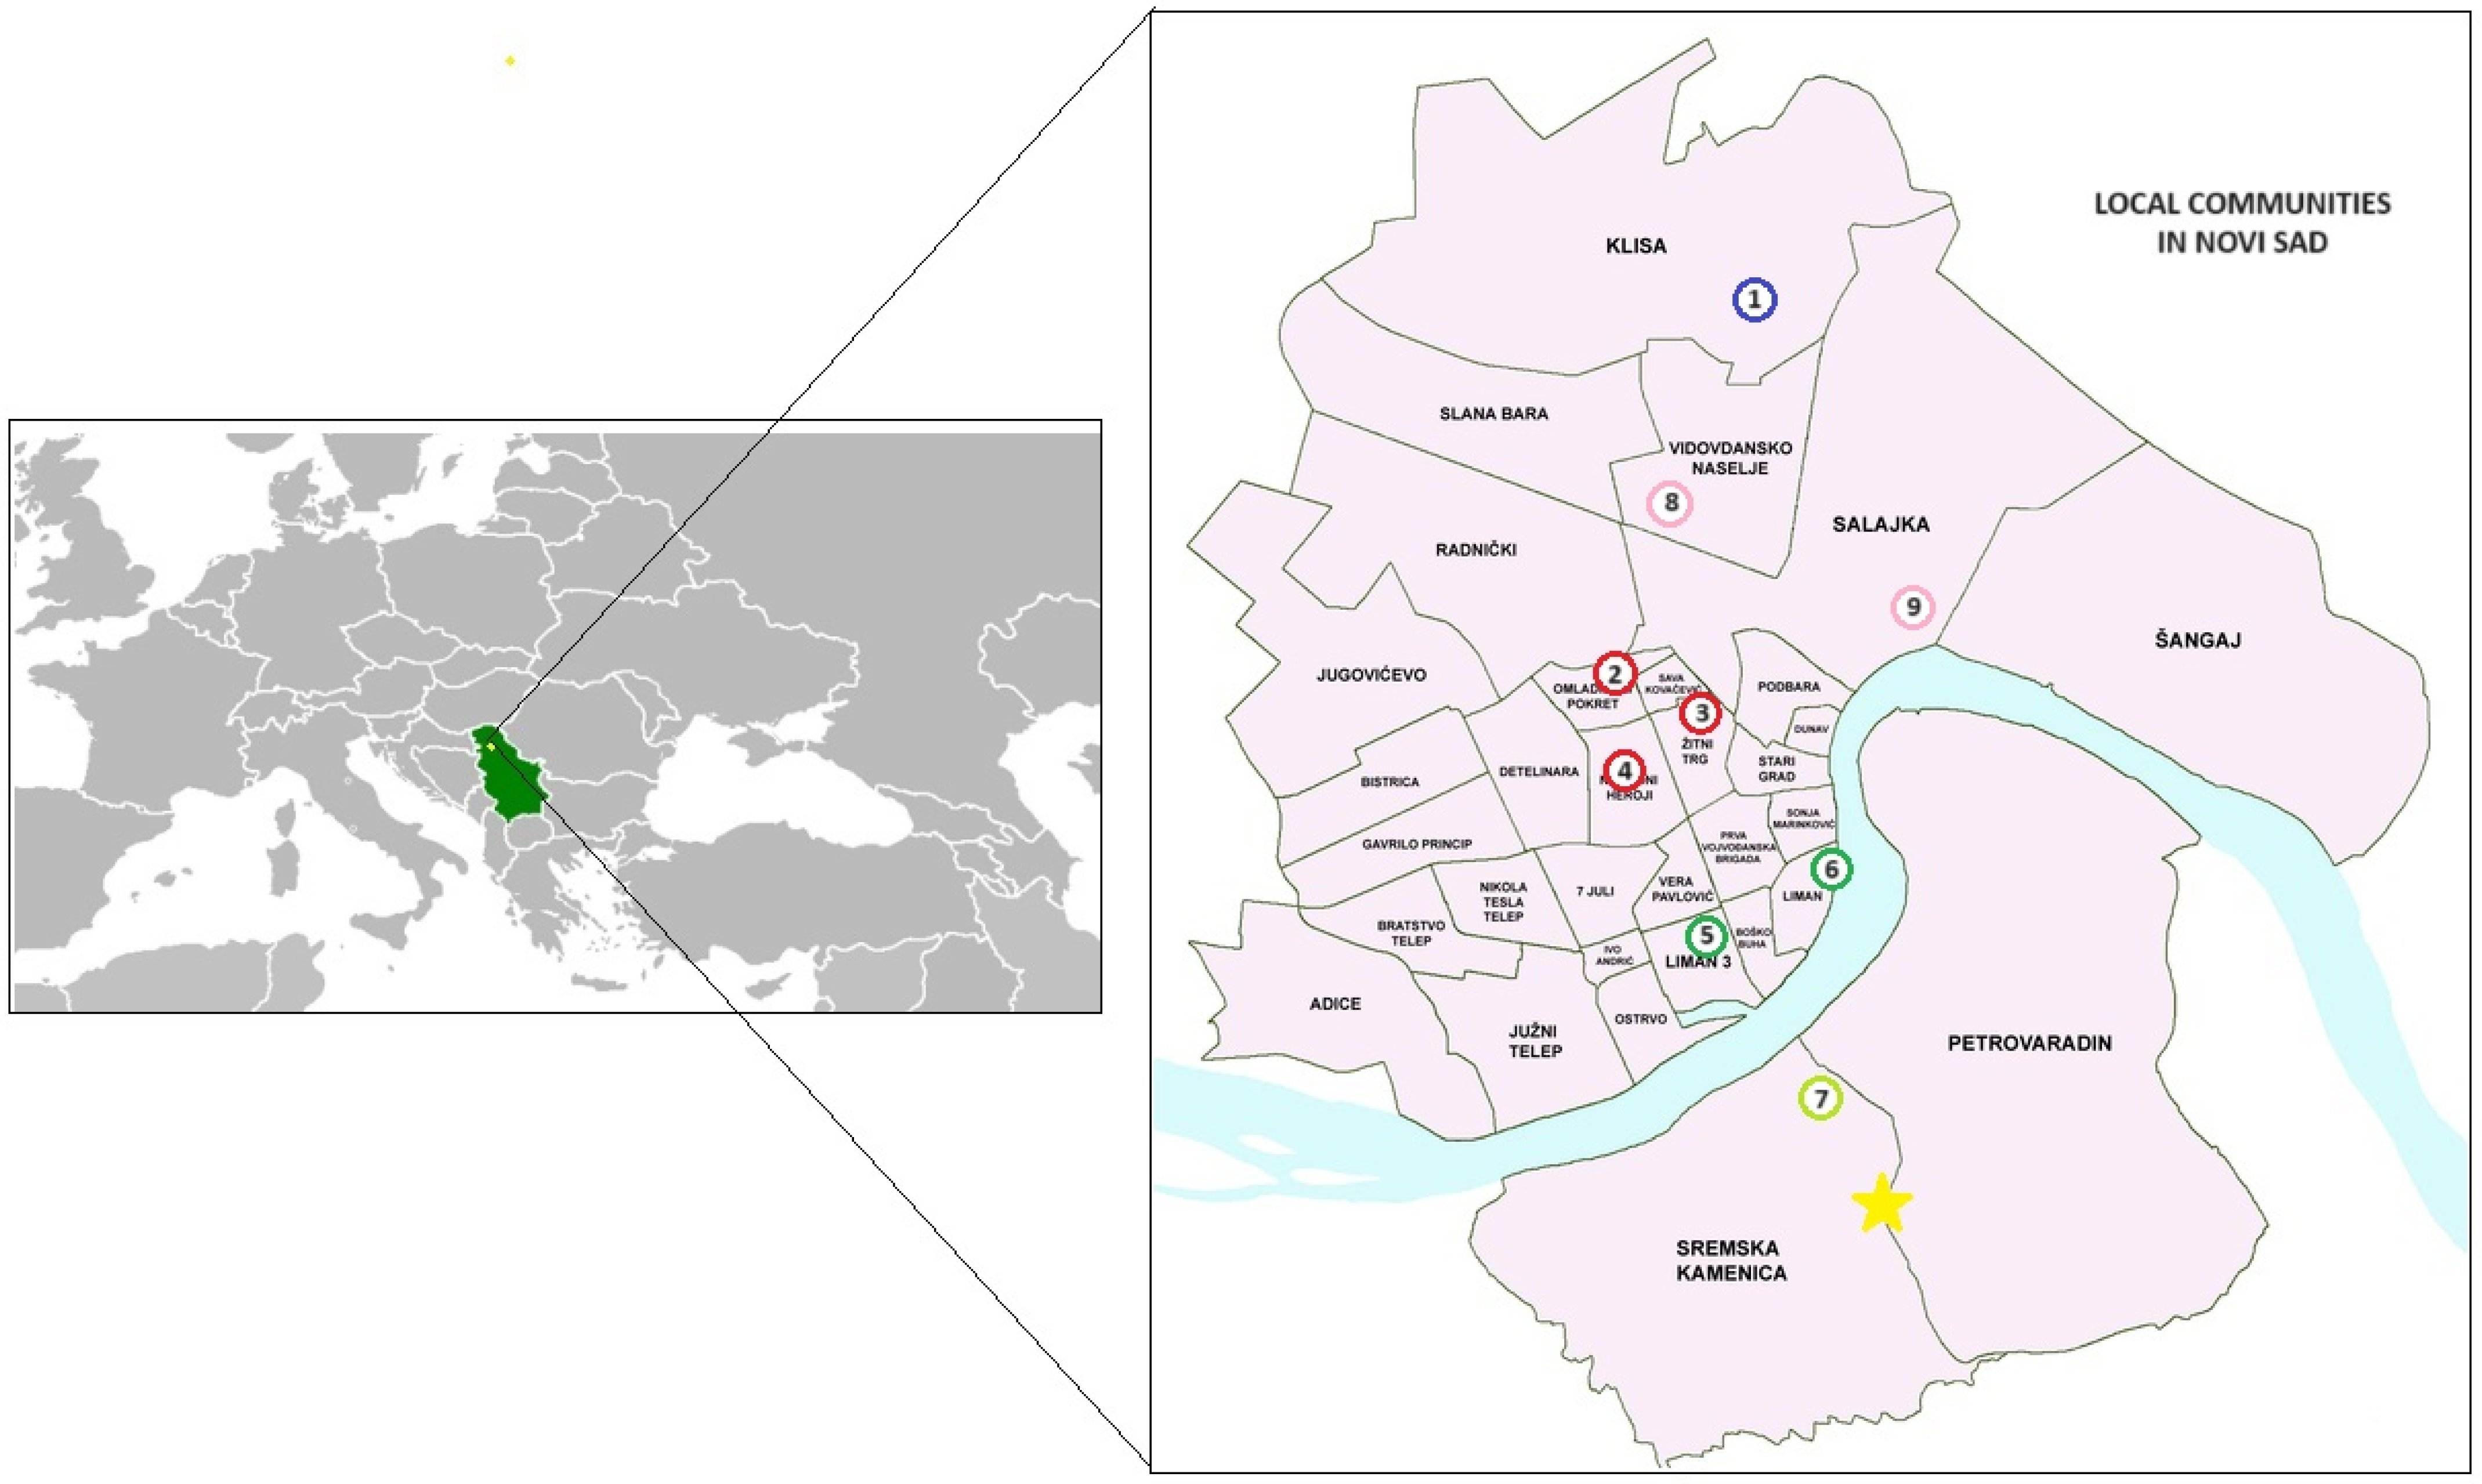
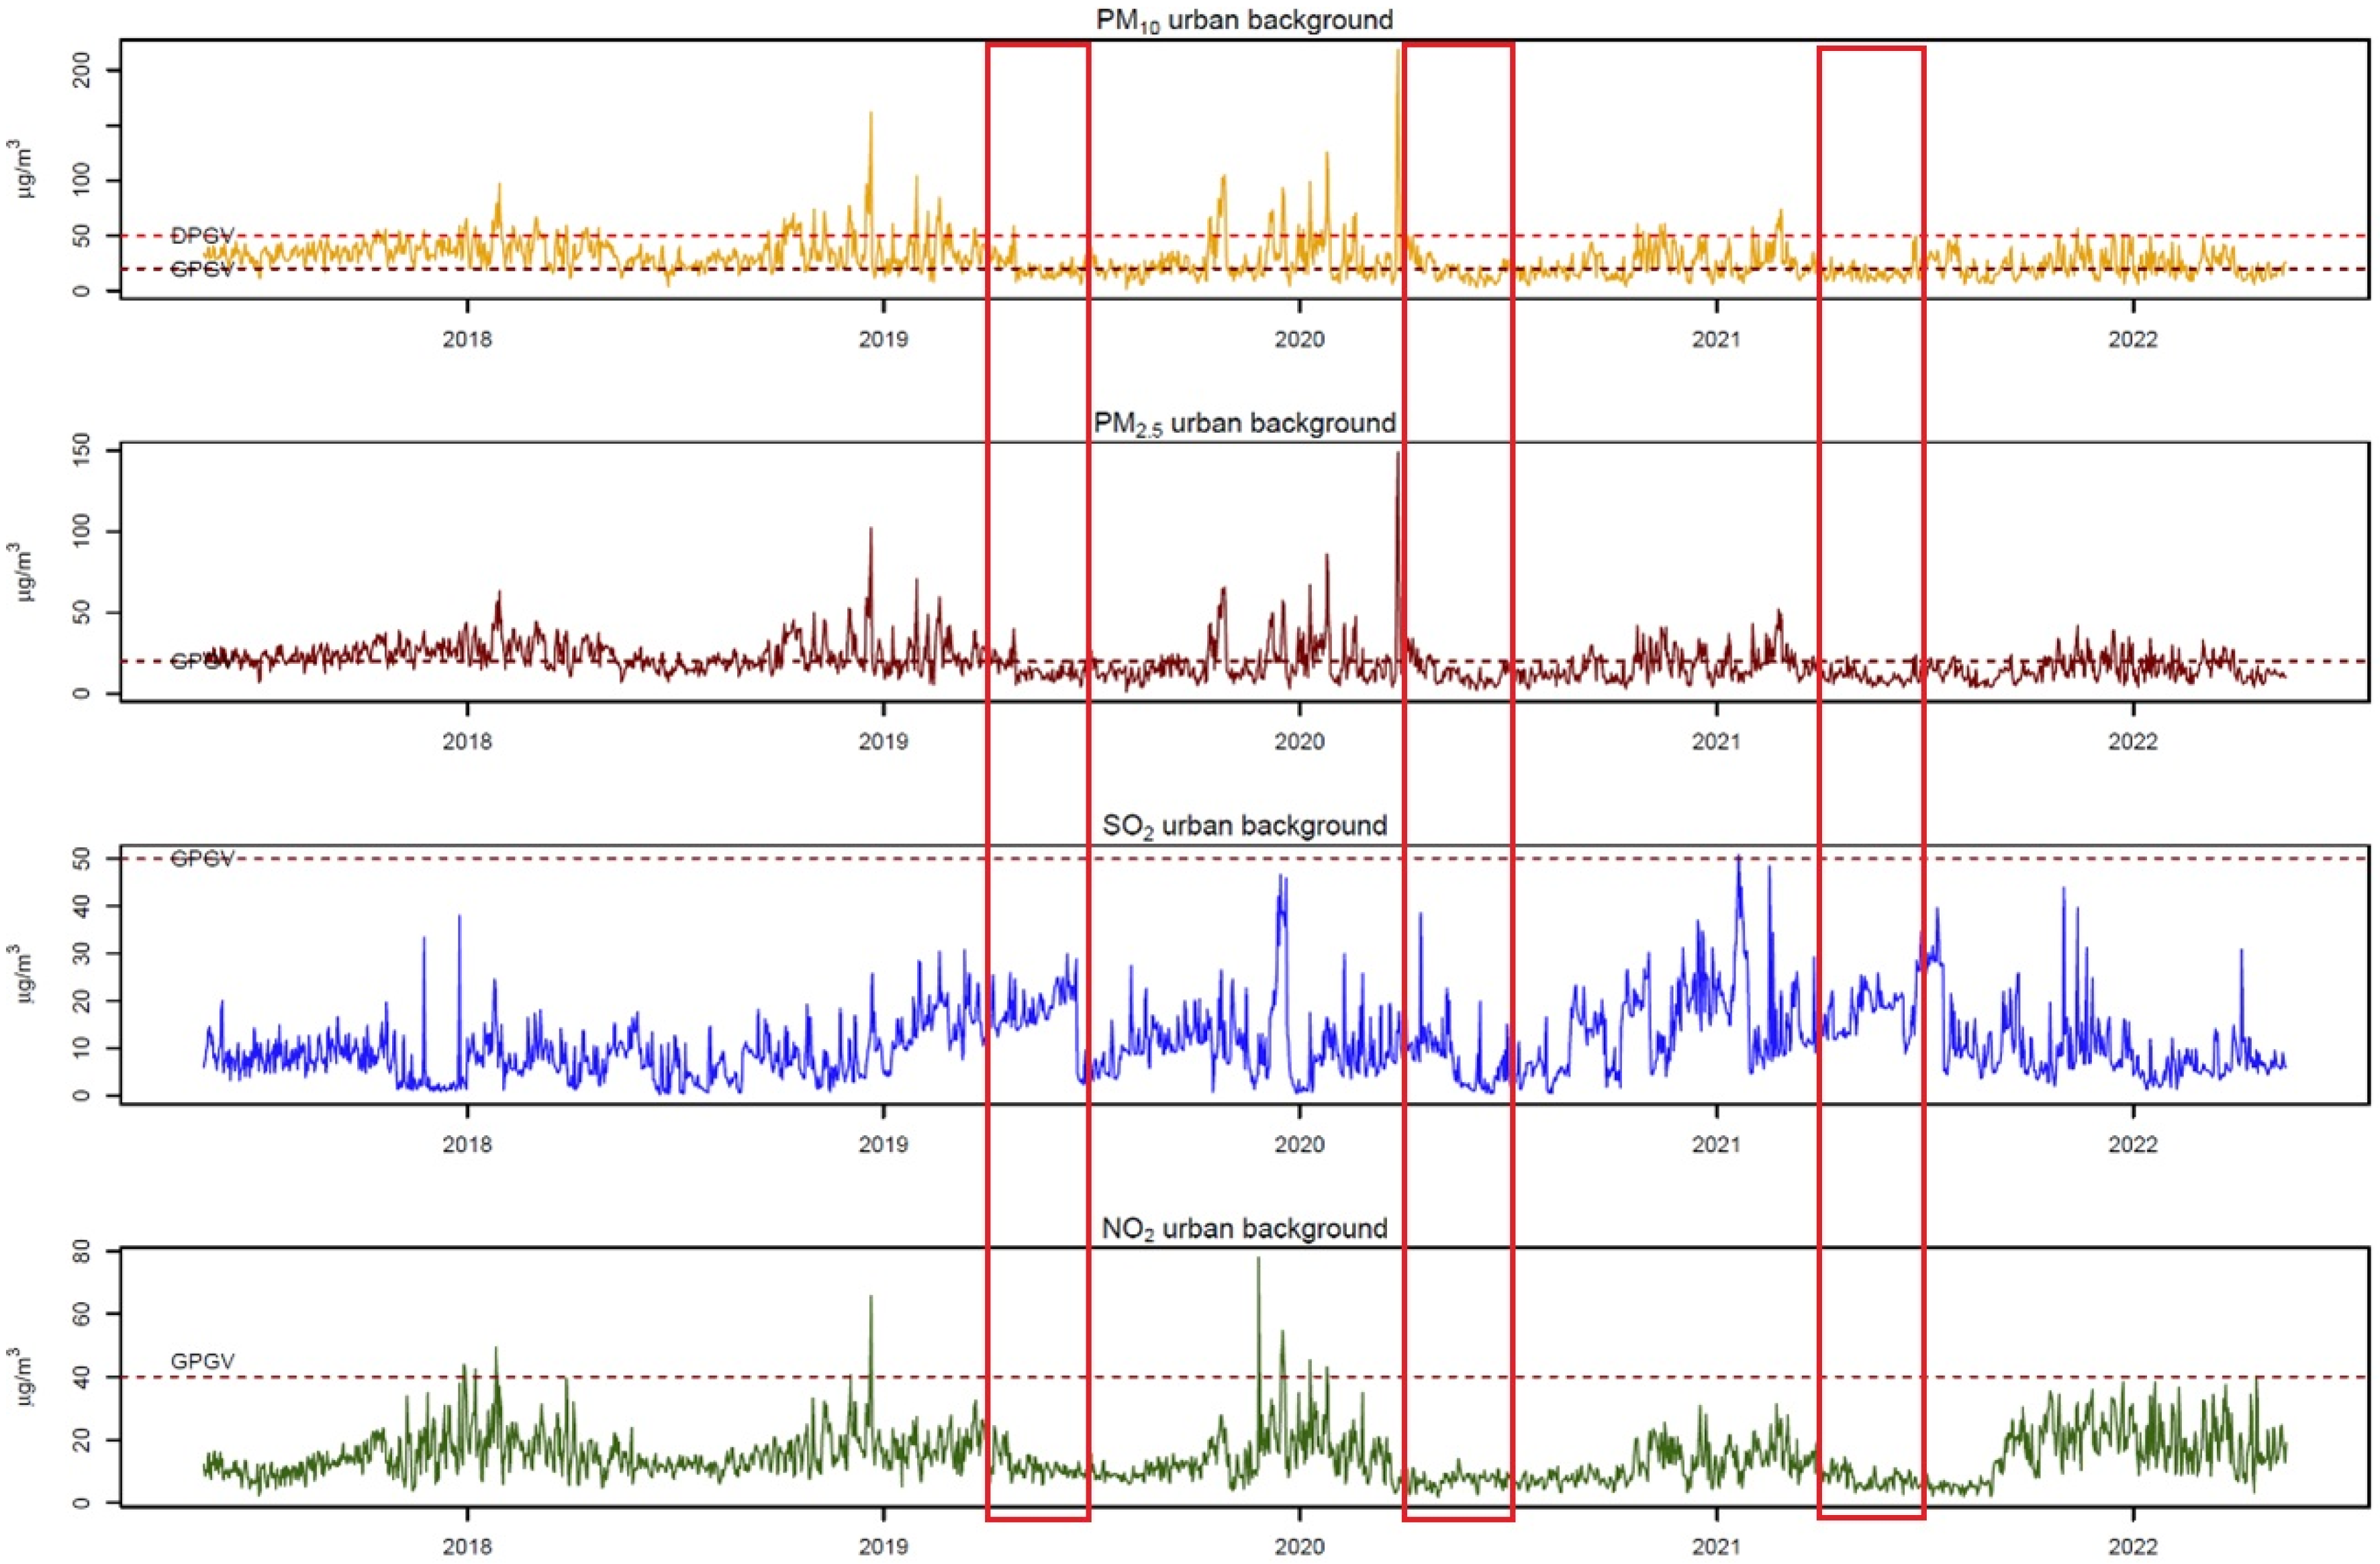
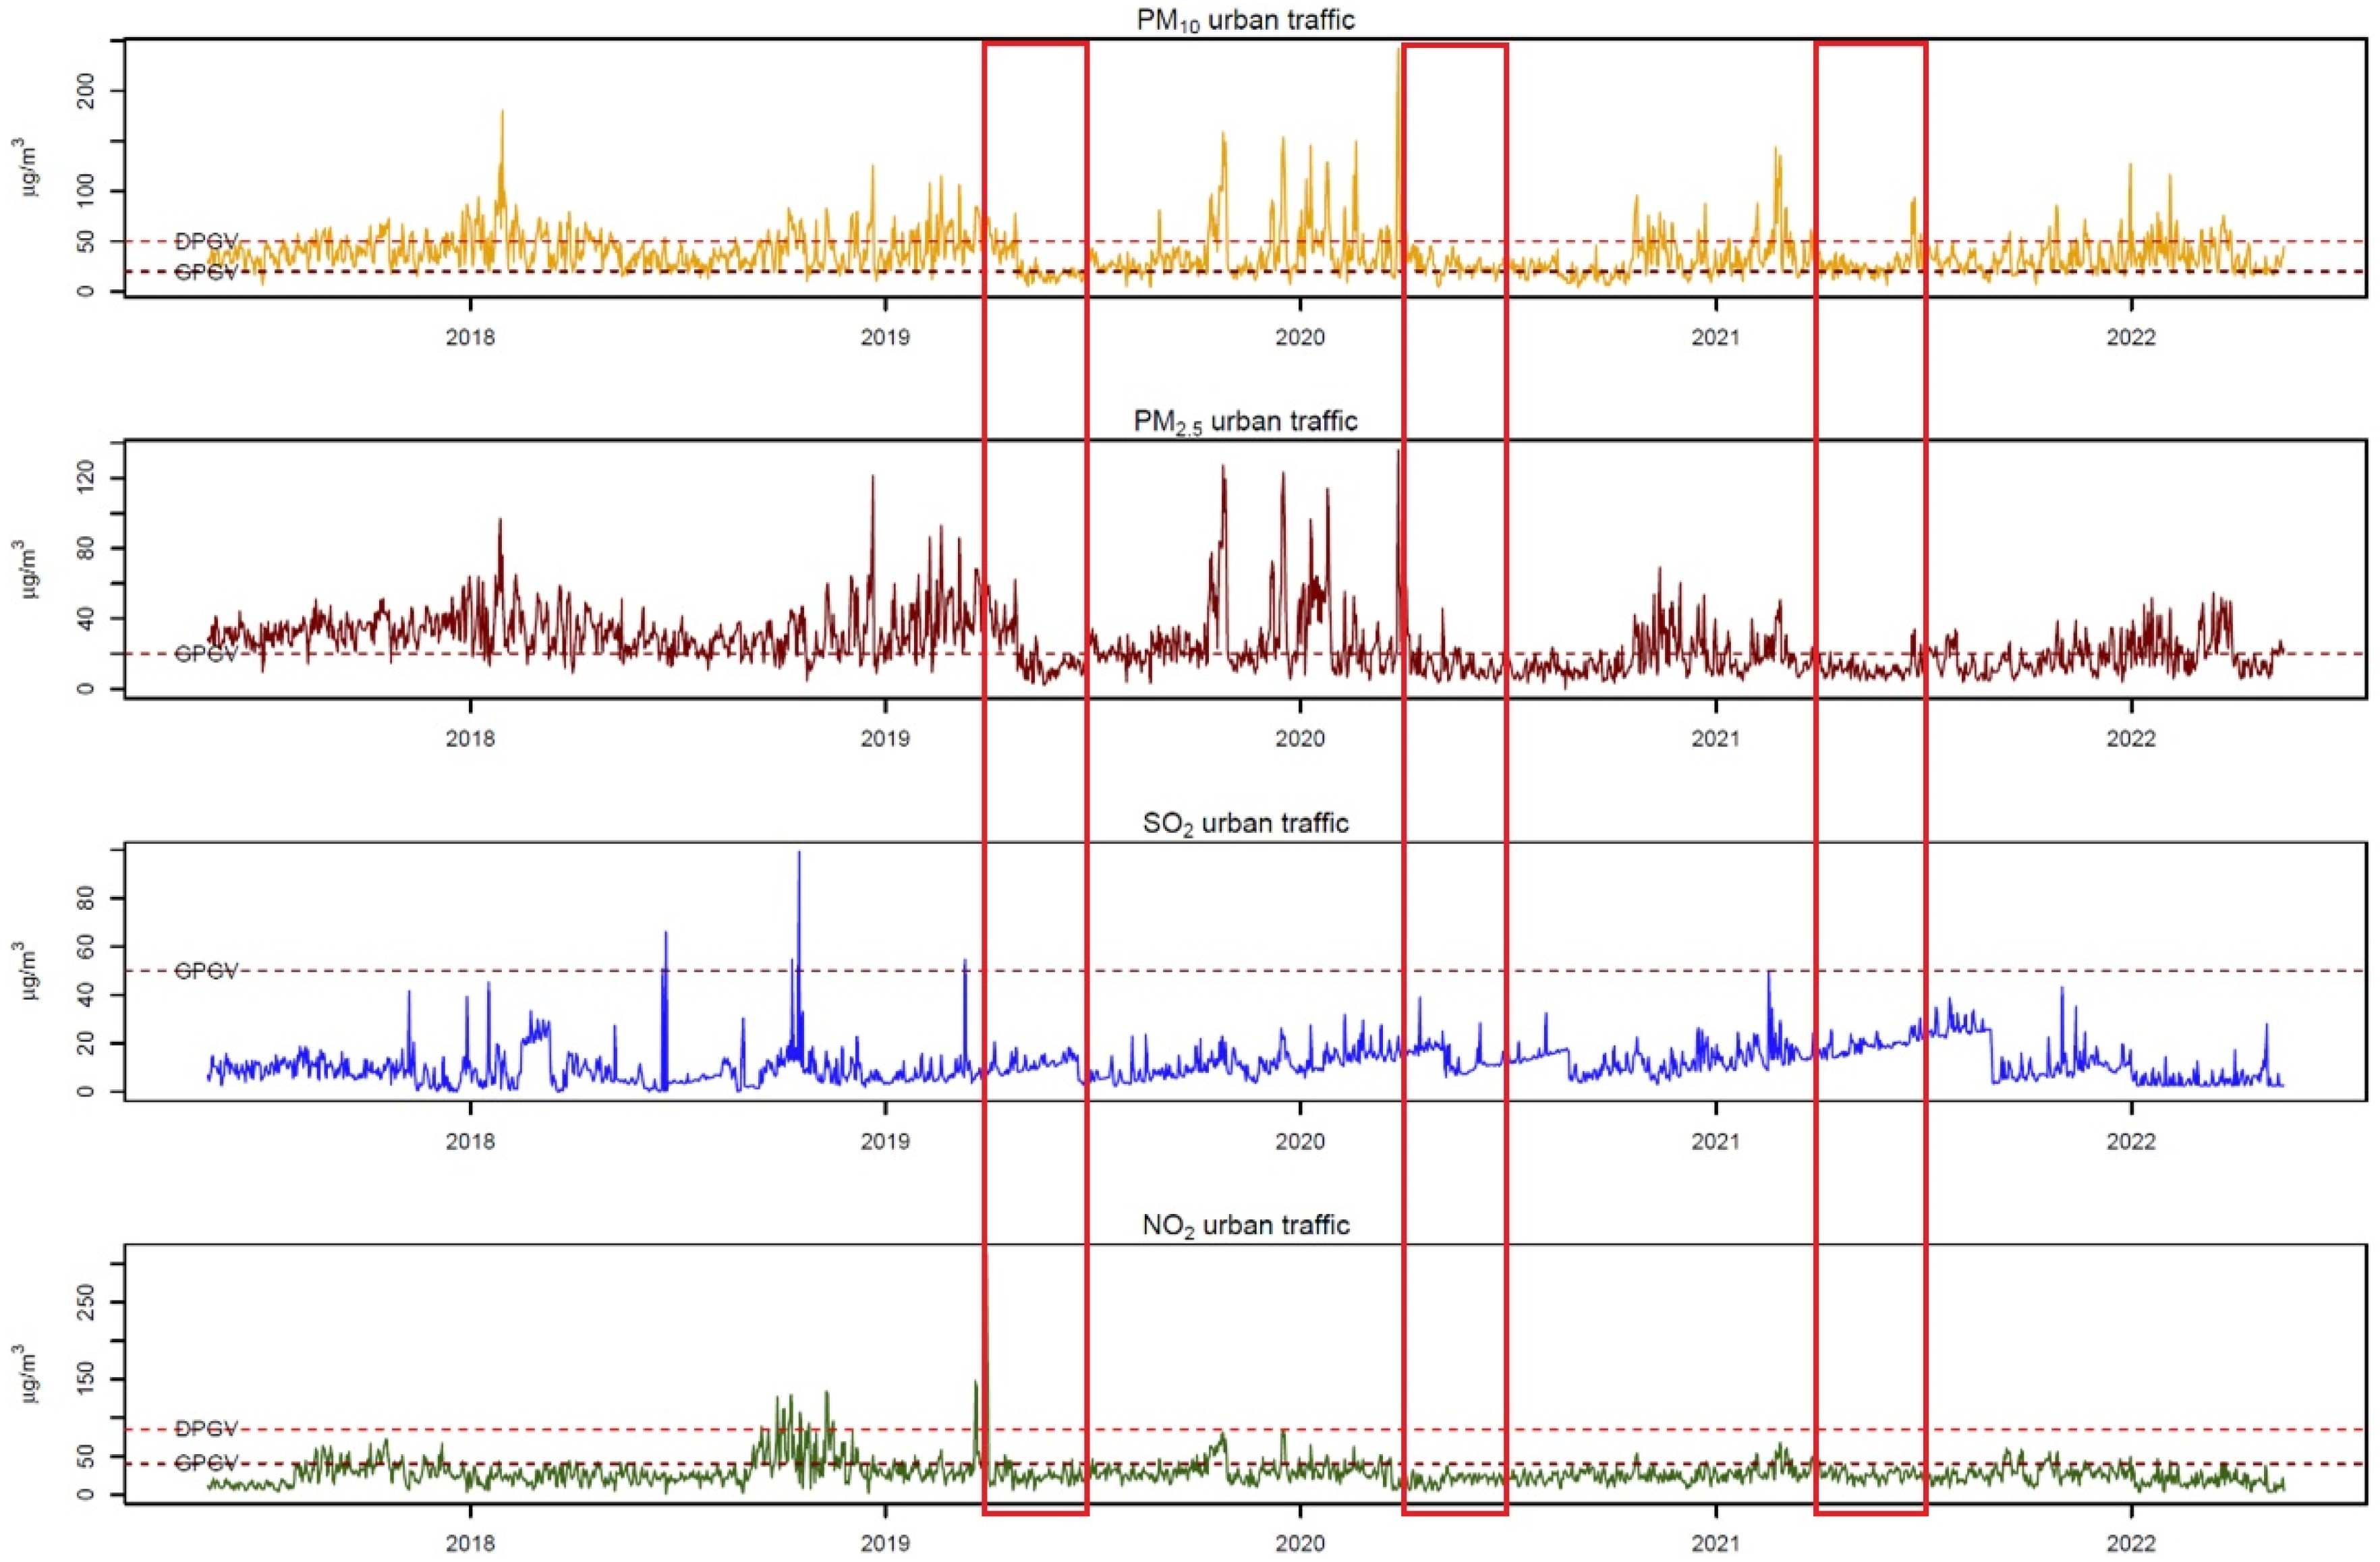
2.3. Study Location and Air Pollution Data

This study analyzed the AECOPD hospitalizations of patients residing in the territory of the City of Novi Sad. Novi Sad is the capital and the main economic, cultural, tourist, sports, scientific, and industrial center of the Serbian autonomous province of Vojvodina. It is situated on the Danube River’s course through Serbia. A part of the city on the left bank of the Danube lies in the Pannonian Plain, while on the right bank stretches the mountain massif of Fruška Gora (up to 250 m above sea level). Novi Sad belongs to the urban-industrial type of agglomeration, with administrative and business facilities, as well as residential buildings, concentrated in the city’s central area. In the peripheral parts of the agglomeration, there are individual residential buildings as well as facilities intended for commercial and industrial activities (especially on the northern side of the city). Green areas are distributed along the banks of the Danube River, as well as in parks and suburbs within the city. The city has a dense traffic network of main and secondary roads, with incompletely developed transportation infrastructure on the outskirts, along with numerous agricultural and forested areas [19].
During the selected temporal interval, mean 24-h concentrations (expressed in μg/m3) of the air pollutants selected for this investigation (PM10, PM2.5, SO2, and NO2) were systematically gathered from monitoring stations strategically positioned throughout the urban landscape of the City of Novi Sad. These stations are strategically located to discern air pollution primarily attributed to proximal emission sources, notably vehicular traffic (urban traffic, UT), and ambient air pollution typical of residential urban locales, stemming from diverse pollution sources (urban background, UB). Figure 1 depicts the spatial configuration of monitoring stations utilized for sampling air pollutant concentrations within the Novi Sad metropolitan region.
The standard gravimetric measurement method was used to determine the average daily concentration of PM10 or PM2.5 in the ambient air, in accordance with the standardized method SRPS EN 12341:2015. Measurements were performed using the Sven Leckel LVS3 air sampling device, with a specially designed inlet operating at a nominal flow rate of 2.3 m3/h, during a nominal sampling period of 24 h [19]. The determination of SO2 concentration in 24-h air samples was conducted in accordance with SRPS ISO 4219:1997 and points 1, 2, 3, and 7 of standard SRPS ISO 4221:1997 using the air sampling devices AT-801 and AT-801x2. Additionally, continuous, automatic measurement was carried out in accordance with standard SRPS ISO 14212:2013/AC:2015 using the measurement instrument API Teledyne T100 snl 621 [20]. The determination of NO2 concentration in 24-h air sampling was conducted in accordance with the Sampling and Determination Instructions for Nitrogen Dioxide Q3.XИ.341 (spectrophotometric method) using the air sampling device AT 801x2. Furthermore, automatic 24-h continuous measurement of NO2, nitrogen monoxide, and nitrogen oxide (NOx) concentrations was conducted in accordance with standard SRPS EN 14211:2013 using the measurement instrument API Teledyne T200 sn 2045 [20].

2.4. Statistical Analysis

In order to achieve the goals of our study (effects of exposure to air pollution on the risk of AECOPD hospitalizations during the COVID-19 lockdown), a quasi-Poisson generalized linear model (GLM) and a distributed lag nonlinear model (DLNM) were implemented. GLMs were first constructed for each of the observed predictors, where the concentrations of air pollutants (PM10(UB), PM10(UT), PM2.5(UB), PM2.5(UT), SO2(UB), SO2(UT), NO2(UB), and NO2(UT)) and the number of AECOPD admissions during 2019, 2020, and 2021 were analyzed. The year of study was included as a confounding variable in the used formulas (if this factor was statistically significant, it indicated that the number of AECOPD admissions significantly differed across the three observed years), along with the interaction between predictors and year (the statistically significant effect of this interaction would suggest that the effect of predictors significantly varied depending on the year), whether admission occurred on weekdays or weekends, and the natural spline of dates for controlling seasonal factors. Lag effects were not considered in these analyses, and the relationship between predictors and criteria was treated as linear, as such a relationship was determined to be optimal. Quasi-Poisson regression was used, and the formulas of the models used are as follows:
log(g[E(yt)]) = α + β × PM10(UB)t,l + Day + Year + Predictor:Year + ns(Date, df = 3),
log(g[E(yt)]) = α + β × PM10(UT)t,l + Day + Year + Predictor:Year + ns(Date, df = 3),
log(g[E(yt)]) = α + β × PM2.5(UB)t,l + Day + Year + Predictor:Year + ns(Date, df = 3),
log(g[E(yt)]) = α + β × PM2.5(UT)t,l + Day + Year + Predictor:Year + ns(Date, df = 3),
log(g[E(yt)]) = α + β × SO2(UB)t,l + Day + Year + Predictor:Year + ns(Date, df = 3),
log(g[E(yt)]) = α + β × SO2(UT)t,l + Day + Year + Predictor:Year + ns(Date, df = 3),
log(g[E(yt)]) = α + β × NO2(UB)t,l + Day + Year + Predictor:Year + ns(Date, df = 3),
log(g[E(yt)]) = α + β × NO2(UT)t,l + Day + Year + Predictor:Year + ns(Date, df = 3),
where yt—criteria (the dependent variable); [E(yt)]—expected number of AECOPD hospitalizations on a certain day t during 2019, 2020, and 2021; log—link function; α—intercept; β—regression coefficient of the predictor; PM10—average concentration of particulate matter with a size less than or equal to 10 μm in the urban background (UB) or urban traffic (UT) surrounding on day t; PM2.5—average concentration of particulate matter with a size less than or equal to 2.5 μm in the urban background (UB) or urban traffic (UT) surrounding on day t; SO2—average concentration of sulfur dioxide in the urban background (UB) surrounding on day t; NO2—average concentration of nitrogen dioxide in the urban background (UB) or urban traffic (UT) surrounding on day t; Day—predictor (workday or weekend on day t); Year—the year of day t (2019, 2020 or 2021); Predictor:Year—interaction of the air pollutant and year; ns(Date)—natural spline of dates to control seasonal factors; and df—degree of freedom.
To determine the impact of exposure to air pollution during the COVID-19 lockdown in Serbia (March–June 2020) on the number of AECOPD hospitalizations, we employed DLNM, taking into account the number of AECOPD admissions realized only in the periods equivalent to the 2020 lockdown (periods from March to June of 2019 and 2021). The formulas of the utilized models were identical to those previously mentioned (1–8), excluding the year and the predictor/year interaction as predictors. The relative risk (RR) for AECOPD hospitalization was calculated for each 10 μg/m3 increase in the air pollutant concentration. If the 95% confidence intervals (CI) of RR did not overlap, the result could be considered statistically significant. This would indicate that the lower limit of one year’s CI is greater than the upper limit of the other year’s CI. Before concluding that there was a statistically important difference in the number of AECOPD admissions that could be attributable to air pollution exposure, this would have to be the case for at least one pair of years (2019 and 2020 or 2020 and 2021).
All analyses were performed within R: A language and environment for statistical computing, version 3.0.2 (RC Team, Vienna, Austria, R foundation for Statistical Computing, 2019) utilizing the “dlnm” package [21].

3. Results

Descriptive Statistics

The analysis of medical records revealed 252 AECOPD admissions to IPDV during the examined time frame (period March–June of 2019, 2020, and 2021). After excluding those hospitalizations for which it was determined that the reason for admission was AECOPD caused by an infectious etiology, a total of 112 AECOPD hospitalizations of non-infectious etiology were available for final analysis.
Considering that the COVID-19 lockdown period lasted in Serbia from March to June 2020, Table 1 displays the total number of AECOPD hospitalizations during the March–June period of 2019, 2020, and 2021, which were the years of interest for this specific research. A pairwise comparison revealed a statistically significant difference in the average number of daily AECOPD admissions in the period of March–June between 2019 and 2020 (2020 had significantly fewer admissions, p = 0.041), while such a difference was not observed between 2020 and 2021 (p = 0.715), although there was a difference in the absolute number of AECOPD hospitalizations (22 hospitalizations in 2020 compared to 41 hospitalizations in 2021).
During the observed time periods, the average daily concentrations of air pollutants in the UB environment were: 21.91 μg/m3 for PM10, 14.90 μg/m3 for PM2.5, 13.99 μg/m3 for SO2, and 10.38 μg/m3 for NO2 (Figure 2). The average daily concentrations of air pollutants in the UT environment were: 32.01 μg/m3 for PM10, 18.72 μg/m3 for PM2.5, 14.33 μg/m3 for SO2, and 28.01 μg/m3 for NO2 (Figure 3). As shown in Table 2, the majority of the examined air pollutants had statistically significant lower concentrations during the lockdown period in Serbia (from March to June 2020) compared to the same period in 2019, while for certain air pollutants, this trend continued into the year 2021.
In the GLM used, the year of admission (2019, 2020, or 2021) and the interaction between the pollutant concentration and year were included as the confounding variables. If these factors were found to be statistically significant, it would imply that the number of AECOPD admissions significantly varied statistically across the observed years or that the effect of the predictor varied statistically significantly by year. In all GLMs, we implemented these; however, these factors lacked statistical significance (p > 0.05).
Using DLNM, the RR for AECOPD hospitalization of non-infectious etiology was then calculated for each 10 μg/m3 increase in the air pollutant concentration between March and June of 2019, 2020, and 2021. The results are displayed in Figure 4. For two RRs to be statistically significantly different, their 95% CI must not intersect. As shown in Figure 4, all 95% CIs overlap, which indicates that RRs during the three observed periods did not differ statistically significantly, meaning that exposure to air pollution during the lockdown period did not have a statistically significant effect on the change in the number of AECOPD hospitalizations compared to the same period in 2019 and 2021. The illustration pertaining to SO2(UT) demonstrates that for each 10 μg/m3 increase during March–June 2019, the RR for AECOPD hospitalization of non-infectious etiology was 0.05 (95% CI 0.00–7.03), whereas for the same period in 2020, the RR was 1.41 (95% CI 0.03–72.12). Although the calculated RR values are different, the 95% CIs overlap, indicating that there were no statistically significant differences between the effects of SO2(UT) during these two time periods on the incidence of AECOPD hospitalizations.

4. Discussion

Our research had two primary objectives: to determine whether there was a reduction in the concentration of air pollutants during the COVID-19 lockdown and to ascertain whether there was a change in the number of non-infectious AECOPD hospitalizations compared to the same period in the year before and the year after the COVID-19 lockdown.
The analysis of the results pointed out that the average daily concentrations of the majority of the air pollutants investigated were lower during the May–June 2020 period compared to the corresponding time in the previous year. The greatest effect was observed for gaseous air pollutants (51% reduction in SO2(UB) concentrations and 42% reduction in NO2(UT) concentrations). These results confirm the positive effects of COVID-19 lockdown on the reduction in air pollution emissions, mainly due to reduced traffic activity as a result of movement restrictions and increased remote work, along with decreased industrial and construction activities due to the closure or reduced capacity of many businesses. Furthermore, the average daily concentrations of PM2.5 were even lower in 2021 compared to the same period in 2020. It is challenging to pinpoint the precise explanation for this, but a combination of complex associated effects of meteorological factors and air pollution, changes in emissions from diverse sources, technological advancements, and behavioral shifts among the general population (reminiscent of the long-term consequences of previous lockdown measures) could have contributed to the observed differences in PM2.5 concentrations between the two periods.
In a recently published European Commission report on the environmental and climate status in the Western Balkan countries [22], the impact of the COVID-19 lockdown on air quality in other Serbian cities (Belgrade and Užice) was also analyzed. It was found that there was a reduction in the concentration of traffic-related air pollutants (NO and NO2) by 50% to 80% (depending on the location of the monitoring station) compared to the same period from 2015 to 2019. During the initial months of the COVID-19 pandemic, air pollution levels decreased in almost all other regions of the world, with the greatest reductions observed in NO2 emissions due to traffic restrictions. Muhammad et al. [23] determined that during the lockdown in Italy, Spain, France, and China, NO2 emissions were reduced by 20–30%; in the United States, the emission of this gas was reduced by about a quarter compared to the historical average [24]; in Egypt, a reduction of 15–33% was observed compared to the five pre-pandemic years [6]; and in the United Kingdom, emissions of all nitrogen oxides from traffic have been reduced by 32–50% [25]. Considering the greater variety of emission sources, the decrease in particulate air pollution was somewhat lower but still significant [1], which is similar to our findings. Mexico City experienced a statistically significant decrease in particulate air pollution during the first year of the pandemic compared to 2019 [26], while in Palermo, Italy, PM10 concentrations decreased by 45% [27], and in Kazakhstan, the concentration of PM2.5 decreased by 21% compared to the pre-lockdown period [28]. Analyzing the levels of air pollution during the lockdown in 278 Chinese cities, Yumin et al. [7] determined a drastic reduction in all observed environmental air pollutants, with the exception of ozone (on average, PM2.5 concentrations decreased by 14.3 μg/m3, PM10 by 22.2 μg/m3, NO2 by 17.7 μg/m3, and SO2 concentrations decreased by 2.9 μg/m3).
In our study, there was a lower number of AECOPD hospitalizations during the COVID-19 lockdown compared to the same period of the previous and following years. A reduced number of AECOPD hospitalizations during COVID-19 lockdown was observed in several different Balkan countries, such as Greece [29] and Slovenia [30], as well as in several other countries across the globe—in Hong Kong [31], United Kingdom [32], and Singapore [33].
There are several potential explanations for these results. Firstly, the emergence of a new, previously unknown infectious disease imposed the need for reorganization of healthcare services worldwide, including in Serbia and the City of Novi Sad, redirecting a large portion of human and economic resources towards the care of COVID-19 patients. This also led to changes in the behavior of chronic patients, who avoided visits to healthcare facilities to reduce the objective risk of potential SARS-CoV-2 virus infection [34]. As a result, it is possible that some patients with mild exacerbations of COPD treated their symptoms at home without seeking help from healthcare institutions or managed their symptoms through remote communication with a doctor (telemedicine) [35]. Next, it is possible that there was indeed a decrease in the frequency of AECOPD in the initial stages of the pandemic, as the implementation of personal protective measures, such as wearing masks, frequent hand washing and disinfection, as well as adherence to social distancing measures, could have had an effect on preventing the transmission of other respiratory infectious agents that act as triggers for AECOPD, such as influenza viruses and RSV [32,33]. It has also been hypothesized that patients had higher adherence to prescribed inhalation therapy [34] and that they quit smoking or reduced the number of cigarettes smoked per day due to fear of exacerbating their underlying condition in pandemic conditions [32]. Another potential explanation for the reduced number of AECOPD cases during the initial months of the COVID-19 pandemic is the under-recognition and underdiagnosis of these conditions due to similar clinical manifestations [36], as well as increased mortality at home before patients sought medical attention or had the opportunity to receive medical assistance [37].
Due to the study’s design, we were unable to analyze the effects of previously discussed factors on the frequency of AECOPD hospitalizations in our sample, but we did examine the impact of exposure to air pollution during COVID-19 lockdown on the risk of AECOPD hospitalization. After the implementation of “dlnm,” no statistically significant difference was observed in the risk of hospitalization for AECOPD of non-infectious etiology when comparing the pre-pandemic period to the lockdown period, suggesting that exposure to reduced levels of air pollution did not result in a reduced number of severe AECOPD.
Although less available, there are studies that have examined the effect of air pollution reduction during the early stages of the COVID-19 pandemic on morbidity and mortality due to respiratory diseases. During the period of traffic restrictions, Irish researchers observed a statistically significant decrease in average annual NO2 concentrations, which was associated with a decrease in hospitalizations for chronic respiratory diseases [38,39]. Similarly, a French study discovered that a 22% reduction in PM2.5 emissions in 2020 was associated with a 3.2% reduction in pediatric physician visits due to worsening asthma symptoms, while a 32% reduction in NO2 concentrations was associated with 1.5% fewer hospitalizations for respiratory diseases compared to the pre-pandemic period [40]. However, only a few studies have examined the impact of air pollution during the COVID-19 pandemic on AECOPD-related morbidity and mortality. According to a study from Iran, the number of AECOPD hospitalizations attributable to NO2 exposure was 21% lower in 2020 than in 2019 under conditions of reduced air pollutant concentrations [41]. Another Iranian study established that the AECOPD-related mortality rate attributed to PM2.5 in 2019 was 25.18%, while in 2020 it was 22.5% [42]. As a consequence of the reduction of NO2 emissions during the lockdown, a study from China discovered that 920 AECOPD-related deaths were avoided [43]. Another case study from China found that a reduction in PM2.5 emissions was associated with an 18% decrease in AECOPD-related premature mortality [44]. In the study by Ko et al. [45], it was determined that during the first year of the pandemic, there was a statistically significant decrease in the concentrations of PM10, NO2, and SO2 compared to the three years preceding the pandemic, which contributed 3.8%, 4%, and 11%, respectively, to the reduction in AECOPD hospitalizations. A study from Greece found that exposure to NO2, PM2.5, and PM10 (but not SO2 exposure) was positively associated with the average number of hospital admissions due to AECOPD in 2020, whereby this number decreased statistically significantly during the lockdown compared to the control pre-pandemic period, which the authors explained by the potential effects of reducing air pollution emissions as well as avoiding seeking medical care by elderly patients [46]. However, none of the mentioned studies used “dlnm” models in the statistical analysis, so it is difficult to compare such results with the results of our research. This also applies to the study by Chan et al. [31], in which, just like in ours, exposure to air pollution during the first three months of the pandemic did not have a statistically significant effect on the number of AECOPD hospitalizations.
There are several potential explanations for these results of our study, some of which represent the limitations of the study at the same time. Firstly, we analyzed only AECOPD hospitalizations of non-infectious etiology, thus excluding the potential interactions between air pollutants and infectious agents. Then, we observed a further decrease in the concentration of some air pollutants (such as PM2.5(UB) and PM2.5(UT)) in the year after the COVID-19 lockdown, which may have influenced the results as well. Furthermore, changes in meteorological conditions during the COVID-19 lockdown could have influenced the risk of non-infective AECOPD hospitalizations, regardless of the level of air pollution. It is also important to consider the lag effects of changes in air pollution levels and their impact on health outcomes. While short-term exposure to reduced air pollution levels may not immediately translate into a decrease in severe AECOPD cases (those requiring hospitalizations), sustained improvements in air quality may eventually lead to tangible health benefits. Furthermore, cumulative exposure to air pollutants over time may have lasting effects on respiratory health, making it challenging to observe immediate improvements in AECOPD hospitalization rates during a relatively short-term lockdown period. Finally, none of the previously referenced studies, including our own, included in the analysis individual exposure to indoor air pollution. Although in nearly all regions where the lockdown was implemented, the population’s exposure to ambient air pollution decreased, little is known about the effects of exposure to air pollution within the indoor environments where individuals reside. Even though there are assumptions that measures implemented to prevent the spread of SARS-CoV-2 infection did not contribute to the reduction in indoor air pollution [26], one Chinese study that monitored PM2.5 concentrations in 147 homes from 30 villages using special analyzers found that during the lockdown there was no statistically significant increase in the concentration of these particles compared to the period before the pandemic [47], whereas another Chinese study demonstrated that during the lockdown in China there was a significant increase in the PM2.5 indoor concentrations [48]. Notwithstanding, considering the recommendation to stay indoors, it is plausible that the populace may have been subjected to prolonged exposure to certain levels of indoor air contaminants, rendering them vulnerable to the adverse consequences of air pollution. Other limitations of our study must be considered when interpreting the results, such as the small number of AECOPD hospitalizations originating from a single center, the inability to assess the actual individual exposure to air pollution, and the inability to control other variable factors that could affect individual exposure, such as housing conditions, air conditioning in patients’ living spaces, time spent outdoors, wearing a face mask and applying other measures of personal protection, socio-economic living conditions, and so on.

5. Conclusions

In this study, there was a notable reduction in the concentrations of the majority of the selected air pollutants (particularly gaseous ones) during the COVID-19 lockdown compared to the same period in the pre-pandemic year. Despite the significantly lower number of hospitalizations for AECOPD during March–June of 2020 compared to the same period in 2019, exposure to reduced concentrations of ambient air pollutants during the COVID-19 lockdown did not lead to a statistically significant alteration in the relative risk of AECOPD hospitalizations stemming from non-infectious causes.
Undeterred by these findings and considering the previously given explanations of the results and the study’s limitations, the positive effects of reducing air pollution emissions on human health cannot be underestimated, which is why public health initiatives should continue to focus on improving air quality. This entails primarily implementing stringent emission controls, promoting clean energy technologies, and encouraging sustainable transportation practices.
It is also important to acknowledge that short-term reductions in air pollution levels may not result in an immediate decrease in AECOPD hospitalization rates; thus, it is important to recognize the long-term benefits of environmental interventions aimed at reducing air pollution levels. Future longitudinal research tracking changes in air quality over time is essential for evaluating the effectiveness of air pollution reduction on AECOPD morbidity and guiding future policy decisions aimed at mitigating air pollution effects.

Author Contributions

Conceptualization, J.J., M.J. and M.I.; methodology, J.J., M.J., M.I. and D.Ž.; validation, J.J., M.J., M.I., S.S. and D.Ž.; investigation, J.J., D.Ž., V.M.J., M.S., B.K. and I.M.; writing—original draft preparation, J.J.; writing—review and editing, J.J., M.J., M.I., D.Ž., V.M.J., M.S., S.S. and V.Ć.; visualization, J.J. All authors have read and agreed to the published version of the manuscript.

Funding

This research received no external funding.

Institutional Review Board Statement

This research was conducted in accordance with the Declaration of Helsinki, and approved by the Institutional Review Board and Ethics Committee of Institute for Pulmonary Diseases of Vojvodina (protocol code No. 113-III/1, date of approval 6 April 2021).

Informed Consent Statement

Patient consent was waived due to the observational nature of the study.

Data Availability Statement

Publicly available data on air pollutant concentrations can be retrieved from the Serbian Environmental Protection Agency’s website (http://www.sepa.gov.rs/ (accessed on 18 August 2022)). The data presented in this study are available upon request from the corresponding author.

Acknowledgments

We would like to thank Bojan Janičić, for the statistical analysis.

Conflicts of Interest

The authors declare no conflicts of interests.

References

  1. Jevtic, M.; Matkovic, V.; van den Hazel, P.; Bouland, C. Environment-lockdown, air pollution and related diseases: Could we learn something and make it last? Eur. J. Public Health 2021, 31 (Suppl. S4), iv36–iv39. [Google Scholar] [CrossRef] [PubMed]
  2. Primorac, D.; Roberts, R.J. The impact of COVID-19 on sustainable development. Croat. Med. J. 2022, 63, 213–220. [Google Scholar] [CrossRef] [PubMed]
  3. Chen, F.; Liu, Y.; Ya, B.; He, J.; Leng, T.; Sun, Y.; Xin, Q. Latest Effective Measures to Combat COVID-19: A Review. Iran. J. Public Health 2021, 50, 640–648. [Google Scholar] [CrossRef] [PubMed]
  4. Kumari, P.; Toshniwal, D. Impact of lockdown measures during COVID-19 on air quality- A case study of India. Int. J. Environ. Health Res. 2022, 32, 503–510. [Google Scholar] [CrossRef] [PubMed]
  5. Wetchayont, P. Investigation on the impacts of COVID-19 lockdown and influencing factors on air quality in greater Bangkok, Thailand. Adv. Meteorol. 2021, 2021, 6697707. [Google Scholar] [CrossRef]
  6. Mostafa, M.K.; Gamal, G.; Wafiq, A. The impact of COVID 19 on air pollution levels and other environmental indicators—A case study of Egypt. J. Environ. Manag. 2021, 277, 111496. [Google Scholar] [CrossRef] [PubMed]
  7. Yumin, L.; Shiyuan, L.; Ling, H.; Ziyi, L.; Yonghui, Z.; Li, L.; Yangjun, W.; Kangjuan, L. The casual effects of COVID-19 lockdown on air quality and short-term health impacts in China. Environ. Pollut. 2021, 290, 117988. [Google Scholar] [CrossRef] [PubMed]
  8. Dragic, N.; Bijelovic, S.; Jevtic, M.; Velicki, R.; Radic, I. Short-term health effects of air quality changes during the COVID-19 pandemic in the City of Novi Sad, the Republic of Serbia. Int. J. Occup. Med. Environ. Health 2021, 34, 223–237. [Google Scholar] [CrossRef] [PubMed]
  9. Chen, K.; Wang, M.; Huang, C.; Kinney, P.L.; Anastas, P.T. Air pollution reduction and mortality benefit during the COVID-19 outbreak in China. Lancet Planet. Health 2020, 4, e210–e212. [Google Scholar] [CrossRef]
  10. Khomsi, K.; Najmi, H.; Amghar, H.; Chelhaoui, Y.; Souhaili, Z. COVID-19 national lockdown in morocco: Impacts on air quality and public health. One Health 2021, 11, 100200. [Google Scholar] [CrossRef]
  11. Mitreska Jovanovska, E.; Batz, V.; Lameski, P.; Zdravevski, E.; Herzog, M.A.; Trajkovik, V. Methods for Urban Air Pollution Measurement and Forecasting: Challenges, Opportunities, and Solutions. Atmosphere 2023, 14, 1441. [Google Scholar] [CrossRef]
  12. Javorac, J.; Živanović, D.; Ilić, M.; Lečić, S.K.; Milenković, A.; Dragić, N.; Bijelović, S.; Savić, N.; Vereš, K.T.; Smuđa, M.; et al. The Influence of Air Pollution on Non-Infectious Hospitalizations for Severe Acute Exacerbations of Chronic Obstructive Pulmonary Disease: A Time-Series from Serbia. Atmosphere 2023, 14, 730. [Google Scholar] [CrossRef]
  13. Evangelopoulos, D.; Chatzidiakou, L.; Walton, H.; Katsouyanni, K.; Kelly, F.J.; Quint, J.K.; Jones, R.L.; Barratt, B. Personal exposure to air pollution and respiratory health of COPD patients in London. Eur. Respir. J. 2021, 58, 2003432. [Google Scholar] [CrossRef] [PubMed]
  14. Benaissa, F.; Alkama, R.; Annesi-Maesano, I. Assessment of Air Pollution Impacts on Population Health in Bejaia City, Northern Algeria. Iran. J. Public Health 2014, 43, 1221–1228. [Google Scholar] [PubMed]
  15. Liang, L.; Cai, Y.; Barratt, B.; Lyu, B.; Chan, Q.; Hansell, A.L.; Xie, W.; Zhang, D.; Kelly, F.J.; Tong, Z. Associations between daily air quality and hospitalisations for acute exacerbation of chronic obstructive pulmonary disease in Beijing, 2013–2017: An ecological analysis. Lancet Planet Health 2019, 3, e270–e279. [Google Scholar] [CrossRef] [PubMed]
  16. Yan, P.; Liu, P.; Lin, R.; Xiao, K.; Xie, S.; Wang, K.; Zhang, Y.; He, X.; Zhao, S.; Zhang, X.; et al. Effect of ambient air quality on exacerbation of COPD in patients and its potential mechanism. Int. J. Chronic Obstr. Pulm. Dis. 2019, 14, 1517–1526. [Google Scholar] [CrossRef] [PubMed]
  17. Burney, P.G.; Patel, J.; Newson, R.; Minelli, C.; Naghavi, M. Global and regional trends in COPD mortality, 1990–2010. Eur. Respir. J. 2015, 45, 1239–1247. [Google Scholar] [CrossRef] [PubMed]
  18. Jung, Y.J.; Kim, E.J.; Heo, J.Y.; Choi, Y.H.; Kim, D.J.; Ha, K.H. Short-Term Air Pollution Exposure and Risk of Acute Exacerbation of Chronic Obstructive Pulmonary Disease in Korea: A National Time-Stratified Case-Crossover Study. Int. J. Environ. Res. Public Health 2022, 19, 2823. [Google Scholar] [CrossRef] [PubMed]
  19. Dragić, N. Impact of Ambient Suspended Particles “PM2.5” on Mortality, Cardiovascular and Respiratory Morbidity of Adults in the City of Novi Sad. Ph.D. Thesis, University of Novi Sad, Faculty of Medicine, Novi Sad, Serbia, 2019. [Google Scholar]
  20. Gradska Uprava za Zaštitu Životne Sredine. Available online: https://environovisad.rs/laravel-filemanager/files/shares/%D0%94%D0%BE%D0%BA%D1%83%D0%BC%D0%B5%D0%BD%D1%82%D0%B8/Program%20kontrole%20kvaliteta%20vazduha%20na%20teritoriji%20grada%20Novog%20Sada%20u%202023.%20i%202024.%20godini.pdf (accessed on 1 May 2024).
  21. Gasparrini, A. Distributed Lag Linear and Non-Linear Models in R: The Package dlnm. J. Stat. Softw. 2011, 43, 1–20. [Google Scholar] [CrossRef]
  22. Belis, C.; Djatkov, D.; Lettieri, T.; Jones, A.; Wojda, P.; Banja, M.; Muntean, M.; Paunovic, M.; Niegowska, M.Z.; Marinov, D.; et al. Status of Environment and Climate in the Western Balkans: Benchmarking the Accession Process Progress on Environment; Publications Office of the European Union: Luxembourg, 2022. [Google Scholar]
  23. Muhammad, S.; Long, X.; Salman, M. COVID-19 pandemic and environmental pollution: A blessing in disguise? Sci. Total Environ. 2020, 728, 138820. [Google Scholar] [CrossRef]
  24. Berman, J.D.; Ebisu, K. Changes in U.S. air pollution during the COVID-19 pandemic. Sci. Total Environ. 2020, 739, 139864. [Google Scholar] [CrossRef]
  25. Ropkins, K.; Tate, J.E. Early observations on the impact of the COVID-19 lockdown on air quality trends across the UK. Sci. Total Environ. 2021, 754, 142374. [Google Scholar] [CrossRef] [PubMed]
  26. Montiel-Lopez, F.; Rodríguez-Ramírez, D.; Cassou-Martínez, M.; Miranda-Márquez, M.C.; González-González, C.; Sansores, R.H.; Mayar-Maya, M.E.; Pérez-Padilla, R.; Robles-Hernández, R.E.; Thirion-Romero, I.; et al. Air quality in Mexico City during the COVID-19 lockdown possibly decreased COPD exacerbations. ERJ Open Res. 2022, 8, 00183–02022. [Google Scholar] [CrossRef] [PubMed]
  27. Vultaggio, M.; Varrica, D.; Alaimo, M.G. Impact on Air Quality of the COVID-19 Lockdown in the Urban Area of Palermo (Italy). Int. J. Environ. Res. Public Health 2020, 17, 7375. [Google Scholar] [CrossRef] [PubMed]
  28. Kerimray, A.; Baimatova, N.; Ibragimova, O.P.; Bukenov, B.; Kenessov, B.; Plotitsyn, P.; Karaca, F. Assessing air quality changes in large cities during COVID-19 lockdowns: The impacts of traffic-free urban conditions in Almaty, Kazakhstan. Sci. Total Environ. 2020, 730, 139179. [Google Scholar] [CrossRef] [PubMed]
  29. Kyriakopoulos, C.; Gogali, A.; Exarchos, K.; Potonos, D.; Tatsis, K.; Apollonatou, V.; Loukides, S.; Papiris, S.; Sigala, I.; Katsaounou, P.; et al. Reduction in Hospitalizations for Respiratory Diseases during the First COVID-19 Wave in Greece. Respiration 2021, 100, 588–593. [Google Scholar] [CrossRef] [PubMed]
  30. Sarc, I.; Dolinar, A.L.; Morgan, T.; Sambt, J.; Ziherl, K.; Gavric, D.; Selb, J.; Rozman, A.; Bonca, P.D. Mortality, seasonal variation, and susceptibility to acute exacerbation of COPD in the pandemic year: A nationwide population study. Ther. Adv. Respir. Dis. 2022, 16, 17534666221081047. [Google Scholar] [CrossRef] [PubMed]
  31. Chan, K.P.F.; Ma, T.F.; Kwok, W.C.; Leung, J.K.C.; Chiang, K.Y.; Ho, J.C.M.; Lam, D.C.L.; Tam, T.C.C.; Ip, M.S.M.; Ho, P.L. Significant reduction in hospital admissions for acute exacerbation of chronic obstructive pulmonary disease in Hong Kong during coronavirus disease 2019 pandemic. Respir. Med. 2020, 171, 106085. [Google Scholar] [CrossRef] [PubMed]
  32. Alsallakh, M.A.; Sivakumaran, S.; Kennedy, S.; Vasileiou, E.; Lyons, R.A.; Robertson, C.; Sheikh, A.; Davies, G.A.; EAVE II Collaborators. Impact of COVID-19 lockdown on the incidence and mortality of acute exacerbations of chronic obstructive pulmonary disease: National interrupted time series analyses for Scotland and Wales. BMC Med. 2021, 19, 124. [Google Scholar] [CrossRef]
  33. Tan, J.Y.; Conceicao, E.P.; Wee, L.E.; Sim, X.Y.J.; Venkatachalam, I. COVID-19 public health measures: A reduction in hospital admissions for COPD exacerbations. Thorax 2021, 76, 512–513. [Google Scholar] [CrossRef]
  34. Pappe, E.; Hammerich, R.; Saccomanno, J.; Sgarbossa, T.; Pohrt, A.; Schmidt, B.; Grah, C.; Eisenmann, S.; Holland, A.; Eggeling, S.; et al. Impact of COVID-19 on Hospital Admissions, Health Status, and Behavioral Changes of Patients with COPD. Chronic Obstr. Pulm. Dis. 2023, 10, 211–223. [Google Scholar] [PubMed]
  35. Ilić, M.; Javorac, J.; Milenković, A.; Živanović, D.; Miljković, D.; Lečić, S.K.; Savić, N.; Vereš, K.T.; Kovačević, D.; Vujičić, E.; et al. Home-Based Spirometry in Patients with Interstitial Lung Diseases: A RealLife Pilot “FACT” Study from Serbia. J. Pers. Med. 2023, 13, 793. [Google Scholar] [CrossRef]
  36. Docherty, A.B.; Harrison, E.M.; Green, C.A.; Hardwick, H.E.; Pius, R.; Norman, L.; Holden, K.A.; Read, J.M.; Dondelinger, F.; Carson, G.; et al. Features of 20 133 UK patients in hospital with covid-19 using the ISARIC WHO Clinical Characterisation Protocol: Prospective observational cohort study. BMJ 2020, 369, m1985. [Google Scholar] [CrossRef]
  37. Poucineau, J.; Delory, T.; Lapidus, N.; Hejblum, G.; Chouaïd, C.; Le Cœur, S.; Khlat, M. Hospital admissions and mortality for acute exacerbations of COPD during the COVID-19 pandemic: A nationwide study in France. Front. Med. (Lausanne) 2022, 9, 995016. [Google Scholar] [CrossRef]
  38. Quintyne, K.I.; Kelly, C.; Sheridan, A.; Kenny, P.; O’Dwyer, M. COVID-19 transport restrictions in Ireland: Impact on air quality and respiratory hospital admissions. Public Health 2021, 198, 156–160. [Google Scholar] [CrossRef]
  39. Kelly, C.; Kenny, P.; O’Dwyer, M.; Quintyne, K.I. Ambient air pollutant concentrations and asthma-related hospital admissions during COVID-19 transport restrictions. Public Health 2022, 211, 66–71. [Google Scholar] [CrossRef]
  40. Aix, M.L.; Petit, P.; Bicout, D.J. Air pollution and health impacts during the COVID-19 lockdowns in Grenoble, France. Environ. Pollut. 2022, 303, 119134. [Google Scholar] [CrossRef]
  41. Anbari, K.; Sicard, P.; Omidi Khaniabadi, Y.; Raja Naqvi, H.; Rashidi, R. Assessing the effect of COVID-19 pandemic on air quality change and human health outcomes in a capital city, southwestern Iran. Int. J. Environ. Health Res. 2023, 33, 1716–1727. [Google Scholar] [CrossRef] [PubMed]
  42. Ghobakhloo, S.; Khoshakhlagh, A.H.; Mostafaii, G.R.; Chuang, K.J.; Gruszecka-Kosowska, A.; Hosseinnia, P. Critical air pollutant assessments and health effects attributed to PM2.5 during and after COVID-19 lockdowns in Iran: Application of AirQ+ models. Front. Public Health 2023, 11, 1120694. [Google Scholar] [CrossRef] [PubMed]
  43. Ling, C.; Li, Y. Substantial Changes of Gaseous Pollutants and Health Effects During the COVID-19 Lockdown Period Across China. Geohealth 2021, 5, e2021GH000408. [Google Scholar] [CrossRef] [PubMed]
  44. Huang, L.; Liu, Z.; Li, H.; Wang, Y.; Li, Y.; Zhu, Y.; Ooi, M.C.G.; An, J.; Shang, Y.; Zhang, D.; et al. The Silver Lining of COVID-19: Estimation of Short-Term Health Impacts Due to Lockdown in the Yangtze River Delta Region, China. Geohealth 2020, 4, e2020GH000272. [Google Scholar] [CrossRef] [PubMed]
  45. Ko, F.W.S.; Lau, L.H.S.; Ng, S.S.; Yip, T.C.F.; Wong, G.L.H.; Chan, K.P.; Chan, T.O.; Hui, D.S.C. Respiratory admissions before and during the COVID-19 pandemic with mediation analysis of air pollutants, mask-wearing and influenza rates. Respirology 2023, 28, 47–55. [Google Scholar] [CrossRef] [PubMed]
  46. Sigala, I.; Giannakas, T.; Giannakoulis, V.G.; Zervas, E.; Brinia, A.; Gianiou, N.; Asimakos, A.; Dima, E.; Kalomenidis, I.; Katsaounou, P. Effect of COVID-19-Related Lockdown οn Hospital Admissions for Asthma and COPD Exacerbations: Associations with Air Pollution and Patient Characteristics. J. Pers. Med. 2021, 11, 867. [Google Scholar] [CrossRef] [PubMed]
  47. Li, X.; Baumgartner, J.; Harper, S.; Zhang, X.; Sternbach, T.; Barrington-Leigh, C.; Brehmer, C.; Robinson, B.; Shen, G.; Zhang, Y.; et al. Field measurements of indoor and community air quality in rural Beijing before, during, and after the COVID-19 lockdown. Indoor Air 2022, 32, e13095. [Google Scholar] [CrossRef] [PubMed]
  48. Zhang, Y.; Zhao, B.; Jiang, Y.; Xing, J.; Sahu, S.K.; Zheng, H.; Ding, D.; Cao, S.; Han, L.; Yan, C.; et al. Non-negligible contributions to human health from increased household air pollution exposure during the COVID-19 lockdown in China. Environ. Int. 2022, 158, 106918. [Google Scholar] [CrossRef] [PubMed]
Figure 1. The network of stations for collecting data on meteorological factors and air pollution inside the local communities of the City of Novi Sad. Legend: meteorological station (marked in blue circle): 1 (45°20′ N, 19°51′ E); air pollution stations: detecting urban traffic air pollution (marked in red circles)—2 (45°15′ N, 19°49′ E), 3 (45°25′ N, 19°83′ E), and 4 (45°24′ N, 19°81′ E); detecting urban background air pollution (marked in green circles)—5 (45°14′ N, 19°50′ E) and 6 (45°25′ N, 19°85′ E); detecting suburban background air pollution (marked in light-green circle)—7 (45°13′ N, 19°50′ E); detecting suburban industrial air pollution (marked in pink circle)—8 (45°16′ N, 19°52′ E) and 9 (45°29′ N, 19°78′ E); yellow star—localization of the Institute for the Pulmonary Diseases of Vojvodina (45°21′ N, 19°85′ E).
Atmosphere 15 00593 g001
Figure 2. Time series of average daily concentrations of the examined air pollutants in the urban background environment. Legend: red frame—refers to time period of March–June of appropriate year; DPGV—red dashed line indicates the recommended daily concentrations of air pollutants according to Directive 2008/50/EC and the legal acts of the Republic of Serbia; GPGV—dark red dashed line indicates the recommended annual concentrations of air pollutants according to Directive 2008/50/EC and the legal acts of the Republic of Serbia.
Atmosphere 15 00593 g002
Figure 3. Time series of average daily concentrations of the examined air pollutants in the urban traffic environment. Legend: red frame—refers to time period of March–June of appropriate year; DPGV—red dashed line indicates the recommended daily concentrations of air pollutants according to Directive 2008/50/EC and the legal acts of the Republic of Serbia; GPGV—dark red dashed line indicates the recommended annual concentrations of air pollutants according to Directive 2008/50/EC and the legal acts of the Republic of Serbia.
Atmosphere 15 00593 g003
Figure 4. The influence of exposure to air pollution during the March–June period of different years on the relative risk of AECOPD hospitalizations. Legend: For each air pollutant examined, the calculated RR values (represented by dots) and 95% CI (represented by vertical lines) are given.
Atmosphere 15 00593 g004
Table 1. The number of AECOPD hospitalizations during the period of March–June.
Year AECOPD Hospitalizations
Non-Infectious InfectiousTotal
20194972121
2020 (lockdown)222345
2021414586
Legend: AECOPD—acute exacerbation of chronic obstructive pulmonary disease.
Table 2. The average daily concentrations of air pollutants during the period March–June of 2019–2021.
Air PollutantMarch–Junep a
2019 vs. 2020
p a
2020 vs. 2021
201920202021
PM10(UB) (μm/m3)24.6422.8618.250.085400.02672 *
PM10(UT) (μm/m3)34.0331.7130.300.179600.30698
PM2.5(UB) (μm/m3)17.0015.5812.120.089670.01672 *
PM2.5(UT) (μm/m3)26.8616.8512.46<0.00001 *0.00162 *
SO2(UB) (μm/m3)16.588.1417.25<0.00001 *<0.00001 *
SO2(UT) (μm/m3)10.3114.5818.12<0.00001 *<0.00001 *
NO2(UB) (μm/m3)13.718.209.23<0.00001 *0.02942 *
NO2(UT) (μm/m3)35.3220.6828.040.00019 *<0.00001 *
Legend: PM10—average concentration of particulate matter with a size less than or equal to 10 μm in the urban background (UB) or urban traffic (UT) surrounding; PM2.5—average concentration of particulate matter with a size less than or equal to 2.5 μm in the urban background (UB) or urban traffic (UT) surrounding; SO2—average concentration of sulfur dioxide in the urban background (UB) or urban traffic (UT) surrounding; NO2—average concentration of nitrogen dioxide in the urban background (UB) or urban traffic (UT) surrounding; a—calculated using Student’s t test; * statistically significant at the level of p < 0.05.
Disclaimer/Publisher’s Note: The statements, opinions and data contained in all publications are solely those of the individual author(s) and contributor(s) and not of MDPI and/or the editor(s). MDPI and/or the editor(s) disclaim responsibility for any injury to people or property resulting from any ideas, methods, instructions or products referred to in the content.

