Analyzing Trend and Variability of Rainfall in The Tafna Basin (Northwestern Algeria)

 ,
,  ,
, 
Abstract
1. Introduction
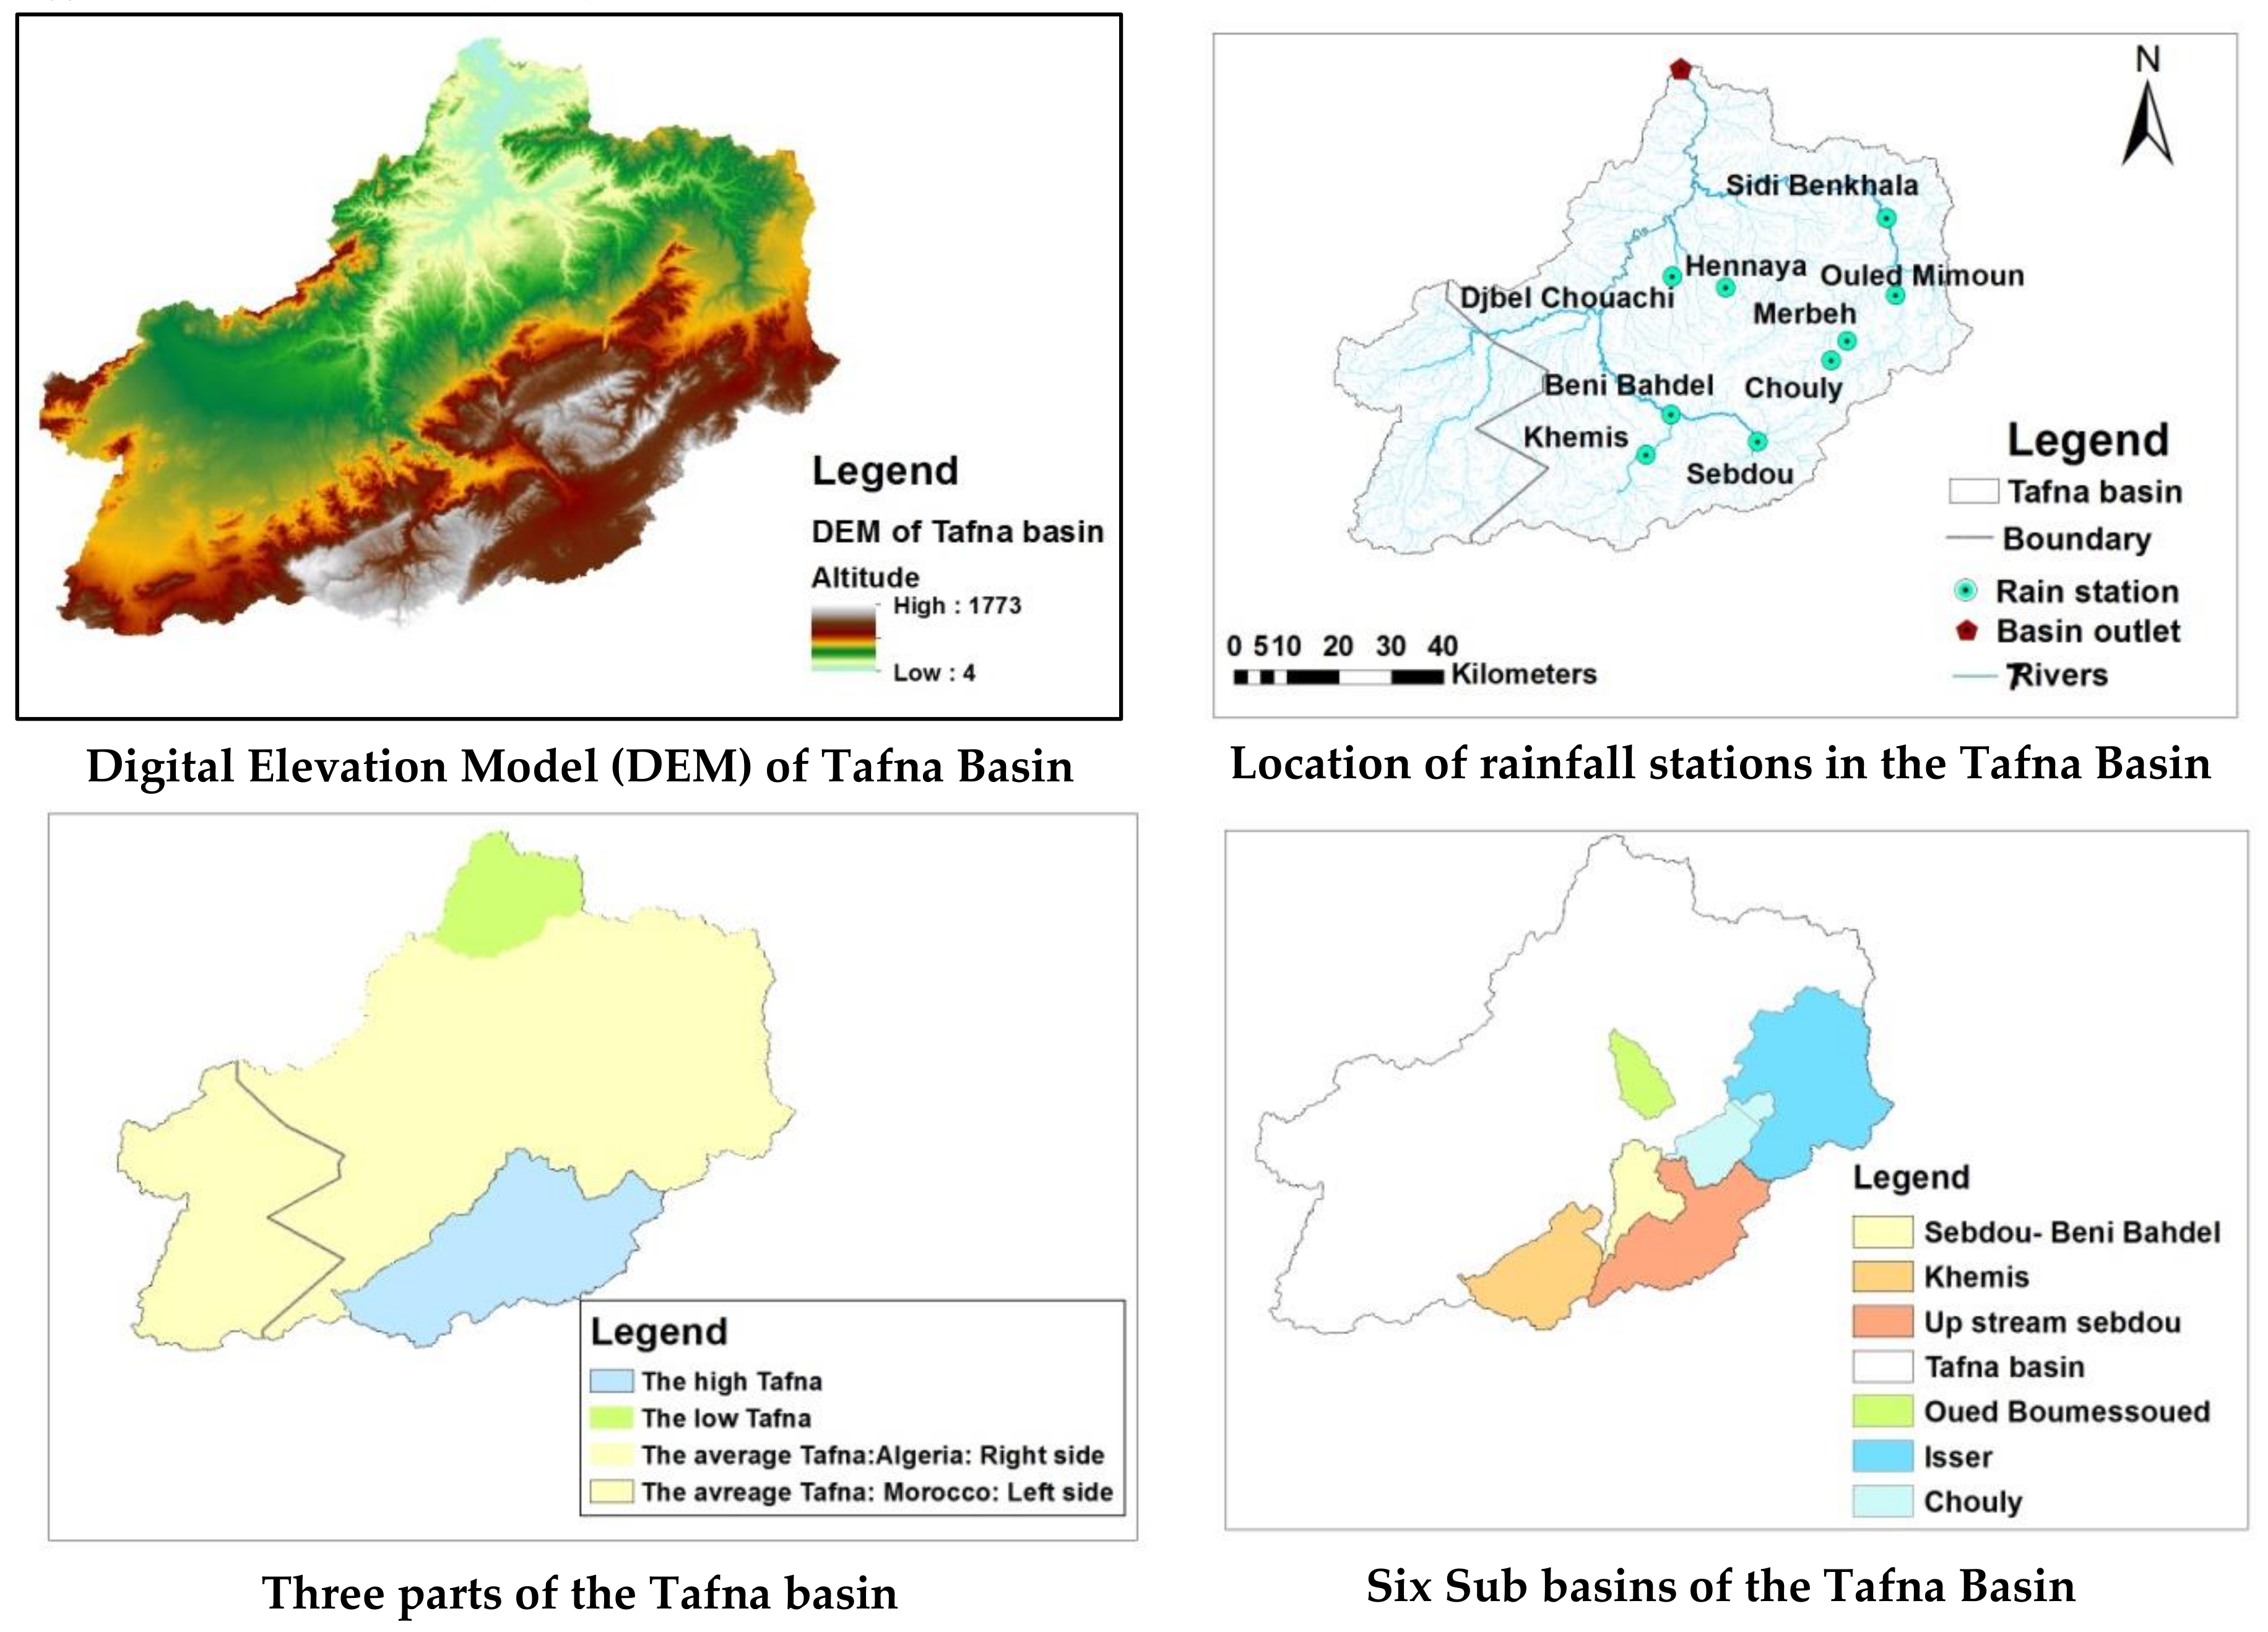
2. Study Area
3. Materials and Methods
3.1. Methodology
3.1.1. Tests for Change Point Detection (Homogeneity Test)
3.1.2. Stationarity Test
3.1.3. Trend Analysis
3.2. Dataset
4. Results and Discussion
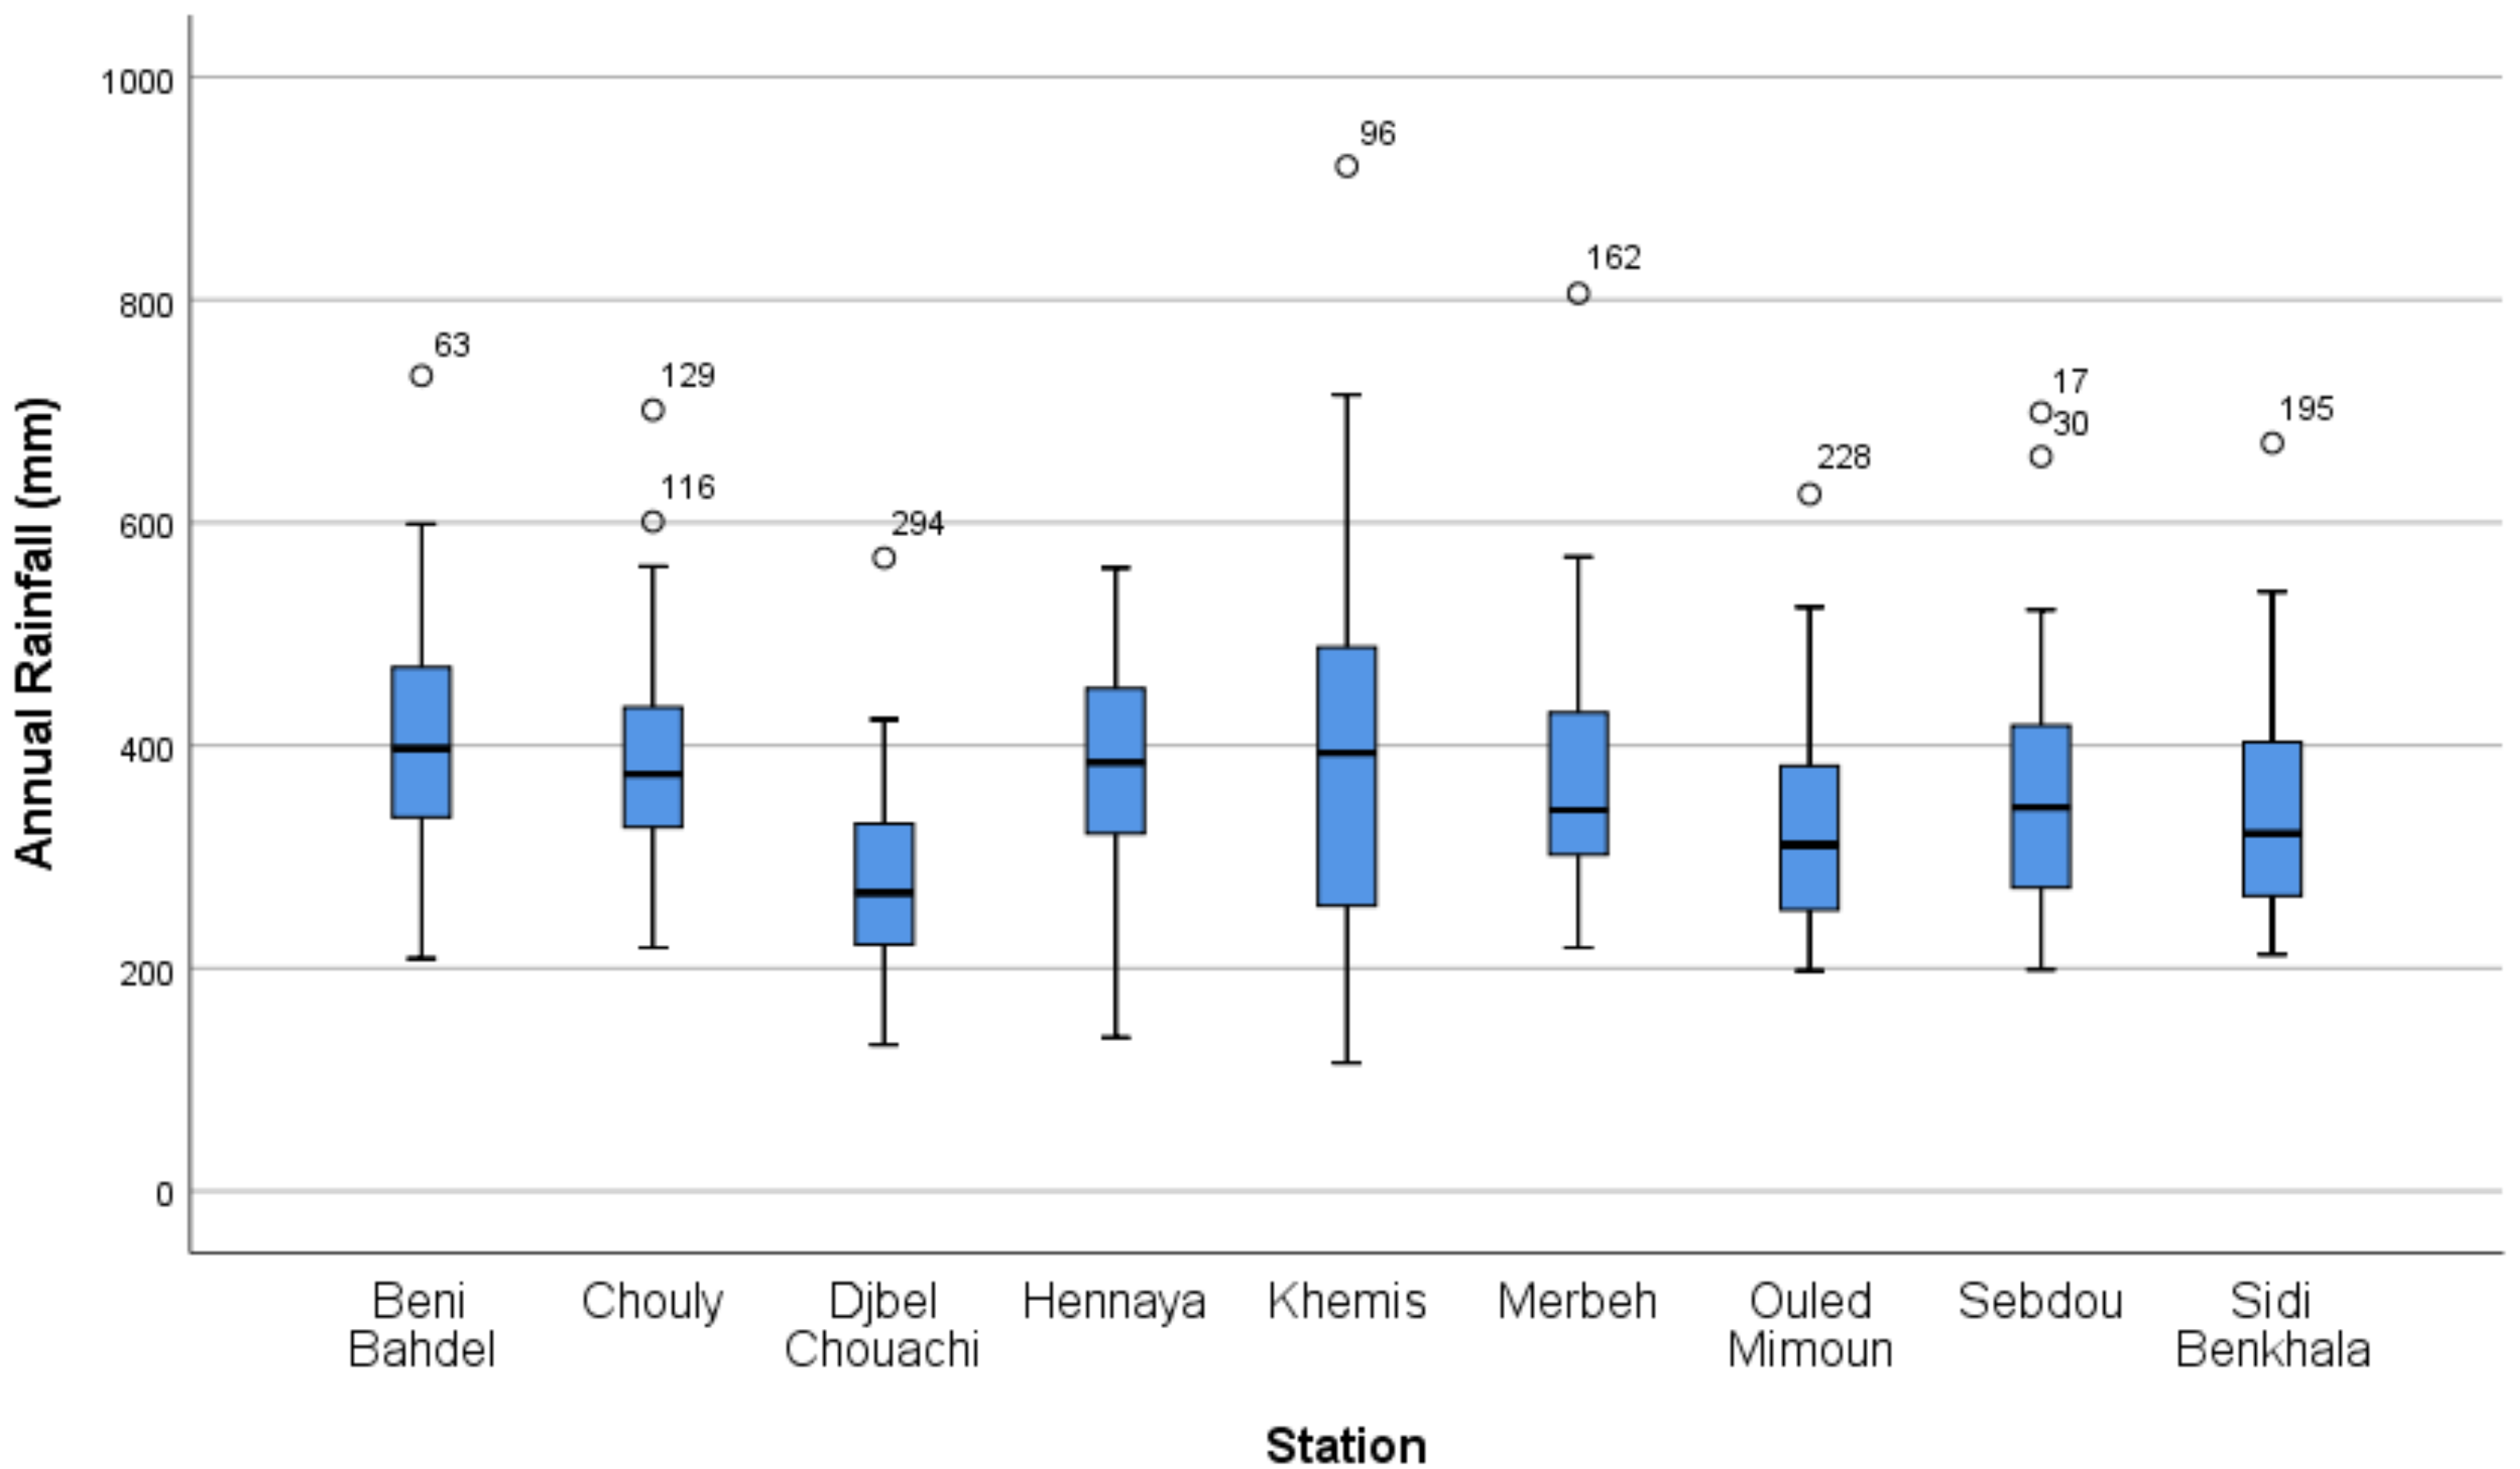
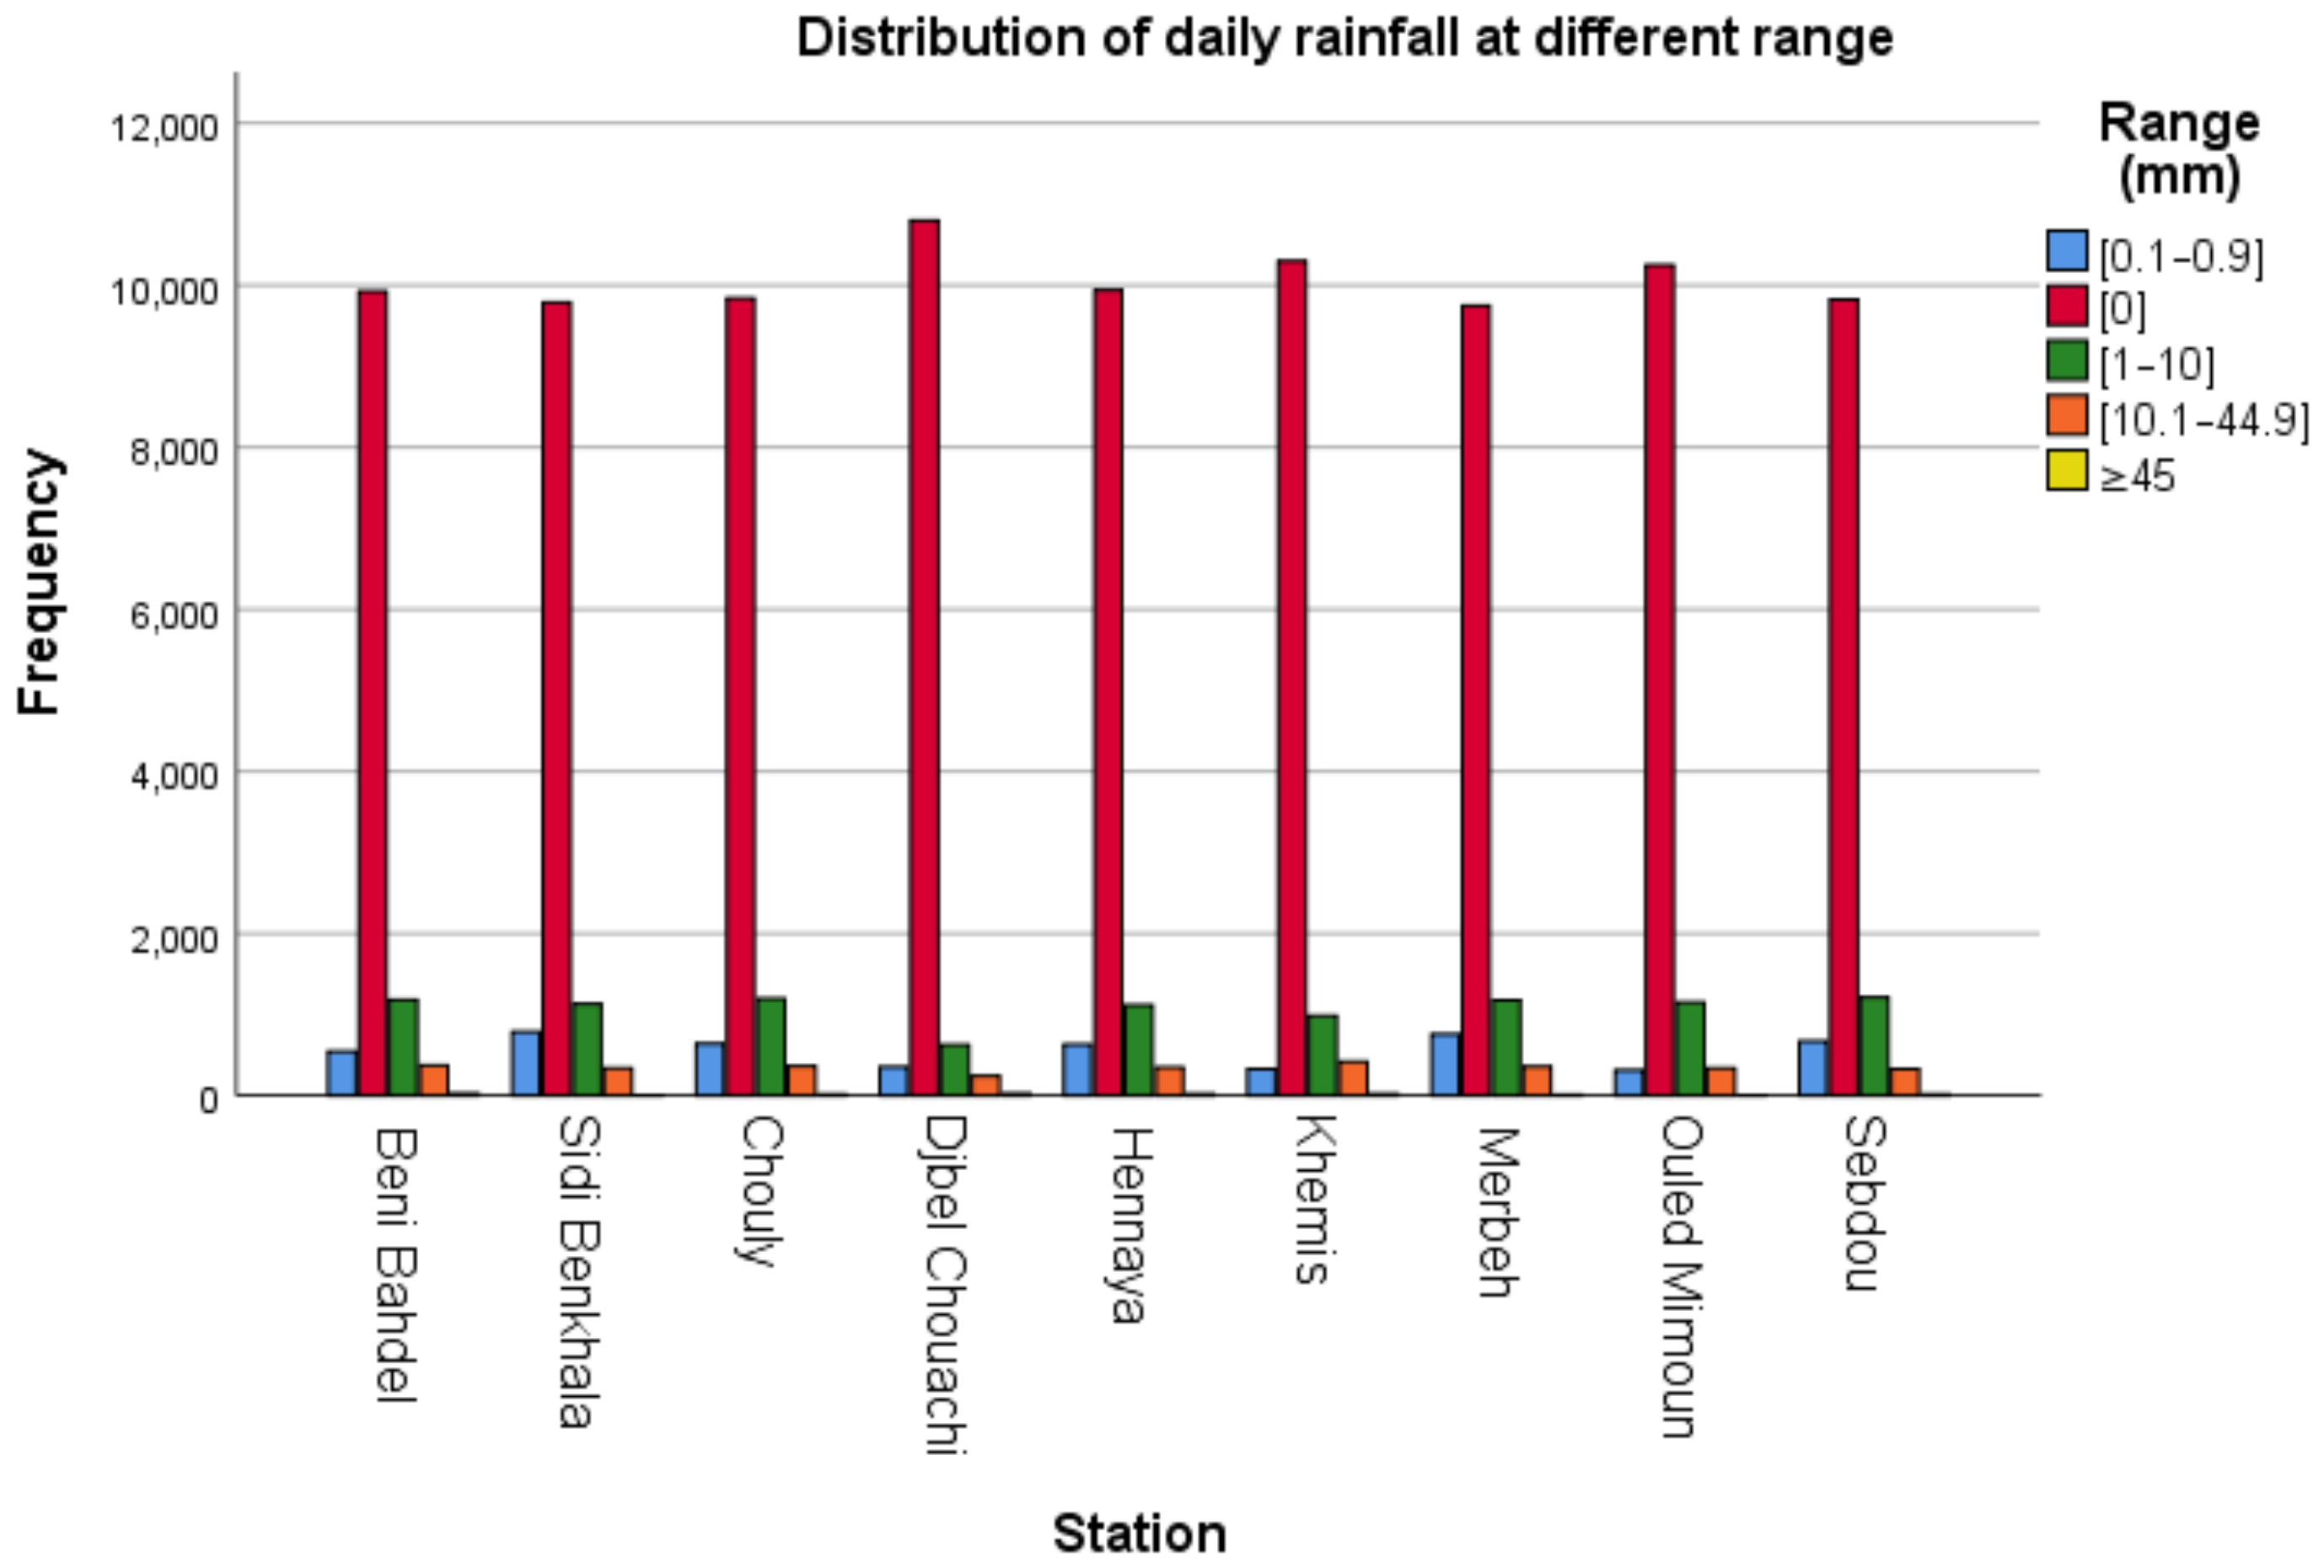
4.1. Preliminary Analysis
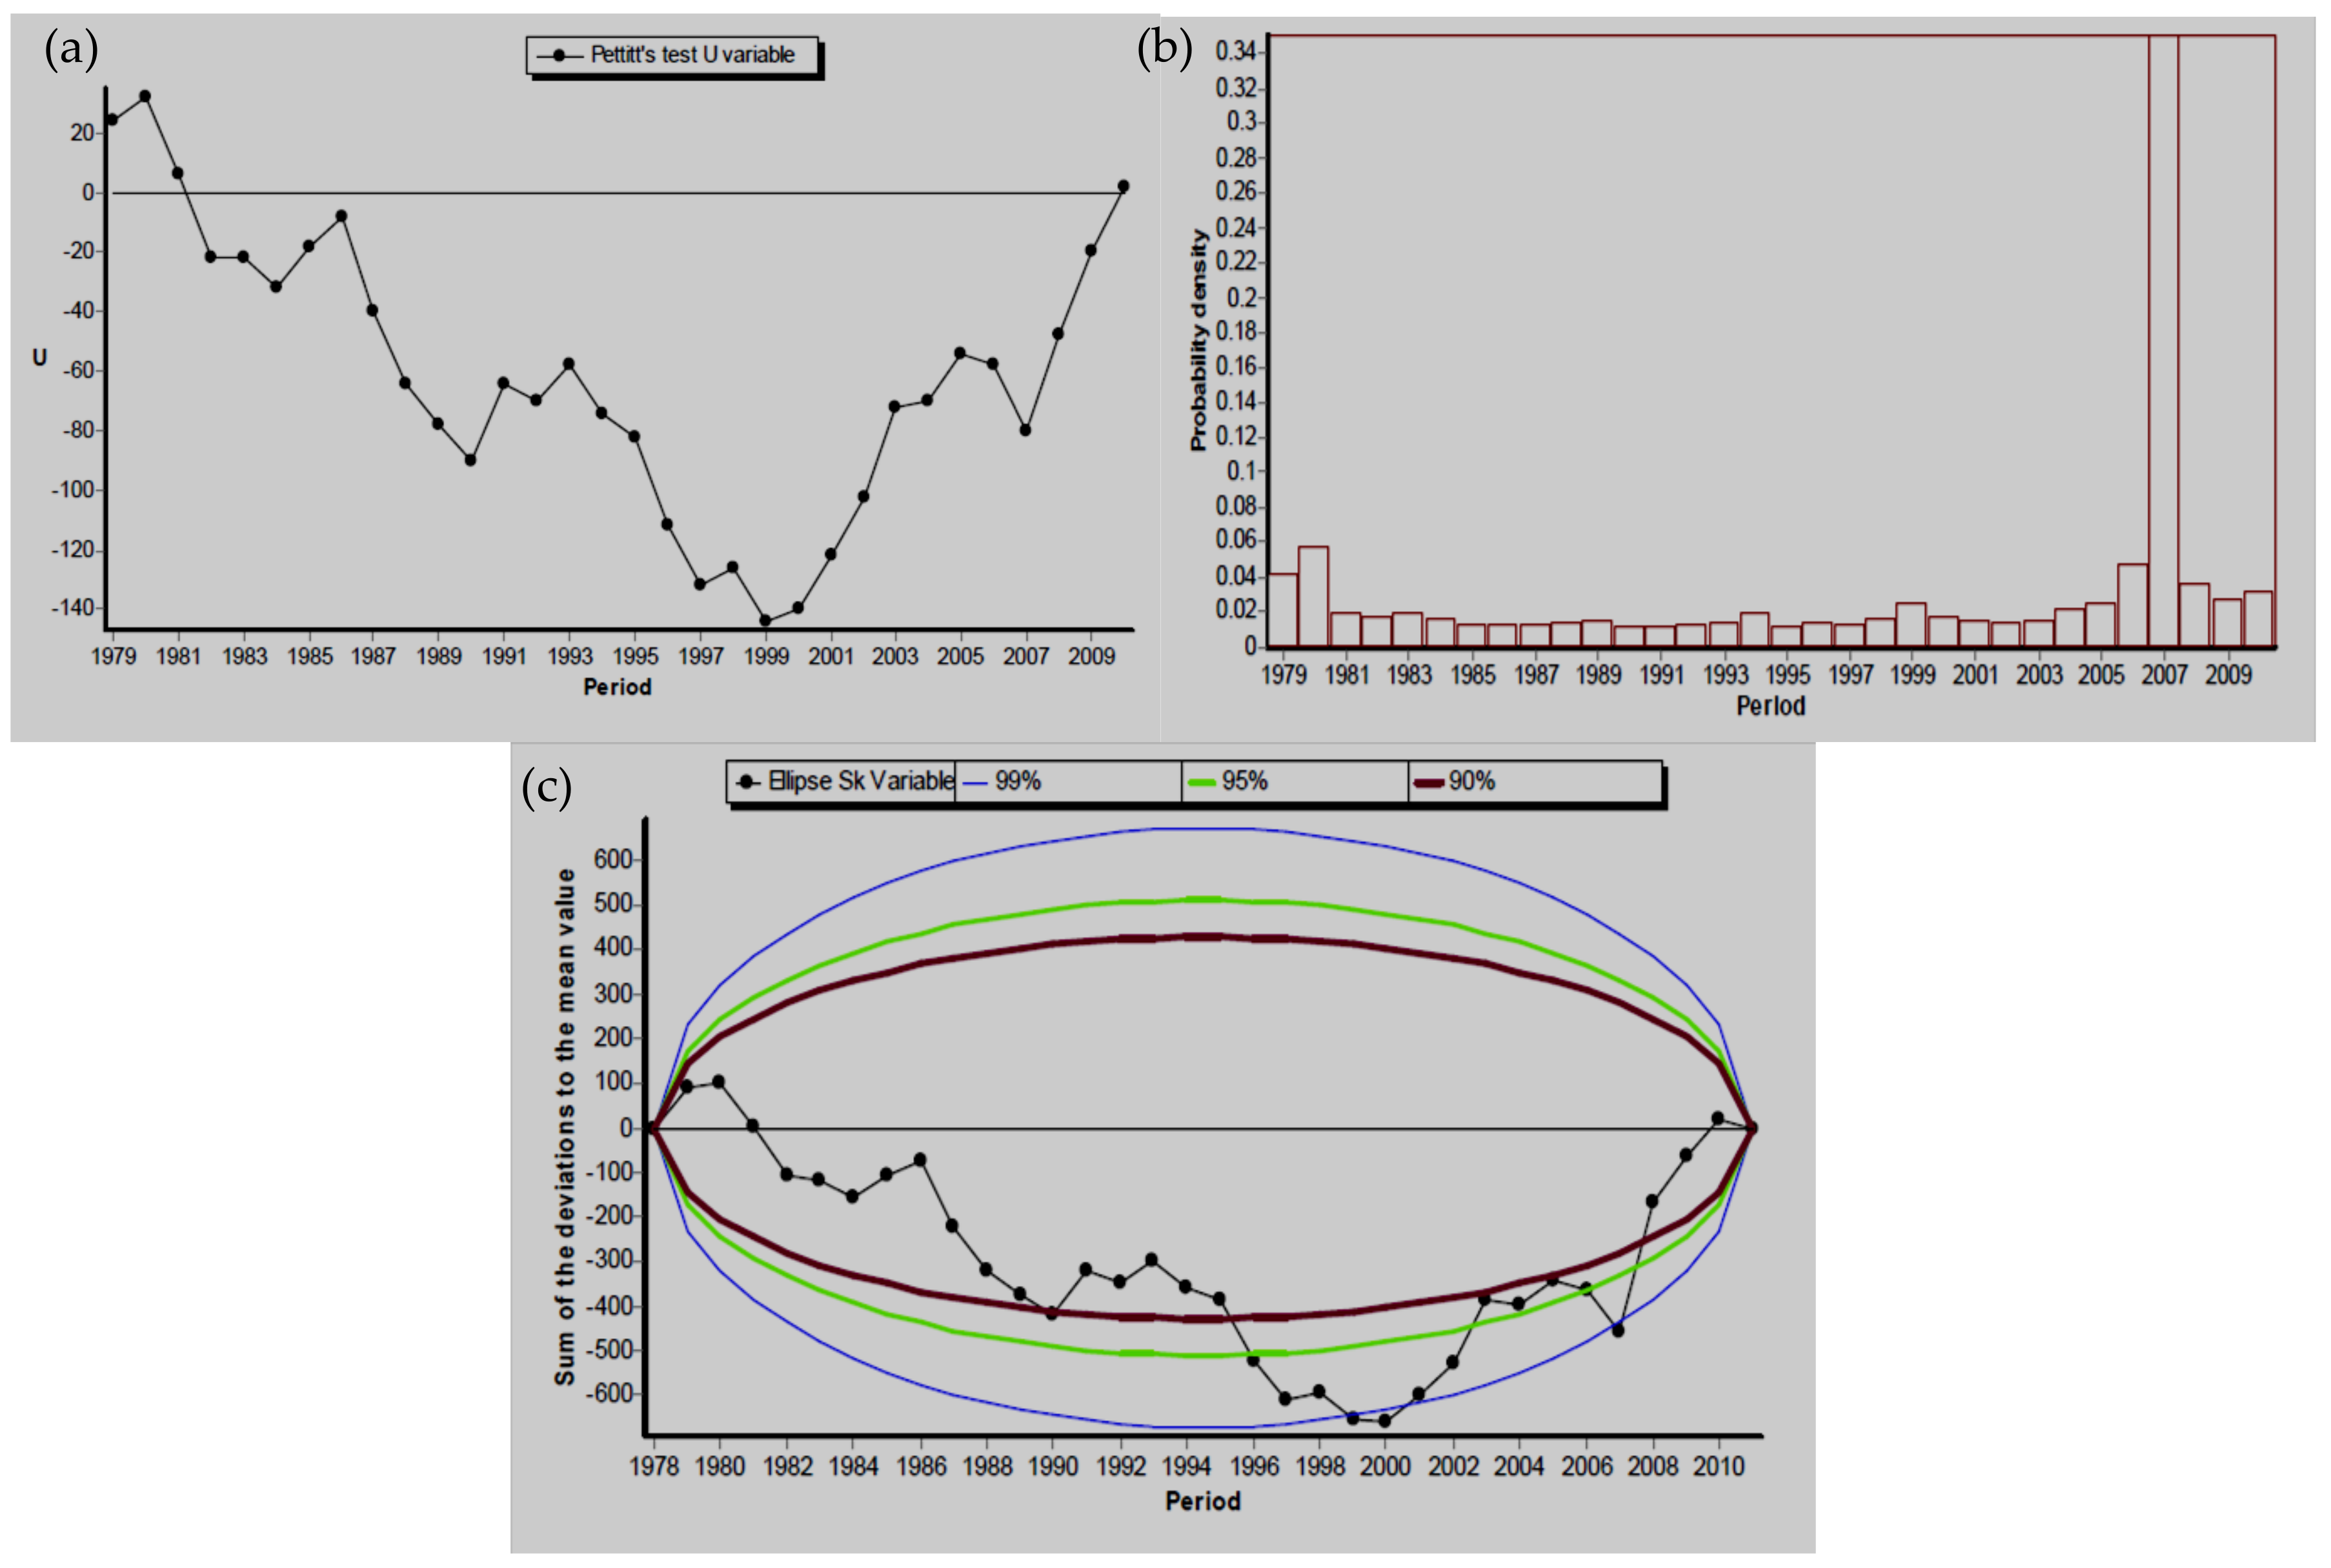
4.2. Change Point Detection Test
4.3. Stationarity Test
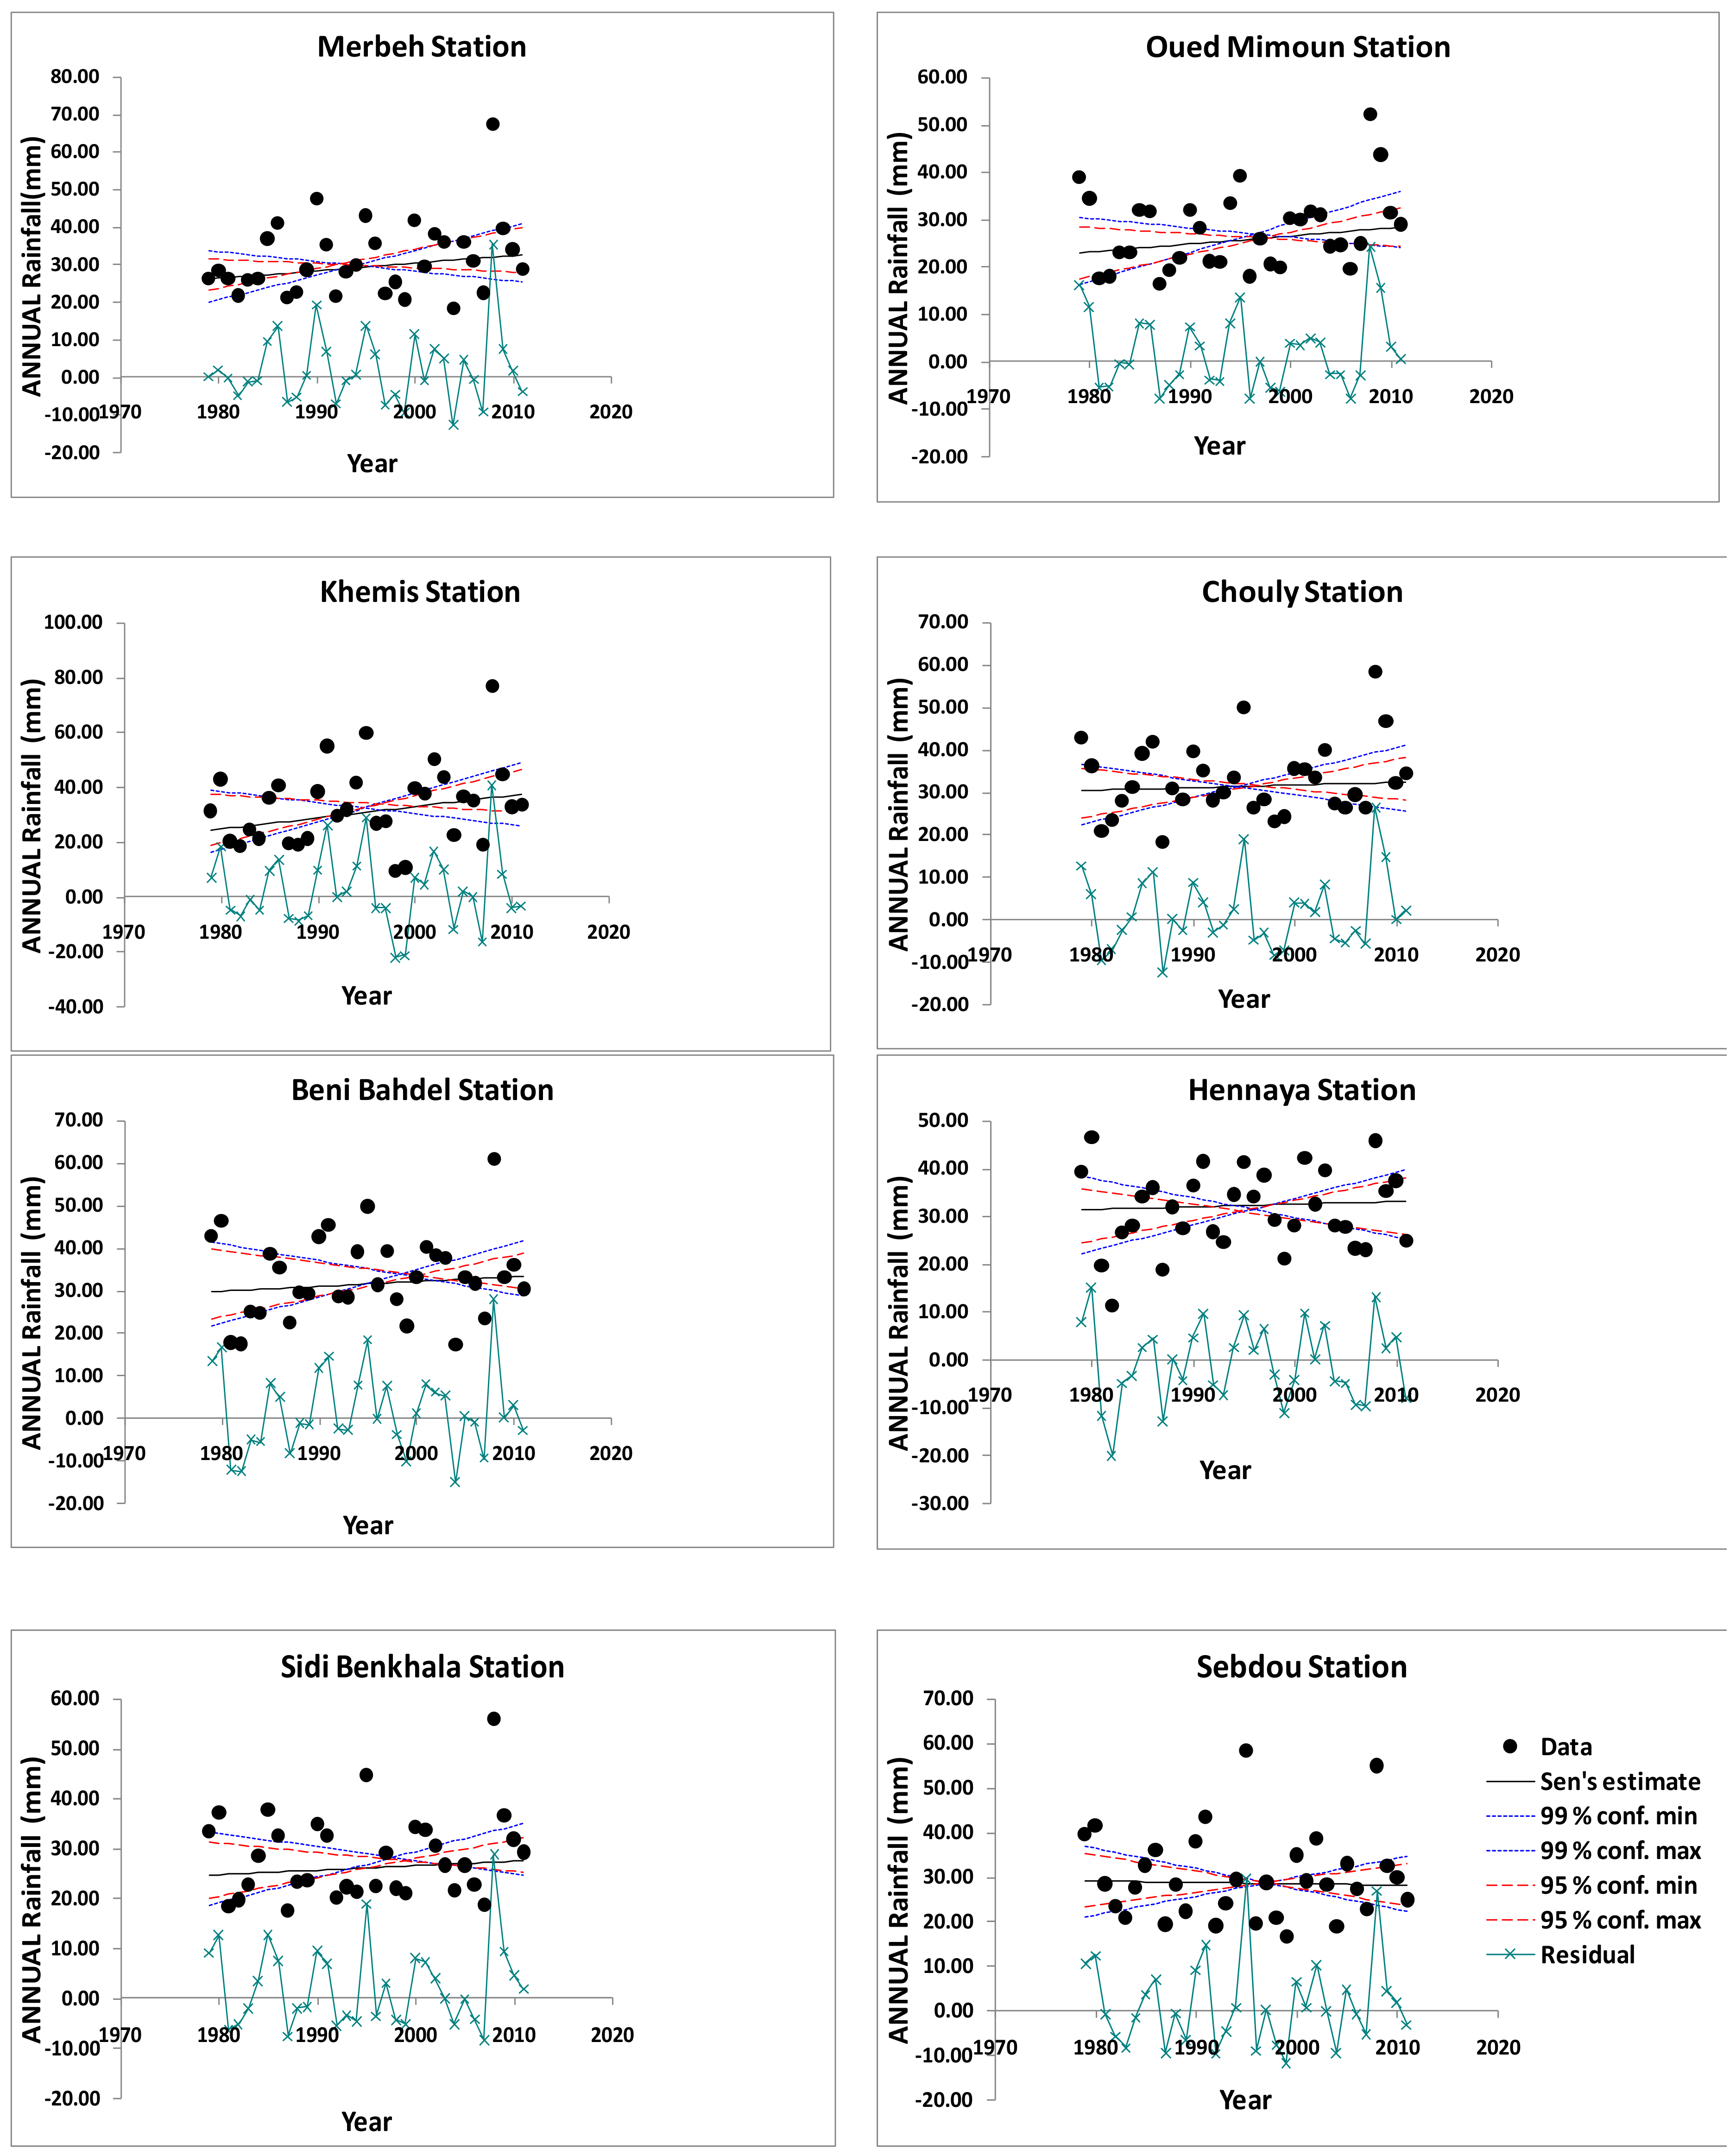
4.4. Trend Analysis
5. Conclusions
Author Contributions
Funding
Acknowledgments
Conflicts of Interest
References
- Mehta, A.V.; Yang, S. Precipitation Climatology over Mediterranean Basin from Ten Years of TRMM Measurements. Adv. Geosci. 2008, 17, 87–91. [Google Scholar] [CrossRef]
- Romero, R.; Guijarro, J.A.; Ramis, C.; Alonso, S. A 30-Year (1964–1993) Daily Rainfall Data Base for the Spanish Mediterranean Regions: First Exploratory Study. Int. J. Clim. 1998, 18, 541–560. [Google Scholar] [CrossRef]
- Lopez-Bermudez, F.; Romero-Dıaz, A.; Martınez-Fernandez, J.; Martınez-Fernandez, J. Vegetation and Soil Erosion under a Semi-Arid Mediterranean Climate: A Case Study from Murcia (Spain). Geomorphology 1998, 24, 51–58. [Google Scholar] [CrossRef]
- Ramos, M.C.; Martínez-Casasnovas, J.A. Trends in Precipitation Concentration and Extremes in the Mediterranean Penedès-Anoia Region, Ne Spain. Clim. Chang. 2006, 74, 457–474. [Google Scholar] [CrossRef]
- Batisani, N.; Yarnal, B. Rainfall Variability and Trends in Semi-Arid Botswana: Implications for Climate Change Adaptation Policy. Appl. Geogr. 2010, 30, 483–489. [Google Scholar] [CrossRef]
- Barbé, L. Rainfall Variability in West Africa during the Years 1950-90. J. Clim. 2002, 15, 16. [Google Scholar] [CrossRef]
- Belarbi, H.; Touaibia, B.; Boumechra, N.; Amiar, S.; Baghli, N. Sécheresse et modification de la relation pluie–débit: Cas du bassin versant de l’OuedSebdou (AlgérieOccidentale) (Drought and modification of the rain–flow relationship: Case of the Oued Sebdou watershed (Western Algeria)). Hydrol. Sci. J. 2016, 1–13. [Google Scholar] [CrossRef]
- Benblidia, M.; Thivet, G. Gestion des ressources en eau: Les limites d’une politique de l’offre. Les Notes D’Anal. CIHEAM 2010, 58, 15. [Google Scholar]
- Meddi, H.; Meddi, M. Variabilité des précipitations annuelles du Nord-Ouest de l’Algérie. Sécheresse 2009, 20, 57–65. [Google Scholar] [CrossRef]
- Meddi, M.; Hubert, P. Impact de la modification du régime pluviométrique sur les ressourceseneau du nord-ouest de l’Algérie (Impact of the modification of the rainfall regime on the water resources of north-western Algeria). In Proceedings of the International Symposium, Montpellier, France, 1–4 April 2003; p. 7. [Google Scholar]
- Meddi, M.M.; Assani, A.A.; Meddi, H. Temporal Variability of Annual Rainfall in the Macta and Tafna Catchments, Northwestern Algeria. Water Resour. Manag. 2010, 24, 3817–3833. [Google Scholar] [CrossRef]
- Hasanean, H.M. Variability of the North Atlantic Subtropical High and Associations with Tropical Sea-Surface Temperature. Int. J. Climatol. 2004, 24, 945–957. [Google Scholar] [CrossRef]
- Knippertz, P.; Ulbrich, U.; Marques, F.; Corte-Real, J. Decadal Changes in the Link between El Niño and Springtime North Atlantic Oscillation and European-North African Rainfall: EL Niño, Nao, European-North African Rainfall. Int. J. Climatol. 2003, 23, 1293–1311. [Google Scholar] [CrossRef]
- Zeroual, A.; Assani, A.A.; Meddi, M. Combined Analysis of Temperature and Rainfall Variability as They Relate to Climate Indices in Northern Algeria over the 1972–2013 Period. Hydrol. Res. 2017, 48, 584–595. [Google Scholar] [CrossRef]
- Vezzoli, R.; Pecora, S.; Zenoni, E.; Tonelli, F. Data Analysis to Detect Inhomogeneity, Change Points, Trends in Observations: An Application to Po River Discharge Extremes. SSRN Electron. J. 2012. [Google Scholar] [CrossRef]
- Jain, S.K.; Kumar, V. Trend Analysis of Rainfall and Temperature Data for India. Curr. Sci. 2012, 102, 13. [Google Scholar]
- Traore, V.B.; Ndiaye, M.L.; Mbow, C.; Malomar, G.; Sarr, J.; Beye, A.C.; Diaw, A.T. Khronostat Model as Statistical Analysis Tools in Low Casamance River Basin, Senegal. World Environ. 2017, 1, 10–22. [Google Scholar]
- Dash, S.S.; Kumar, H.V.H. Statistical and Trend Analysis of Climate Data of Bapatla (A.P), India. Int. J. Curr. Microbiol. Appl. Sci. 2017, 6, 4959–4969. [Google Scholar] [CrossRef]
- Ndiaye, M.L.; Toure, M.A.; Diaw, A.T. Contribution of Remote Sensing to The Study of Spatiotemporal Evolution of Rainfall in Senegal: Exploitation of TRMM 3B43 Low Spatial Resolution. J. Multidiscip. Eng. Sci. Stud. 2016, 2, 6. [Google Scholar]
- Tossou, E.M.; Ndiaye, M.L.; Traore, V.B.; Sambou, H.; Kelome, N.C.; SY, B.A.; Diaw, A.T. Characterisation and Analysis of Rainfall Variability in the Mono-Couffo River Watershed Complex, Benin (West Africa). Resour. Environ. 2017, 1, 13–29. [Google Scholar]
- Adugna, B.T.; Goshu, G. Integrating Aquaculture with Traditional Farming System: Socioeconomic Assessment in the Amhara Region, Ethiopia. Ecohydrol. Hydrobiol. 2010, 10, 223–230. [Google Scholar] [CrossRef]
- Sharma, C.S.; Panda, S.N.; Pradhan, R.P.; Singh, A.; Kawamura, A. Precipitation and Temperature Changes in Eastern India by Multiple Trend Detection Methods. Atmos. Res. 2016, 180, 211–225. [Google Scholar] [CrossRef]
- Celleri, R.; Willems, P.; Buytaert, W.; Feyen, J. Space–Time Rainfall Variability in the Paute Basin, Ecuadorian Andes. Hydrol. Process. 2007, 21, 3316–3327. [Google Scholar] [CrossRef]
- Conrad, V.; Pollak, C. Methods in Climatology; Harvard University Press: Cambridge, MA, USA, 1950. [Google Scholar]
- Longobardi, A.; Villani, P. Trend Analysis of Annual and Seasonal Rainfall Time Series in the Mediterranean Area. Int. J. Climatol. 2009. [Google Scholar] [CrossRef]
- Peterson, T.C.; Easterling, D.R.; Karl, T.R.; Groisman, P.; Nicholls, N.; Plummer, N.; Torok, S.; Auer, I.; Boehm, R.; Gullett, D.; et al. Homogeneity Adjustments of in Situ Atmospheric Climate Data: A Review. Int. J. Clim. 1998, 18, 1493–1517. [Google Scholar] [CrossRef]
- Hubert, P. The Segmentation Procedure as a Tool for Discrete Modeling of Hydrometeorological Regimes. Stoch. Environ. Res. Risk Assess. 2000, 14, 297–304. [Google Scholar] [CrossRef]
- Yang, K.; Wu, H.; Qin, J.; Lin, C.; Tang, W.; Chen, Y. Recent Climate Changes over the Tibetan Plateau and Their Impacts on Energy and Water Cycle: A Review. Glob. Planet. Chang. 2014, 112, 79–91. [Google Scholar] [CrossRef]
- Kisi, O.; Ay, M. Comparison of Mann–Kendall and Innovative Trend Method for Water Quality Parameters of the Kizilirmak River, Turkey. J. Hydrol. 2014, 513, 362–375. [Google Scholar] [CrossRef]
- Da Silva, R.M.; Santos, C.A.G.; Moreira, M.; Corte-Real, J.; Silva, V.C.L.; Medeiros, I.C. Rainfall and River Flow Trends Using Mann–Kendall and Sen’s Slope Estimator Statistical Tests in the Cobres River Basin. Nat. Hazards 2015, 77, 1205–1221. [Google Scholar] [CrossRef]
- Djellouli, F.; Bouanani, A.; Baba-Hamed, K. Efficiency of Some Meteorological Drought Indices in Different Time Scales, Case Study: Wadi Louza Basin (NW-Algeria). J. Water Land Dev. 2016, 31, 33–41. [Google Scholar] [CrossRef][Green Version]
- Otmane, A.; Baba Hamed, K.; Bouanani, A.; Kebir, L.W. ’MiseEnÉvidence de La Sécheresse Par l’étude de La VariabilitéClimatiqueDans Le Bassin Versant de l’ouedMekerra (Nord-Ouest Algérien) (Highlighting drought by studying climate variability in the watershed of the Mekerra river (northwest of Algeria)). Tech. Sci. Méthodes 2018, 9, 23–37. [Google Scholar] [CrossRef]
- Kumar, N.; Tischbein, B.; Beg, M.K. Multiple Trend Analysis of Rainfall and Temperature for a Monsoon-Dominated Catchment in India. Meteorol. Atmos. Phys. 2019, 131, 1019–1033. [Google Scholar] [CrossRef]
- Pal, A.B.; Khare, D.; Mishra, P.K.; Singh, L. Trend Analysis of Rainfall, Temperature and Runoff Data: A Case Study of Rangoon Watershed in Nepal. Int. J. Stud. Res. Technol. Manag. 2017, 5, 21–38. [Google Scholar] [CrossRef]
- Panda, A.; Sahu, N. Trend Analysis of Seasonal Rainfall and Temperature Pattern in Kalahandi, Bolangir and Koraput Districts of Odisha, India. Atmos. Sci. Lett. 2019, 20. [Google Scholar] [CrossRef]
- Liuzzo, L.; Bono, E.; Sammartano, V.; Freni, G. Analysis of Spatial and Temporal Rainfall Trends in Sicily during the 1921–2012 Period. Theor. Appl. Climatol. 2016, 126, 113–129. [Google Scholar] [CrossRef]
- Lappas, I.; Tsioumas, I.; Zorapas, V. Spatial-Temporal Analysis, Variation and Distribution of Precipitation in the Water District of Central-Eastern Greece. Bull. Geol. Soc. Greece 2017, 47, 740. [Google Scholar] [CrossRef]
- Wu, H.; Qian, H. Innovative Trend Analysis of Annual and Seasonal Rainfall and Extreme Values in Shaanxi, China, since the 1950s: Trend in Annual and Seasonal Rainfall and Extreme Values in Shaanxi. Int. J. Climatol. 2017, 37, 2582–2592. [Google Scholar] [CrossRef]
- Gocic, M.; Trajkovic, S. Analysis of Changes in Meteorological Variables Using Mann-Kendall and Sen’s Slope Estimator Statistical Tests in Serbia. Glob. Planet. Chang. 2013, 100, 172–182. [Google Scholar] [CrossRef]
- Duhan, D.; Pandey, A. Statistical Analysis of Long Term Spatial and Temporal Trends of Precipitation during 1901–2002 at Madhya Pradesh, India. Atmos. Res. 2013, 122, 136–149. [Google Scholar] [CrossRef]
- Gedefaw, M.; Yan, D.; Wang, H.; Qin, T.; Girma, A.; Abiyu, A.; Batsuren, D. Innovative Trend Analysis of Annual and Seasonal Rainfall Variability in Amhara Regional State, Ethiopia. Atmosphere 2018, 9, 326. [Google Scholar] [CrossRef]
- Machiwal, D.; Jha, M.K. Comparative Evaluation of Statistical Tests for Time Series Analysis: Application to Hydrological Time Series/Evaluation Comparative de Tests Statistiques Pour l’analyse de SériesTemporelles: Application à Des SériesTemporellesHydrologiques. Hydrol. Sci. J. 2008, 53, 353–366. [Google Scholar] [CrossRef]
- Khalil, A.; Ullah, S.; Khan, S.; Manzoor, S.; Gul, A.; Shafiq, M. Applying Time Series and a Non-ParametricApproach to Predict Pattern, Variability, and Number of Rainy Days Per Month. Pol. J. Environ. Stud. 2017, 26, 635–642. [Google Scholar] [CrossRef]
- De Luca, D.; Galasso, L. Stationary and Non-Stationary Frameworks for Extreme Rainfall Time Series in Southern Italy. Water 2018, 10, 1477. [Google Scholar] [CrossRef]
- Hamlaoui-Moulai, L.; Mesbah, M.; Souag-Gamane, D.; Medjerab, A. Detecting Hydro-Climatic Change Using Spatiotemporal Analysis of Rainfall Time Series in Western Algeria. Nat. Hazards 2013, 65, 1293–1311. [Google Scholar] [CrossRef]
- Mrad, D.; Djebbar, Y.; Hammar, Y. Analysis of Trend Rainfall: Case of North-Eastern Algeria. J. Water Land Dev. 2018, 36, 105–115. [Google Scholar] [CrossRef]
- Ghenim, A.N.; Megnounif, A.; Seddini, A.; Terfous, A. Fluctuations hydro-pluviométriques du bassin-versant de l’ouedTafna à BéniBahdel (Nord-Ouest algérien)(Hydro-pluviometric fluctuations of the Tafna wadi watershed in BéniBahdel (Northwest Algeria)). Sécheresse 2010, 21, 115–120. [Google Scholar] [CrossRef]
- Khaldi, A. Impacts de la sécheresse sur le régime des écoulements souterrains dans les massifs calcaires de l’Ouest Algérien “Monts de Tlemcen-Saida”. (Impacts of drought on the regime of underground flows in the limestone massifs of western Algeria “Monts de Tlemcen-Saida). Ph.D. Thesis, Univ. d’Oran, Oran, Algérie, 2005; p. 239. [Google Scholar]
- Ghenim, A.N.; Megnounif, A. Variability and Trend of Annual Maximum Daily Rainfall in Northern Algeria. Int. J. Geophys. 2016, 2016, 1–11. [Google Scholar] [CrossRef]
- Bakreti, A.; Braud, I.; Leblois, E.; Benali, A. Analyse conjointe des régimes pluviométriques et hydrologiques dans le bassin de la Tafna (AlgérieOccidentale)(Joint analysis of rainfall and hydrological regimes in the Tafna basin (Western Algeria)). Hydrol. Sci. J. 2013, 58, 133–151. [Google Scholar] [CrossRef]
- Bouanani, A. Etude de Quelques Sous Bassins de la Tafna (NW–Algérie) (Study of Some Tafna Sub-Basins (NW-Algeria)); University of Abou Bekr Belkaid Tlemcen: Tlemcen, Algeria, 2004. [Google Scholar]
- Ketrouci, K.; Meddi, M.; Abdesselam, B. Study of the extreme floods in Algeria: The case of the Tafna catchment area. Sécheresse 2012, 23, 297–305. [Google Scholar] [CrossRef]
- Huth, R.; Pokorn, L. Parametric versus Non-Parametric Estimates of Climatic Trends. Theor. Appl. Climatol. 2004, 77, 107–112. [Google Scholar] [CrossRef]
- Maftei, C.; Barbulescu, A.; Buta, C.; Serban, C. Change Points Detection and Variability Analysis of Some Precipitation Series. Recent Res.Comput. Tech. Non-Linear Syst. Control 2011, 232–237. [Google Scholar]
- Pettitt, A.N. A Non-Parametric Approach to the Change Point Problem. Appl. Stat. 1979, 28, 126–135. [Google Scholar] [CrossRef]
- Wijngaard, J.B.; Klein Tank, A.M.G.; Können, G.P. Homogeneity of 20th Century European Daily Temperature and Precipitation Series: Homogeneity of European Climate Series. Int. J. Climatol. 2003, 23, 679–692. [Google Scholar] [CrossRef]
- L’Hôte, Y.; Mahé, G.; Somé, B.; Triboulet, J.P. Analysis of a Sahelian Annual Rainfall Index from 1896 to 2000; the Drought Continues. Hydrol. Sci. J. 2002, 47, 563–572. [Google Scholar] [CrossRef]
- Fossou, R.M.N.; Soro, N.; Traore, V.B.; Lasm, T.; Sambou, S.; Soro, T.; Orou, R.K.; Cisse, M.T. Variabilité climatique et son incidence sur les ressources en eaux de surface: Cas des stations de Bocanda et de Dimbokro, Centre-Est de la Côte d’Ivoire en Afrique de l’Ouest (Climate variability and its impact on surface water resources: The case of Bocanda and Dimbokro stations, Center-East of Côte d’Ivoire in West Africa). Afr. Sci. 2014, 10, 118–134. [Google Scholar]
- Traore, V.B. Trends and Shifts in Time Series of Rainfall and Runoff in the Gambia River Watershed. Int. J. Environ. Prot. Policy 2014, 2, 138. [Google Scholar] [CrossRef]
- Hubert, P.; Carbonnel, J.P. Segmentation Annual Series of Major African Rivers Flow. Bind. CIEH Bull. 1993, 3, 92. [Google Scholar]
- Hubert, P.; Carbonnel, J.P.; Chaouche, A. Segmentation of Hydrometeorological Series. Application to a Series of Precipitation and Flow of West Africa. J. Hydrol. 1989, 110, 349–367. [Google Scholar] [CrossRef]
- Isliker, H. A Test for Stationarity:Finding Parts in Time Series APT for Correlation Dimension Estimation. Int. J. Bifuraction Chaos 1993, 3, 1573–1579. [Google Scholar] [CrossRef]
- Witt, A.; Kurths, J.; Pikovsky, A. Testing Stationarity in Time Series. Phys. Rev. E 1998, 58, 11. [Google Scholar] [CrossRef]
- Irannezhad, M.; Marttila, H.; Chen, D.; Kløve, B. Century-Long Variability and Trends in Daily Precipitation Characteristics at Three Finnish Stations. Adv. Clim. Chang. Res. 2016, 7, 54–69. [Google Scholar] [CrossRef]
- Whitley, E.; Ball, J. Statistics Review 6: Nonparametric Methods. Crit. Care 2002, 6, 509. [Google Scholar] [CrossRef] [PubMed]
- Bewick, V.; Cheek, L.; Ball, J. Statistics Review 10: Further Nonparametric Methods. Crit. Care 2004, 8, 196. [Google Scholar] [CrossRef] [PubMed][Green Version]
- Tabari, H.; HosseinzadehTalaee, P. Analysis of Trends in Temperature Data in Arid and Semi-Arid Regions of Iran. Glob. Planet. Chang. 2011, 79, 1–10. [Google Scholar] [CrossRef]
- Sneyers, R. Sur l’analyse Statistique des Séries d’observations; Organisation météorologique mondiale, Note Technique N.143; Secrétariat de l’Organisations Météorologique Mondiale: Genève, Switzerland, 1975; p. 192. [Google Scholar]
- Sen, P.K. Estimates of the Regression Coefficient Based on Kendall’s Tau. J. Am. Stat. Assoc. 1968, 63, 1379–1389. [Google Scholar] [CrossRef]
- Dünkeloh, A.; Jacobeit, J. Circulation Dynamics of Mediterranean Precipitation Variability 1948-98: Circulation Dynamics of Mediterranean Precipitation Variability. Int. J. Climatol. 2003, 23, 1843–1866. [Google Scholar] [CrossRef]
- Philandras, C.M.; Nastos, P.T.; Kapsomenakis, J.; Douvis, K.C.; Tselioudis, G.; Zerefos, C.S. Long Term Precipitation Trends and Variability within the Mediterranean Region. Nat. Hazards Earth Syst. Sci. 2011, 11, 3235–3250. [Google Scholar] [CrossRef]
- Donat, M.G.; Peterson, T.C.; Brunet, M.; King, A.D.; Almazroui, M.; Kolli, R.K.; Boucherf, D.; Al-Mulla, A.Y.; Nour, A.Y.; Aly, A.A.; et al. Changes in Extreme Temperature and Precipitation in the Arab Region: Long-Term Trends and Variability Related to ENSO and NAO: Extreme Temperature and Precipitation in the Arab Region. Int. J. Climatol. 2014, 34, 581–592. [Google Scholar] [CrossRef]
- Tramblay, Y.; Badi, W.; Driouech, F.; El Adlouni, S.; Neppel, L.; Servat, E. Climate Change Impacts on Extreme Precipitation in Morocco. Glob. Planet. Chang. 2012, 82–83, 104–114. [Google Scholar] [CrossRef]
- Nouaceur, Z.; Murărescu, O. Rainfall Variability and Trend Analysis of Annual Rainfall in North Africa. Int. J. Atmospheric Sci. 2016, 2016, 1–12. [Google Scholar] [CrossRef]
- Báez, J.C.; Enrique Salvo, A.; García-Soto, C.; Real, R.; Márquez, A.L.; Flores-Moya, A. Effects of the North Atlantic Oscillation (NAO) and Meteorological Variables on the Annual Alcarria Honey Production in Spain. J. Apic. Res. 2019, 58, 788–791. [Google Scholar] [CrossRef]
- Muñoz-Díaz, D.; Rodrigo, F.S. Effects of the North Atlantic Oscillation on the Probability for Climatic Categories of Local Monthly Rainfall in Southern Spain. Int. J. Climatol. 2003, 23, 381–397. [Google Scholar] [CrossRef]
- Megnounif, A.; Terfous, A.; Ghenaim, A.; Poulet, J.-B. Key Processes Influencing Erosion and Sediment Transport in a Semi-Arid Mediterranean Area: The Upper Tafna Catchment, Algeria/Processus Clefs Influençantl’érosion et Le Transport des SédimentsDans Une Région Semi-ArideMéditerranéenne: Le Bassin Versant de La Haute Tafna, Algérie. Hydrol. Sci. J. 2007, 52, 1271–1284. [Google Scholar] [CrossRef]
- Matari, A.; Douguedroit, A. Chronologie Des Précipitations et Des SécheressesDansl’ouestAlgérien (Chronology of Precipitation and Drought in Western Algeria); Alger, Algeria, 1995. [Google Scholar]
- Wang, L.; Chen, W.; Zhou, W.; Chan, J.C.L.; Barriopedro, D.; Huang, R. Effect of the Climate Shift around Mid-1970s on the Relationship between Wintertime Ural Blocking Circulation and East Asian Climate. Int. J. Climatol. 2009. [Google Scholar] [CrossRef]
- Bouragba, N. Modélisation et Simulation des Changements Climatiques (Climate Change Modeling and Simulation). Mémoire Magister Mascara. 2006. [Google Scholar]
- Nouaceur, Z. Vers Un Retour des Pluies Sur La Rive Sud Du Bassin Mediterraneen Occidental: Analyse Et Evaluation De La Tendance Pluviometrique Sur Plus D’un Demi – Siecle En Algerie. Ann.Valahia Univ. Târgovişte Geogr. Ser. 2011, 11, 6. [Google Scholar]
- Nouaceur, Z.; Murărescu, O. Trend of Rainfall Over Nearly Half a Century in North Africa. Air. Water Compon. Environ. 2016, 84, 9. [Google Scholar]
- Hasanean, H.M. Precipitation Variability Over the Mediterranean and Its Linkage with El Nino Southern Oscillation (ENSO). J. Meteorol. 2004, 29, 151–160. [Google Scholar]
- Nouaceur, Z.; Murărescu, O.; Murătoreanu, G. Rainfall Variability and Trend Analysis of Multiannual Rainfall in Romanian Plain. Ann. Valahia Univ. Targoviste Geogr. Ser. 2017, 17, 124–144. [Google Scholar] [CrossRef][Green Version]
- Liuzzo, L.; Notaro, V.; Freni, G. Uncertainty Related to Climate Change in the Assessment of the DDF Curve Parameters. Environ. Model. Softw. 2017, 96, 1–13. [Google Scholar] [CrossRef]


| Statistical Method | Statistical Test Types | Description |
|---|---|---|
| Change point detection test | Pettitt Test | Detect a single change-point in hydrological or climate data with continuous long-term time series |
| Buishand Test | Detect a change in variables according to any distribution. | |
| Hubert Test | Detect multiple breaks in time series. | |
| Lee and Heghinian Test | Detect change of means in the data with a continuous time series. | |
| Stationarity test | Kruskal-Wallis test | Comparison of the means of several samples and makes it possible to check whether several samples come from the same population and that they have the same characteristics. |
| Jonckheere-Terpstra test | Indicating a trend of independent samples. | |
| Friedman Test | Two-way analysis of variance for indicating and comparing results. | |
| Trend analysis | Mann-Kendall (MK) Trend Test | Non-parametric test, which is commonly employed to detect monotonic trends in series of data for mainly climate or hydrological data. |
| Sen’s Slope Estimator | Computing the linear rate of change (slopes) by choosing the median of the slopes of all lines through pairs of points also computes the upper and lower confidence limits for Sen’s slope. |
| N | Sub Basin | Stations | Code of Station | Longitude (W) | Latitude (N) | Elevation (m) | Area (km2) | Perimeter (km) | Period of Data |
|---|---|---|---|---|---|---|---|---|---|
| 1 | Up stream Sebdou | Sebdou | 16-04-01 | 1°33’ | 34°65’ | 875 | 439.30 | 153.88 | 1979–2011 |
| 2 | Sebdou-Beni Behdel | Beni Bahdel | 16-04-03 | 1°51’ | 34°71’ | 666 | 162.37 | 87.91 | 1979–2011 |
| 3 | Khemis | Khemis | 16-04-06 | 1°56’ | 34°64’ | 920 | 342.22 | 104.35 | 1979–2011 |
| 4 | Oued Boumessao-ud | Hennaya | 16-05-16 | 1°39’ | 34°92’ | 515 | 1979–2011 | ||
| Djbel Chouachi | 16-05-18 | 1°50’ | 34°94’ | 110 | 108.76 | 57.16 | 1979–2011 | ||
| 5 | Chouly | Chouly | 16-06-01 | 1°14’ | 34°83’ | 700 | 1979–2011 | ||
| Merbah | 16-06-02 | 1°17’ | 34°79’ | 1100 | 176.39 | 78.80 | 1979–2011 | ||
| 6 | Isser | Ouled Mimoun | 16-06-07 | 1°03’ | 34°90’ | 705 | 1979–2011 | ||
| 7 | Sidi Benkhala | 16-06-10 | 1°05’ | 35°03’ | 430 | 696.10 | 164.26 | 1979–2011 |
| Stations | ||||||||||
|---|---|---|---|---|---|---|---|---|---|---|
| Statistics | Sebdou | Beni Bahdel | Khemis | Chouly | Merbeh | Sidi Benkhala | Ouled Mimoun | Hennaya | Djbel Chouachi | |
| Mean | 361.8 | 400.4 | 399.3 | 393.9 | 375.2 | 340.5 | 330.6 | 378.3 | 278.7 | |
| Standard Error of Mean | 20.5 | 20.6 | 29.8 | 18.1 | 20.6 | 17.6 | 17.1 | 17.3 | 15.8 | |
| Standard Deviation | 117.9 | 118.2 | 171.2 | 103.7 | 118.6 | 101.1 | 98.4 | 99.4 | 90.6 | |
| Coefficient Variance | 32.6 | 29.5 | 42.9 | 26.3 | 31.6 | 29.7 | 29.7 | 26.3 | 32.5 | |
| Variance | 13,891.2 | 13,966.3 | 29,307.2 | 10,755.6 | 14,055.9 | 10,228.6 | 9674.9 | 9878.9 | 8199.7 | |
| Range | 500.1 | 523.1 | 804.7 | 482.7 | 587.3 | 459.1 | 427.6 | 421.3 | 437.1 | |
| Minimum | 198.8 | 208.7 | 115.2 | 218.4 | 218.4 | 212.3 | 197.9 | 137.9 | 131.2 | |
| Maximum | 698.9 | 731.8 | 919.9 | 701.1 | 805.7 | 671.4 | 625.5 | 559.2 | 568.3 | |
| Skewness | 1.13 | 0.5 | 0.9 | 1 | 1.6 | 1.224 | 1 | -0.2 | 0.9 | |
| Percentiles | 25 | 269.6 | 318.1 | 256.1 | 321.5 | 285.9 | 262.3 | 250.1 | 310.7 | 221.1 |
| 50 | 344.4 | 397.3 | 393.3 | 374 | 341.8 | 321 | 310.8 | 384.6 | 267.8 | |
| 75 | 424.2 | 471.5 | 493 | 451.9 | 434.9 | 404.2 | 382.8 | 457.9 | 333.7 | |
| Value | df | Asymptotic Significance (2-Sided) | |
|---|---|---|---|
| Pearson Chi-Square | 908.309 a | 33 | 0.000 |
| Likelihood Ratio | 973.059 | 33 | 0.000 |
| N of Valid Cases | 108,477 |
| Classification of Range of the Number of Rain Days | |||||||
|---|---|---|---|---|---|---|---|
| [0.1–0.9] | [0] | [1–10] | [10.1–44.9] | ≥45 | |||
| Station | Beni Bahdel | 547 | 9925 | 1182 | 376 | 23 | 12,053 |
| Sidi Benkhala | 788 | 9789 | 1129 | 340 | 7 | 12,053 | |
| Chouly | 640 | 9837 | 1196 | 365 | 15 | 12,053 | |
| Djbel Chouachi | 356 | 10,800 | 627 | 244 | 26 | 12,053 | |
| Hennaya | 631 | 9940 | 1115 | 349 | 18 | 12,053 | |
| Khemis | 330 | 10,297 | 987 | 421 | 18 | 12,053 | |
| Merbeh | 760 | 9747 | 1179 | 357 | 10 | 12,053 | |
| Ouled Mimoun | 311 | 10,246 | 1151 | 338 | 7 | 12,053 | |
| Sebdou | 673 | 9822 | 1214 | 330 | 14 | 12,053 | |
| Total | 5036 | 90,403 | 9780 | 3120 | 138 | 108,477 | |
| Scale | Test | Sebdou | Khemis | Beni Bahdel | Djbel Chouachi | Hen-naya | Chouly | Merbeh | Ould Mimoun | Sidi Benkhala | |
|---|---|---|---|---|---|---|---|---|---|---|---|
| Annual | Kolmogorov-Smirnov | Statistic | 0.15 | 0.09 | 0.08 | 0.11 | 0.11 | 0.11 | 0.14 | 0.11 | 0.16 |
| Significance | 0.06 | 0.20 | 0.20 | 0.20 | 0.20 | 0.20 | 0.1 | 0.20 | 0.02 | ||
| Shapiro-Wilk | Statistic | 0.91 | 0.95 | 0.97 | 0.95 | 0.95 | 0.95 | 0.88 | 0.93 | 0.90 | |
| Significance | 0.01 | 0.15 | 0.55 | 0.13 | 0.87 | 0.13 | 0.002 | 0.002 | 0.005 | ||
| Monthly | Kolmogorov-Smirnov | Statistic | 0.18 | 0.22 | 0.2 | 0.20 | 0.18 | 0.18 | 0.18 | 0.17 | 0.19 |
| Significance | 0.00 | 0.00 | 0.00 | 0.00 | 0.00 | 0.00 | 0.00 | 0.00 | 0.00 | ||
| Shapiro-Wilk | Statistic | 0.82 | 0.74 | 0.79 | 0.81 | 0.83 | 0.83 | 0.82 | 0.85 | 0.82 | |
| Significance | 0.00 | 0.00 | 0.00 | 0.00 | 0.00 | 0.00 | 0.00 | 0.00 | 0.00 | ||
| Test | Investigative Work | Sebdou | Khemis | Beni Bahdel | Djbel Chouachi | Hennaya | Chouly | Merbeh | Ouled Mimoun | Sidi Benkhala |
|---|---|---|---|---|---|---|---|---|---|---|
| Pettitt | Conclusion on H0 | Accepted | Accepted | Accepted | Rejected | Accepted | Accepted | Accepted | Accepted | Accepted |
| Break date | / | / | / | 1999 * | / | / | / | / | / | |
| Hubert | Conclusion on H0 | Accepted | Accepted | Accepted | Rejected | Accepted | Accepted | Accepted | Rejected | Rejected |
| Break date | / | / | / | 2007 ** | / | / | / | 2007 ** | 2007 ** | |
| Buishand | Conclusion on H0 | Accepted | Accepted | Accepted | Rejected | Accepted | Accepted | Accepted | Accepted | Accepted |
| Break date | / | / | / | 1999,2007 | / | / | / | / | / | |
| Lee and Heghinian | Break probability | 0.1267 | 0.1380 | 0.1332 | 0:2345 | 0.2473 | 0.3842 | 0.2183 | 0.5171 | 0.3505 |
| Conclusion on H0 | Rejected | Rejected | Rejected | Rejected | Rejected | Rejected | Rejected | Rejected | Rejected | |
| Break date | 1980 | 2007 | 1980 | 2007 | 1980 | 2007 | 2007 | 2007 | 2007 |
| Sebdou | Khemis | Beni Bahdel | Djbel Chouachi | Hennaya | Chouly | Merbeh | Ouled Mimoun | Sidi Benkhala | |||||||||||||||||||
|---|---|---|---|---|---|---|---|---|---|---|---|---|---|---|---|---|---|---|---|---|---|---|---|---|---|---|---|
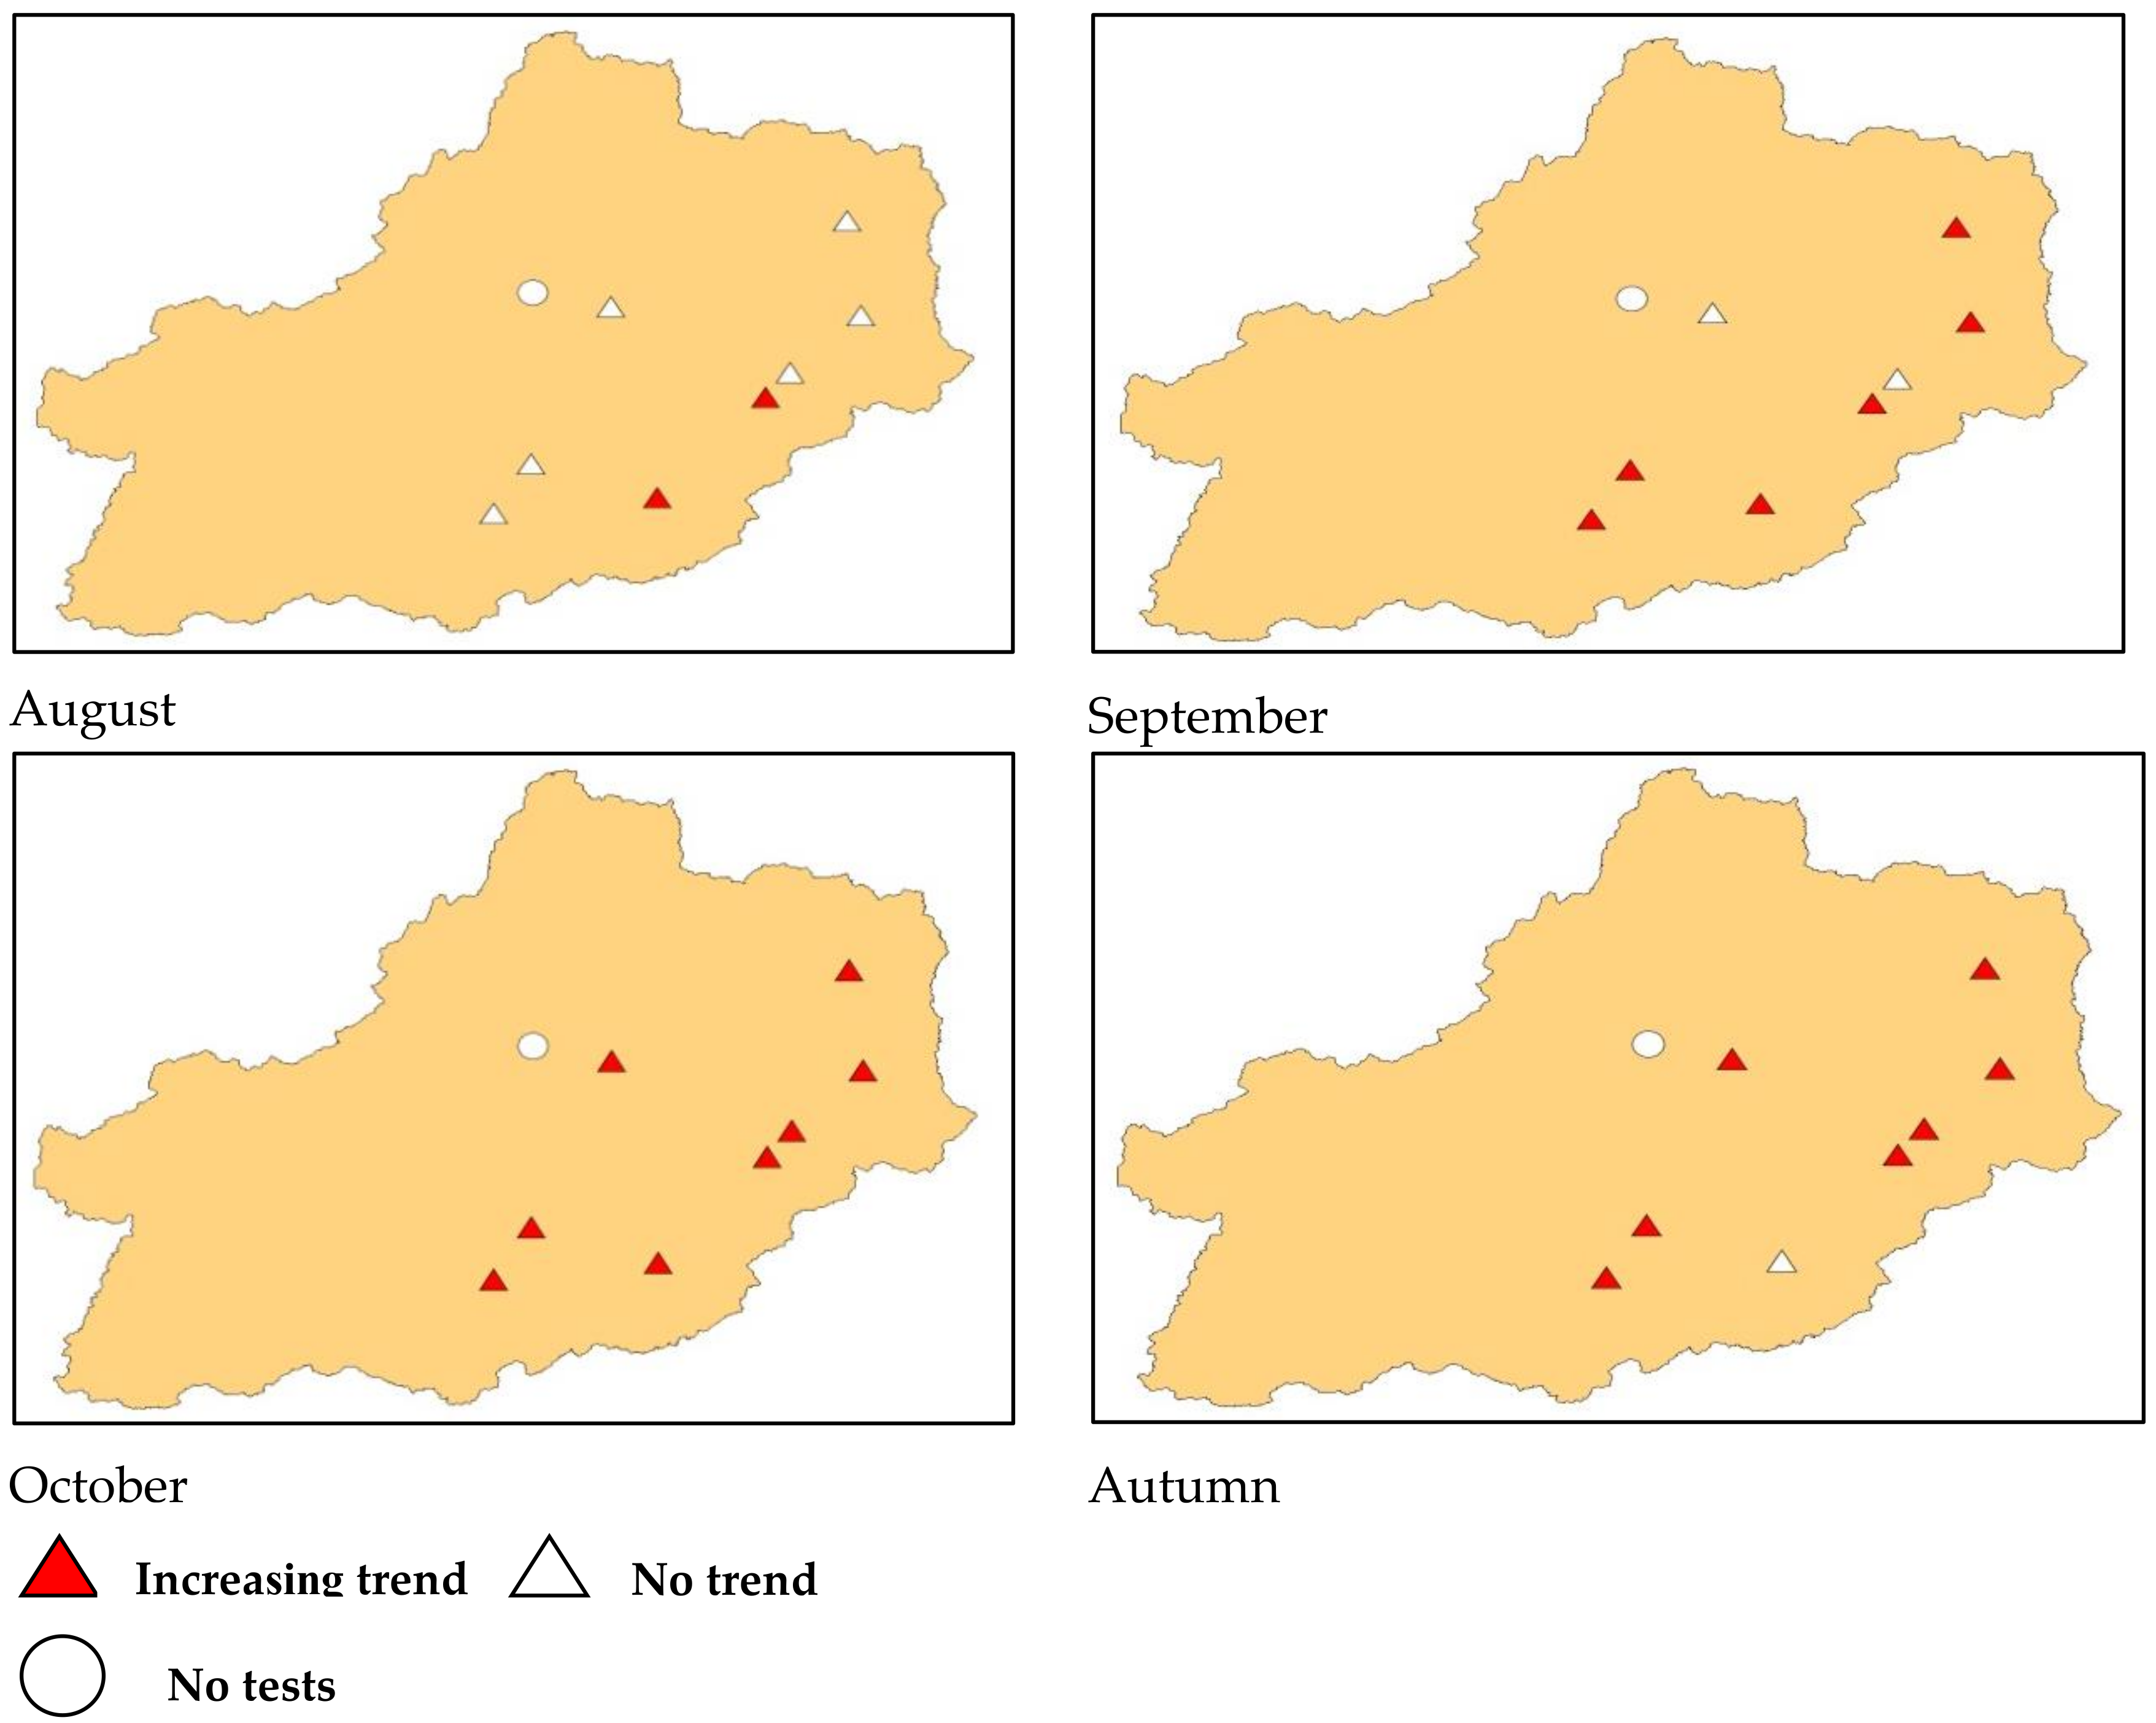
| Test | Sep | Oct | Nov | Sep | Oct | Nov | Sep | Oct | Nov | Sep | Oct | Nov | Sep | Oct | Nov | Sep | Oct | Nov | Sep | Oct | Nov | Sep | Oct | Nov | Sep | Oct | Nov |
| Pettitt | R | A | A | R | R | A | R | R | A | A | A | A | A | R | A | A | A | A | R | R | A | A | A | A | A | R | A |
| Hubert | A | R | R | R | R | A | R | R | A | A | R | A | A | R | A | R | A | A | R | R | A | R | A | A | A | R | A |
| Buishand | R | R | A | R | R | A | R | R | A | A | A | A | A | R | A | R | R | A | R | R | A | R | R | A | R | R | A |
| Lee and Heghinian | R | R | R | R | R | R | R | R | R | R | R | R | R | R | R | R | R | R | R | R | R | R | R | R | R | R | R |
| Test | Dec | Jan | Feb | Dec | Jan | Feb | Dec | Jan | Feb | Dec | Jan | Feb | Dec | Jan | Feb | Dec | Jan | Feb | Dec | Jan | Feb | Dec | Jan | Feb | Dec | Jan | Feb |
| Pettitt | A | A | A | A | A | A | A | A | A | A | A | A | A | A | A | A | A | A | A | A | A | A | A | A | A | A | A |
| Hubert | R | A | A | R | A | A | R | A | A | A | A | A | R | A | A | A | A | A | A | A | A | R | A | A | R | A | A |
| Buishand | A | A | A | NT | A | A | NT | A | A | A | A | A | A | A | A | A | A | A | A | A | A | NT | A | A | A | A | A |
| Lee and Heghinian | R | R | R | R | R | R | NT | R | R | R | R | R | R | R | R | R | R | R | R | R | R | NT | R | R | R | R | R |
| Test | Mar | Apr | May | Mar | Apr | May | Mar | Apr | May | Mar | Apr | May | Mar | Apr | May | Mar | Apr | May | Mar | Apr | May | Mar | Apr | May | Mar | Apr | May |
| Pettitt | A | A | A | A | A | A | A | A | A | A | A | A | A | A | A | A | A | A | A | A | A | A | A | A | A | A | A |
| Hubert | A | A | A | A | A | A | A | A | A | A | A | A | A | A | A | A | R | A | A | A | A | A | A | A | R | A | A |
| Buishand | A | A | A | A | A | A | A | A | A | A | A | A | A | A | A | A | A | A | A | A | A | A | A | A | A | A | A |
| Lee and Heghinian | R | R | R | R | R | R | R | R | R | R | R | R | R | R | R | R | R | R | R | R | R | R | R | R | R | R | R |
| Test | Jun | Jul | Aug | Jun | Jul | Aug | Jun | Jul | Aug | Jun | Jul | Aug | Jun | Jul | Aug | Jun | Jul | Aug | Jun | Jul | Aug | Jun | Jul | Aug | Jun | Jul | Aug |
| Pettitt | A | A | A | A | A | A | A | A | A | A | A | A | A | A | A | A | A | A | A | A | A | A | A | R | A | A | A |
| Hubert | A | A | A | A | A | A | A | A | A | R | A | A | A | A | A | R | A | A | A | A | A | A | A | R | A | A | A |
| Buishand | NT | NT | R | NT | NT | NT | NT | NT | NT | NT | NT | NT | NT | NT | NT | NT | NT | NT | NT | NT | NT | NT | NT | NT | NT | NT | NT |
| Lee and Heghinian | NT | NT | R | NT | NT | NT | NT | NT | NT | NT | NT | NT | NT | NT | NT | NT | NT | NT | NT | NT | NT | NT | NT | NT | NT | NT | NT |
| Test | Statistics | Sebdou | Khemis | Beni Bahdel | Djbel Chouachi | Hennaya | Chouly | Merbeh | Ouled Mimoun | Sidi Bounekhla |
|---|---|---|---|---|---|---|---|---|---|---|
| Kruskal-Wallis test | Kruskal Wallis H | 33.27 | 41.65 | 25.26 | 19.04 | 26.61 | 23.11 | 28.82 | 24.78 | 21.14 |
| Asymp Significance | 0.36 | 0.1 | 0.76 | 0.95 | 0.69 | 0.85 | 0.58 | 0.78 | 0.91 | |
| Jonckheere-Terpstra test | J-T Statistic | 39,288 | 40,970 | 39,990.50 | 40,421 | 39,417.5 | 39,906 | 37,944 | 39,991 | 39,991 |
| Asymp Significance | 0.31 | 0.02 | 0.12 | 0.06 | 0.26 | 0.14 | 0.02 | 0.10 | 0.12 | |
| Friedman Test | Chi Square | 45.60 | 58.56 | 39.72 | 32.58 | 46.60 | 38.82 | 48.08 | 42.93 | 36.93 |
| Asymp Significance | 0.06 | 0.00 | 0.16 | 0.44 | 0.05 | 0.19 | 0.03 | 0.09 | 0.25 |
| Test | Time Series | Sebdou | Khemis | Beni Bahdel | Djbel Chouachi | Hennaya | Chouly | Merbeh | Ouled Mimoun | Sidi Benkhala |
|---|---|---|---|---|---|---|---|---|---|---|
| Test Z | January | 0.39 | 0.37 | 0.71 | −0.26 | 1.27 | 0.99 | 0.84 | 0.34 | 0.81 |
| February | 0.00 | 0.06 | −0.91 | 0.96 | −1.05 | 0.02 | 0.26 | −0.03 | 0.50 | |
| March | −0.70 | −0.29 | −0.29 | 0.22 | −0.56 | −0.15 | −0.88 | −0.22 | −0.85 | |
| April | 0.88 | 1.27 | 0.90 | −0.56 | 0.67 | 1.10 | 1.63 | 1.46 | 1.08 | |
| May | −0.50 | 0.96 | –0.05 | 1.32 | −0.48 | 0.23 | 0.82 | −0.19 | −0.28 | |
| June | −0.03 | 0.29 | 0.74 | 0.00 | 0.48 | 0.03 | 0.06 | −1.00 | −0.21 | |
| July | 0.14 | 0.81 | 1.02 | / | 0.79 | 0.31 | 0.57 | 0.26 | 0.43 | |
| August | 1.71 + | 0.53 | 0.36 | / | −1.20 | 1.55 | 2.29 * | 1.52 | 1.58 | |
| September | 2.56 * | 2.93 ** | 2.19 * | / | 1.36 | 1.63 | 2.08 * | 1.83 + | 1.94 + | |
| October | 2.17 * | 2.59 ** | 1.92 + | / | 2.53 * | 1.77 + | 3.04 ** | 2.47 * | 2.73 ** | |
| November | −0.64 | 0.11 | 0.19 | / | 1.27 | 0.08 | 1.24 | 0.98 | 0.67 | |
| December | −1.53 | −0.48 | −0.70 | / | −0.67 | −0.88 | −0.91 | −1.19 | −0.98 | |
| ANNUAL | −0.20 | 1.35 | 0.42 | / | 0.26 | 0.39 | 1.26 | 1.04 | 0.54 | |
| Spring | −0.60 | 0.85 | −0.09 | / | −0.67 | 0.26 | 0.43 | 0.02 | −0.54 | |
| Summer | 0.60 | 0.30 | 0.53 | / | 0.03 | −0.03 | 0.48 | −0.06 | 0.25 | |
| Autumn | 0.85 | 2.43 * | 1.97* | / | 2.68 ** | 2.06 * | 2.76 ** | 2.56 * | 2.25 * | |
| Winter | −0.45 | −0.17 | −0.26 | / | −0.51 | −0.26 | −0.45 | −0.29 | 0.00 | |
| Q | January | 0.211 | 0.182 | 0.390 | −0.060 | 0.513 | 0.622 | 0.420 | 0.162 | 0.440 |
| February | 0.009 | 0.064 | −0.527 | 0.654 | −0.602 | 0.000 | 0.139 | −0.021 | 0.313 | |
| March | −0.403 | −0.165 | −0.162 | 0.108 | −0.329 | −0.123 | −0.489 | −0.103 | −0.275 | |
| April | 0.267 | 0.646 | 0.522 | −0.135 | 0.388 | 0.589 | 0.800 | 0.593 | 0.485 | |
| May | −0.131 | 0.317 | −0.016 | 0.403 | −0.229 | 0.097 | 0.260 | −0.031 | −0.083 | |
| June | 0.000 | 0.000 | 0.018 | 0.000 | 0.009 | 0.000 | 0.000 | 0.000 | 0.000 | |
| July | 0.000 | 0.000 | 0.000 | / | 0.000 | 0.000 | 0.000 | 0.000 | 0.000 | |
| August | 0.200 | 0.000 | 0.000 | / | −0.019 | 0.024 | 0.181 | 0.020 | 0.005 | |
| September | 0.677 | 0.633 | 0.768 | / | 0.389 | 0.416 | 0.653 | 0.496 | 0.466 | |
| October | 1.119 | 1.116 | 1.005 | / | 1.238 | 0.811 | 1.534 | 1.062 | 0.961 | |
| November | −0.340 | 0.077 | 0.145 | / | 0.743 | 0.071 | 0.702 | 0.553 | 0.275 | |
| December | −0.702 | −0.194 | −0.337 | / | −0.363 | −0.709 | −0.438 | −0.331 | −0.460 | |
| ANNUAL | −0.038 | 0.403 | 0.112 | / | 0.049 | 0.061 | 0.199 | 0.175 | 0.090 | |
| Spring | −0.265 | 0.427 | −0.020 | / | −0.353 | 0.071 | 0.104 | 0.010 | −0.110 | |
| Summer | 0.059 | 0.000 | 0.023 | / | 0.000 | 0.000 | 0.033 | 0.000 | 0.003 | |
| Autumn | 0.320 | 0.858 | 0.731 | / | 0.959 | 0.574 | 0.895 | 0.755 | 0.611 | |
| Winter | −0.265 | −0.118 | −0.260 | / | −0.233 | −0.081 | −0.187 | −0.134 | −0.001 |
© 2020 by the authors. Licensee MDPI, Basel, Switzerland. This article is an open access article distributed under the terms and conditions of the Creative Commons Attribution (CC BY) license (http://creativecommons.org/licenses/by/4.0/).
Share and Cite
Bougara, H.; Hamed, K.B.; Borgemeister, C.; Tischbein, B.; Kumar, N. Analyzing Trend and Variability of Rainfall in The Tafna Basin (Northwestern Algeria). Atmosphere 2020, 11, 347. https://doi.org/10.3390/atmos11040347
Bougara H, Hamed KB, Borgemeister C, Tischbein B, Kumar N. Analyzing Trend and Variability of Rainfall in The Tafna Basin (Northwestern Algeria). Atmosphere. 2020; 11(4):347. https://doi.org/10.3390/atmos11040347
Chicago/Turabian StyleBougara, Hanane, Kamila Baba Hamed, Christian Borgemeister, Bernhard Tischbein, and Navneet Kumar. 2020. "Analyzing Trend and Variability of Rainfall in The Tafna Basin (Northwestern Algeria)" Atmosphere 11, no. 4: 347. https://doi.org/10.3390/atmos11040347
APA StyleBougara, H., Hamed, K. B., Borgemeister, C., Tischbein, B., & Kumar, N. (2020). Analyzing Trend and Variability of Rainfall in The Tafna Basin (Northwestern Algeria). Atmosphere, 11(4), 347. https://doi.org/10.3390/atmos11040347