Article

Genetic Map Construction and Primary Quantitative Trait Locus Analysis of Low-Light-Stress-Related Traits in Cucumber

1
College of Horticulture and Landscape Architecture, Heilongjiang Bayi Agriculture University, Daqing 163319, China
2
College of Horticulture, Northwest A&F University, Yangling 712100, China
3
Qiqihar Branch, Heilongjiang Academy of Agricultural Sciences, Qiqihar 161006, China
*
Author to whom correspondence should be addressed.
Agronomy 2024, 14(5), 1061; https://doi.org/10.3390/agronomy14051061
Submission received: 20 February 2024 / Revised: 1 May 2024 / Accepted: 14 May 2024 / Published: 16 May 2024
(This article belongs to the Topic Vegetable Breeding, Genetics and Genomics)

Abstract

:
To ascertain the effect of low-light stress (80 μmol·m−2·s−1) on cucumbers, we report on improving and breeding low-light-tolerant varieties by mining genes related to low-light tolerance. In this study, the quantitative trait locus (QTL) mapping of cucumber plant height and internode length under low-light stress was conducted using the F2 population, employing specific-length amplified fragment sequencing (SLAF-seq) and phenotypic analysis. A genetic map with a total length of 1114.29 c M was constructed from 1,076,599 SNPs, and 2233 single-nucleotide polymorphism (SNP) markers were distributed on seven linked groups, with an average map distance of 0.50 c M. Two QTLs related to plant height, CsPlH5.1 and CsPlH6.1, were detected on Chr.5 and Chr.6, with a cumulative contribution rate of 16.33%. The contribution rate (PVE), max LOD value, additive effect (ADD), and dominant effect (DOM) of CsPlH5.1 were 9.446%, 4.013, 1.005, and 0.563, respectively. CsPlH5.1 was located between 4,812,907 and 5,159,042 in the Gy14_V2.0 genome of cucumber, with a genetic distance of 0.32 Mb; the interval contained 41 candidate genes, and CsPlH6.1 was found to be located between Marker537985 (171.10 c M) and Marker537984 (171.55 c M), a range containing only one candidate gene. A total of 42 candidate genes related to photosynthesis, chloroplast development, abiotic stress, and plant growth were found in the location range associated with plant height. Simultaneously, a QTL (Csnd2_NdL6.1) for the second internode length was detected, and the max LOD, ADD, and DOM values were 5.689, 0.384, and −0.19, respectively. Csnd2_NdL6.1 was located between 29,572,188 and 29,604,215, with 0.03 Mb on Chr.6 including seven candidate genes. The molecular function of the CsGy6G032300 gene is involved with the binding of calcium ions, which may be related to the elongation and growth of plants; however, the population needs to be further expanded for acceptable localization verification. The results of this study provide a preliminary basis for the mining of essential genes of cucumber’s low-light tolerance and identifying low-light-tolerance genes.

1. Introduction

Cucumber (Cucumis sativus L.) is a vital vegetable crop originating from the Himalayan foothills in Nepal [1]. The global planting area for cucumbers and gherkins is extensive, with the global area harvested and production in 2022 totaling 2,174,347 ha and 94,718,396.55 t, respectively [2,3]. Cucumber growth requires suitable day/night temperatures of 28 °C/18 °C and light conditions of 300 to 800 µmol·m−2·s−1, and the CO2 compensation point and saturation point of cucumber photosynthesis are 69 μL L−1 and 1592 μL L−1, respectively [4]. An increase in low-light stress decreases the photosynthetic capacity of cucumber leaves, as well as the dry matter content; these effects are caused by damage to the chloroplast ultrastructure or a decrease in the chlorophyll content in the leaf and the expression of related genes, even in otherwise good cultivation conditions [5,6]. As a year-round vegetable crop, cucumber production often faces adverse conditions such as continuous rainy weather in the south and low-light stress (the average light intensity is less than 100 µmol·m−2·s−1) in protected areas during winter and spring in the north of China, leading to problems, such as excessive plant elongation, deformed fruits, and increased rates of fruit abortion and diseases, which significantly impact cucumber yield and quality [6]. Therefore, it is crucial to develop cucumber varieties that are tolerant to low light. The utilization of molecular-marker-assisted selection to breed low-light-tolerant cucumber varieties is one of the most effective ways to solve the problem of low-light stress in cucumber production. Research on the low-light tolerance of cucumber dates back to the 1990s [7]; while most of the existing studies have focused on its interaction with low temperatures, there have been few reports on the mapping construction of cucumber and QTL localization under low-light conditions.
Analyzing the regulatory mechanism of the ideal plant type under low light is the key and prerequisite for selecting an ideal plant type, with an appropriate plant height and reasonable leaf and branch distribution, for breeding low-light-tolerant cucumber varieties. Previous research has established that a short period of low-light conditions can promote plant growth and the lengthening of internodes, which is conducive to the plant’s absorbing more light to adapt to the low-light environment [7]. However, others found that low-light stress significantly inhibited the plant height and stem growth of cucumber [8], watermelon [9], melon [10], and tomato [11]. Cucumber plant height and internode length are quantitative genetic traits controlled by multiple genes [12,13]. Many QTLs have been detected in previous studies, such as the QTLs of the main stem length (F-de, OP-R13-OP-H5, ll-BC-592, U15-2-OP-I20, and OP-AB14-BC-469) [14] and four quantitative trait loci related to plant height, namely, Qchl1, Qchl2, QPH4_1, and QPH4_2 [15,16]; moreover, 11 QTLs related to plant height, internode length, and the segment number have been located [17,18].
SLAF-seq technology has been used for high-density map construction and QTL localization in many crops; it is widely used for SNP marker development and gene localization in horticultural crops such as cucumber [19], pepper [20], melons [21,22], apples [23], eggplants [24], strawberries [25], etc. In recent years, the excavation of genes related to cucumber plant type has promoted the improvement of cucumber plant types; these include dwarfing genes CsDET2 [26], CsCYP85A [27], ll (little leaf) [28], scl1 (small and cordate leaf 1) [29], etc. Extensive studies have focused on the roles of dwarfing genes cp [30], CsCLAVATA1 [31], and CsGN5 [32] and internode gene CsIVP [33]. Many morphological OTLs and genes have been reported; however, little of the QTL mapping of plant height and internode length has been performed under low light; therefore, our study aims to map and mine genes of cucumber plant height and internode length under low-light stress, to provide a theoretical basis for low-light-tolerance gene mining, germplasm resource innovation, and marker-assisted selection breeding.

2. Materials and Methods

2.1. Plant Materials

The experiments were performed with two segregated populations of cucumber; the F2-2021 (N = 131) and F2-2022 (N = 153) populations originated from a cross between the low-light-tolerant homozygous inbred line WI (P1) and the low-light-intolerant homozygous inbred line M14 (P2). In total, 338 cucumber seeds were sown in substrate (peat 70% + perlite 25% + decomposed organic fertilizer 5%) in the phytotron of Heilongjiang Bayi Agricultural University (Daqing, Heilongjiang province, 125°03′ east longitude, 46°58′ north latitude) in the springs of 2021 and 2022. The plants were cultivated under normal daily light flux density (500 μmol·m−2·s−1), and when the plants reached the two-leaf stage, they were treated with low-light stress, with an average daily light flux density of 80 μmol·m−2·s−1 for 15 days in 2021 and 7 days in 2022, respectively. Normal fertilizer and water management was conducted for cucumber plant cultivation; cultivated plants were provided with the same light time of 16 h per day, a temperature of 28 °C/18 °C (day/night), and a relative humidity of 70%. Leaves were then collected for mapping and QTL analysis of plant height and the second internode length. The parental forms of both populations resulted from a recombinant breeding program established in previous research, and the seeds used in the experiment were obtained from the cucumber research group of Heilongjiang Bayi Agricultural University.

2.2. Phenotypic Data Collection

The plant height and the second internode length of the parents and their offspring were measured using a ruler after 15 days of the low-light treatment. Parents and F1 materials were planted with 3 replicates, 3 plants per replicate, and a total of 9 single parent or F1 phenotypic data were obtained. The data obtained from the F2 population single plants over two years were analyzed for population genetic variation. Phenotypic data were recorded as the averages of three replications, and the healthy and young leaves were stored at −80 ℃ for DNA extraction and SLAF-seq.

2.3. DNA Extraction and SLAF-seq

A total of 266 F2 plants and parental lines were genotyped using SLAF-seq. Leaf genome DNA was extracted using the cetyl-trimethylammonium bromide (CTAB) method [34], diluted to 50–100 ng, and quantified with an ND-2000 spectrophotometer (Nano Drop, Wilmington, DE, USA); the value of OD260/OD280 is about 1.8, indicating high DNA purity. Enzyme digestion experiments were conducted on the genomes of each qualified sample using the optimal endonuclease combination RsaI+HaeIII; the selection of this combination was based on the size, Q30, and GC contents of the cucumber genome. Sequences with enzyme digestion fragment lengths between 264 and 364 bp were defined as SLAF tags; 102,715 SLAF tags were predicted in total. The SLAF-seq library was sequenced using an Illumina HiSeq 2500 system (Illumina, Inc., San Diego, CA, USA) by Biomark, Inc., Beijing, China, and the original sequencing read length of the SLAF-seq library was PE125 bp. SOAP software 1.2 [35] was used to compare the control sequencing reads with the reference genome. SLAF markers were defined according to similarly clustered sequences of each sample, and polymorphic SLAF markers were identified by comparing the sequencing data of the different samples.

2.4. Map Construction and QTL Analysis

GATK-3.8 was utilized to find SNP sites shared between parents at each SLAF site, while BWA software version 0.7.10 was utilized to align high-quality reads to the cucumber reference genome Gy14_V2.0. Paired readings mapped at the same position and with a homology of more than 95% were combined into a single SLAF site. By comparing the genome reads, SLAFs of parents and offspring were utilized to search for polymorphic SLAFs based on SNP mutations. To enhance the genetic map quality and QTL detection accuracy, polymorphic SLAF markers were screened and compared with the cucumber reference genome to observe their distribution across chromosomes. Finally, the obtained markers were linearly arranged by using the Map Chart software V1.0 and the genetic distance between adjacent markers was estimated. High-Map-1.1.6 software was used to develop molecular markers and construct high-density genetic maps. Subsequently, the QTLs were mapped for genes related to the traits of interest. Based on phenotypic data, the Map QTL method was used for preliminary analysis of cucumber-related traits under low light. The LOD threshold was 3.0. Each QTL was named by the abbreviation + chromosome number + site-serial-number method.

2.5. Data Analysis

The experimental data were statistically analyzed, and the mean and standard error were calculated using Microsoft Excel and SPSS18. Origin 2021 software was used for graphical analysis. The normality of the distribution of phenotypic data was tested using the Kolmogorov–Smirnov, Lilliefors, and Shapiro–Wilk tests. Duncan’s multiple range test was used to assess the significance of differences in plant height and the second internode length between the different cucumber lines. The variation range and peak values of genotypes, years, and their interactions with the targeted population traits were evaluated using SAS v9.4 (SAS Institute Inc., Cary, NC, USA). The QTL genetic map of cucumber population traits was mapped using QTL licMapping4.2 and Chart Maker.

3. Results

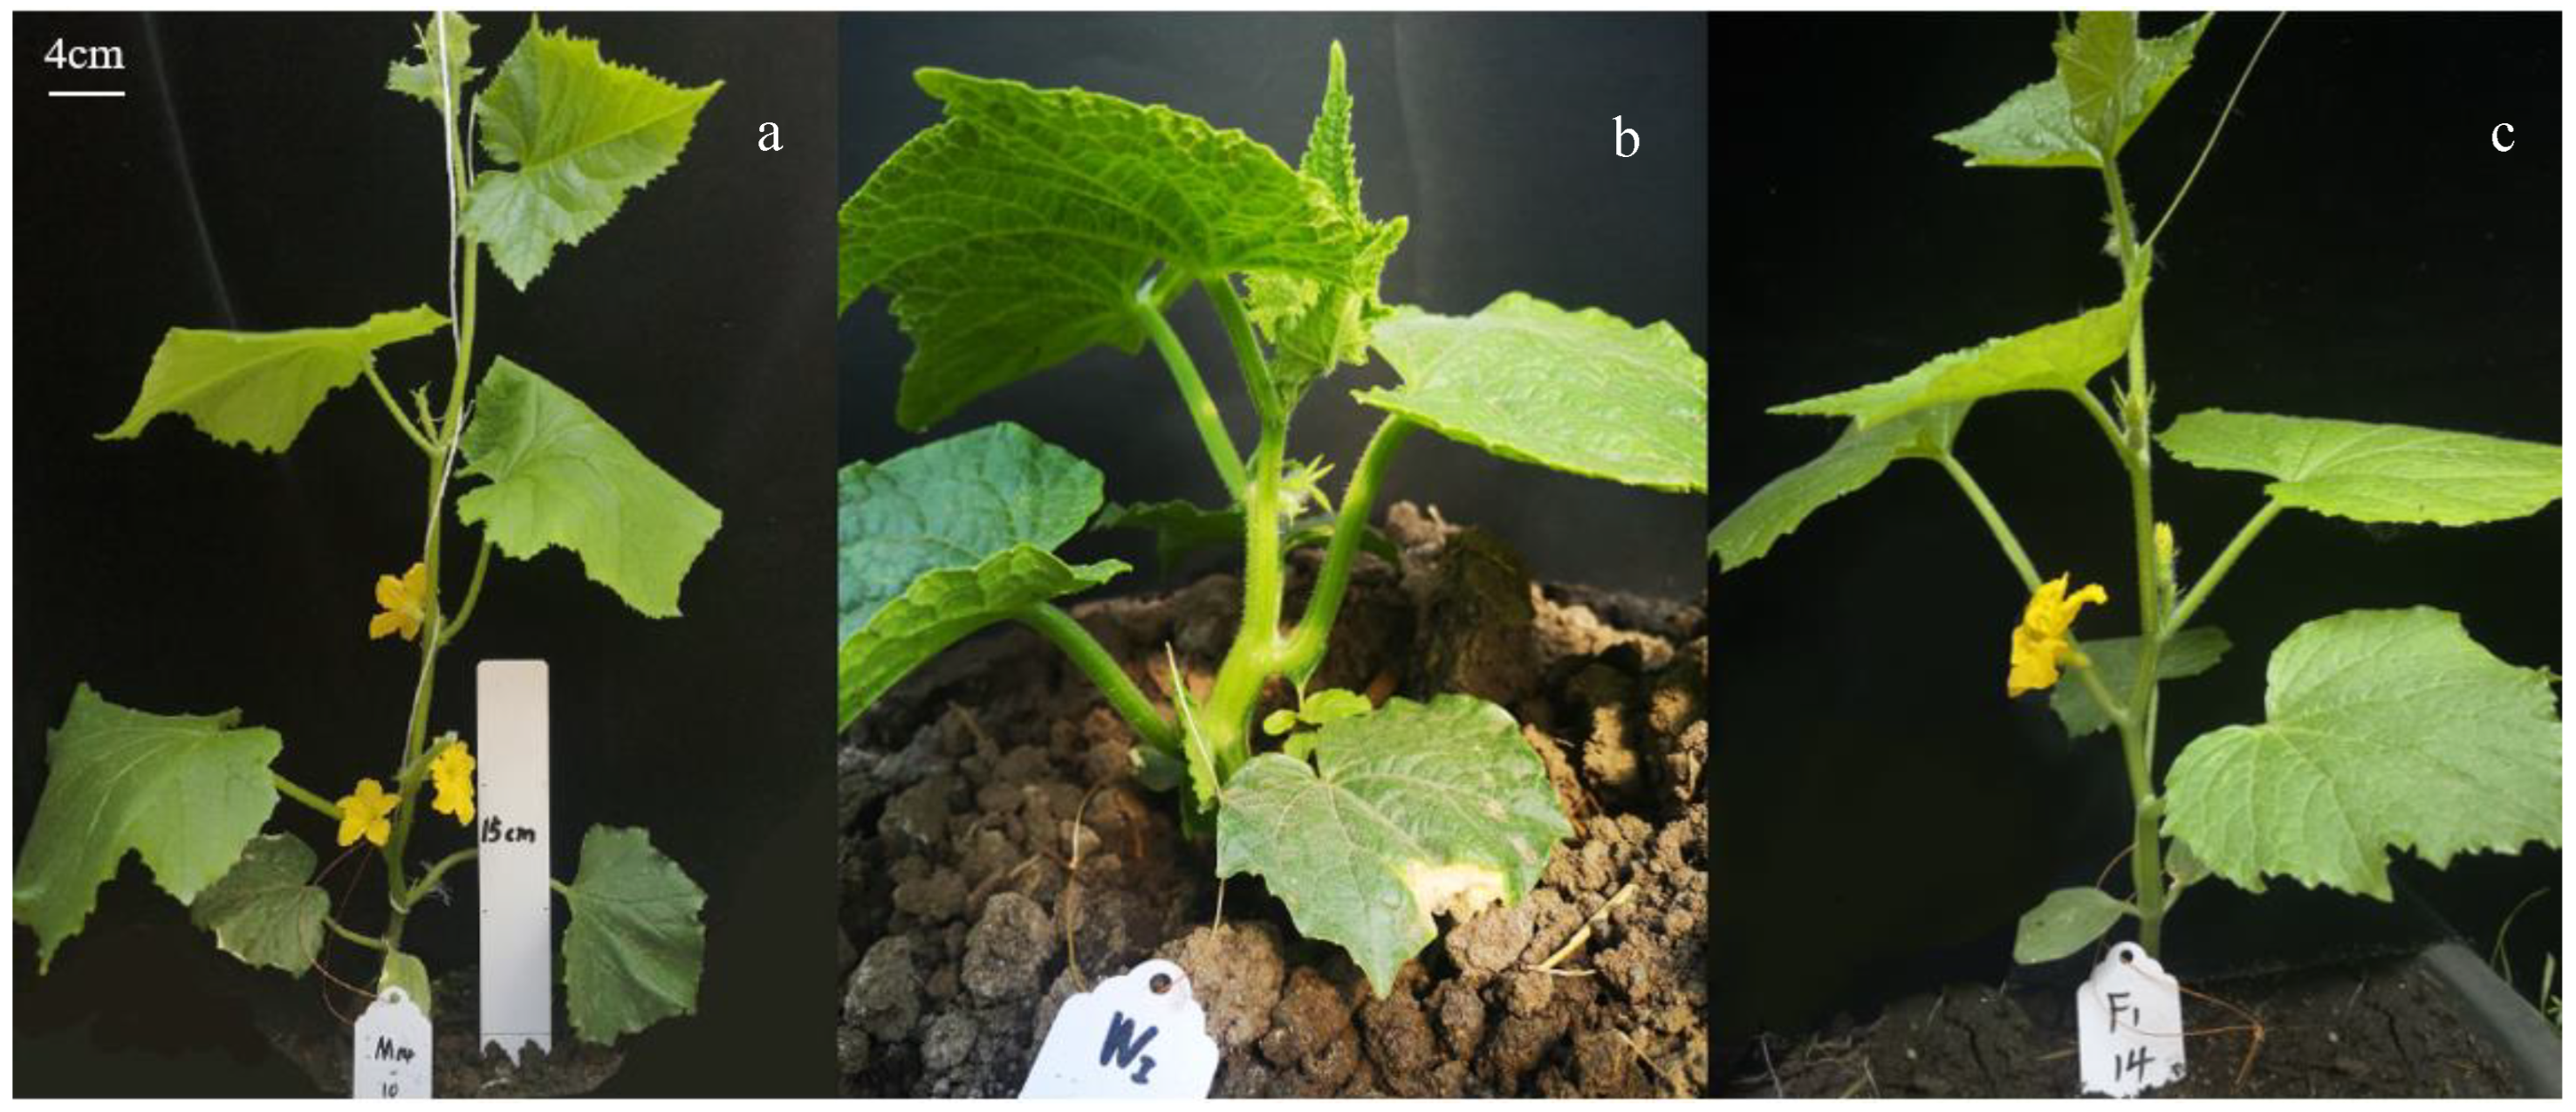
3.1. Phenotypic Characteristics of Parents of Different Tolerance and F1 under Low-Light Stress

The effects of low-light stress on parent plants of different tolerance were significantly different; the low-light-tolerant line WI grew robust under low light, while M14 plants, intolerant to low light, grew slender and thin (Figure 1). The parent plants displayed significant differences in plant height, and the second internode lengths of the WI plants were 26.44 cm and 1.61 cm, respectively. In comparison, the plant height and internode length of the low-light-tolerant parent M14 were 66.11 cm and 1.38 cm, respectively; the F1 values were somewhere between those of the parents, at 52.64 cm and 1.52 cm, respectively (Table S1).

3.2. Phenotypic Analysis of an F2 Isolated Population under Low Light

The plant height of the F2 isolated population in 2021 showed a normal distribution (Figure 2a), in which the variation range of the plant height was 15.90–62.50 cm, with a kurtosis (SEK) of −0.660, skewness (SES) of −0.036, and coefficient of variation (CV) of 0.247. In 2022, the plant height also showed a bimodal distribution (Figure 2d), and the phenotypic variation was similar to that seen in 2021 (Figure 2b). The CV of the second internode length in the F2 population was more extensive than that of the plant height, indicating that the variation degree of the second internode length was greater than that of plant height (Table 1).

3.3. Quantity Analysis of SLAF-seq

A total of 296,908,762 reads were obtained, and the average sequencing depths of the labeled parents’ offspring in the genetic map were 14.09X and 25.52X, respectively. The average sequencing Q30 was 93.96%, and the average GC content distribution of samples was normal, with 41.44%. The WI sequences were composed of 28,924,098 reads, with an average Q30 of 89.04% and an average GC content of 37.60%; and 28 536 117 sequenced reads of M14, with an average Q30 of 89.53% and an average GC content of 38.27%. The F2 population had 2,119,013 sequences, with an average Q30 of 94.04% and an average GC content of 41.50%, indicating a normal GC distribution. The efficiency of double-end comparison in this library was 91.96%, while the enzyme digestion efficiency was 89.83%; therefore, the SLAF library in this study was constructed correctly (Table S2).

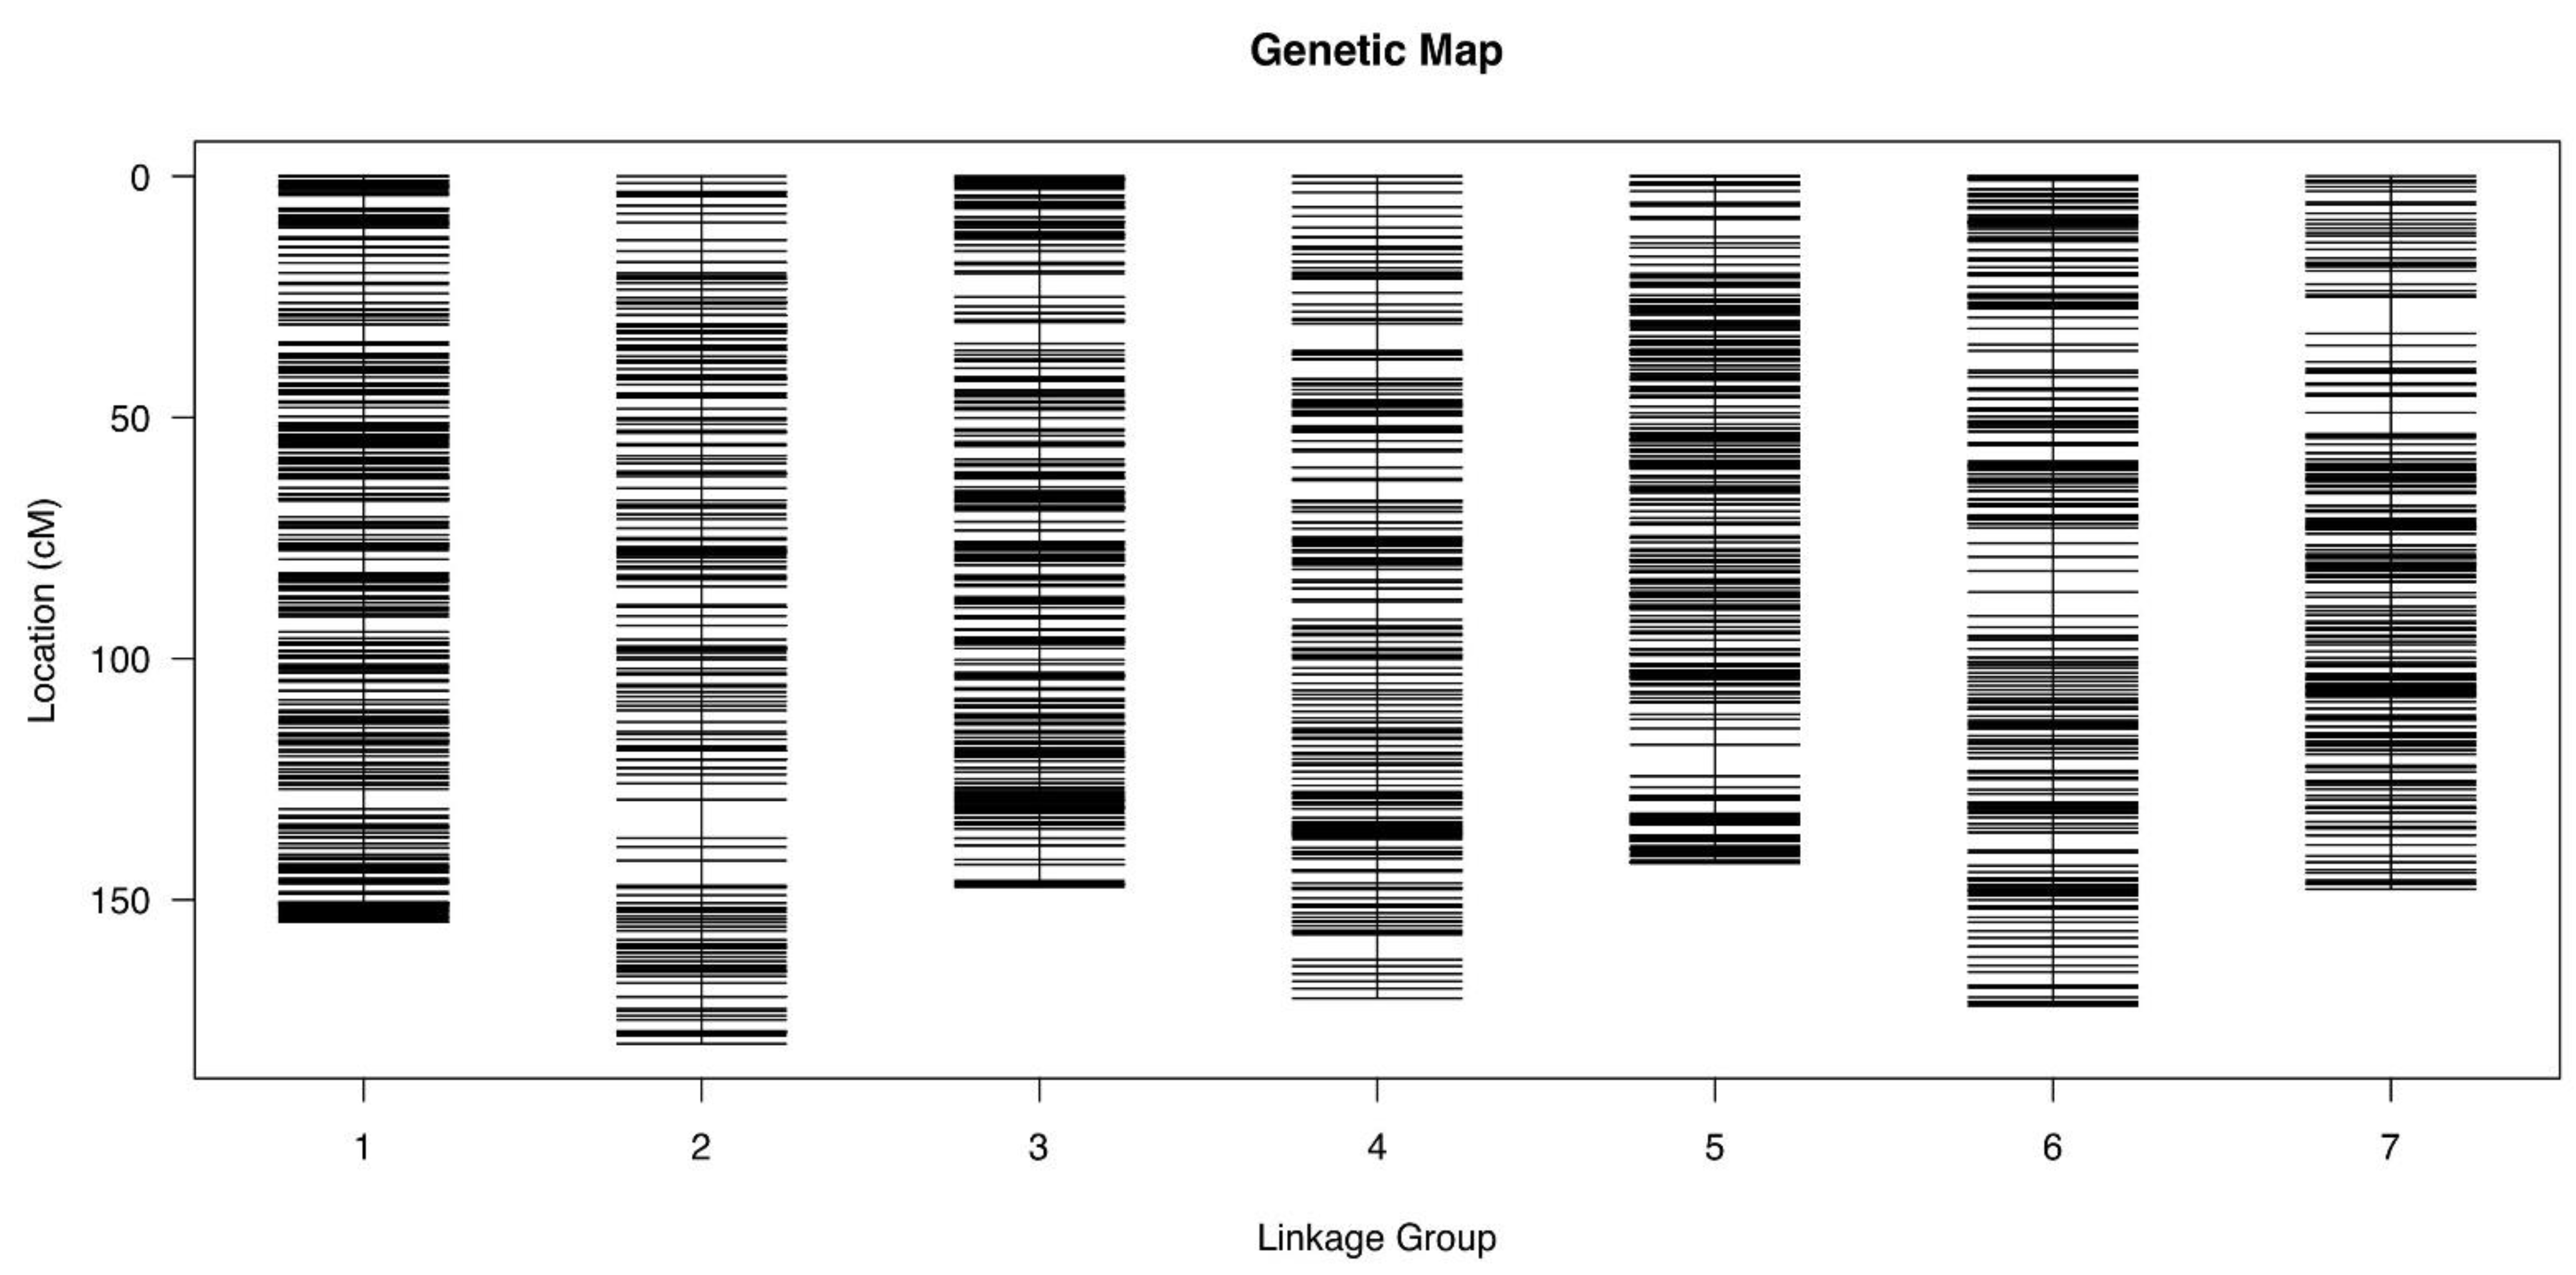
3.4. Marker Development and Construction of SLAF Genetic Map

The GATK-3.8 software was utilized for data alignment and SNP development for the parental lines and offspring. The results showed that WI and M14 developed 528,629 and 642,036 SNP tags, with heterozygosity rates of 16.92% and 6.39%, respectively. The offspring population developed 100,868.51 tags, exhibiting a heterozygosity rate of 26.86%. The homozygous SNPs for WI, M14, and F1 were 439,185, 601,010, and 73,775.23, respectively, as shown in Table 2. A total of 1,076,599 SNPs tags were obtained, with 604,638 being successfully genotyped. A total of 496,263 tags, consisting of 496–263 aa×bb-type SNP tags, constituted 46.10% of all developed SNP tags utilized in constructing a genetic map. There were 580,336 non-aa×bb tags, representing 53.90% of all produced SNP tags (Table S3).
In the established genetic map, 2233 markers were located on seven linkage groups, each including 319 markers on average, with a total distance of 1114.29 c M, and the average distance was 0.50 c M. Chr.1 had the highest number of markers, 427, while Chr.2 had the lowest number, 248. There was no biased separation of markers for the seven examined chromosomes. The linkage degree between markers, as expressed by Gap < 5, ranged from 99.00% to 100%, with an average value of 99.68%. The most considerable gap value in the seven chromosomes was 7.94 c M (Table 3; Figure 3).

3.5. QTL Analysis

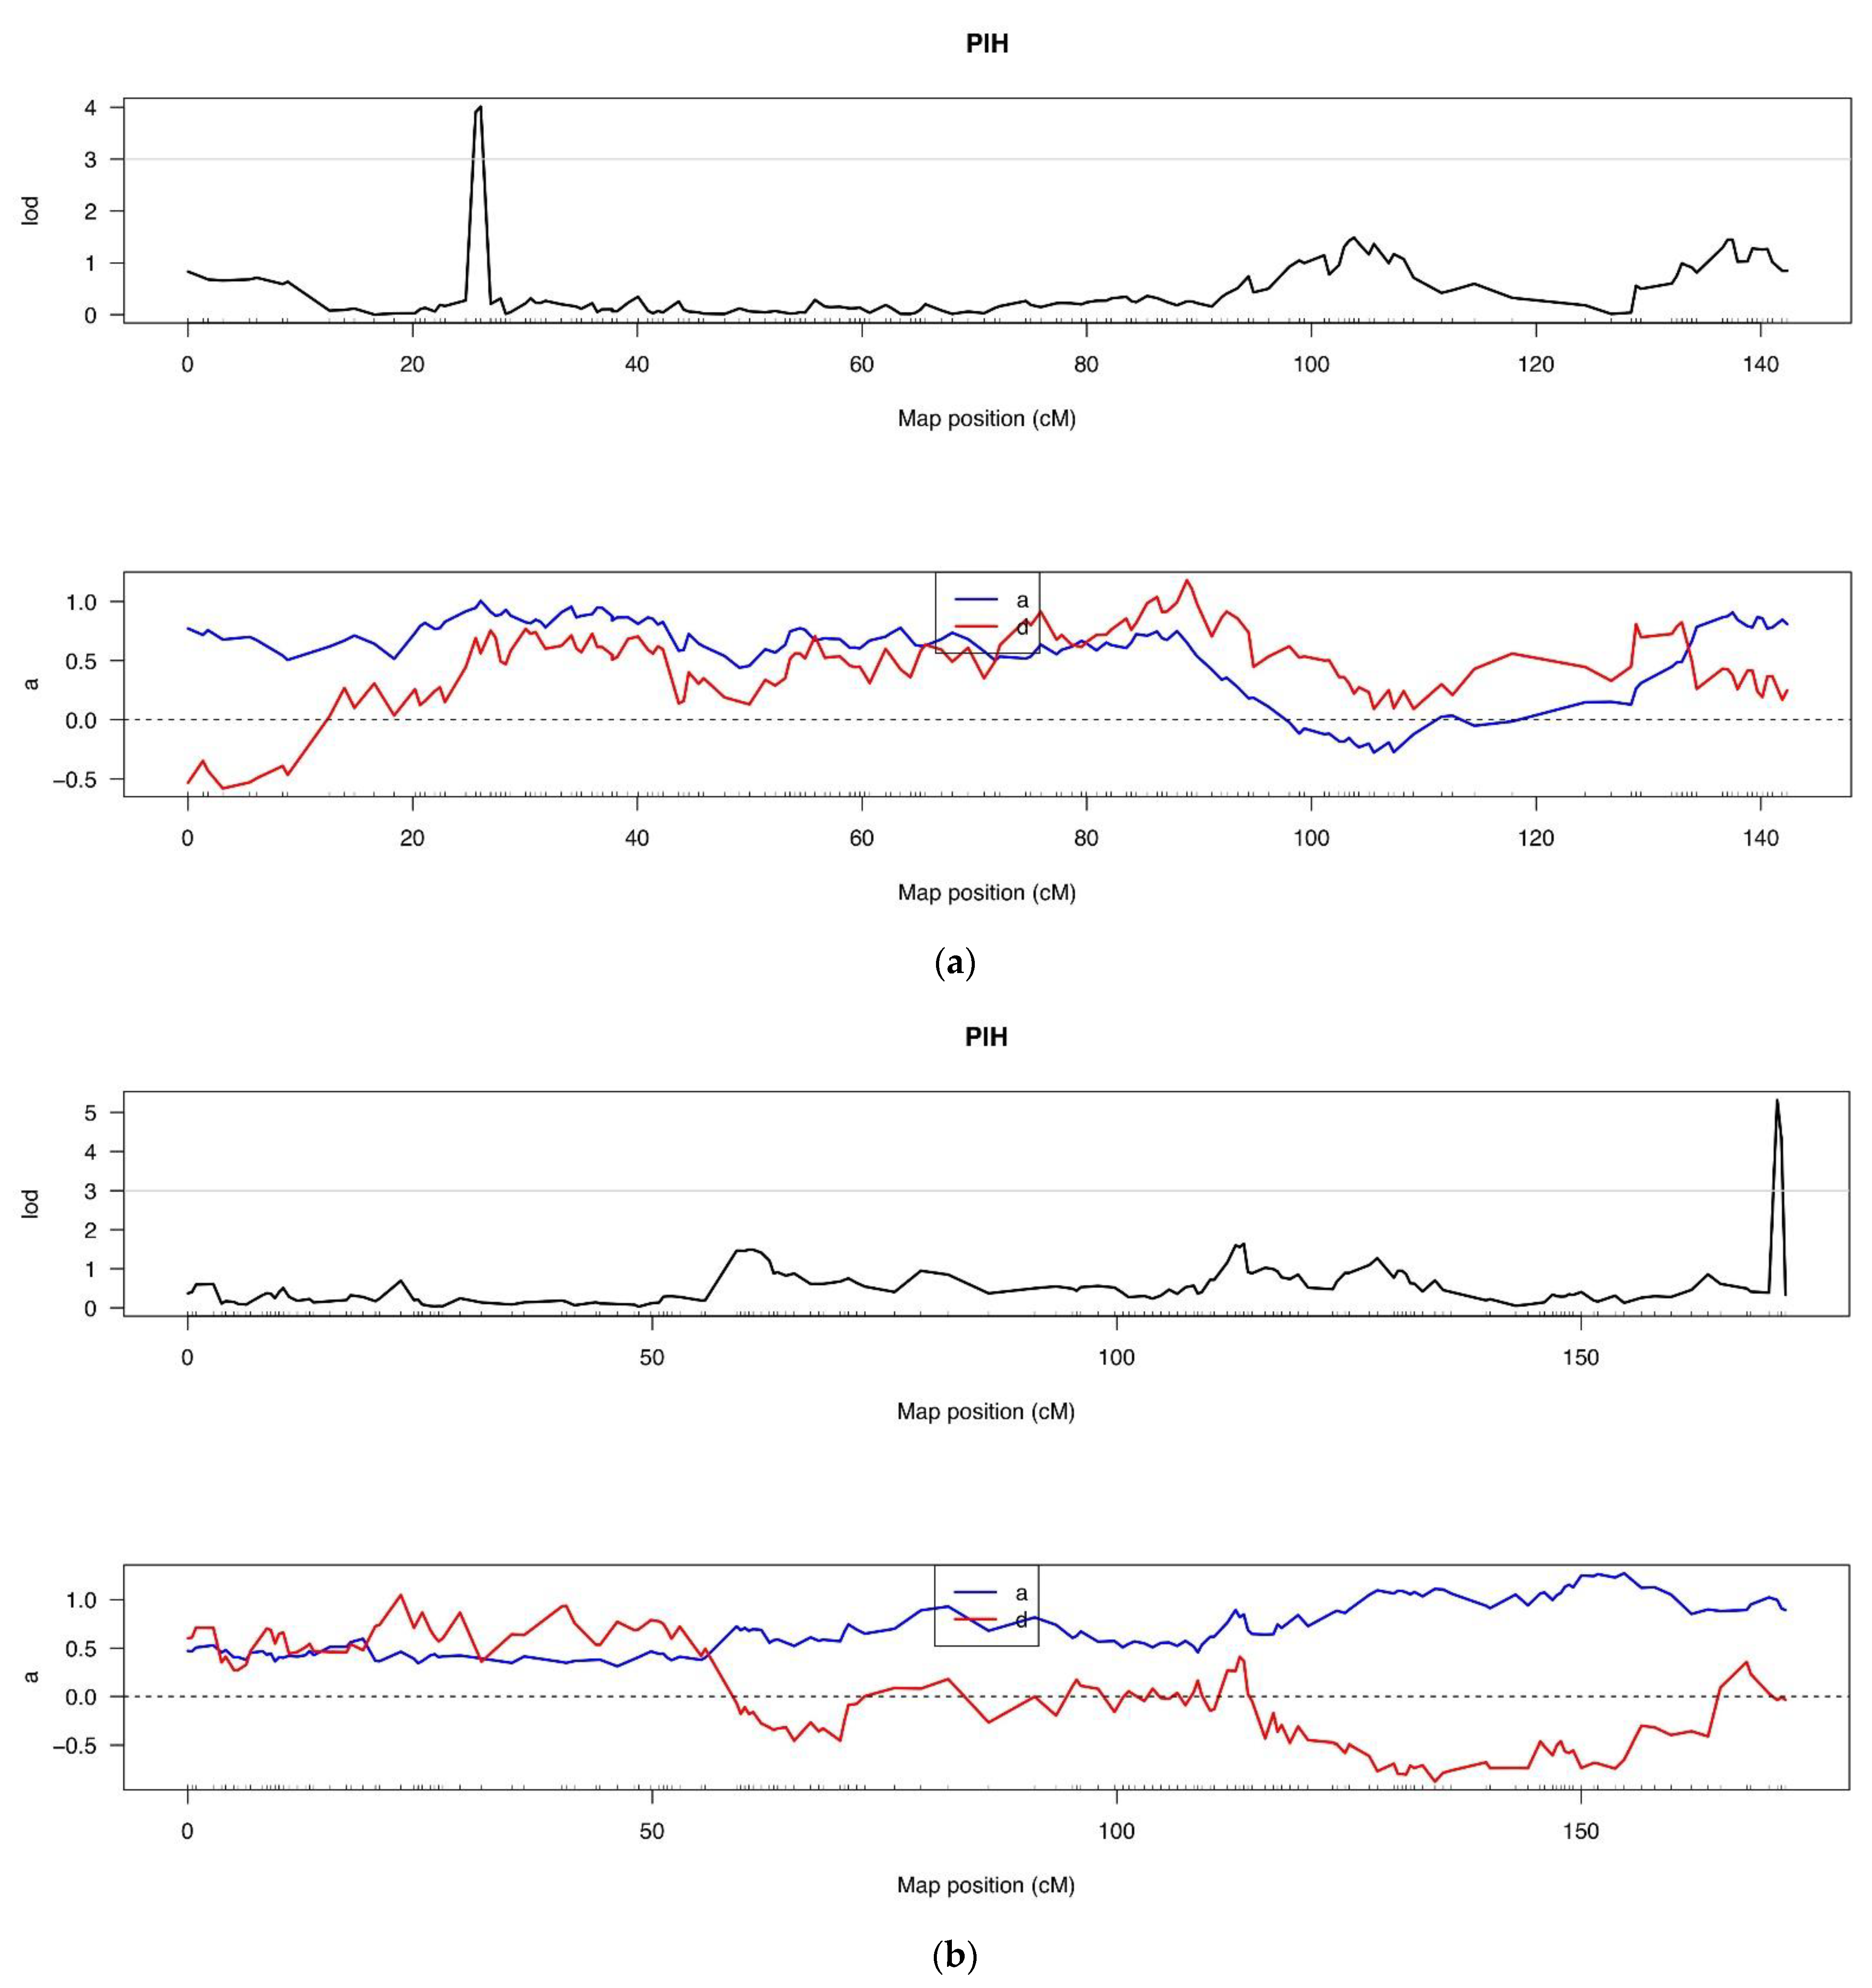
3.5.1. QTL Analysis of Plant Height under Low-Light Conditions

Two QTLs were identified for plant height in cucumber under low-light conditions, located on Chr.5 and Chr.6, with a total contribution rate of 16.33% for the plant height trait. The QTL CsPlH5.1 on Chr.5 had a significant contribution rate of 9.446%, with a peak LOD value of 4.013 and LOD value of 3.0, which exhibited an additive effect of 1.005 and a dominance effect of 0.563. The region spanned from Marker382711 (25.61 c M) to Marker382610 (26.05 c M), covering a genomic range of 4,812,907 to 5,159,042, totaling 0.35 Mb and containing 41 candidate genes. The QTL CsPlH6.1 on Chr.6 was located between Marker537985 (171.10 c M) and Marker537984 (171.55 c M), with a contribution rate of 6.887%, a max LOD value of 5.318, LOD value of 3.0, ADD effect of 0.997, and DOM effect of −0.037. This candidate region covered the genomic range of 31,658,938 to 31,658,958, spanning 20 bp and containing one candidate gene (Table 4, Figure 4a,b).

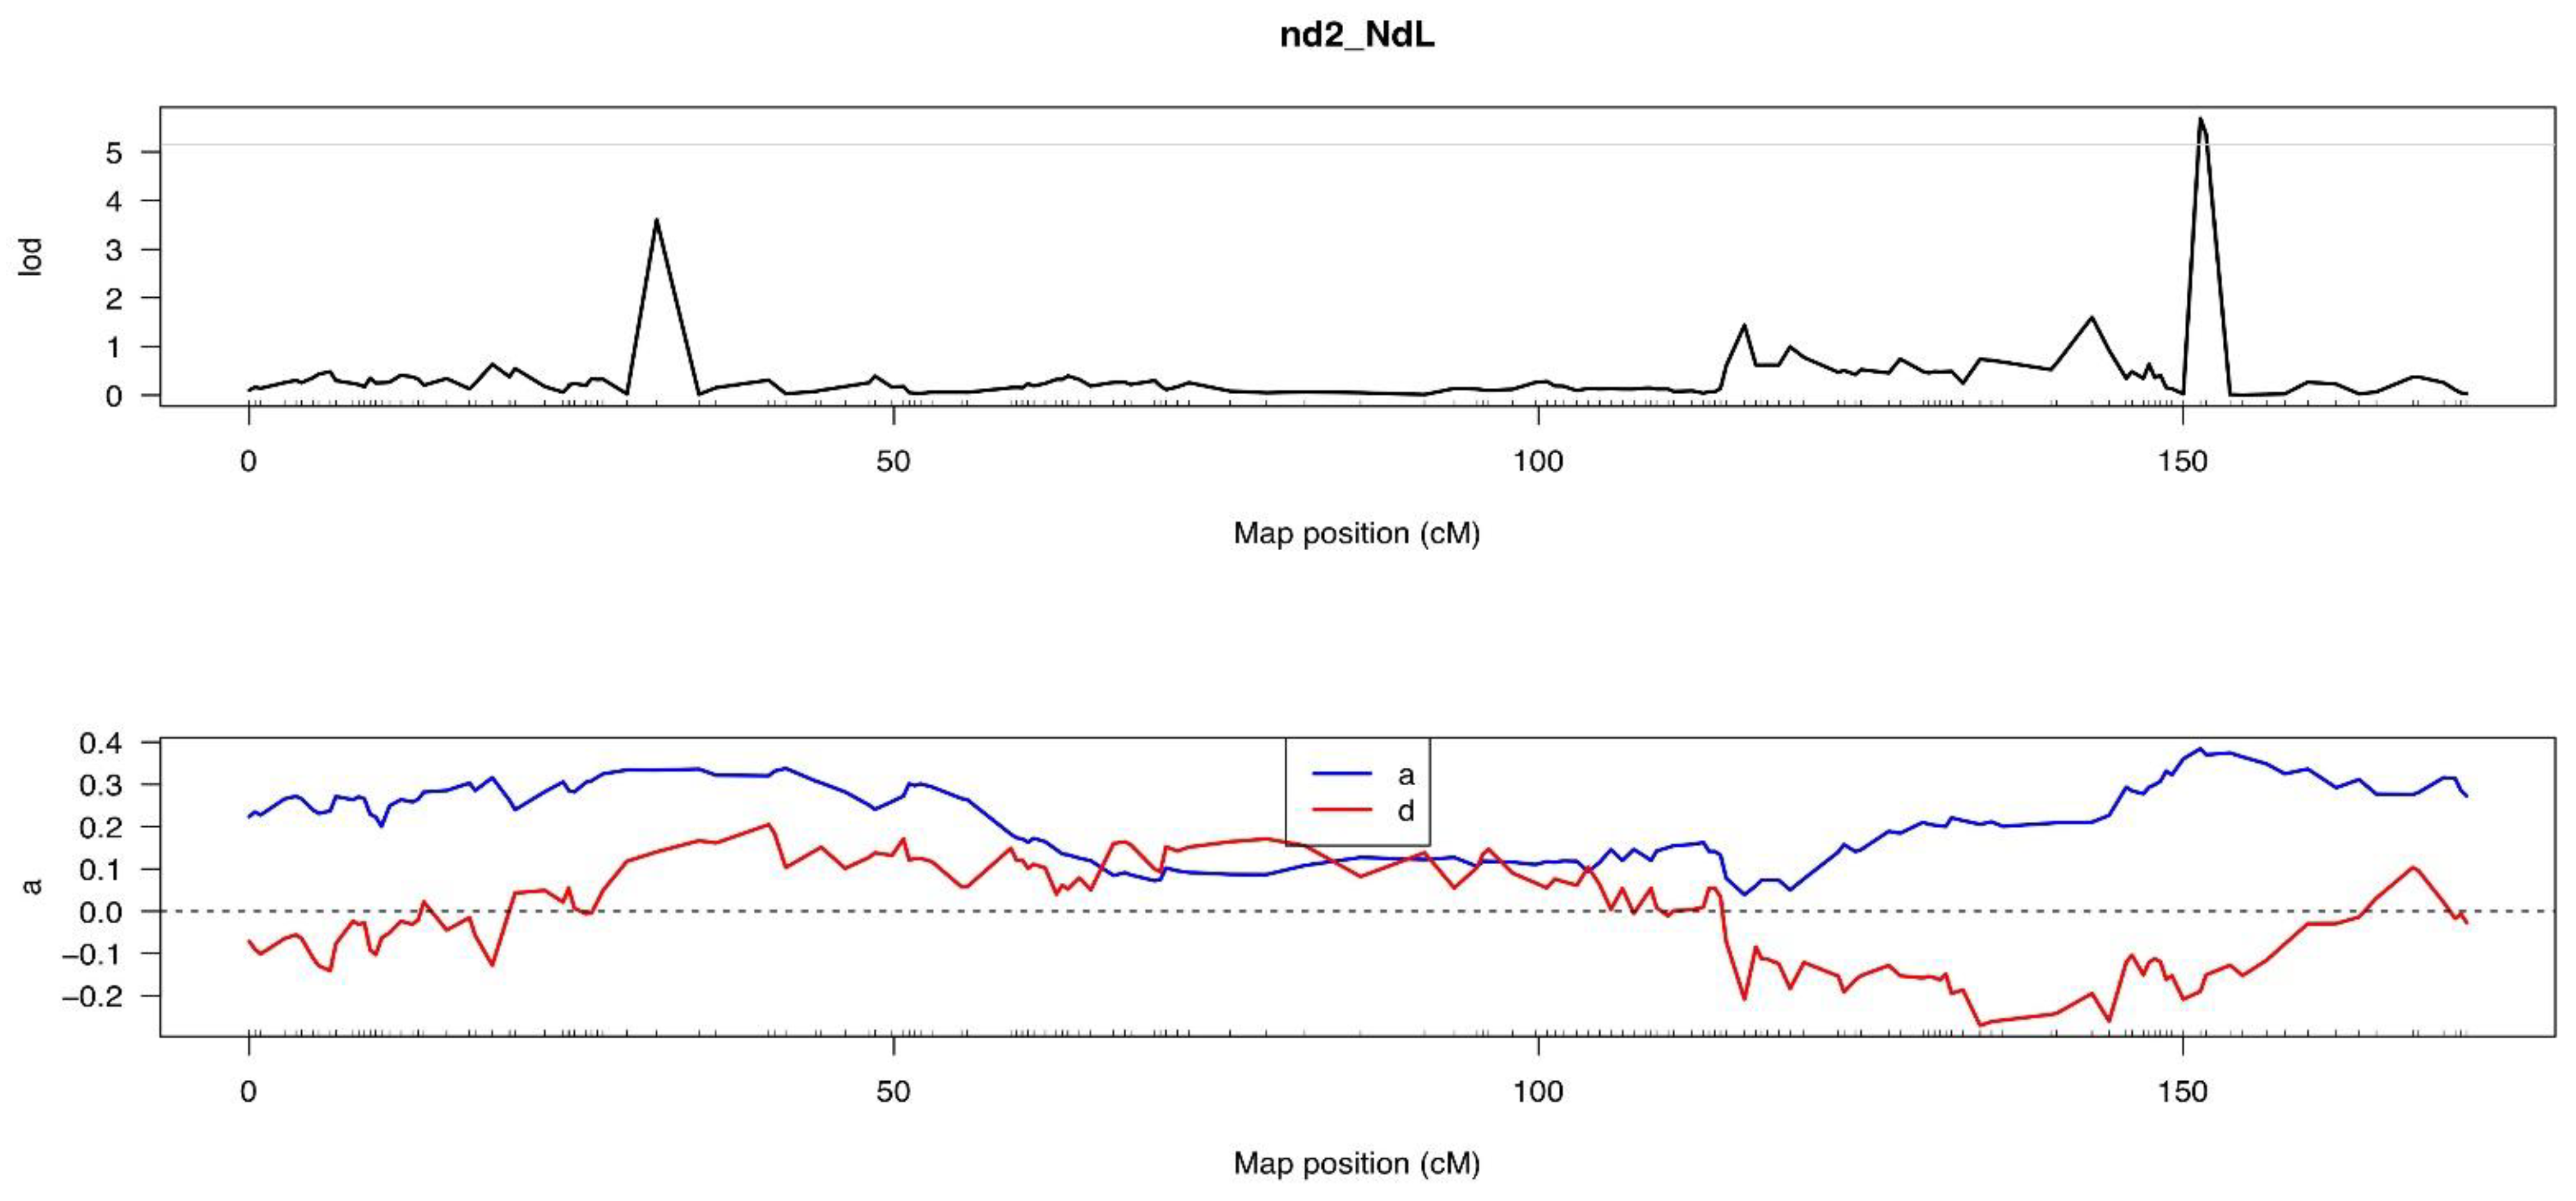
3.5.2. The Second Internode Length

A QTL named nd2_NdL6.1 was identified for the second internode length of cucumber under low-light conditions, as located on Chr.6. The peak LOD value of this QTL was 5.689, with an LOD value of 5.148. Furthermore, it showed an additive effect of 0.384 and a dominance effect of −0.19. This region extends from Marker533236 (151.34) to Marker533459 (151.78), including the genomic range of 29,572,188 to 29,604,215, totaling 0.03 Mb and containing seven candidate genes (Table 5; Figure 5).

3.6. Candidate Gene Screening and Function Prediction

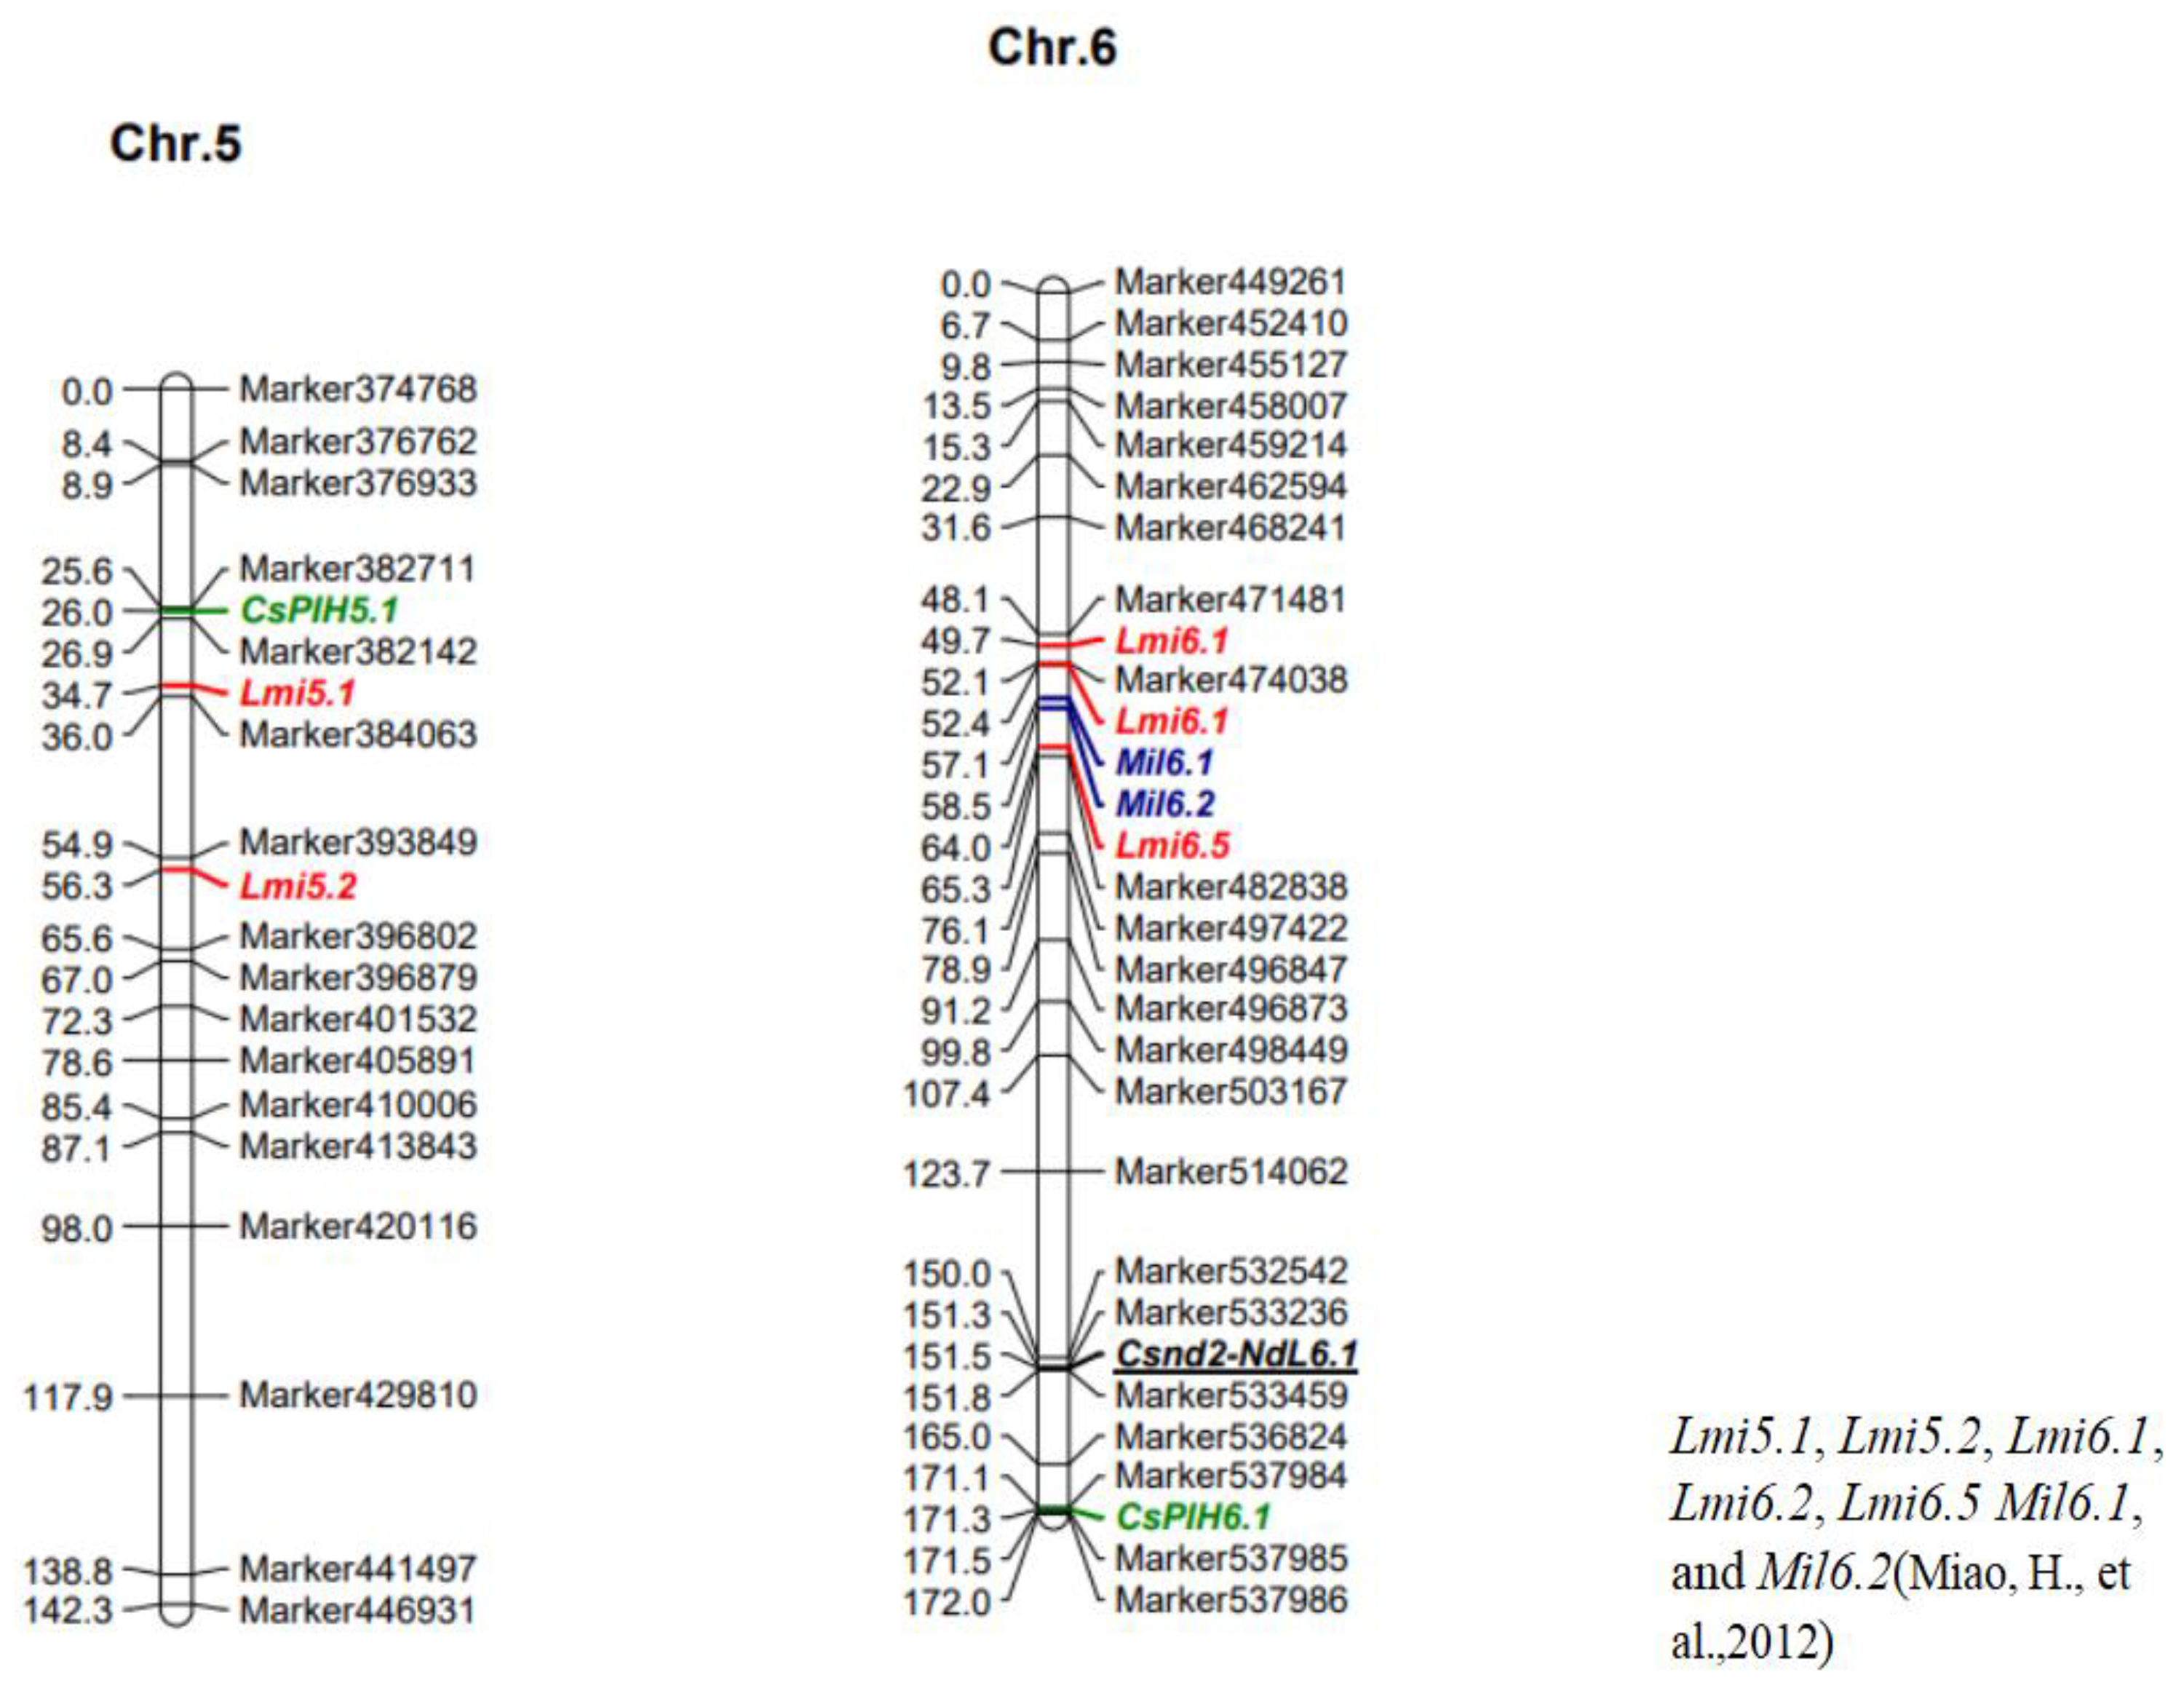
3.6.1. QTL Localization

CsPlH5.1 was located on Chr.5 between Marker382711 and Marker382610, CsPlH6.1 was situated on Chr.6 between Marker537985 and Marker537984, and Csnd2-NdL6.1 was found on Chr.6 between Marker533236 and Marker533459 [18] (Figure 6).

3.6.2. Candidate Genes of Plant Height

A total of 42 potential genes relevant to photosynthesis, chloroplasts, abiotic stress, and growth and development were located on Chr.5 and Chr.6. The candidate gene CsGy5G007180 is related to photosynthesis. In contrast, the CsGy5G007200 gene is annotated as an AHL protein linked to plant aging. The CsGy5G007220 gene is functionally annotated as a vesicular transport V-SNARE 12-like gene associated with plant growth and stress responses. CsGy5G007240 represents transcription termination factor MTERF5, which is related to chlorophyll-related genes; CsGy5G007310 is a UV-B receptor UVRB linked to light. CsGy6G036070 is a pentatricopeptide containing repeat protein At4g21065 associated with chloroplast development (Table 5).

3.6.3. Candidate Genes of the Second Internode Length

Seven candidate genes related to the second internode length were identified, including an unknown protein (CsGy6G032340) and a pentatricopeptide repeat-containing protein (CsGy6G032330). Gene CsGy6G032280 is classified as an E3 ubiquitin protein ligase. Gene CsGy6G032300 is associated with nucleotide binding, catalytic activity, and calcium-ion binding in molecular function, according to its GO annotation. CsGy6G032310 protein is like the At5g47800 protein and has a BTB/POZ domain: CsGy6G032320 phosphoglycerate phosphatase (Table 6).

4. Discussion

In northern China, low light is one of the major obstacles to the conservation of cucumber, adversely impacting both the yield and quality of cucumber; therefore, it is important to improve and cultivate low-light-tolerance varieties by identifying genes associated with low-light tolerance [36]. Constructing high-density genetic maps is crucial for gene localization and QTL analysis, several studies have focused on different horticultural crops; for example, a high-density genetic linkage map for cucumber was created by SLAF-seq, achieving the lowest SNP molecular marker spacing [37]. The QTLs of cucumber adventitious rooting under waterlogging stress were detected using SLAF analysis [38]. In this study, a cucumber genetic map containing seven linkage groups was constructed using the SLAF-seq technique, with a total map distance of 1114.29 c M and an average map distance of 0.50 c M. QTLs associated with cucumber plant height and the second internode length under low-light stress were preliminarily identified, providing the foundation for key-gene mining of cucumber growth. These genes could control healthy cucumber growth under low-light stress and improve growth potential and photosynthetic yield.
Cucumber plant height and internode length are quantitative genetic traits governed by multiple genes, and they are influenced by the cultivation environment; in this study, we demonstrated that cucumber growth was affected by low light. The variation coefficient of plant height exceeded that associated with the second internode length, indicating a more significant variation in plant height under low-light stress. Currently, the identified genetic loci associated with cucumber plant height and internode length are mainly found on separate chromosomes in cucumber [15,16]. For example, three QTLs (Msl1.1, Msl6.1, and Msl6.2) of cucumber plant height were identified on Chr.1 and Chr.6, and six internode length QTLs were located on Chr.1, Chr.2, Chr.5, and Chr.6 [18]. This study identified QTLs of cucumber plant height and the second internode length under low light on Chr.5 and Chr.6, a finding which overlapped with the results of Miao et al. (Figure 6) [18], but didn’t check the QTLs on Chr.1and Chr.2, a phenomenon which may be caused by influences of different planting conditions on growth and gene expression. Our work focused on mapping QTLs of plant height and the second internode length under low-light stress, while the other study investigated plant height and internode length in plastic tunnels in Beijing (116°20′ east longitude, 39°56′ north latitude), and performed QTL analysis with data collected in the spring and autumn, with normal solar radiation conditions of more than 500 μmol·m−2·s−1.
Previous research has identified several genes associated with cucumber plant characteristics, including the dwarfing genes CsDET2 [26] and CsCYP85A [27] and the short internode genes CsVFB1 and CsIVP [33]; however, fewer genes related to cucumber plant height under low-light stress have been reported. In our research, a total of 42 genes were identified within the plant-height QTL interval, including some genes related to photosynthesis, chloroplasts, and growth and development, which might have been due to the chloroplast development of leaves being hindered by low-light stress, and the photosynthetic capacity decreased, which would have indirectly affected plant height and internode elongation. Seven candidate genes associated with the second internode length of cucumber were found, including genes encoding pentatricopeptide repeat proteins, E3 ubiquitin-protein ligases, calcium ion channel-related genes, and ethylene transcription regulatory factors, which are possibly involved in plant growth and development. Studies have found that the E3 ubiquitin ligase family of genes plays a key role in regulating plant growth, development, and responses to both biotic and abiotic stresses [39,40,41]. The calcium (Ca2+)-channel-related genes and ethylene transcription regulatory factors have also been reported to be related to the elongation and growth of plants [42,43]. Calcium (Ca2+) plays an important role in transducing signals for plant growth and development [44,45] and plants’ responses to diverse stimuli [46]; Ca2+ as second messenger has been involved in phytochrome-mediated cellular events. Photochromin and Ca2+-dependence have been linked to the activity of some protein kinases (PKs); some studies have shown that calc-dependent protein kinases (CDPKs) may exist in cucumber cotyledon, which can be regulated by photoallergens in FR-HIR and VLFR reactions [47]. It has been reported that transient elevation of cytosolic Ca2+ concentration is involved in the responses to a variety of stresses in plants, including hormonal stress, light stress and other abiotic stresses [48,49]. Therefore, it is necessary to identify candidate genes by increasing the population size and conduct fine mapping of the plant height and internode length under low-light stress.

5. Conclusions

Under low-light conditions, the plant height and the second internode length of cucumber individuals in the F2 population exhibited a normal or skewed normal distribution, indicating a quantitative trait inheritance and with the plant height showing greater variability. In this study, a high-density genetic map of cucumber was constructed, one which consists of seven chromosomes with 2233 markers, and the total map distance was 1114.29 c M with an average genetic distance of 0.50 c M.
Two plant height QTLs, CsPlH5.1 and CsPlH6.1, and one QTL of the second internode length locus, Csnd2-NdL6.1, were initially detected. CsPlH5.1 is located between Marker382711 (25.61 c M) and Marker382610 (26.05 c M) on Chr.1, with a genetic distance of 0.32 Mb. A total of 42 candidate genes related to plant growth and development, photosynthesis, chloroplast development, and abiotic stress were examined. The Csnd2-NdL6.1 locus is located on Chr.1 between Marker533236 (151.34) and Marker533459 (151.78), with a genetic distance of 0.03 Mb, and containing seven candidate genes, one of which is associated with calcium-ion transport. This result could provide a theoretical basis for further research on genes related to cucumber tolerance to low light, which could benefit cucumber production, allowing the plant to grow well under low-light stress, and thereby improve plant tolerance and production.

Supplementary Materials

The following supporting information can be downloaded at: https://www.mdpi.com/article/10.3390/agronomy14051061/s1, Table S1: Phenotype data of parents and F1 plant under low-light treatment; Table S2: Quantity analysis of sequencing samples; Table S3: Statistic of SNP Markers for the parental lines and offspring.

Author Contributions

Conceptualization, D.L. and Y.H.; Data curation, S.L., K.H. and F.Y.; Formal analysis, Y.Z. (Yanzhao Zhang) and S.S.; Funding acquisition, D.L.; Investigation, S.L. and J.C.; Methodology, K.H.; Project administration, Y.Z. (Yanzhao Zhang); Software, Y.Z. (Yanzhao Zhang) and F.Y.; Supervision, D.L.; Validation, Y.Z. (Yuting Zhang); Visualization, S.L.; Writing—original draft, S.S.; Writing—review and editing, D.L. and Y.Z. (Yuting Zhang). All authors have read and agreed to the published version of the manuscript.

Funding

This research was funded by the National Natural Science Foundation of China (Grant numbers: 32002043), and the National Science Foundation of Heilongjiang Province (Grant numbers: LH2022065).

Data Availability Statement

The data presented in this study are available on request from the corresponding author.

Acknowledgments

The authors would like to thank Heilongjiang Bayi Agricultural University for supporting this study.

Conflicts of Interest

Author D.L. was employed by the Heilongjiang Bayi Agricultural University. The remaining authors declare that the research was conducted in the absence of any commercial or financial relationships that could be construed as a potential conflict of interest.

References

  1. Lin, D.P. Research progress on the origin and classification of cucumber plants. China Cucurbits Veg. 2017, 30, 1–3. [Google Scholar]
  2. FAOSTAT, The Production/Yield quantities of cucumbers and gherkins in world total between 1994 and 2022. Available online: https://www.fao.org/faostat/en/#search/Cucumbers%20and%20gherkins (accessed on 16 December 2023).
  3. Zhang, S.P.; Miao, H.; Bo, K.L.; Dong, S.Y.; Gu, X.F. Research progress on cucumber genetic breeding during “the Thirteenth Five-year Plan” in China. China Veg. 2021, 4, 16–26. [Google Scholar]
  4. Wang, X.F. Monographs on Vegetable Cultivation: Northern Edition; China Agriculture Press: Beijing, China, 2018; Volume 7, p. 10. [Google Scholar]
  5. Ai, X.Z.; Ma, X.Z.; Yu, L.M.; Xing, Y.X. Effect of long-term suboptimal temperature and short-term low temperature under low light density on cucumber growth and its photosynthesis. Chin. J. Appl. Ecol. 2004, 15, 2091–2094. [Google Scholar]
  6. Li, D.D.; Yu, F.S.; Zhang, Y.Z.; Hu, K.H.; Dai, D.Y.; Song, S.W.; Zhang, F.; Sa, R.N.; Lian, H.; Sheng, Y.Y. Integrative analysis of different low-light-tolerant cucumber lines in response to low-light stress. Front. Plant Sci. 2023, 13, 1093859. [Google Scholar] [CrossRef] [PubMed]
  7. Liebig, H.P.; Krug, H. Response of cucumber to climate. Acta Horti. 1991, 287, 47–50. [Google Scholar] [CrossRef]
  8. Zhang, X.F.; Linghu, S.F.; Sheng, Y.Y.; Wen, Y.H.; Xue, S.T.; Li, D.D. Analysis of plant characters and fruit quality in different cucumber combination under low light condition. J. Sichuan Agric. Univ. 2022, 40, 395–401, 420. [Google Scholar]
  9. Gao, W.R.; Sun, Y.J.; Han, B.; Li, D.C.; Fei, C.; Wang, X.S.; Xu, G. Effect of low light on plant growth and fruit development of watermelon. Chin. Agric. Sci. Bull. 2022, 38, 39–45. [Google Scholar]
  10. Wang, X.W.; Wang, Y.J.; Fu, Q.S.; Zhao, B.; Guo, Y.D. Effects of low light stress on morphological trait, physiological characters and leaf ultrastructure of tomato (Lycopersicon esculentum L.) seedlings. Acta Agric. Boreali-Sin. 2009, 24, 144–149. [Google Scholar]
  11. Yang, W.J.; Yu, X.H.; Jiang, X.M.; Gao, H.; Cheng, Y.; Zhang, F.; Li, Y.D.; Sun, D.X. Effects of low light stress on photosynthetic characteristics and root growth of tomato seedlings. Jiangsu Agric. Sci. 2017, 45, 112–114. [Google Scholar]
  12. Gu, X.F.; Zhang, C.Z.; Feng, L.L.; Fang, X.J.; Zhang, T.M. Genetic analysis of cucumber seedling traits in protected land. Acta Hortic. Sin. 2002, 29, 443–446. [Google Scholar]
  13. Cao, Q.W.; Zhang, Y.N.; Wang, Y.Q.; Yang, G.L.; Sun, X.L.; Li, L.B. Mixed genetic model analysis of main gene + polygene for cucumber internode length. J. Agric. Biotechnol. 2018, 26, 205–212. [Google Scholar]
  14. Serquen, F.C.; Bacher, J.; Staub, J.E. Mapping and QTL analysis of horticultural traits in a narrow cross in cucumber (Cucumis sativus L.) using random-amplified polymorphic DNA markers. Mol. Breed. 1997, 3, 257–268. [Google Scholar] [CrossRef]
  15. Xin, M.; Qin, Z.W.; Zhou, X.Y. Genetic analysis of cucumber plant height and its molecular markers. J. Northeast. Agric. Univ. 2008, 39, 34–38. [Google Scholar]
  16. Ji, Y.; Xu, Q.; Miao, M.M.; Liang, G.H.; Gao, H.J.; Luo, J.J.; Chen, X.H. Construction of cucumber genetic map and QTL mapping of plant height-related traits. Acta Hortic. Sin. 2009, 36, 1450–1456. [Google Scholar]
  17. Shi, J.L.; Chen, J.F.; Lou, Q.F.; Qian, C.T.; Meng, J.L. Genetic variation analysis and QTL detection of cucumber introgressive progeny. Acta Hortic. Sin. 2012, 39, 687–694. [Google Scholar]
  18. Miao, H.; Gu, X.F.; Zhang, S.P.; Zhang, Z.H.; Huang, S.W.; Wang, Y. QTL of cucumber plant height in different environments using permanent population. Sci. Agric. Sin. 2012, 45, 4552–4560. [Google Scholar]
  19. Xu, X.W.; Xu, R.X.; Zhu, B.Y.; Yu, T.; Qu, W.Q.; Lu, L.; Xu, Q.; Qi, X.H.; Chen, X.H. A high-density genetic map of cucumber derived from specific length amplified fragment sequencing (SLAF-seq). Front. Plant Sci. 2015, 5, 768. [Google Scholar] [CrossRef]
  20. Zhang, X.F.; Wang, G.Y.; Dong, T.T.; Chen, B.; Du, H.S.; Li, C.B.; Zhang, F.L.; Zhang, H.Y.; Xu, Y.; Wang, Q.; et al. High-density genetic map construction and QTL mapping of first flower node in pepper (Capsicum annuum L.). BMC Plant Biol. 2019, 19, 167. [Google Scholar] [CrossRef]
  21. Wang, L.; Cai, Y.; Wang, G.C.; Wang, D.; Sheng, Y.Y. Construction of SLAF map and QTL analysis of fruit-related traits in melon. Sci. Agric. Sin. 2021, 54, 4196–4206. [Google Scholar]
  22. Dai, D.Y.; Fan, L.; Zeng, S.; Wang, L.; Sheng, Y.Y.; Li, Z.Z.; Zhang, F. Construction of SLAF genetic linkage map and main QTL mapping of fruit stalk length in melon. J. Agric. Biotechnol. 2021, 29, 656–662. [Google Scholar]
  23. Zhang, C.H.; Chen, D.M.; Yang, F.Q.; Zhao, T.S.; Li, Y.; Zhao, G.D.; Zhao, Y.B. Construction of SLAF map and QTL analysis of fruit rust gene in apple. Acta Agric. Boreali-Sin. 2019, 34, 37–44. [Google Scholar]
  24. Wei, Q.Z.; Wang, W.H.; Hu, T.H.; Hu, H.J.; Wang, J.L.; Bao, C.L. Construction of a SNP-Based genetic map using SLAF-Seq and QTL analysis of morphological traits in eggplant. Front. Genet. 2020, 11, 178. [Google Scholar] [CrossRef]
  25. Dong, H.; Yang, L.; Li, L.; Zhang, J.J.; Fang, Q.F.; Song, S.J.; Yang, L.; Li, H.S. Construction of high-density genetic map of cultivated strawberry based on SLAF-seq technology. Acta Agric. Boreali-Sin. 2020, 35, 52–57. [Google Scholar]
  26. Hou, S.S.; Niu, H.H.; Tao, Q.Y.; Wang, S.H.; Gong, Z.H.; Li, S.; Weng, Y.Q.; Li, Z. A mutant in the CsDET2 gene leads to a systemic brassinosteriod deficiency and super compact phenotype in cucumber (Cucumis sativus L.). Theor. Appl. Genet. 2017, 130, 1693–1703. [Google Scholar] [CrossRef]
  27. Wang, H.; Li, W.Q.; Qin, Y.G.; Pan, Y.P.; Wang, X.F.; Weng, Y.Q.; Chen, P.; Li, Y.H. The cytochrome P450 gene CsCYP85A1 is a putative candidate for super compact-1 (Scp-1) Plant Architecture Mutation in Cucumber (Cucumis sativus L.). Front. Plant Sci. 2017, 8, 266. [Google Scholar] [CrossRef]
  28. Yang, L.M.; Liu, H.Q.; Zhao, J.Y.; Pan, Y.P.; Cheng, S.Y.; Lietzow, C.D.; Wen, C.L.; Zhang, X.L.; Weng, Y.Q. LITTLELEAF (LL) encodes a WD40 repeat domain-containing protein associated with organ size variation in cucumber. Plant J. 2018, 95, 834–847. [Google Scholar] [CrossRef]
  29. Gao, D.L.; Zhang, C.Z.; Zhang, S.; Hu, B.W.; Wang, S.H.; Zhang, Z.H.; Huang, S.W. Mutation in a novel gene SMALL AND CORDATE LEAF 1 affects leaf morphology in cucumber. J. Integr. Plant Biol. 2017, 59, 736–741. [Google Scholar] [CrossRef]
  30. Li, Y.H.; Yang, L.M.; Pathak, M.; Li, D.W.; He, X.M.; Weng, Y.Q. Fine genetic mapping of cp: A recessive gene for compact (dwarf) plant architecture in cucumber, Cucumis sativus L. Theor. Appl. Genet. 2011, 123, 973–983. [Google Scholar] [CrossRef]
  31. Xu, L.L.; Wang, C.; Cao, W.; Zhou, S.M.; Wu, T. CLAVATA1-type receptor-like kinase CsCLAVATA1 is a putative candidate gene for dwarf mutation in cucumber. Mol. Genet. Genom. 2018, 293, 1393–1405. [Google Scholar] [CrossRef]
  32. Chen, F.F.; Fu, B.B.; Pan, Y.P.; Zhang, C.W.; Wen, H.F.; Weng, Y.Q.; Chen, P.; Li, Y.H. Fine mapping identifies CsGCN5 encoding a histone acetyltransferase as putative candidate gene for tendril-less1 mutation (td-1) in cucumber. Theor. Appl. Genet. 2017, 130, 1549–1558. [Google Scholar] [CrossRef]
  33. Yan, S.S.; Ning, K.; Wang, Z.Y.; Liu, X.F.; Zhong, Y.T.; Ding, L.; Zi, H.L.; Cheng, Z.H.; Li, X.X.; Shan, H.Y.; et al. CsIVP functions in vasculature development and downy mildew re sistance in cucumber. PLoS Biol. 2020, 18, e3000671. [Google Scholar] [CrossRef]
  34. Doyle, J.J.; Doyle, J.L. A rapid DNA isolation procedure for small quantities of fresh leaf tissue. Phytochem. Bull. 1987, 19, 11–15. [Google Scholar]
  35. Li, R.Q.; Li, Y.R.; Kristiansen, K.; Wang, J. SOAP: Short oligonucleotide alignment program. Bioinformatics 2008, 24, 713–714. [Google Scholar] [CrossRef] [PubMed]
  36. Li, D.D.; Cui, H.Q.; Liu, F.; Wang, R.H.; Sheng, Y.Y.; Wu, X. Evaluation and analysis of downy mildew resistance in cucumber under low light stress. J. Plant Prot. 2016, 43, 621–626. [Google Scholar]
  37. Zhu, W.Y.; Huang, L.; Chen, L.; Yang, J.T.; Wu, J.N.; Qu, M.L.; Yao, D.Q.; Guo, C.L.; Lian, H.L.; He, H.L.; et al. A high-density genetic linkage map for cucumber (Cucumis sativus L.): Based on specific length amplified fragment (SLAF) se quencing and QTL analysis of fruit traits in cucumber. Front. Plant Sci. 2016, 7, 437. [Google Scholar] [CrossRef]
  38. Xu, X.W.; Ji, J.; Xu, Q.; Qi, X.H.; Chen, X.H. Inheritance and quantitative trail loci mapping of adventitious root numbers in cucumber seedlings under waterlogging conditions. Mol. Genet. Genomics. 2017, 292, 353–364. [Google Scholar] [CrossRef]
  39. Li, Z.G.; Hu, Q.; Zhou, M.; Vandenbrink, J.; Li, D.Y.; Menchyk, N.; Reighard, S.; Norris, A.; Liu, H.B.; Sun, D.F.; et al. Heterologous expression of OsSIZ1, a rice SUMO E3 ligase, enhances broad abiotic stress tolerance in transgenic creeping bentgrass. Plant Biotechnol. J. 2013, 11, 432–445. [Google Scholar] [CrossRef]
  40. Li, Q.; Serio, R.J.; Schofield, A.; Liu, H.; Rasmussen, S.R.; Hofius, D.; Stone, S.L. Arabidopsis RING-type E3 ubiquitin ligase XBAT35.2 promotes proteasome-dependent degradation of ACD11 to attenuate abiotic stress tolerance. Plant J. 2020, 104, 1712–1723. [Google Scholar] [CrossRef]
  41. Tan, B.; Lian, X.D.; Cheng, J.; Zeng, W.F.; Zheng, X.B.; Wang, W.; Ye, X.; Li, J.D.; Li, Z.Q.; Zhang, L.L.; et al. Genome-wide identification, and transcriptome profiling reveal that E3 ubiquitin ligase genes relevant to ethylene, auxin and abscisic acid are differentially expressed in the fruits of melting flesh and stony hard peach varieties. BMC Genome 2019, 20, 892. [Google Scholar] [CrossRef]
  42. Ren, H.M.; Zhang, Y.T.; Zhong, M.Y.; Hussian, J.; Tang, Y.T.; Liu, S.K.; Qi, G.N. Calcium signaling-mediated transcriptional re programming during abiotic stress response in plants. Theor. Appl. Genet. 2023, 136, 210. [Google Scholar] [CrossRef]
  43. Luan, S.; Kudla, J.; Rodriguez-Concepcion, M.; Yalovsky, S.; Gruissem, W. Calmodulins and calcineurin B-like proteins: Calcium sensors for specific signal response coupling in plants. Plant Cell 2002, 14, 389–400. [Google Scholar] [CrossRef] [PubMed]
  44. Sun, S.J.; Zhang, X.Y.; Chen, K.; Zhu, X.H.; Zhao, Y. Screening for Arabidopsis mutants with altered Ca2+ signal response using ae quorin-based Ca2+ reporter system. STAR Protoc. 2021, 23, 100558. [Google Scholar] [CrossRef] [PubMed]
  45. Yang, J.; Guo, X.; Mei, Q.; Qiu, L.; Chen, P.; Li, W.H.; Ma, F.W. MdbHLH4 negatively regulates apple cold tolerance by inhibiting MdCBF1/3 expression and promoting MdCAX3L-2 expression. Plant Physiol. 2023, 191, 789–806. [Google Scholar] [CrossRef] [PubMed]
  46. Vidal, D.; Gil, M.T.; Alvarez-Flórez, F.; Moysset, L.; Simón, E. Protein kinase activity in Cucumis sativus cotyledons: Effect of calcium and light. Phytochemistry 2007, 68, 438–445. [Google Scholar] [CrossRef] [PubMed]
  47. Rudd, J.J.; Vernonica, E.; Franklin, T. Unravelling response-specificity in Ca2+ signalling pathways in plant cells. New Phytol. 2010, 151, 7–33. [Google Scholar] [CrossRef]
  48. White, P.J.; Broadley, M.R. Calcium in Plants. Ann. Bot. 2003, 92, 487–511. [Google Scholar] [CrossRef]
  49. Chi, Y.; Wang, C.; Wang, M.Y.; Wan, D.; Huang, F.F.; Jiang, Z.H.; Crawford, B.M.; Vo-Dinh, T.; Yuan, F.; Wu, F.H.; et al. Flg22-induced Ca2+ increases undergo desensitization and resensitization. Plant Cell Environ. 2021, 44, 3563–3575. [Google Scholar] [CrossRef]
Figure 1. Phenotypes of parents and their F1 plant height and internode length under low light. Note: (a), the low-light-tolerant parent M14; (b), the F1 plant; (c), the low-light-tolerant line WI.
Agronomy 14 01061 g001
Figure 2. Frequency distribution of plant height and the second internode length in the F2 population: (a) frequency distribution of the second internode length of the F2 population in 2021; (b) frequency distribution of the second internode length of the F2 population in 2022; (c) frequency distribution of the plant height of the F2 population in 2021; and (d) frequency distribution of the plant height of the F2 population in 2022.
Agronomy 14 01061 g002
Figure 3. The genetic maps of cucumber under low-light stress.
Agronomy 14 01061 g003
Figure 4. (a) Distribution plots of LOD values of CsPlH5.1 associated with cucumber plant height under low-light stress. (b) Distribution plots of LOD values of CsPlH6.1 associated with plant height in cucumber under low-light stress.
Agronomy 14 01061 g004
Figure 5. QTLs for Csnd2-NdL6.1 of the second internode length in cucumber under low light.
Agronomy 14 01061 g005
Figure 6. QTL loci of plant height and internode length in cucumber. Note: Lmi5.1, Lmi5.2, Lmi6.1, Lmi6.2, Lmi6.5, and Csnd2-NdL6.1 are the QTLs of the length of the main stem internodes; Mil6.1, Mil6.2, CsPIH5.1, and CsPIH5.2 are the QTLs of cucumber plant height [18].
Agronomy 14 01061 g006
Table 1. The phenotypic variation analysis of related traits in the F2 population of cucumber under low light.
TraitsRangeMean
(cm)
Standard Deviation (SD)Kurtosis
(SEK)
Skewness (SES)Coefficient of Variation (CV)
Plant height (2021)15.90–62.5037.088 ± 0.7999.145−0.660−0.0360.247
Plant height (2022)4.50–18.011.635 ± 0.1972.442−0.1300.2050.210
Second internode length (2021)0.40–2.501.173 ± 0.0400.462−0.0900.3470.394
Second internode length (2022)0.50–4.301.783 ± 0.0560.6871.1170.7010.385
Note: CV = SD/Mean.
Table 2. Comparison of sequencing data and SNPs.
ItemsMapped Reads (%)Properly Mapped Reads (%)Number of SNPsNumber of Heterozygosity SNPsNumber of Homozygosity SNPsHeter Ratio (%)
WI98.3382.98528,62989,444439,18516.92
M1492.5375.53642,03641,026601,0106.39
F290.4679.46100,868.5127,093.2873,775.2326.86
Note: SNPs, Single nucleotide polymorphism; WI, the low-light-tolerance line; F1, the hybrid of parents WI and M14; M14, the low-light-intolerance line.
Table 3. Basic characteristics of Malus linkage groups in the cross between Miyazaki Spur and Sakata Tsugaru.
Linkage Group Number of MarkersTotal Distance/c MAverage Distance/c MMax Gap/c MGaps ≤ 5 c M
Chr.1427154.520.364.11100%
Chr.2248179.850.737.9499.19%
Chr.3376147.350.394.88100%
Chr.4261170.450.665.6099.23%
Chr.5390142.340.366.5199.74%
Chr.6280171.990.624.96100%
Chr.7250147.790.597.5299.60%
Total22331114.290.507.9499.68%
Note: Max Gap, Maximal gap; Chr., Chromosome.
Table 4. QTLs and effect analysis of plant height and the second node traits in cucumber under low light.
QTL PositionLOD ValueChr.Start (c M)Genome PositionEnd (c M)Genome PositionMax LODADDDOMPVE (%)Candidate Gene Numbers
CsPlH5.135Marker
382711
4,812,907Marker
382610
5,159,0424.0131.0050.5639.44641
(25.61) (26.05)
CsPlH6.136Marker
537985
31,658,938Marker
537984
31,658,9585.3180.997−0.0376.8871
(171.10) (171.55)
Csnd2_NdL6.15.1486Marker
533236
29,572,188Marker
533459
29,604,2155.6890.384−0.1914.187
(151.34) (151.78)
Note: QTL, Quantitative trait loci; LOD, Limit of detection; Chr., Chromosome; Max LOD, Maximum limit of detection; ADD, Additive effect; DOM, Dominance effect; PVE, Contribution rate.
Table 5. Functional annotation of gene mapping segments associated with plant height.
No.Gene IDFunction Annotation
1CsGy5G007180ribulose bisphosphate carboxylase/oxygenase activase 2, chloroplastic-like
2CsGy5G007200AT-hook motif nuclear-localized protein
3CsGy5G007220vesicle transport v-SNARE 12-like
4CsGy5G007240transcription termination factor MTERF5, chloroplastic-like
5CsGy5G007310ultraviolet-B receptor UVR8 isoform X2
6CsGy5G007340protein DA1-related 2
7CsGy5G007360subtilase 4.13
8CsGy6G036070pentatricopeptide repeat-containing protein At4g21065
Note: genes were Blast-searched in Cucumber (Gy14) genome V2.0 (http://cucurbitgenomics.org/ JBrowse, accessed on 19 February 2024).
Table 6. Functional annotation of gene mapping segments of the second internode length.
No.Gene IDFunction Annotation
1CsGy6G032280E3 ubiquitin-protein ligase RGLG2-like
2CsGy6G032290uncharacterized protein At4g26485
3CsGy6G032300Calcineurin B-like protein 3
4CsGy6G032310BTB/POZ domain-containing protein At5g47800-like
5CsGy6G032320Phosphoglycerate phosphatase
6CsGy6G032330pentatricopeptide repeat-containing protein At2g04860
7CsGy6G032340Unknown Protein
Note: genes were Blast-searched in Cucumber (Gy14) genome V2.0 (http://cucurbitgenomics.org/JBrowse accessed on 19 February 2024).
Disclaimer/Publisher’s Note: The statements, opinions and data contained in all publications are solely those of the individual author(s) and contributor(s) and not of MDPI and/or the editor(s). MDPI and/or the editor(s) disclaim responsibility for any injury to people or property resulting from any ideas, methods, instructions or products referred to in the content.

