Article

Improving Wheat Leaf Nitrogen Concentration (LNC) Estimation across Multiple Growth Stages Using Feature Combination Indices (FCIs) from UAV Multispectral Imagery

1
College of Resource and Environment, Anhui Science and Technology University, Fengyang 233100, China
2
Anhui Engineering Research Center of Smart Crop Planting and Processing Technology, Fengyang 233100, China
3
College of Life Sciences, Langfang Normal University, Langfang 065000, China
4
Anhui Province Agricultural Waste Fertilizer Utilization and Cultivated Land Quality Improvement Engineering Research Center, Anhui Science and Technology University, Fengyang 233100, China
*
Author to whom correspondence should be addressed.
Agronomy 2024, 14(5), 1052; https://doi.org/10.3390/agronomy14051052
Submission received: 28 March 2024 / Revised: 2 May 2024 / Accepted: 13 May 2024 / Published: 15 May 2024

Abstract

:
Leaf nitrogen concentration (LNC) is a primary indicator of crop nitrogen status, closely related to the growth and development dynamics of crops. Accurate and efficient monitoring of LNC is significant for precision field crop management and enhancing crop productivity. However, the biochemical properties and canopy structure of wheat change across different growth stages, leading to variations in spectral responses that significantly impact the estimation of wheat LNC. This study aims to investigate the construction of feature combination indices (FCIs) sensitive to LNC across multiple wheat growth stages, using remote sensing data to develop an LNC estimation model that is suitable for multiple growth stages. The research employs UAV multispectral remote sensing technology to acquire canopy imagery of wheat during the early (Jointing stage and Booting stage) and late (Early filling and Late filling stages) in 2021 and 2022, extracting spectral band reflectance and texture metrics. Initially, twelve sensitive spectral feature combination indices (SFCIs) were constructed using spectral band information. Subsequently, sensitive texture feature combination indices (TFCIs) were created using texture metrics as an alternative to spectral bands. Machine learning algorithms, including partial least squares regression (PLSR), random forest regression (RFR), support vector regression (SVR), and Gaussian process regression (GPR), were used to integrate spectral and texture information, enhancing the estimation performance of wheat LNC across growth stages. Results show that the combination of Red, Red edge, and Near-infrared bands, along with texture metrics such as Mean, Correlation, Contrast, and Dissimilarity, has significant potential for LNC estimation. The constructed SFCIs and TFCIs both enhanced the responsiveness to LNC across multiple growth stages. Additionally, a sensitive index, the Modified Vegetation Index (MVI), demonstrated significant improvement over NDVI, correcting the over-saturation concerns of NDVI in time-series analysis and displaying outstanding potential for LNC estimation. Spectral information outperforms texture information in estimation capability, and their integration, particularly with SVR, achieves the highest precision (coefficient of determination (R2) = 0.786, root mean square error (RMSE) = 0.589%, and relative prediction deviation (RPD) = 2.162). In conclusion, the sensitive FCIs developed in this study improve LNC estimation performance across multiple growth stages, enabling precise monitoring of wheat LNC. This research provides insights and technical support for the construction of sensitive indices and the precise management of nitrogen nutrition status in field crops.

1. Introduction

Wheat, one of the world’s most important cereal crops, significantly impacts global grain markets. Its production levels directly affect the dynamics of food security, which are crucial for human populations to survive and grow [1,2]. Leaf nitrogen concentration (LNC) is a vital parameter for assessing the nitrogen nutritional status of crops, serving as a critical indicator for nitrogen fertilization management in wheat during the early growth stages [3]. LNC directly affects grain quality development and yield in later growth stages [4,5]. Consequently, the rapid, precise, and dynamic acquisition of LNC information is essential to making informed nitrogen fertilization decisions and enhancing crop production.
Traditional methods for measuring LNC in crops often rely on destructive field sampling and chemical analysis in the laboratory. These procedures are not only time-consuming and labor-intensive but also expensive [6], and they present certain safety risks, making them unsuitable for general use. Remote sensing technology has emerged as an effective tool for monitoring crop growth conditions in precision agriculture due to its accuracy and speed [7], providing critical technical support for the efficient and non-destructive acquisition of LNC information [8]. Nowadays, crop development is monitored using a variety of remote sensing platforms, such as satellites [9], unmanned aerial vehicles (UAVs) [8], and ground-based hyperspectral sensors [10]. Satellite platforms can undertake large-scale LNC monitoring [11,12], but their low revisit frequency and spatial–temporal resolution restrict real-time high-precision monitoring. Although ground-based hyperspectral platforms may collect high-precision remote sensing data [13], their limited sampling points and high costs make them unsuitable for large area applications. UAVs are commonly used for crop LNC monitoring due to their flexibility, convenience, and low cost compared to satellite or ground-based hyperspectral systems [6,14].
A range of sensors, including RGB [15], multispectral [16], hyperspectral [17], and LiDAR [18], can be mounted on UAV platforms to collect data from field remote sensing. While hyperspectral sensors and LiDAR are expensive and unsuitable for practical field-scale applications, RGB sensors cannot capture the Red edge and Near-infrared bands, which are sensitive to vegetation features [19]. With their superior performance and low cost, multispectral sensors may acquire high-spatial–temporal-resolution images across multiple crop growth stages, which makes them more suitable for rapid, non-destructive crop growth monitoring [7].
Vegetation indices (VIs) derived from UAV remote sensing spectral band data are closely related to agronomic parameters and are commonly used for crop growth monitoring [20] and yield estimation [16]. Crop canopy structure and biochemical properties change according to growth stage [13], with particularly significant variations between vegetative and reproductive development stages [21]. The heterogeneity of canopies across growth stages can lead to variations in spectral responses, affecting the accuracy of LNC estimates using VIs. Compared to the early growth stage, increased canopy cover in the later stage might cause spectral saturation effects [22], reducing the sensitivity of VIs to crop biochemical properties. These factors indicate that there are still limitations in using existing VIs for precise monitoring of LNC across multiple growth stages of crops.
High-resolution images acquired by UAV multispectral sensors capture the spectral characteristics of wheat canopies and the texture features that reflect crop structure changes. These texture features can reflect variations in wheat leaf color across various varieties and fertilizer treatments and respond to changes in canopy structure during different growth stages [23]. Texture metrics and crop biochemistry are closely related, but developing trustworthy crop information prediction models based only on texture metrics is difficult due to the absence of a formulaic method to enhance their response to vegetation physiology [24]. Prior studies often used texture metrics in models to complement VIs and improve model performance [25].
Although combining texture metrics with VIs improved the estimation accuracy of crop LNC [14], most studies have relied on pre-existing texture metrics and VIs constructed from specific spectral bands and combination formulas [26], ignoring the potential of feature combination applications. VIs such as Normalized Difference Vegetation Index (NDVI) and Ratio Vegetation Index (RVI), which are constructed using simple formulas, offer advantages like reducing the impact of background noise and effectively mitigating the interference from solar zenith angle, thereby enhancing their responsiveness to vegetation features [27,28]. However, the current fixed pairing of bands and formulas in the VI design limits the application potential of feature combinations in crop growth monitoring [19,29]. This study aims to improve the estimation capability of LNC across growth stages and meet the demands of modern agricultural production by further investigating the feasibility of constructing feature combination indices (FCIs) sensitive to LNC across multiple growth stages using remote sensing data. It will allow for the full exploration of feature combinations and their respective benefits. By leveraging spectral band information, the study developed spectral feature combination indices (SFCIs) sensitive to LNC across various growth stages. In addition, using the same methodology, the study has created texture feature combination indices (TFCIs).
The potential of SFCIs in the field of precision agriculture is gradually being revealed by scholars. Inoue et al. [29] constructed a series of spectral indices based on simple formulas of NDVI and RVI, and found that the spectral index composed of the first-order derivatives at 740 nm and 522 nm (RSI: D740, D522) is the most accurate and stable indicator for monitoring canopy nitrogen content. Yao et al. [19] utilized spectral information combined with simple formulas of NDVI and RVI to create a series of novel spectral indices that achieves precise monitoring of leaf nitrogen accumulation in winter wheat. TFCIs are also being progressively developed for crop growth monitoring. Fan et al. [21] demonstrated that the use of feature combination formulas integrated with texture information can significantly enhance the estimation accuracy of plant nitrogen content in potatoes. Yuan et al. [19,30] constructed four texture indices based on hyperspectral texture information to accurately estimate the leaf area index of rice. However, previous studies have rarely constructed both SFCIs and TFCIs or systematically compared them with traditional variables (VIs and texture metrics) in terms of estimation potential.
Based on the previously mentioned data, this study constructed 12 FCIs to reduce the impact of canopy heterogeneity caused by variations in growth stages. It used spectral bands and texture metrics from high-resolution UAV multispectral imagery at the Jointing, Booting, Early filling, and Late filling stages. The objectives of this study are as follows: (1) to thoroughly consider all possible combinations of the 12 developed FCIs (SFCIs, TFCIs) based on UAV multispectral data (five spectral bands, 40 texture metrics) and to assess the feasibility; (2) to compare the capabilities of the newly developed FCIs with traditional variables (VIs, Tm) in estimating wheat LNC across multiple growth stages; and (3) to evaluate the potential of using FCIs to enhance the accuracy of LNC estimation across multiple growth stages and to investigate the feasibility of integrating multi-characteristic features for wheat LNC estimation.

2. Materials and Methods

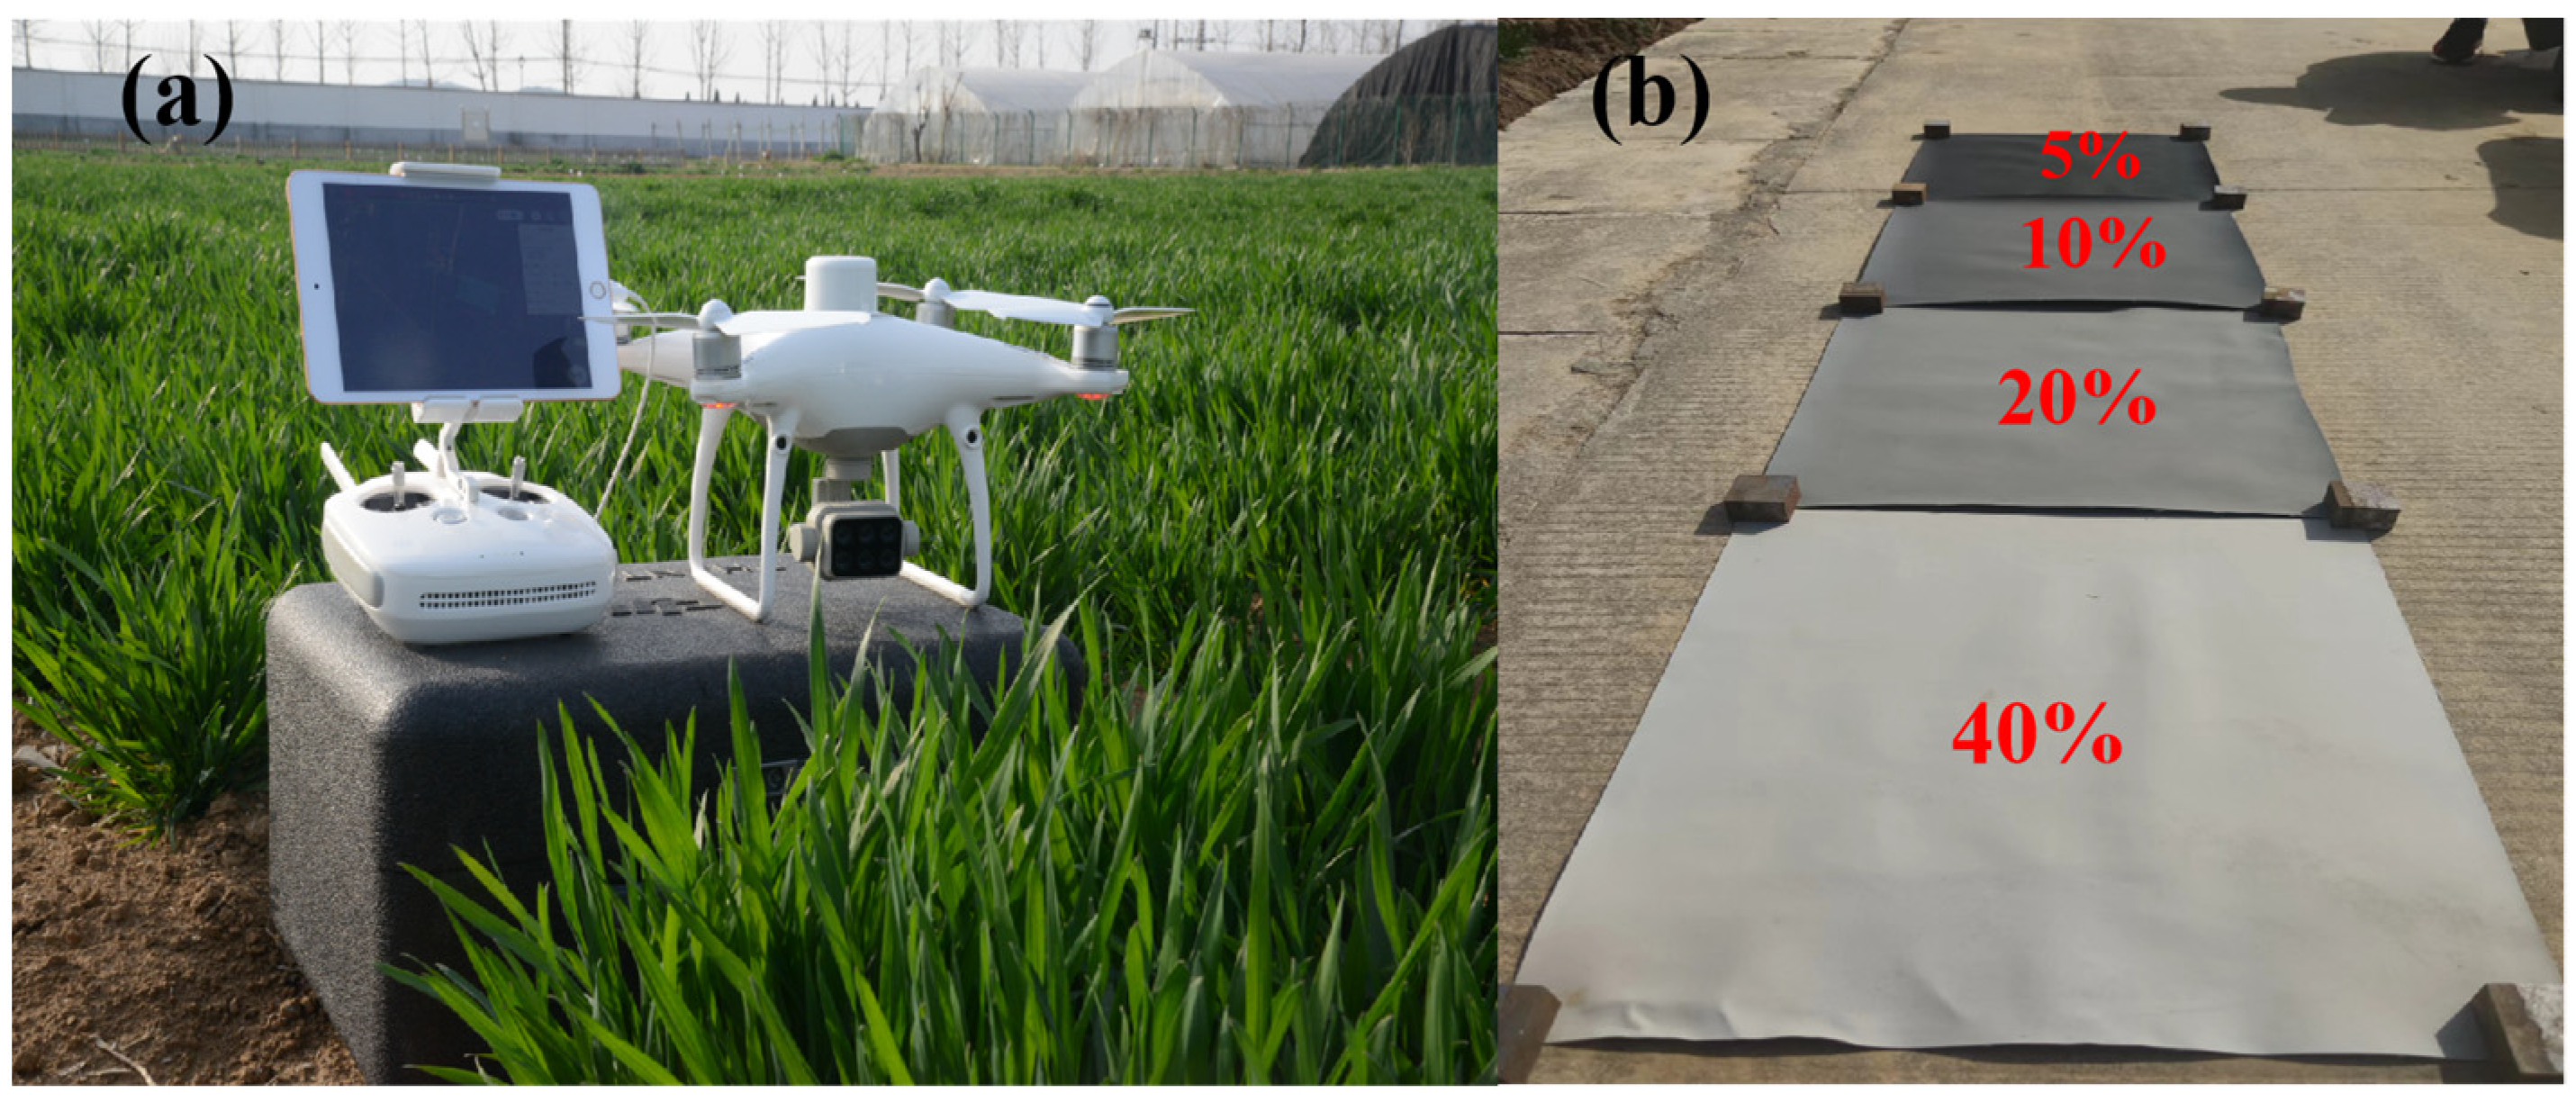
2.1. Experimental Area and Experimental Design

A two-year field trial of winter wheat was conducted in Chuzhou City, Anhui Province (32°48′52″ N, 117°46′7″ E). The experimental site is located in the middle and lower reaches of the Yangtze River, characterized by a humid climate with distinct seasons, typical of a subtropical monsoon climate. The average elevation is 31 m, with an annual average temperature of 15.4 °C, an annual average precipitation of 1000–1100 mm, approximately 144 days of rainfall per year, and a frost-free period of about 240 days throughout the year.
The winter wheat field trial primarily considered two variables: different nitrogen application rates and different varieties, with three replicates for each, as detailed in Table 1. In Exp. 1, there were a total of 36 sampling plots, each with an area of 16 m2 (2 m × 8 m), and the wheat was planted with a row spacing of 0.3 m. Exp. 2 consisted of 36 sampling plots, each with an area of 10 m2 (2 m × 5 m), and the wheat was planted using manual strip sowing with the same row spacing of 0.3 m (Figure 1). Both Exp. 1 and Exp. 2 employed the same sowing techniques and fertilization levels, with phosphorus and potassium fertilizers applied as basal fertilizers before sowing (P = 90 kg/ha, K = 135 kg/ha), followed by topdressing at the jointing stage with a 6:4 ratio of basal to topdressing nitrogen fertilizers, in accordance with local agricultural practices. The field trial was conducted following the local farmers’ field management practices, and no pest or weed infestations occurred during the trial period.

2.2. LNC Measurements

In the field, destructive sampling was conducted on each plot, with random samples of winter wheat representing the average growth within the area taken and placed into sealed bags for immediate transport to the laboratory. The wheat plants were then subjected to stem and leaf separation, and the leaves were dried in an oven at 105 °C for 0.5 h, followed by constant temperature drying at 75 °C for over 48 h until a stable weight was achieved. The dried leaves were ground into a powder form. Then, 2 to 4 mg of the sample was weighed and analyzed using the Euro Vector EA3000 automatic elemental analyzer to determine the nitrogen concentration (%) of the wheat leaf tissue.

2.3. UAV Image Collection and Preprocessing

During the Jointing (J), Booting (B), Early filling (EF), and Late filling (LF) stages of winter wheat, multispectral canopy imagery data were acquired using a Phantom 4 Multispectral RTK (DJI Technology Co., Shenzhen, China) unmanned aerial vehicle (UAV) (Figure 2a). The UAV is equipped with five monochrome high-resolution sensors for multispectral imaging, each with a resolution of 2.08 million effective pixels. It also features individual filters for Blue (450 ± 16 nm), Green (560 ± 16 nm), Red (650 ± 16 nm), Red edge (730 ± 16 nm), and Near-infrared (840 ± 26 nm) bands, with spectral bandwidths of 20 nm, 20 nm, 10 nm, 10 nm, and 40 nm, respectively. The UAV is equipped with an RTK positioning system that offers a vertical accuracy of ±1.5 cm and a horizontal accuracy of ±1 cm, enabling the acquisition of high-precision spectral and texture information from the wheat canopy. Data collection was conducted between 11:00 and 13:00 on clear days with stable solar radiation intensity and no wind or clouds. The UAV flight routes for the two-year winter wheat field trial were autonomously defined using DJI GS PRO software (https://www.dji.com/cn/ground-station-pro/), with the UAV’s autopilot system executing the predefined flight plans. The flight had a forward and side overlap of 90% and 85%, respectively, with a flight speed of 2 m/s and an altitude of 30 m. The images were captured in TIFF format and stored on an SD card.
The multispectral (MS) data were preprocessed using PIX4Dmapper software (version 4.4.12, Pix4D SA, Prilly, Switzerland) to obtain high-resolution wheat MS imagery. This process included image calibration, generation of high-density point clouds, mesh creation, and texture generation. Four radiance calibration panels with reflectance values of 5%, 10%, 20%, and 40% (each 0.5 m × 0.5 m in size) were placed within the UAV data collection area (Figure 2b). The empirical line method (ELM) was employed to radiometrically calibrate the five bands of the MS imagery [31], converting digital numbers into reflectance values.

2.4. Vegetation Index Calculation

Vegetation indices (VIs) are obtained by calculations or combinations of characteristic bands, providing robust vegetation information factors and enhancing, to a certain extent, the expressive ability of remote sensing data [19]. Building upon previous research, this study initially selected ten commonly used VIs that are associated with estimating chlorophyll and nitrogen content to analyze their correlation with wheat LNC across multiple growth stages and to establish estimation models (Table 2).

2.5. Texture Metrics Extraction

Texture is a visual feature that reflects the spatial arrangement of an image independent of its brightness, capturing information about changes in crop canopy structure by calculating the gray-level spatial correlation properties between two pixels [41]. This study employs the widely used Gray Level Co-occurrence Matrix (GLCM) method to extract texture information from winter wheat. GLCM requires user-defined parameters such as window size and orientation. To enhance the generalizability of the subsequent indices and to facilitate comparative analysis with traditional methods, the study adopts the most commonly used parameters for extracting texture metrics (Tm), specifically a window size of 3 pixels × 3 pixels, an extraction direction of 45°, and grayscale quantization levels set to 64 as default parameters. Detailed information is provided in Table 3.

2.6. Feature Combination Index Construction

To fully explore and exploit the potential of feature combination applications, this study has selected 12 different constructed formulas based on previous research to attempt the construction of FCIs that remain sensitive to LNC across multiple growth stages. These include 6 dual-index formulas and 6 triple-index formulas, with the detailed information of these formulas provided in Table 4.
In the SFCIs constructed based on spectral band information, λ1, λ2, and λ3 represent the reflectance of the respective spectral bands. In the TFCIs constructed based on texture information, λ1, λ2, and λ3 represent the texture metrics (Tm) extracted using the GLCM method. For subsequent comparative analysis, this study categorizes spectral information into two groups: VIs (Table 2) and SFCIs (Table 4), and texture information into two groups: Tm (Table 3) and TFCIs (Table 4).

2.7. Model Construction and Accuracy Assessment

To develop a model for estimating LNC across multiple growth stages of wheat, this study tested four representative machine learning algorithms: partial least squares regression (PLSR), random forest regression (RFR), support vector regression (SVR), and Gaussian process regression (GPR). PLSR is a linear regression model that combines the strengths of principal component analysis, canonical correlation analysis, and linear regression analysis. It projects the predictive variables and observed variables into a new space, aiming to find the multidimensional direction that explains the maximum variance in the predictive variable space, extracting the maximum information reflecting data variability. PLSR is adept at addressing multicollinearity among independent variables and reducing the impact of random noise [48]. RFR is a non-parametric regression method based on the decision tree approach. RFR constructs multiple decision trees on different subsets of the data, training models on each subset. By aggregating the predictions from all the individual trees, RFR enhances the model’s accuracy and reduces the prediction error [49]. RFR exhibits stable performance even in the presence of noise, effectively managing issues of information redundancy and overfitting. SVR is a non-linear regression model that operates on the principle of structural risk minimization. It seeks to find the hyperplane that maximizes the margin for feature variables by minimizing the cost function, resulting in a model with strong robustness and generalizability [50]. GPR is a Bayesian non-parametric method that performs regression by using a Gaussian process prior on the data. It also provides posterior predictions, offering good generalizability and interpretability, making it suitable for handling small datasets and non-linear problems [51]. The four machine learning methods mentioned above were implemented using R language version 4.3.1 (R Foundation, Vienna, Austria). In the study, the hyperparameters for each algorithm were specified as follows. For PLSR, the number of components (ncomp) was set to a range of 1–5. In RFR, the number of predictors randomly selected (mtry) was set to 3, and the number of trees (ntrees) was set to 1000. For SVR with a Gaussian kernel, the standard deviation (sigma) of the kernel function ranged from 0.01 with an increment of 0.01 up to 0.2. The regularization parameter (C) ranged from 0.01 with an increment of 0.1 up to 2. GPR utilized a linear kernel for the regression task. To ensure the reproducibility of the results, a random seed was set for the execution of the algorithms. Additionally, all the aforementioned algorithms opted for data preprocessing through centering and scaling.
This study randomly divided the wheat LNC dataset from four critical growth stages over two years (n = 288) into calibration and validation datasets. One-third of the data were used to construct the LNC estimation model (Calibration, n = 96), and two-thirds were used for model evaluation (Validation, n = 192). The study employed three statistical metrics to evaluate the model performance, including coefficient of determination (R2), Root Mean Square Error (RMSE), and the Relative Prediction Deviation (RPD). R2 represents the proportion of variance in the dependent variable that is explained by the model. It serves as a general indicator of model performance. The closer the R2 value is to 1, the better the correlation between predicted and actual values. The RMSE translates the squared prediction errors into units that are consistent with the actual values, effectively reflecting the discrepancies between predictions and reality. The RPD also evaluates the stability of the model by reflecting the differences between predicted and actual values. A higher RPD indicates smaller discrepancies between predictions and actual values, suggesting better model stability. Additionally, the flowchart from data acquisition to model construction and evaluation is shown in Figure 3.
R 2 = 1 i = 1 n y i y i ^ 2 i = 1 n y i y ¯ 2
R M S E = i = 1 n y i y i ^ 2 n
R P D = S D R M S E
In the formulas, y i and y i ^ represent the observed and predicted values of LNC, respectively, y ¯ is the mean of the observed LNC values, n is the sample size, and SD is the standard deviation of the reference values.

3. Results

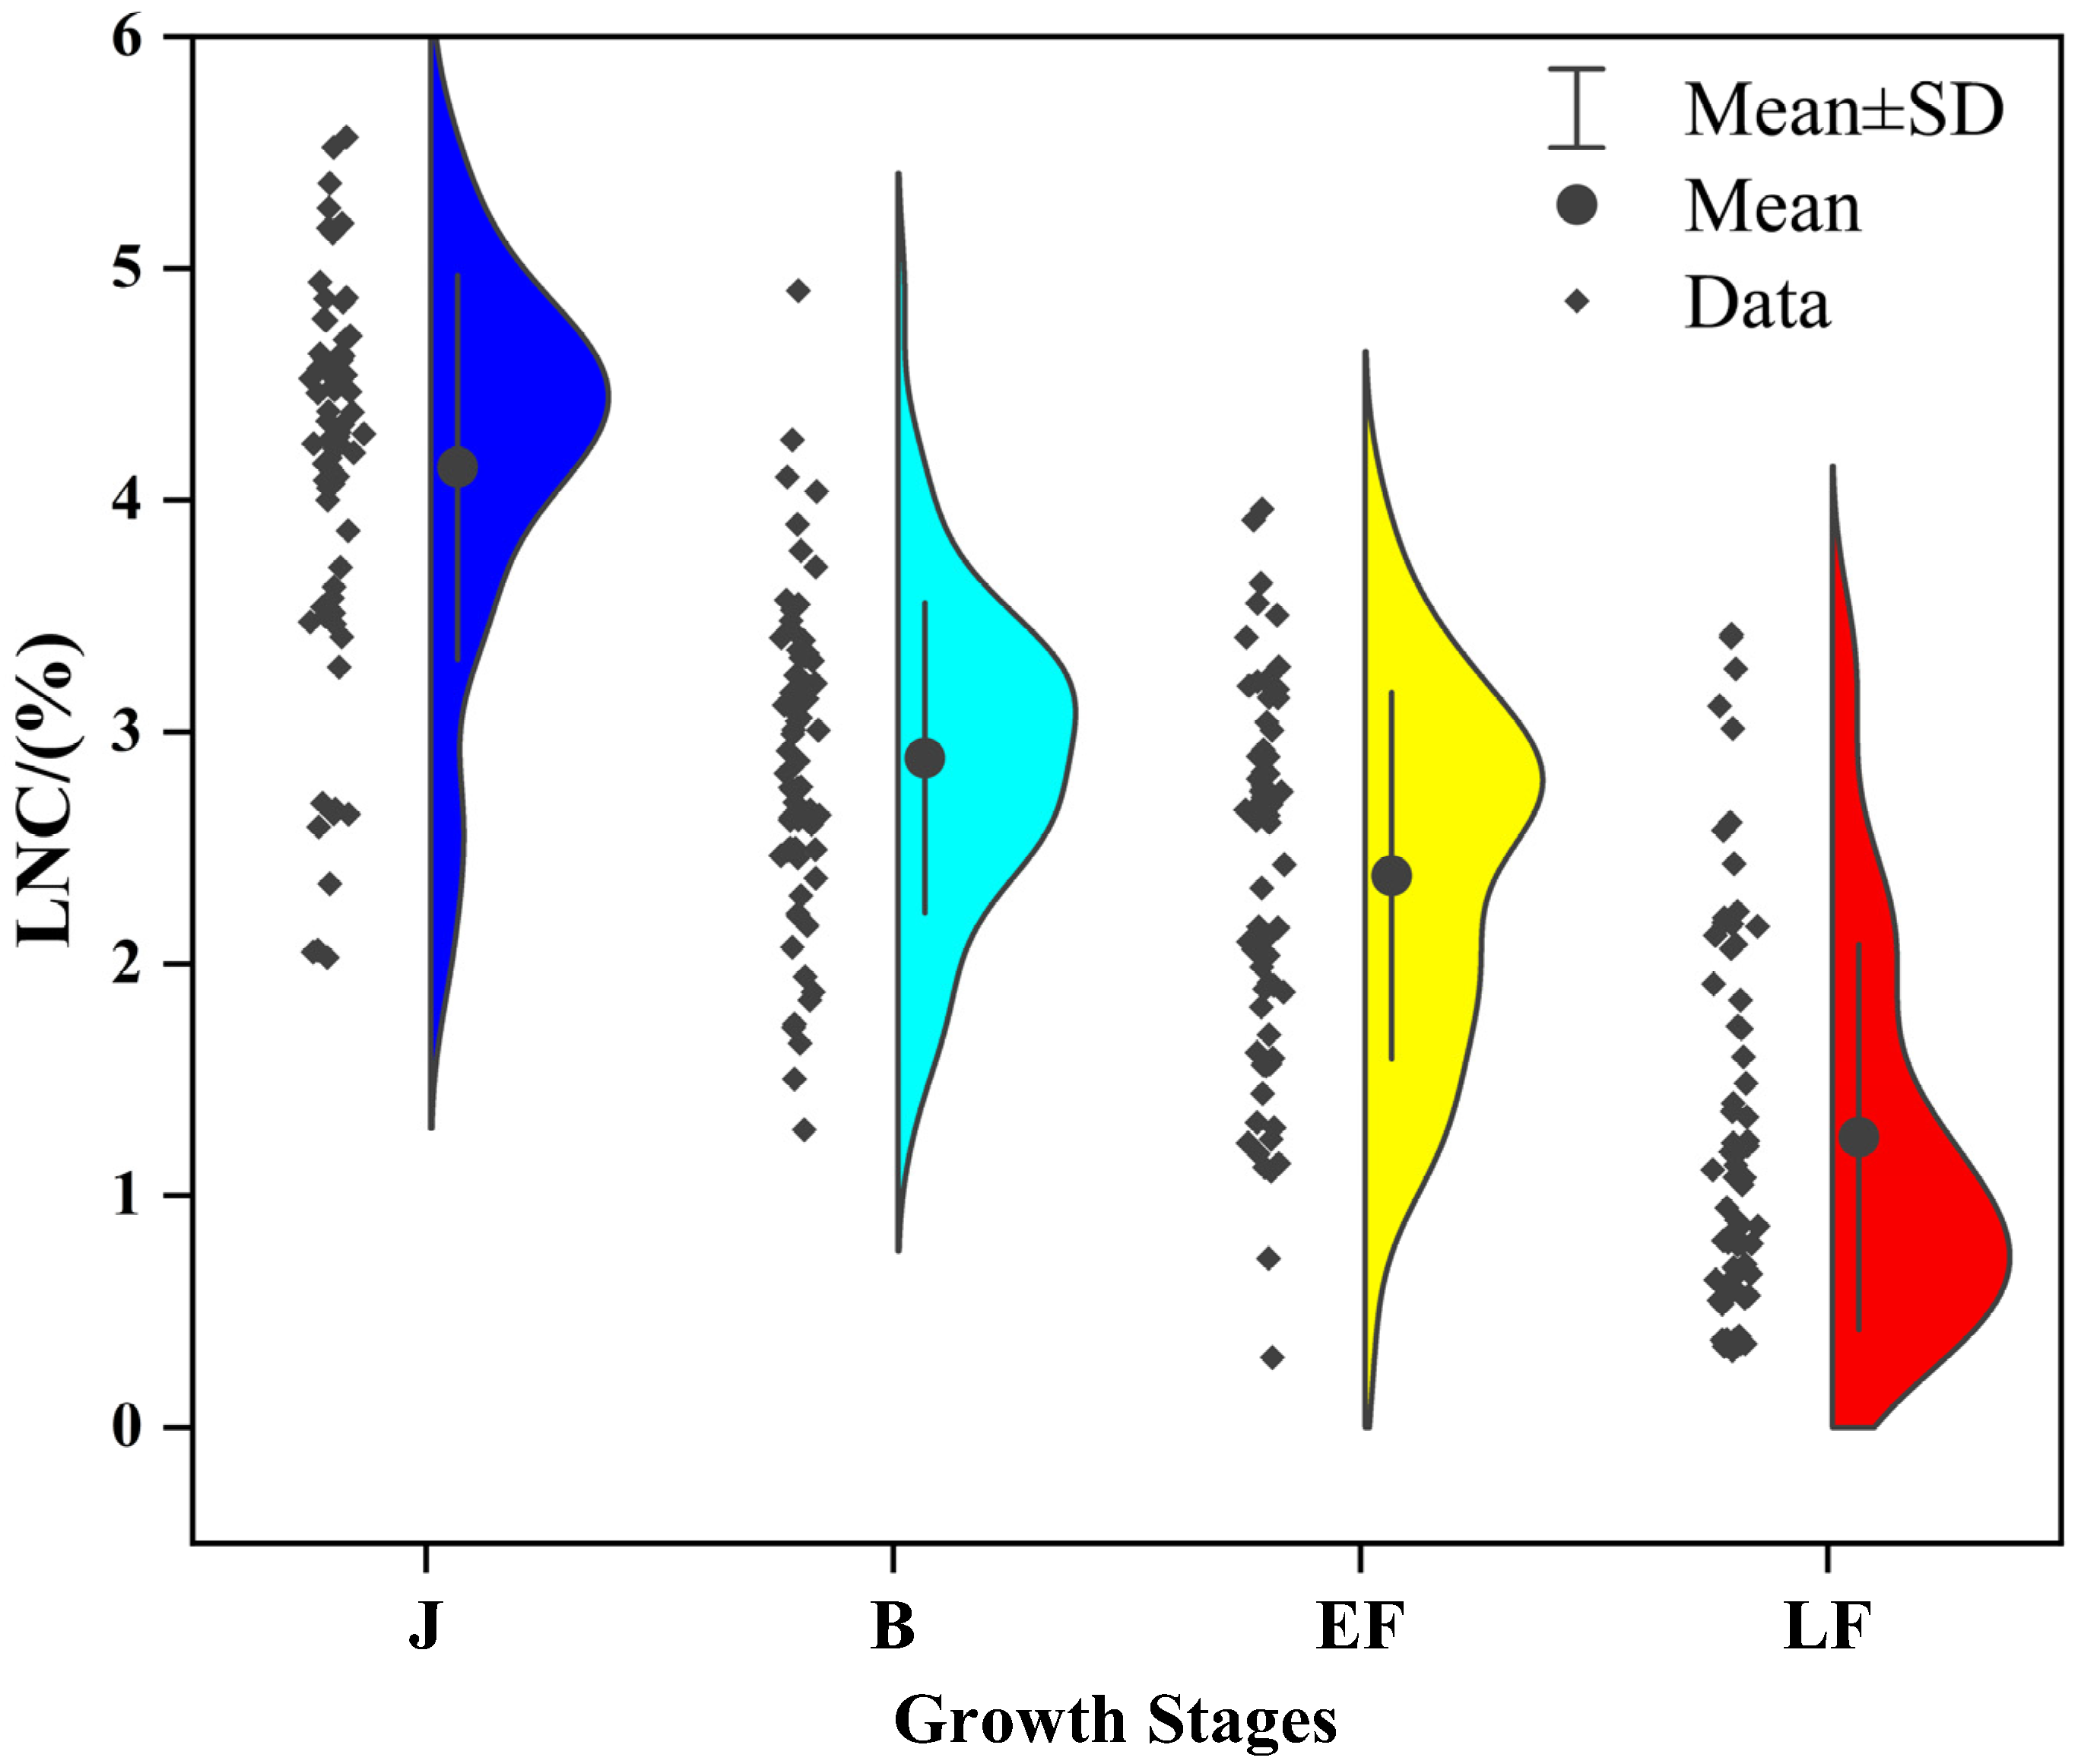
3.1. Variations in Winter Wheat LNC

Figure 4 illustrates the distribution and variation of LNC across four critical growth stages of winter wheat. From Jointing to Late filling, the mean values of each sample gradually decrease, specifically Mean J-LF: 4.141, 2.888, 2.380, and 1.253, while the standard deviation remains relatively stable, with a range of 0.668 to 0.831. The point density distribution across the four key growth stages is not uniform, indicating significant differences in LNC at each stage, and a decreasing trend in LNC values.

3.2. The Response of Spectral Information to Multiple Growth Stages LNC

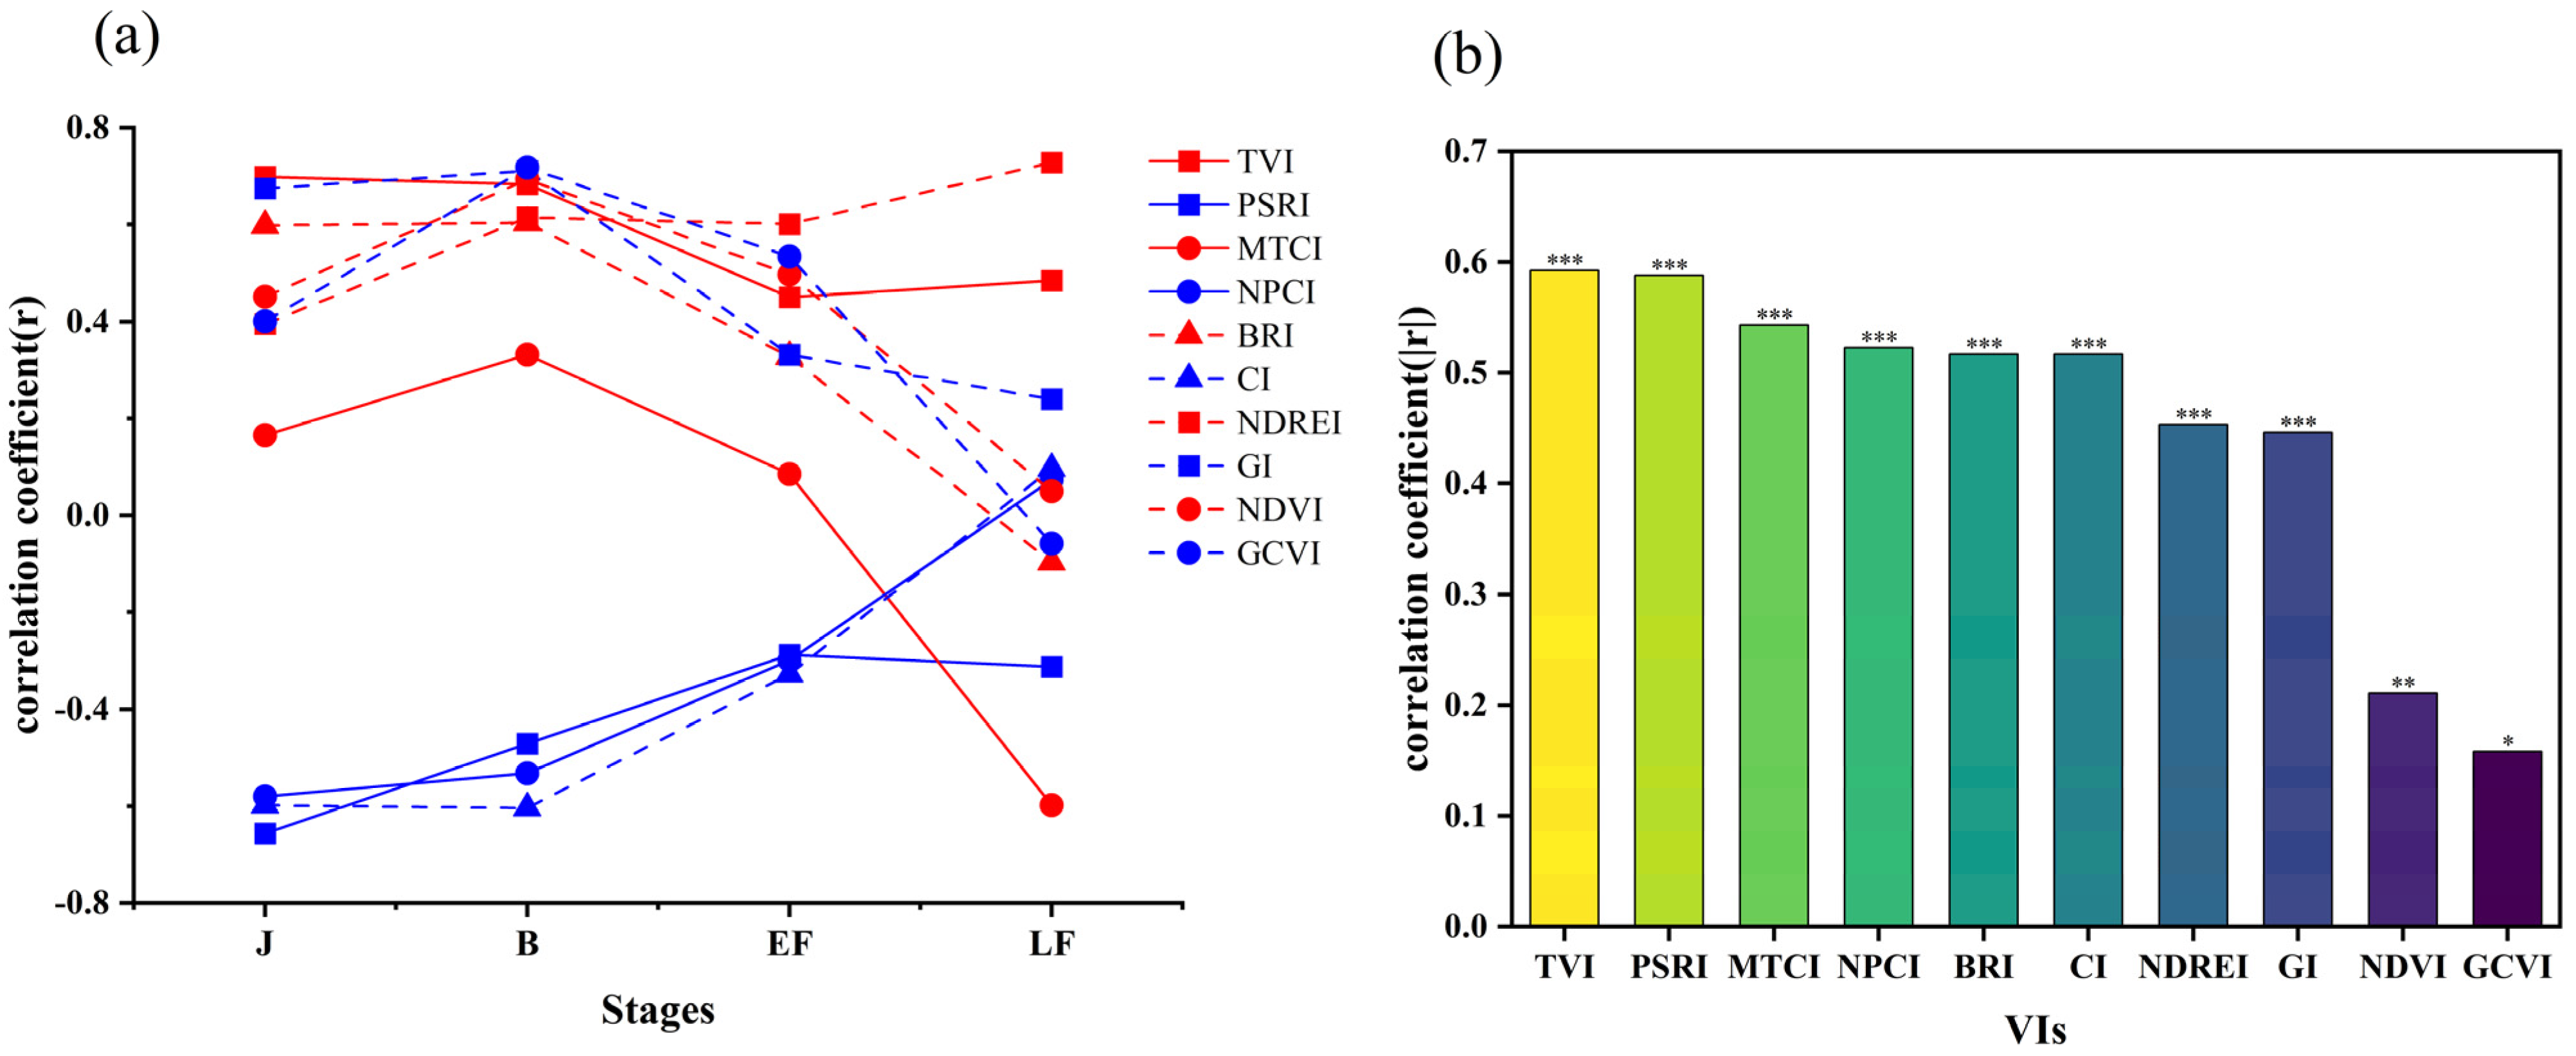
3.2.1. Correlation between LNC and VIs at Multiple Growth Stages

The correlation analysis results between commonly used VIs and LNC are shown in Figure 5. The correlation coefficients between VIs and LNC vary significantly across different growth stages, with most VIs reaching their peak correlation at the Booting stage and then gradually decreasing during the Early filling and Late filling stages (Figure 5a). As indicated in Figure 5b, the VIs used in this study all show moderate correlations with LNC across multiple growth stages of winter wheat (p < 0.05). Among them, TVI has the strongest correlation (|r| = 0.593, p < 0.001), while GCVI has the weakest (|r| = 0.158, p < 0.05). Integrating the correlations across different growth stages (Figure 5a), the overall correlation of VIs with LNC smooths out the high and low values of correlation coefficients at each stage, reflecting the overall relationship between VIs and LNC across growth stages. Additionally, since this study constructed six SFCID and six SFCIT, to facilitate subsequent comparative analysis of the performance of commonly used VIs in LNC estimation across multiple growth stages, the top six VIs with the strongest correlations were selected for LNC modeling (Figure 5b); these are TVI, PSRI, MTCI, NPCI, BRI, and CI, with correlation coefficients (|r|) of 0.593, 0.588, 0.543, 0.523, 0.517, and 0.517, respectively.

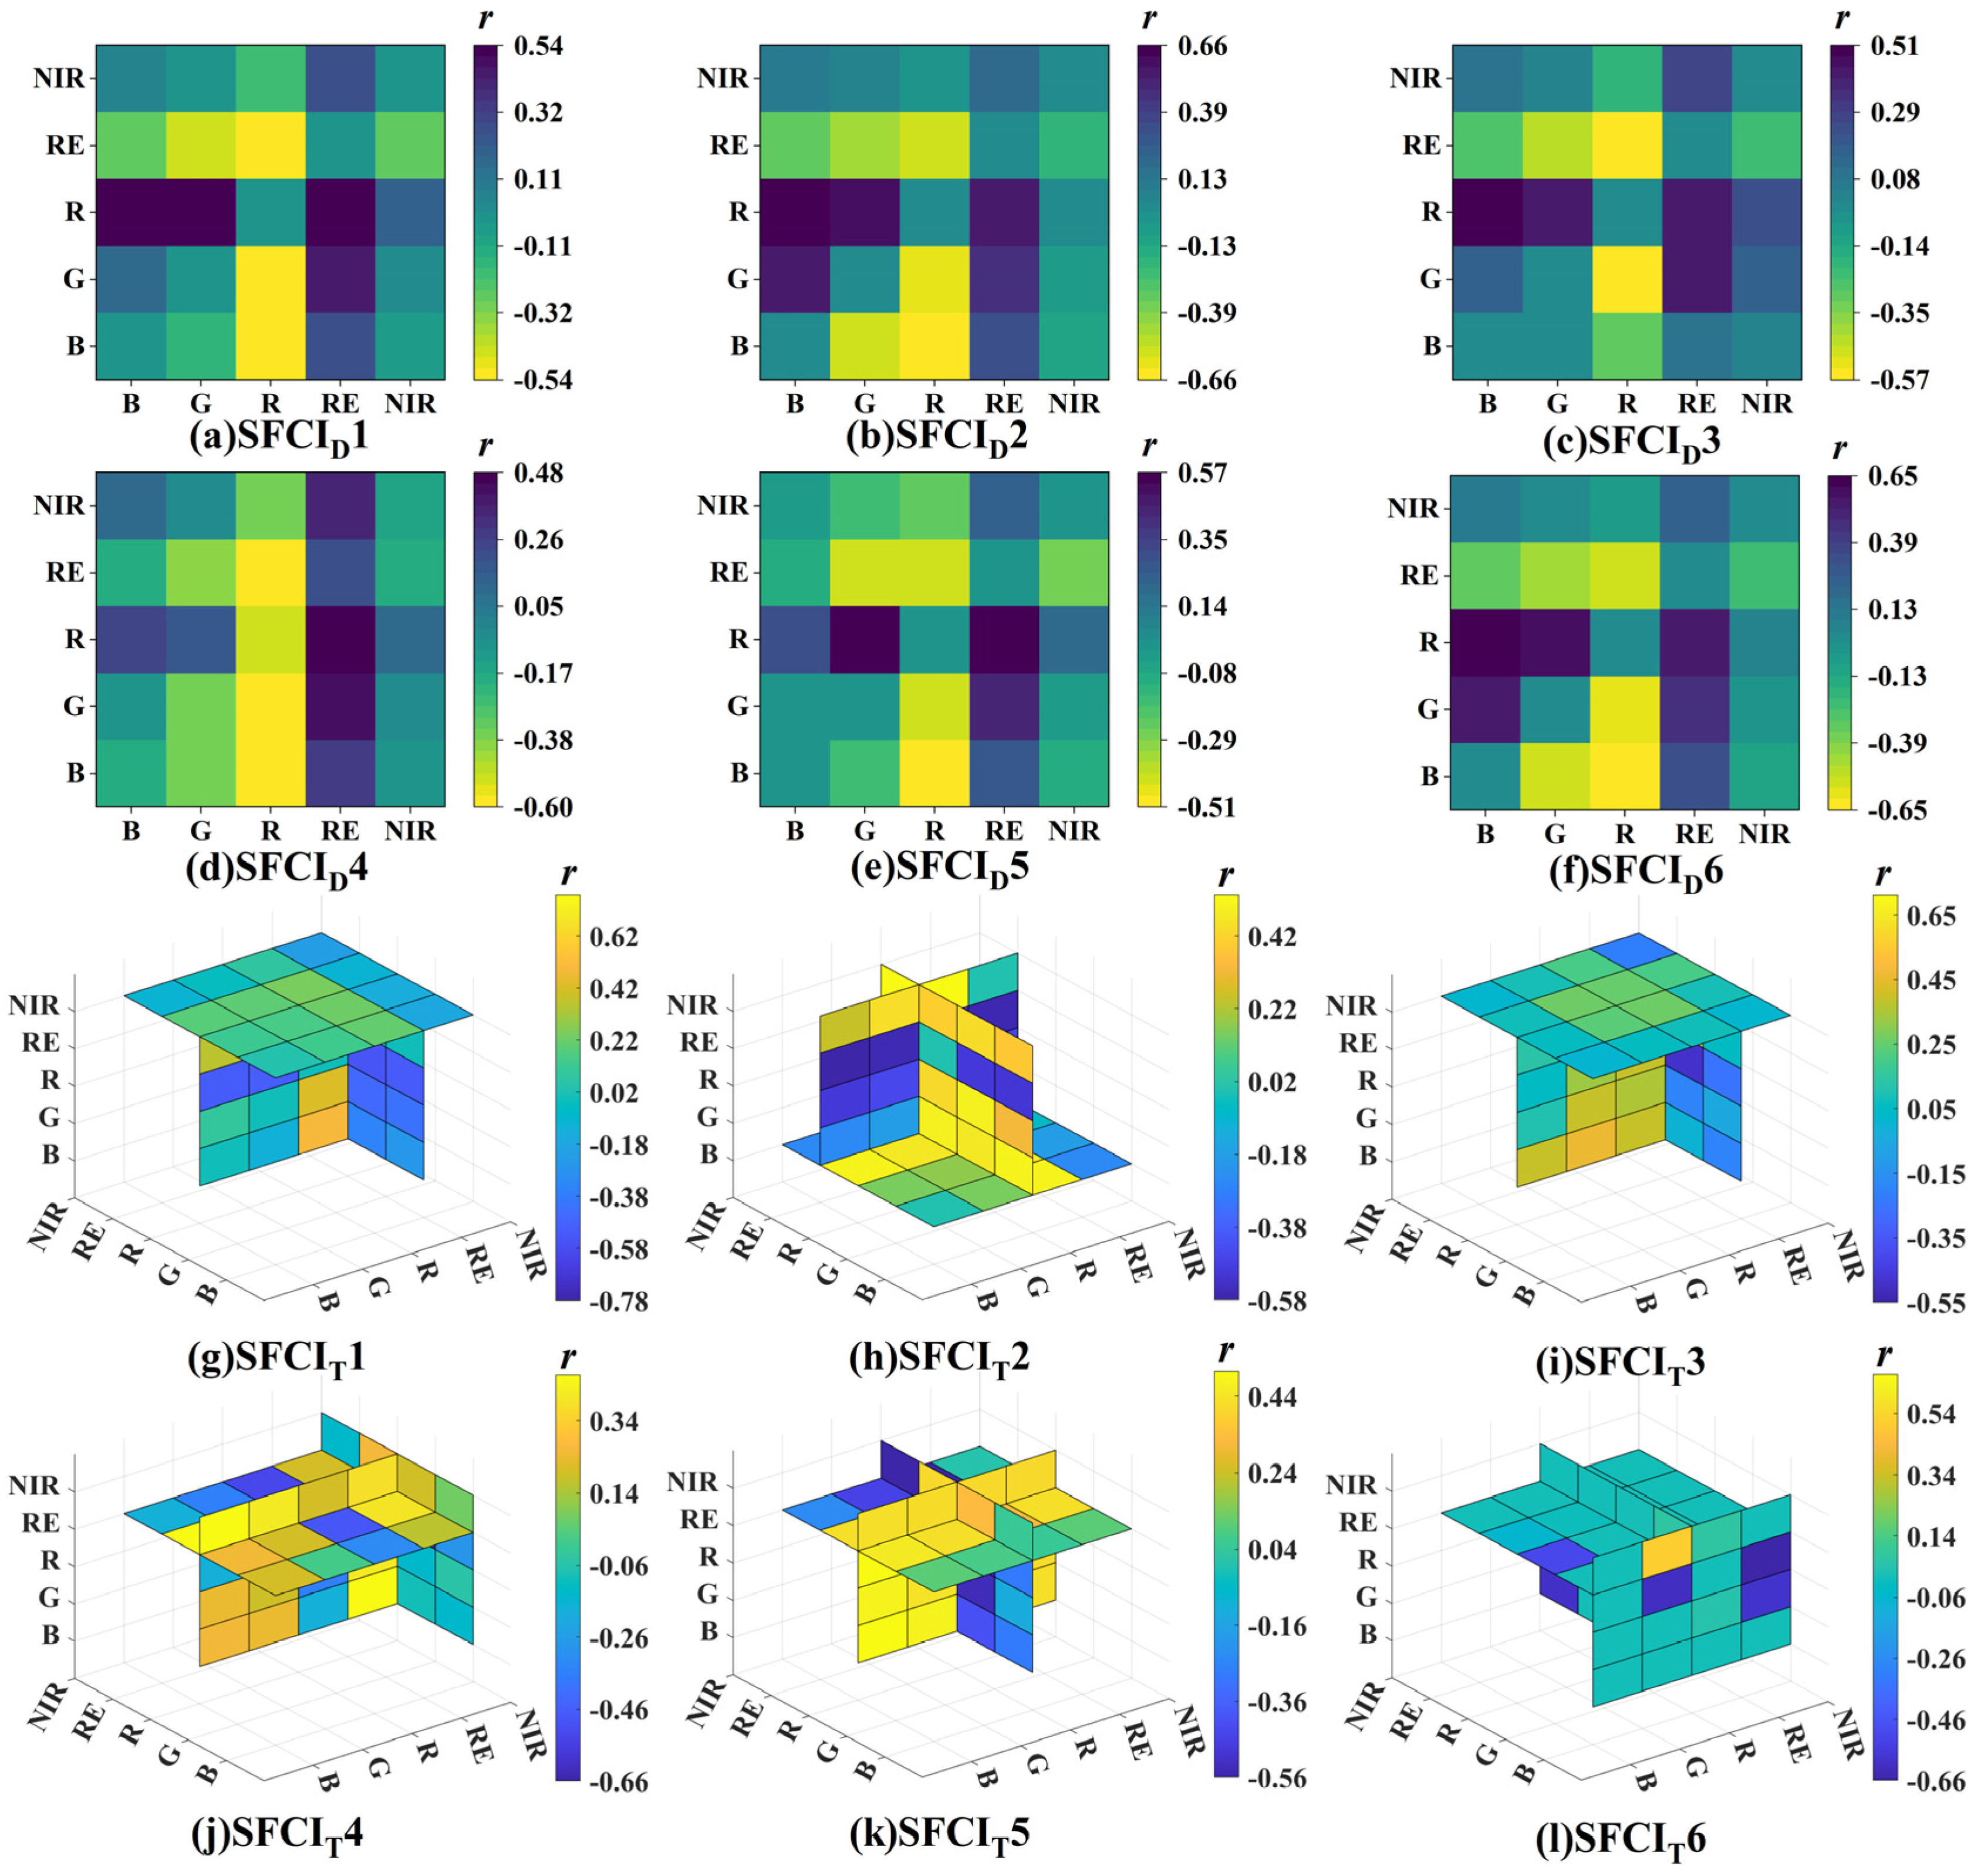
3.2.2. Correlation between LNC and SFCIs at Multiple Growth Stages

Based on the spectral reflectance of winter wheat canopies, SFCIs sensitive to LNC across multiple growth stages were constructed using the formulas from Table 4, which include six SFCID and six SFCIT. The correlation analysis results between these SFCIs and LNC during multiple growth stages of winter wheat are shown in Figure 6. To explore the potential of SFCIs for estimating LNC across wheat’s multiple growth stages, the SFCIs with the strongest correlation for each FCI treatment were selected for subsequent modeling, resulting in a total of six SFCID and six SFCIT. Among the SFCID, the six with the highest correlation with LNC across winter wheat’s multiple growth stages are SFCID1 (RE,R), SFCID2 (B,R), SFCID3 (R,RE), SFCID4 (R,B), SFCID5 (RE,R), and SFCID6 (B,R), with correlation coefficients (r) of 0.532, 0.652, −0.564, −0.598, 0.564, and 0.641, respectively. Among the SFCIT, the six with the highest correlation with LNC are SFCIT1 (RE,R,NIR), SFCIT2 (R,RE,B), SFCIT3 (RE,R,NIR), SFCIT4 (NIR,R,RE), SFCIT5(R,R,RE), and SFCIT6 (R,B,RE), with correlation coefficients (r) of 0.780, −0.597, 0.713, −0.661, −0.564, and 0.663, respectively. From Figure 6, it can be observed that SFCIT has a better correlation with LNC across multiple growth stages of wheat compared to SFCID, and SFCIs constructed with multiple spectral reflectance bands show a stronger association with wheat LNC.

3.2.3. Estimating LNC of Winter Wheat across Multiple Growth Stages Using Spectral Information

This study employed PLSR, RFR, SVR, and GPR algorithms to construct LNC estimation models based on spectral information (VIs and SFCIs) extracted from MS imagery of winter wheat canopies obtained by UAV. The validation statistics of the models are presented in Table 5. According to Table 5, VIs provide better estimation accuracy for LNC than SFCID, but overall, they perform lower than SFCIT. Combining VIs with SFCID and SFCIT to construct LNC estimation models yields higher accuracy, with the RFR model showing the best performance among the four machine learning algorithms, specifically with an R2 = 0.738, RMSE = 0.653%, RPD = 1.952.

3.3. Multiple Growth Stage LNC Estimation Based on Texture Information

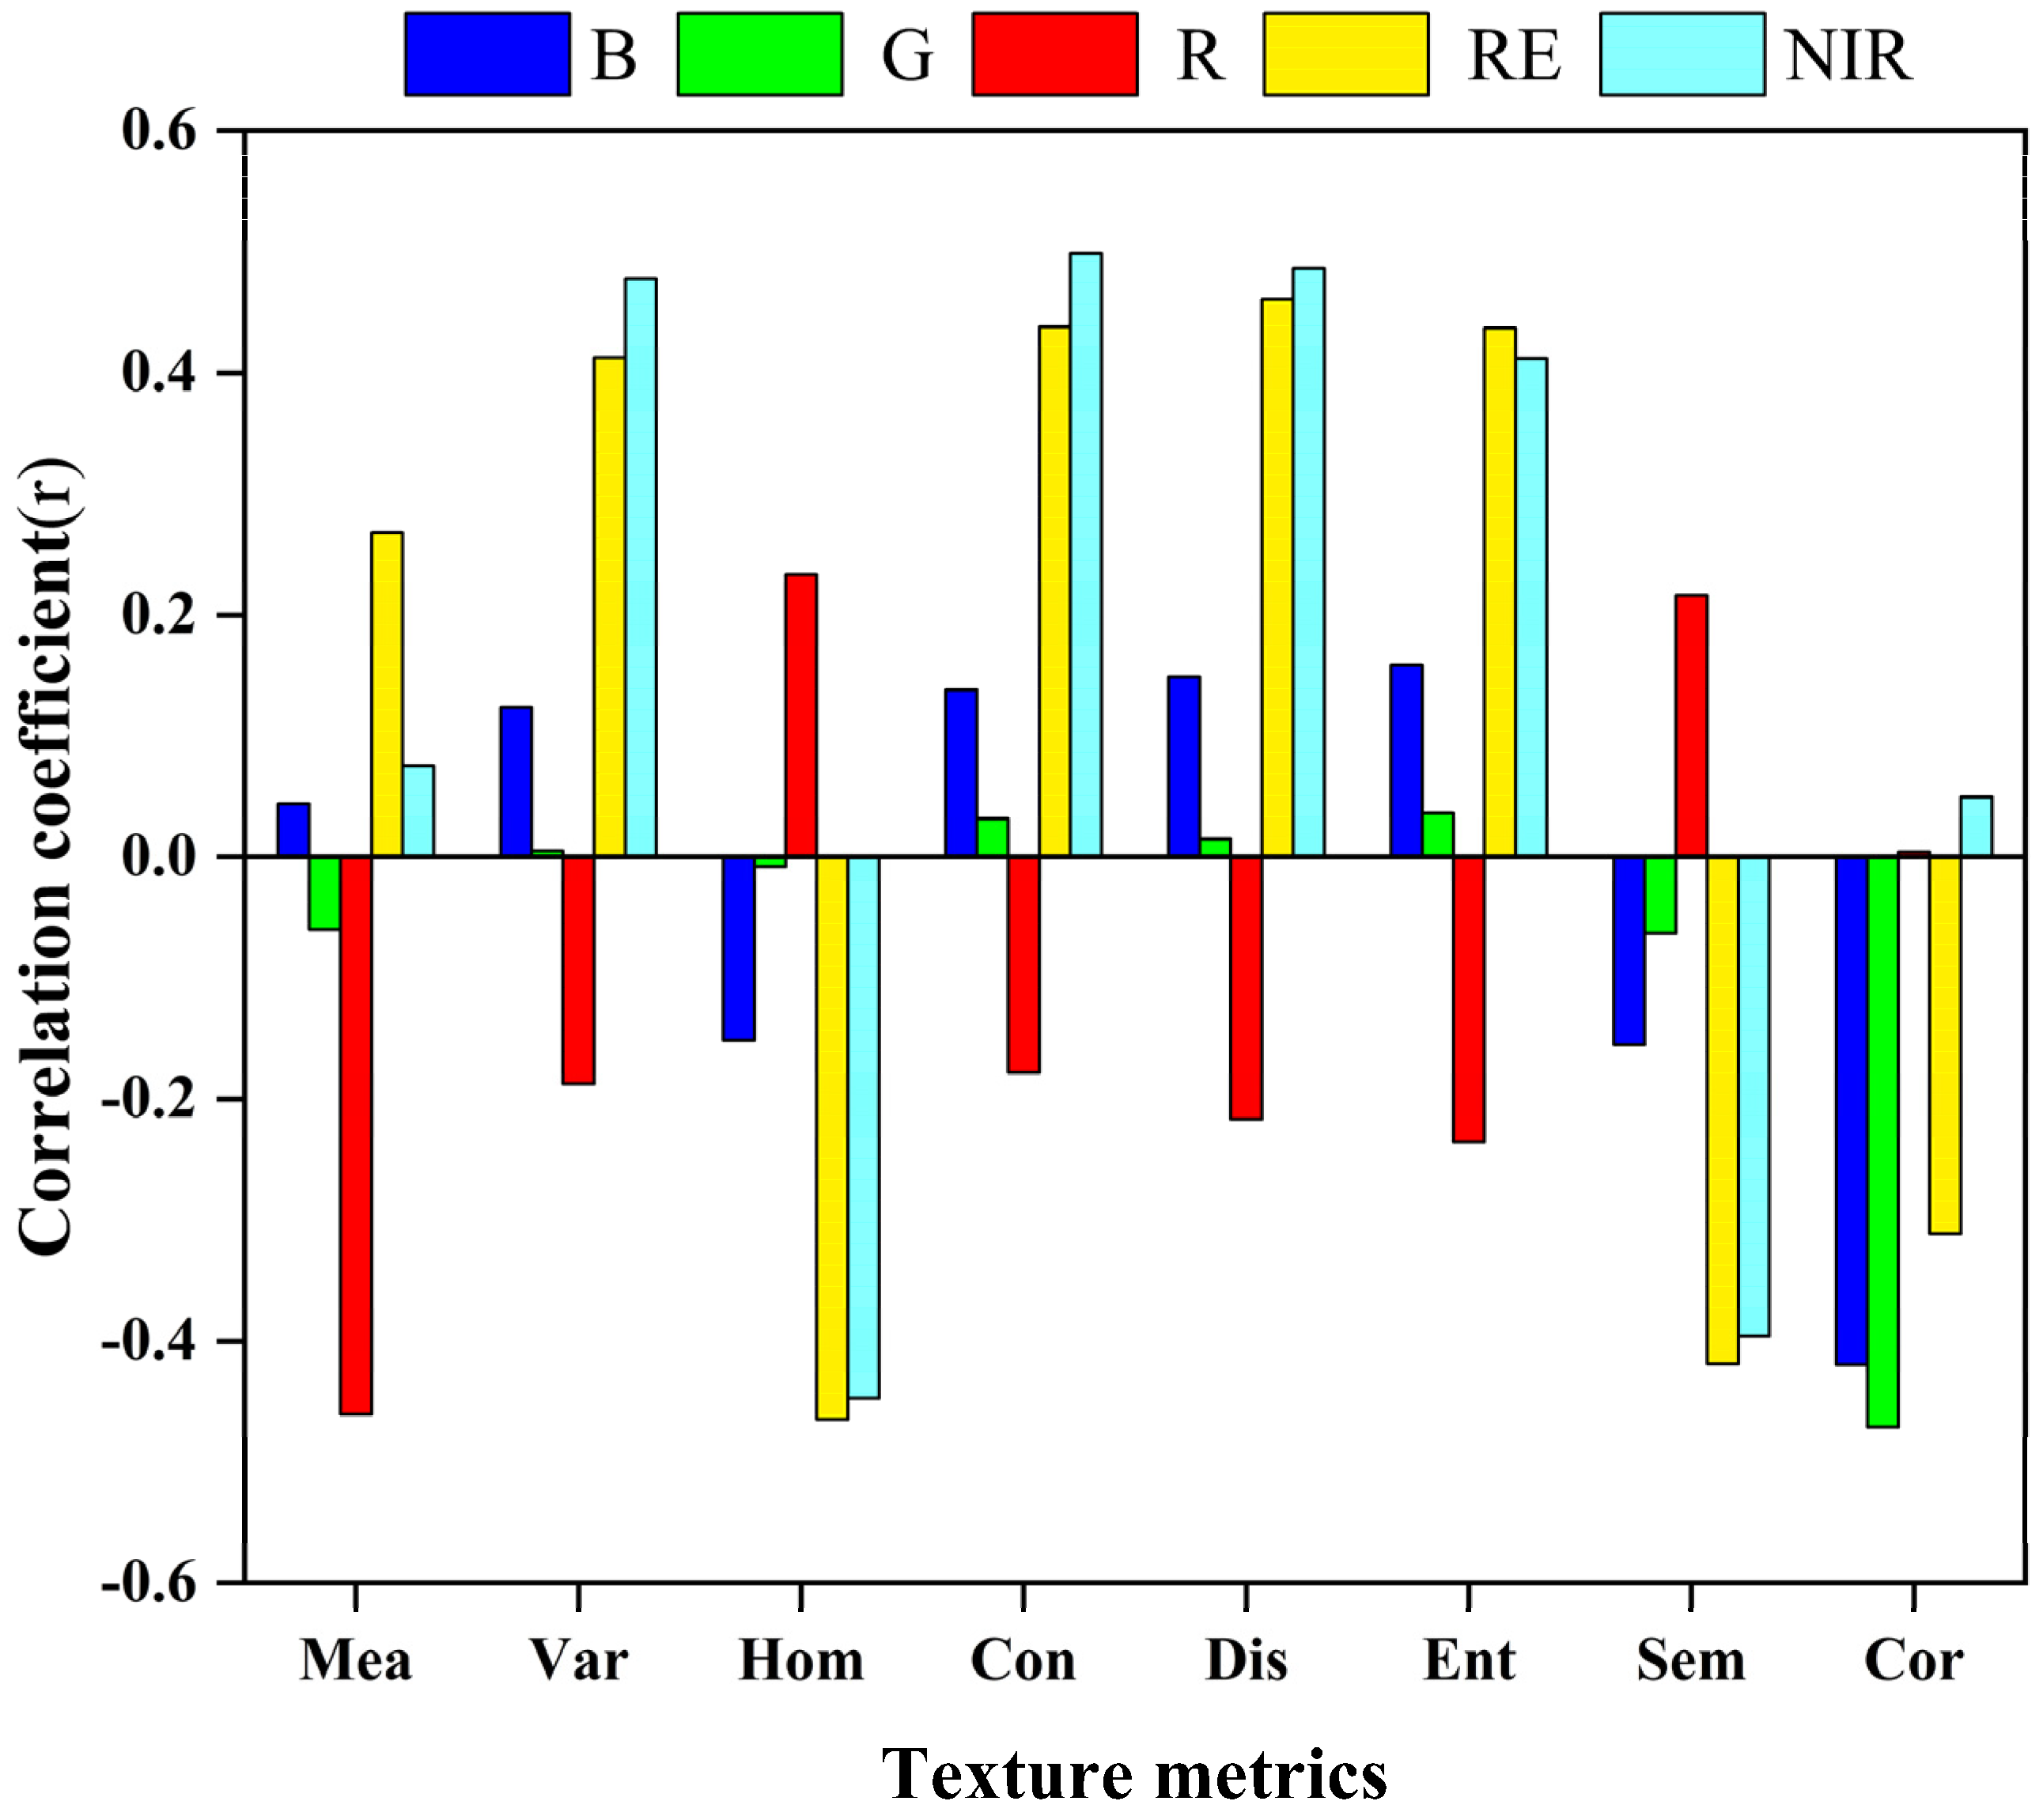
3.3.1. Correlation between LNC and Texture Metrics at Multiple Growth Stages

The study extracted Tm from the five bands of the multispectral (MS) imagery using the Gray Level Co-occurrence Matrix (GLCM) and analyzed their correlation with LNC across multiple growth stages of winter wheat, as shown in Figure 7. The correlation coefficients for the texture metrics across all bands are generally low, with none exceeding 0.5. Among them, the texture metric at the Near-infrared band (NIR.Con) shows the highest correlation with LNC (r = 0.499). To enhance the precision of Tm in estimating LNC across multiple growth stages and for comparative analysis with TFCIs (TFCID, TFCIT), the study selected the six Tm with the highest correlation coefficients for subsequent model construction. These are NIR.Con, NIR.Dis, NIR.Var, RE.Hom, G.Cor, and RE.Dis, with correlation coefficients of 0.499, 0.487, 0.478, −0.464, −0.471, and 0.461, respectively.

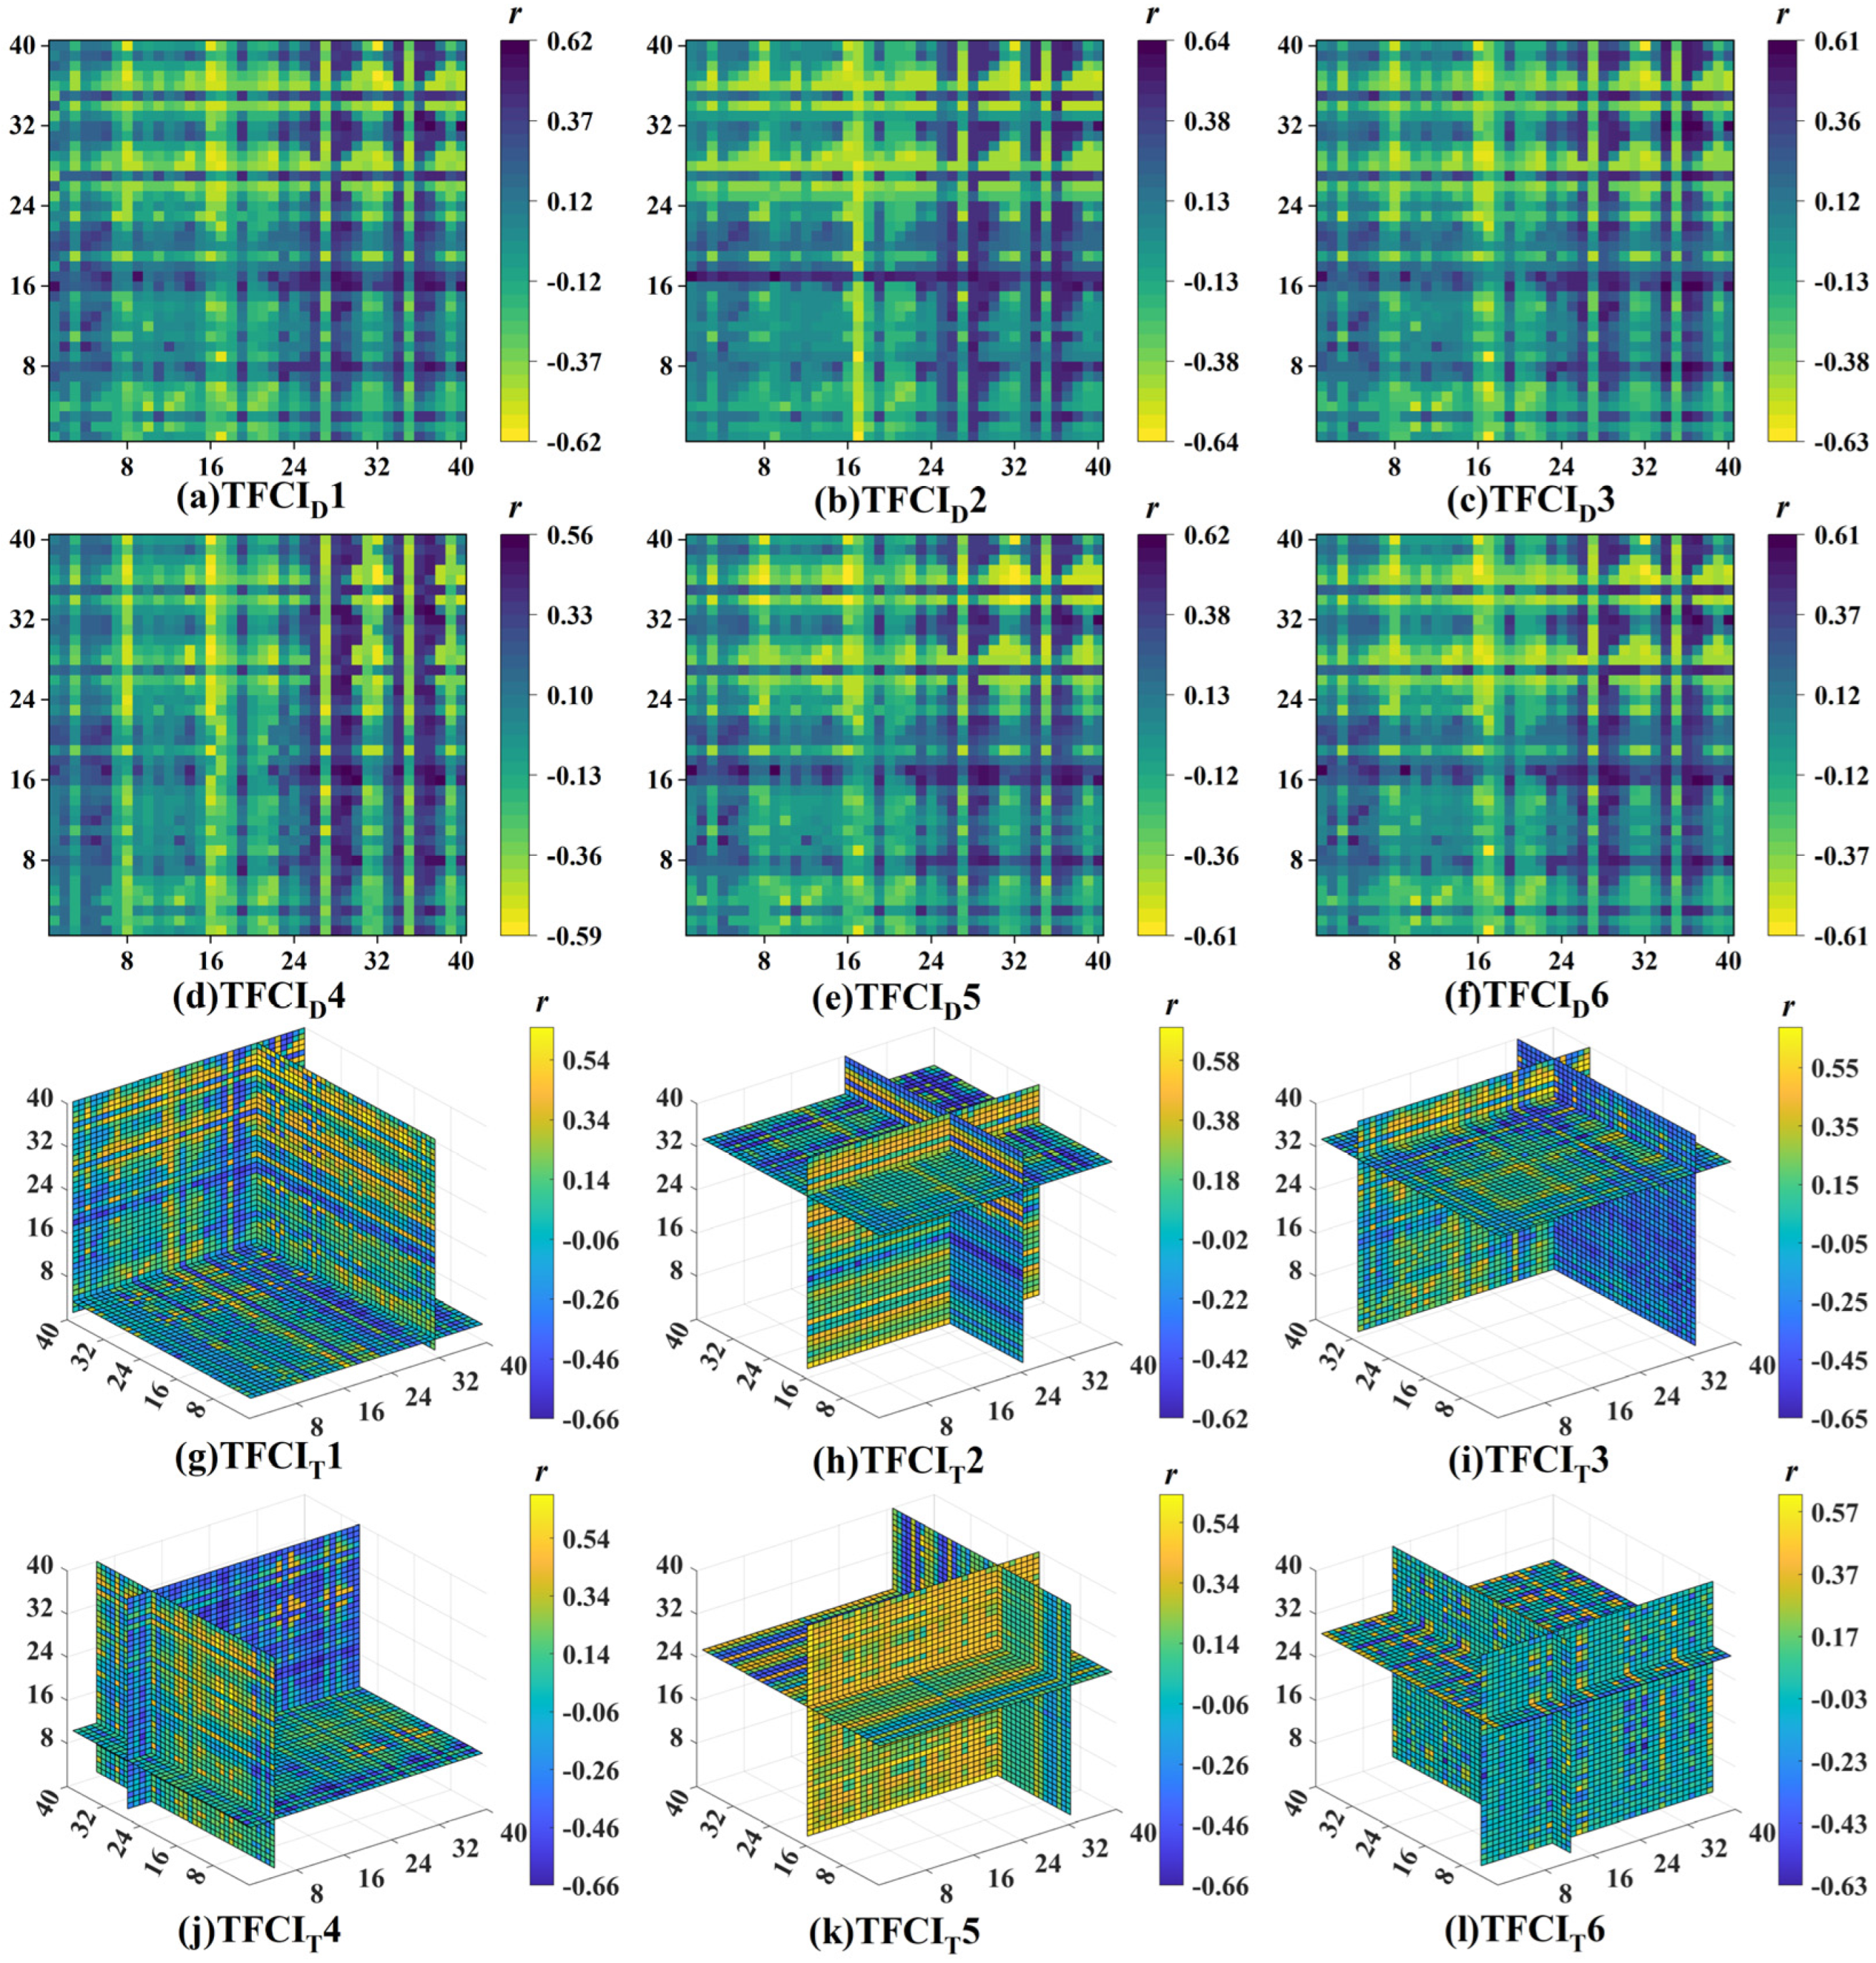
3.3.2. Correlation between LNC and TFCIs at Multiple Growth Stages

Based on MS imagery, Tm were extracted using the GLCM, and 12 TFCIs were constructed using the formulas from Table 4. The optimal TFCIs were selected for subsequent modeling for each FCI treatment. Figure 8 presents the correlation results between TFCID, TFCIT, and LNC across multiple growth stages of winter wheat. The numbers on each axis correspond to the Tm for each band, specifically B: 1–8, G: 9–16, R: 17–24, RE: 25–32, and NIR: 33–40, with the order of Tm for each band following the arrangement in Table 3.
From Figure 8, it can be observed that the TFCID with the highest correlation with LNC across multiple growth stages of winter wheat are TFCID1 (NIR.Cor, RE.Cor), TFCID2 (R.Mea, B.Mea), TFCID3 (RE.Cor, NIR.Cor), TFCID4 (G.Cor, NIR.Dis), TFCID5 (NIR.Cor, RE.Cor) and TFCID6 (NIR.Cor, RE.Cor), with correlation coefficients of 0.616, −0.634, −0.623, −0.586, −0.607, and 0.609, respectively. The six TFCIT with the highest correlation are TFCIT1 (RE.Cor, NIR.Cor, B.Hom), TFCIT2 (RE.Mea, R.Mea, NIR.Mea), TFCIT3 (NIR.Var, RE.Cor, NIR.Mea), TFCIT4 (B.Dis, RE.Con, G.Var), TFCIT5 (NIR.Mea, R.Mea, RE.Mea), and TFCIT6 (G.Dis, B.Dis, RE.Con), with correlation coefficients of −0.656, 0.688, 0.685, 0.668, −0.662, and 0.627, respectively. The TFCIs constructed in this study show higher correlations with LNC across multiple growth stages compared to the individual Tm, and the TFCIT generally have better correlations with LNC than the TFCID (Figure 7 and Figure 8).

3.3.3. Estimating LNC of Winter Wheat across Multiple Growth Stages Based on Texture Information

This study constructs LNC estimation models across multiple growth stages of winter wheat using texture information (Tm and TFCI) extracted from MS imagery of wheat canopies obtained by UAV, employing PLSR, RFR, SVR, and GPR algorithms. Table 6 presents the statistical results of model validation. According to Table 6, compared to traditional Tm, the TFCIs constructed in this study perform better in estimating LNC of winter wheat, with the performance ranking as TFCIT > TFCID > Tm. The SVR model with TFCIT as the input variable achieves the highest accuracy, with R2 = 0.626, RMSE = 0.785%, and RPD = 1.621. When Tm and TFCIs are combined as input variables for LNC estimation models, the model performance is significantly enhanced, clearly surpassing models using Tm and TFCIs individually. Furthermore, among the four machine learning algorithms, the SVR model with texture information as the input variable consistently outperforms the other three, with the highest accuracy achieved by the SVR model integrating Tm, TFCID, and TFCIT, with specific metrics of R2 = 0.688, RMSE = 0.714%, and RPD = 1.783.

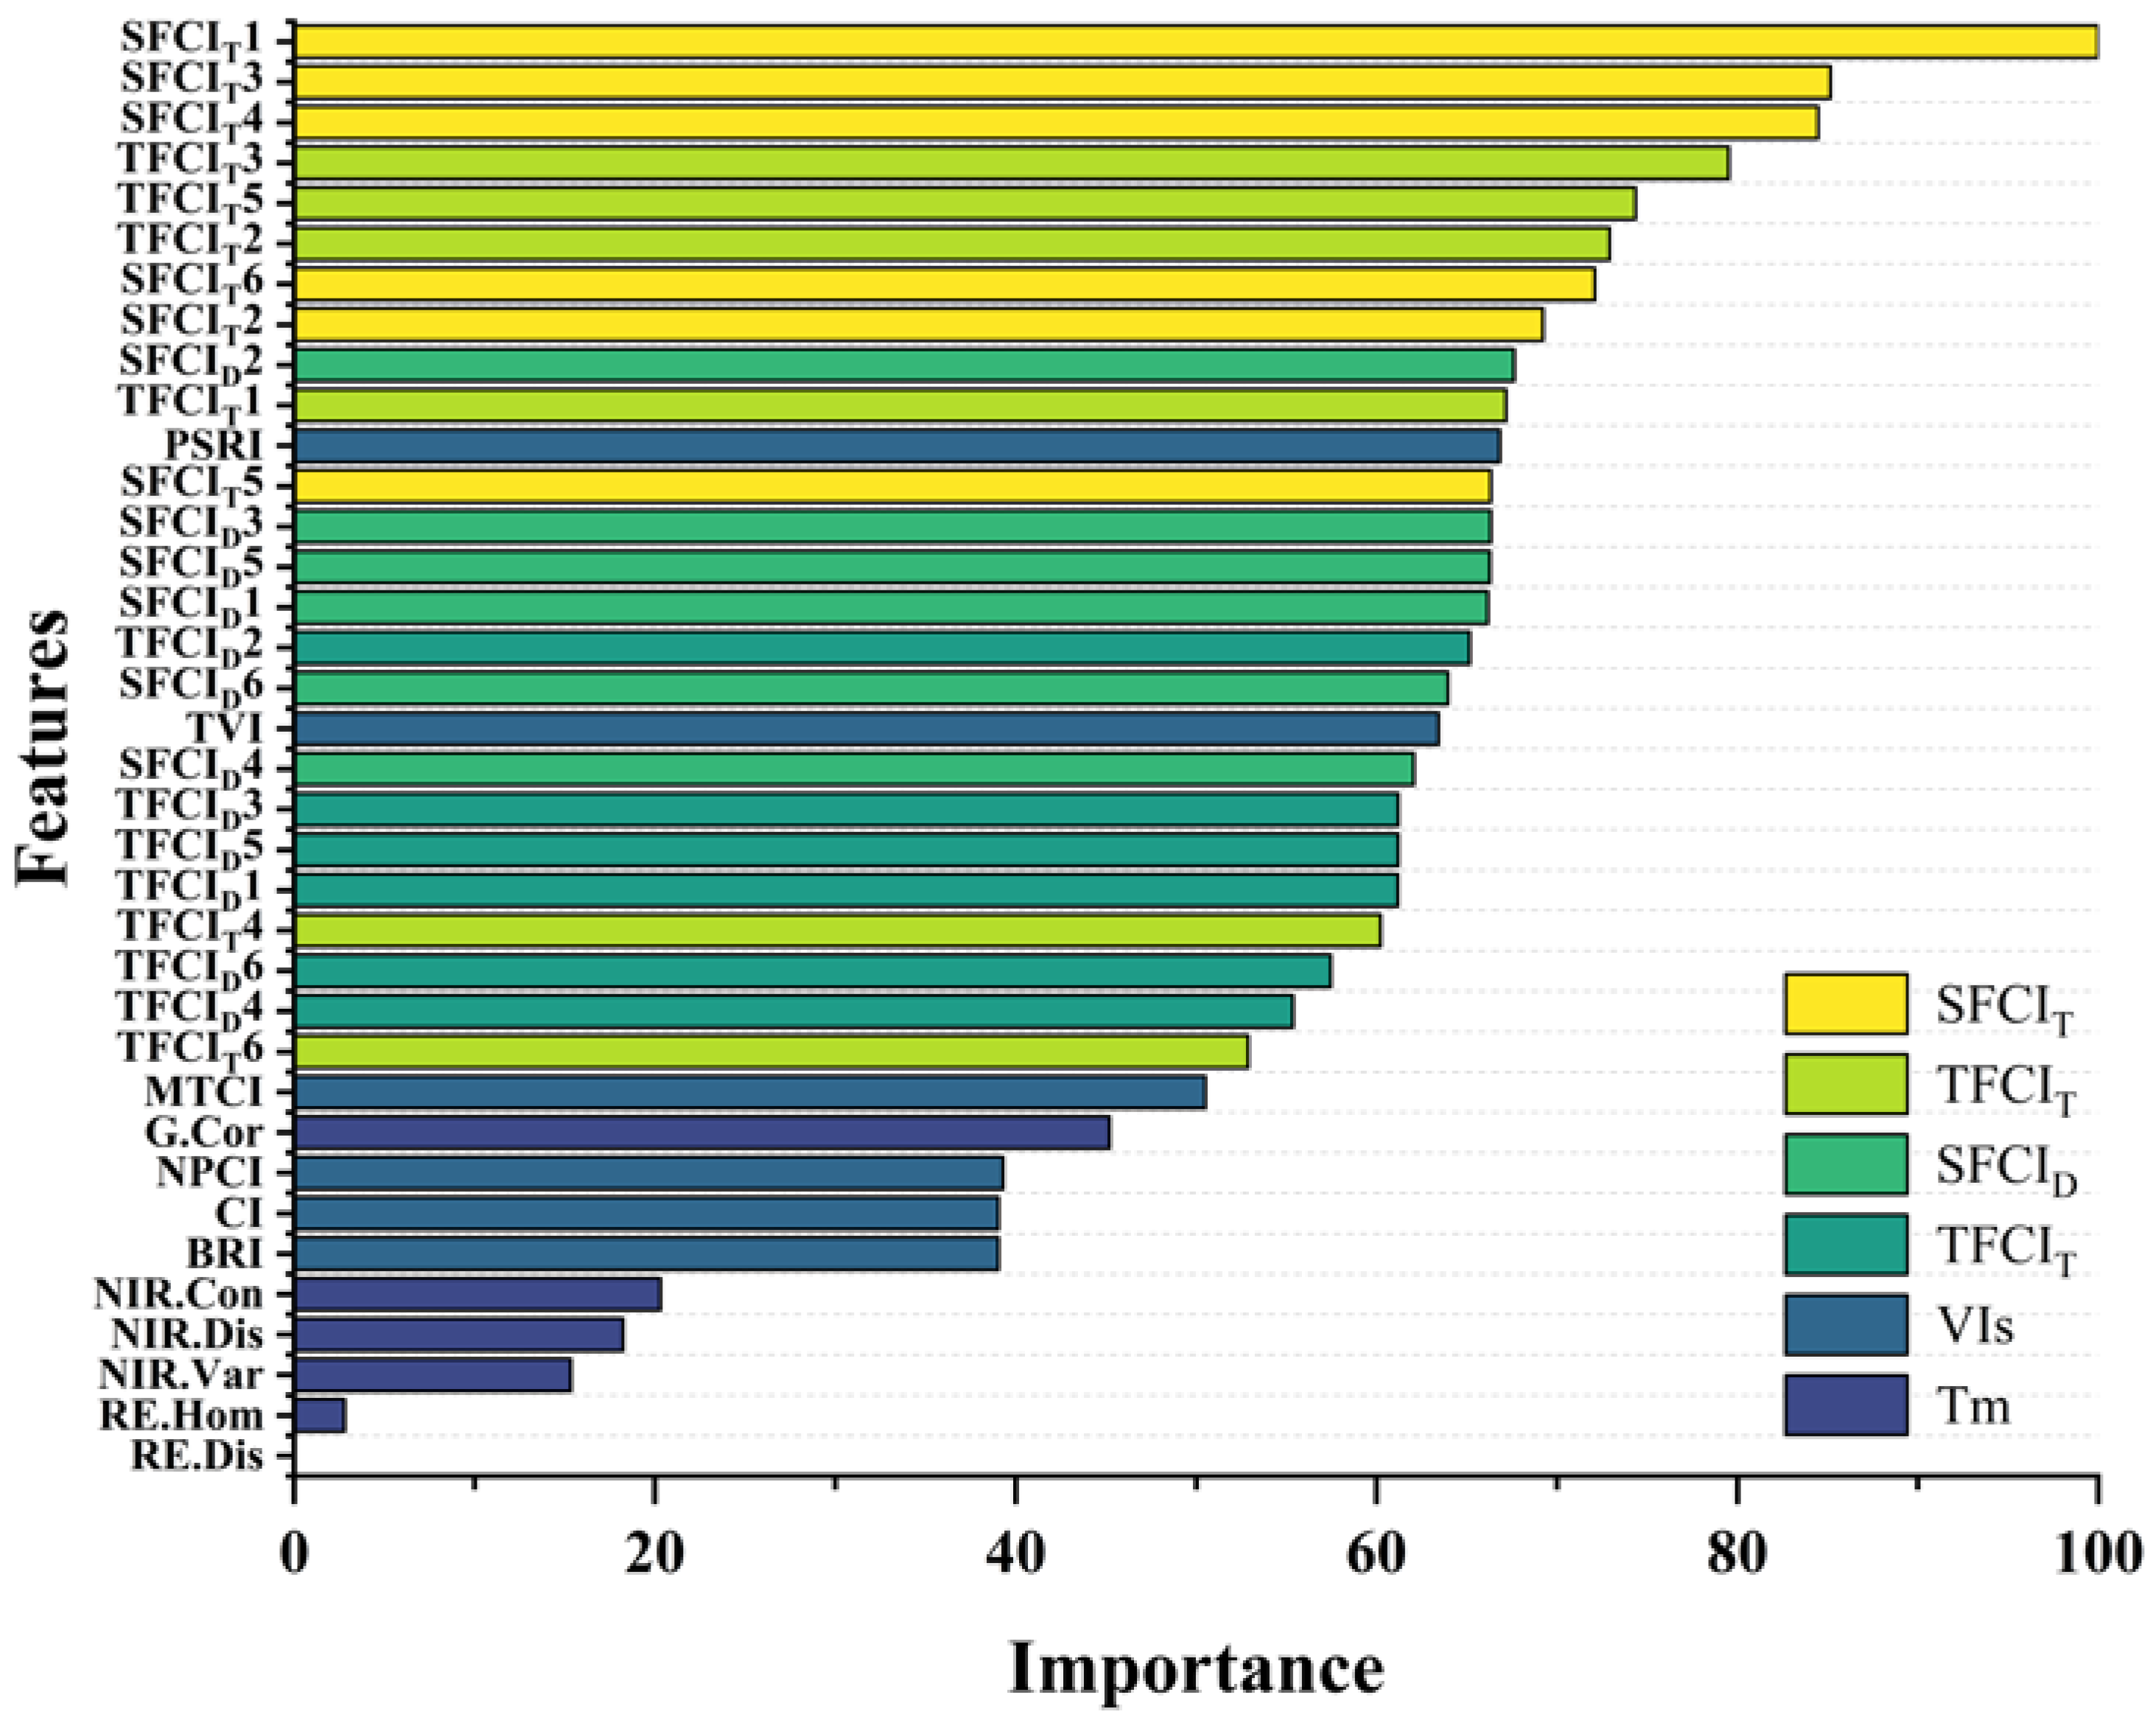
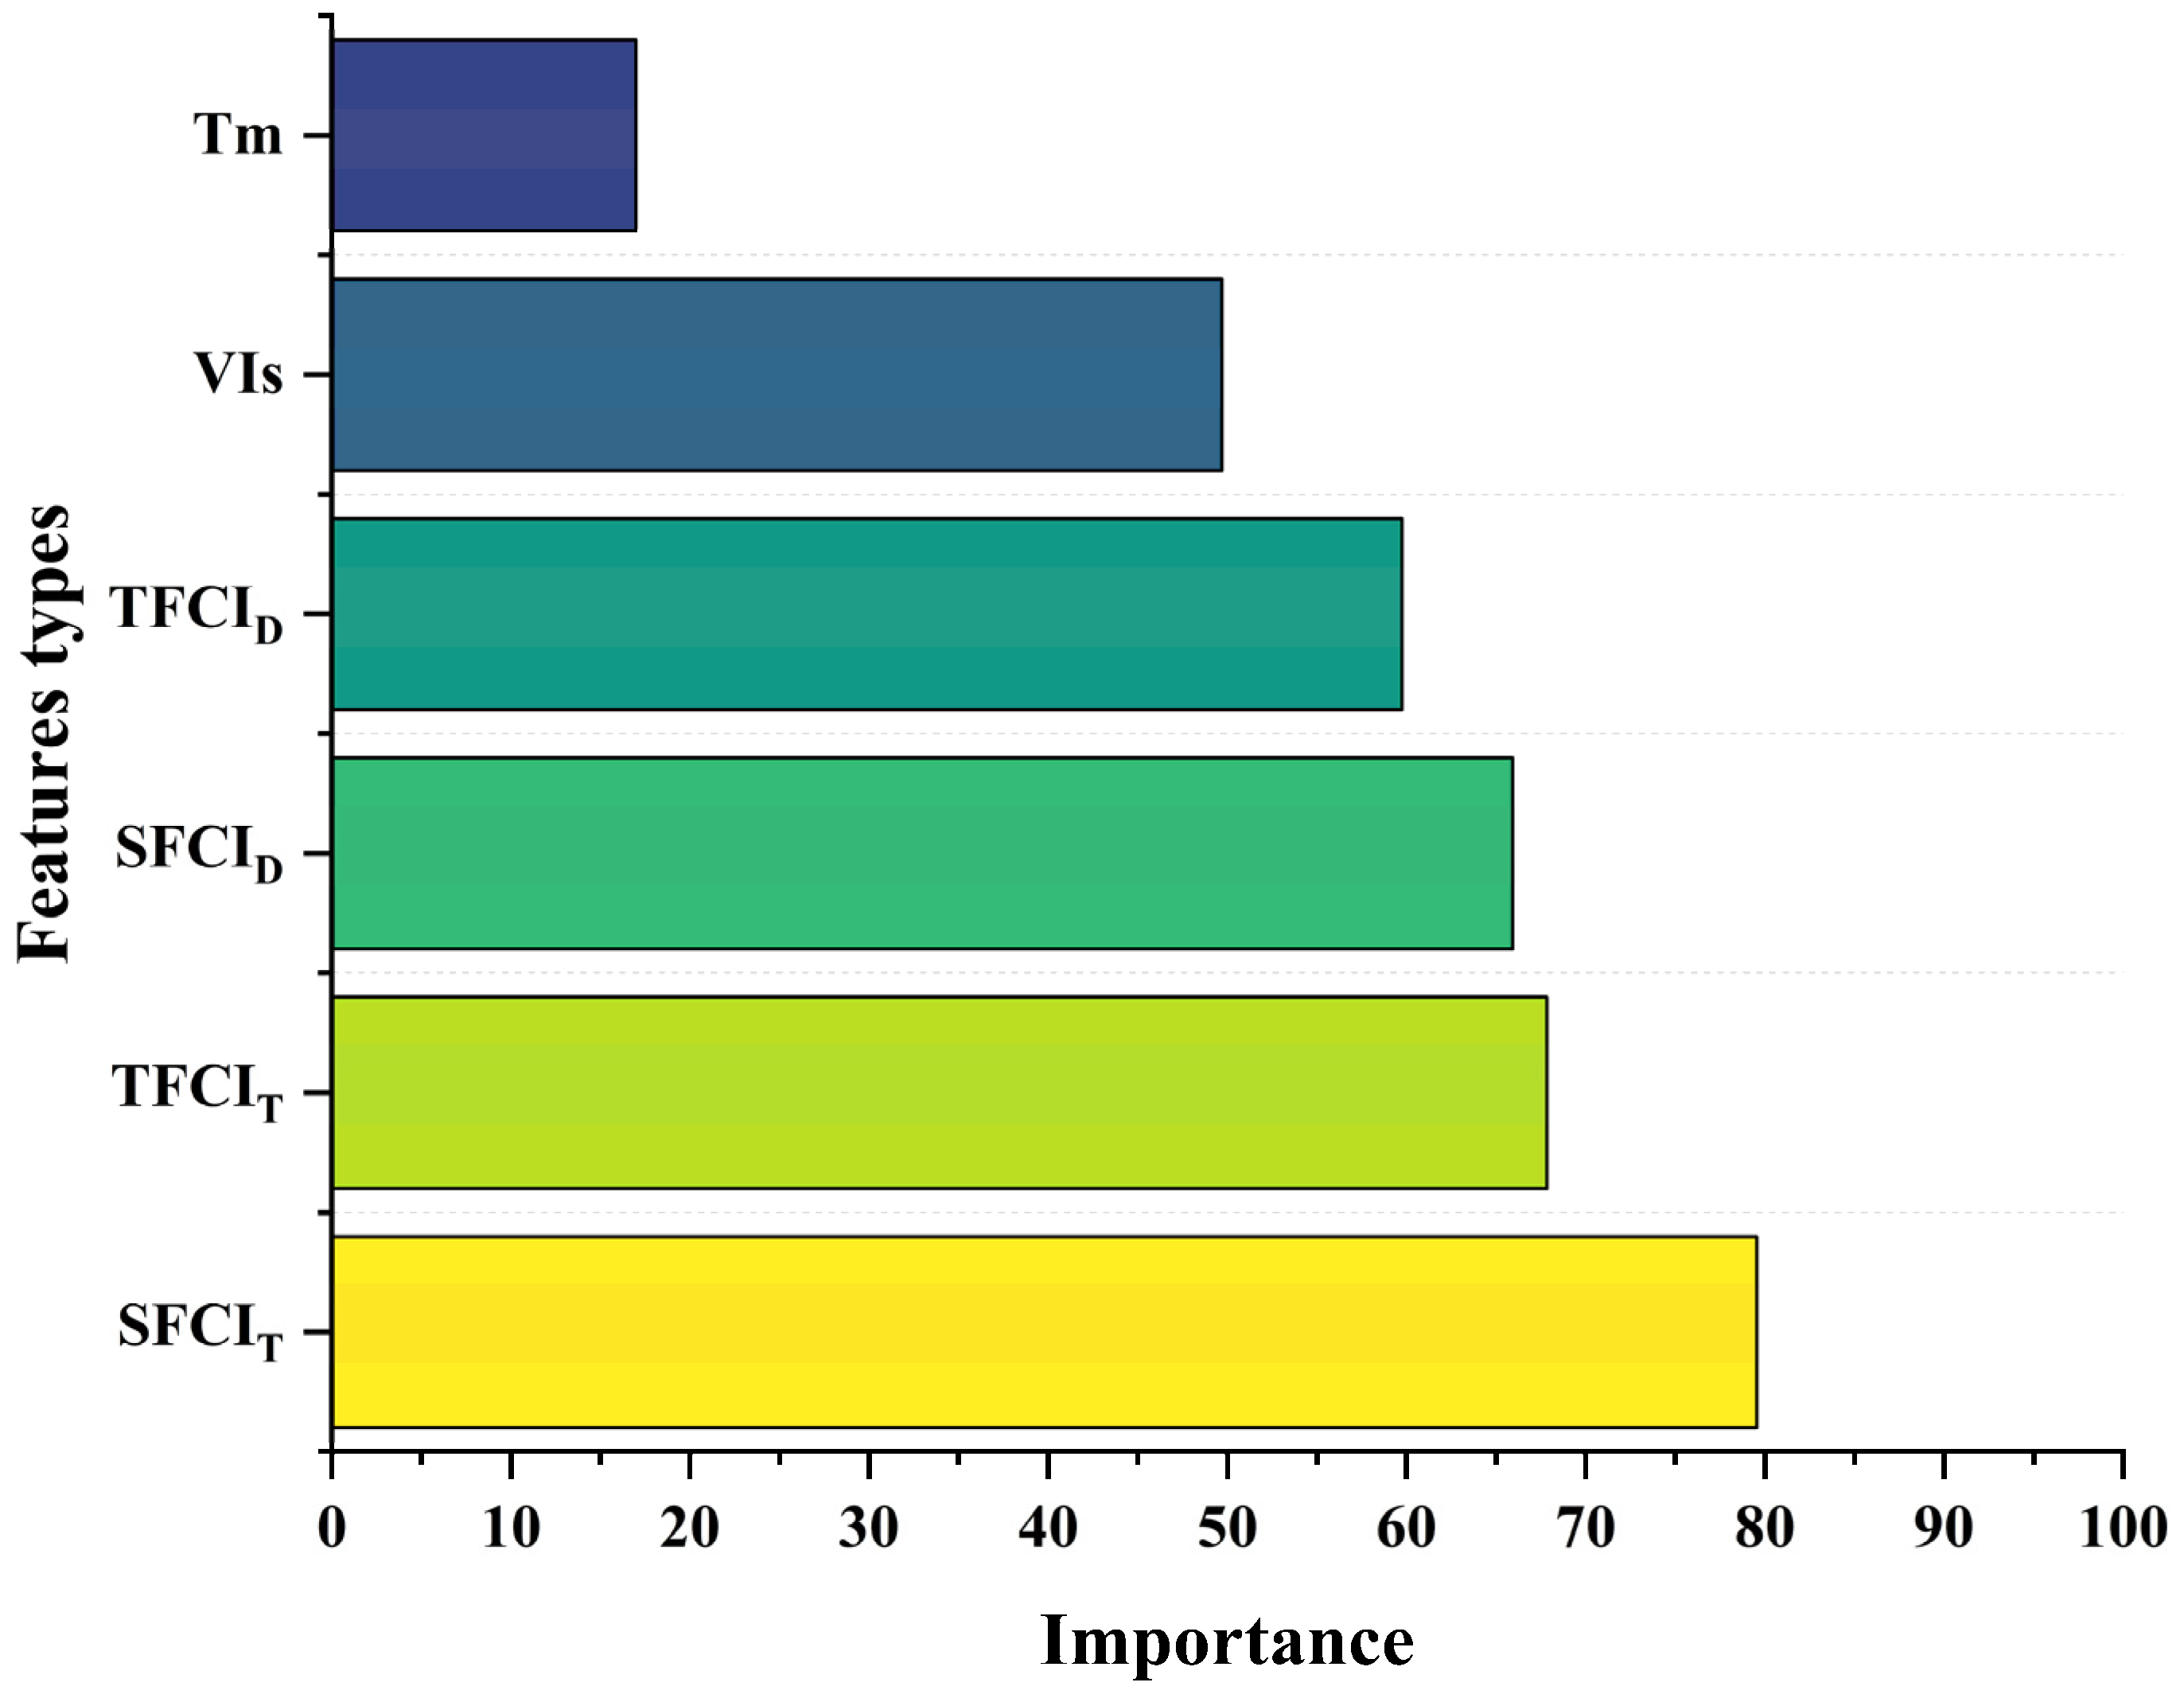
3.4. Combining the UAV-Based Spectral and Texture Information for Estimating LNC across Multiple Growth Stages of Winter Wheat

Based on four different machine learning algorithms, LNC estimation models were constructed (Table 7, Figure 9). The results indicate that the optimal model for estimating LNC using spectral information is RFR, which outperforms the other three algorithms with higher accuracy: R2 = 0.738, RMSE = 0.653%, RPD = 1.952. The best models for estimating LNC using texture information and a combination of spectral and texture information are both SVR, which shows superior performance compared to PLSR, RFR, and GPR, with specific metrics of R2 = 0.786, RMSE = 0.589%, RPD = 2.162. From the perspective of data types, it was found that the capability of estimating LNC based on spectral information across all four machine learning algorithms is superior to that of texture information. Moreover, combining spectral information with texture information maximizes the estimation accuracy of LNC across multiple growth stages compared to using either type of information alone.
This study, based on the optimal estimation model for LNC across multiple growth stages (SVRval: R2 = 0.786, RMSE = 0.589%, and RPD = 2.162), outlined the feature importance of the model (Figure 10). The feature importance scale runs from 0 to 100, where 100 represents the most contributing feature, and 0 represents the least contributing feature. SFCIT1 had the highest feature relevance, while RE.Dis had the least. The top ten most important features are FCIs. We created a ranking chart of feature type relevance by further integrating the significance of various features by type and calculating the average (Figure 11). Figure 11 illustrates that developed FCIs are more significant than VIs and Tm. The overall importance of feature types is as follows: SFCIT > TFCIT > SFCID > TFCID > VIs > Tm, with SFCIT outperforming the rest.

4. Discussion

4.1. Response of Spectral Information to LNC across Multiple Growth Stages

Spectral information, a type of remote sensing data that reflect the growth status of crops, and crop phenotypic information are closely associated [52]. VIs derived from band operations moderately correlate with LNC because the spectral bands extracted from multispectral images responded differently to LNC (Figure 5). In contrast to previous research [14,53], our study’s correlation between NDVI and LNC is not optimal. In addition, the results indicate that, like NDVI, GCVI, which represents the amount of chlorophyll and nitrogen in crops, has the lowest correlation with LNC across multiple growth stages. This may be related to the growth stages of winter wheat used in this study, where canopy heterogeneity across multiple growth stages affects the comprehensive performance of NDVI and GCVI. NDVI and GCVI gradually increased during the Jointing and Booting stages followed by a sharp decrease during the Early and Late filling stages. The UAV-obtained canopy images of winter wheat at the Jointing stage are susceptible to soil background effects, and the complex spectral mixing effect [8] may affect the NDVI and GCVI information. The canopy growth variations during the Booting stage mask the background effects, enhancing NDVI and GCVI accuracy. Previously, Su et al. [16] also demonstrated that the spectral accuracy during the Booting stage is superior to other periods. However, NDVI and GCVI information tends to become saturated in the Early and Late filling stages due to the wheat canopy closure [54], decreasing their sensitivity to LNC.
Previous research has shown that specific feature combination algorithms can provide spectral information reflecting crop growth conditions [55]. This study used feature combination formulas to construct indices sensitive to LNC across multiple growth stages. The findings indicate that, under each SFCID treatment, the spectral indices with the best correlation with LNC in various growth stages are primarily composed of the R and RE bands and that, under each SFCIT treatment, the spectral features with the best correlation are mainly composed of the R, RE, and NIR bands (Figure 6). Thus, information from the R, RE, and NIR bands has the potential for estimating LNC across multiple growth stages. Nitrogen is a constituent of the chlorophyll molecule, a vital pigment in plant photosynthesis, and variations in the nitrogen content in wheat leaves can affect the amount of chlorophyll present. Chlorophyll is particularly sensitive to red light, as the pigment predominantly absorbs it [13]. Thus, an increase in LNC may result in a lower reflectance in the red spectral band, reducing the amount of red light reflected to the sensor from the plant surface. The RE band represents a transitory zone in the plant’s spectral reflectance, characterized by a sharp increase. The position of this “red edge” correlates with the chlorophyll content [19]. An increase in LNC usually causes the RE to shift towards longer wavelengths, as more chlorophyll absorbs light in the red band and extends the decline in reflectance to longer wavelengths. While chlorophyll hardly absorbs any light in the NIR spectrum, variations in this band significantly correlate with the internal structure and biochemical composition of the plant leaves. The NIR band effectively represents crops’ health status since plant cellular structure reflects a high percentage of the NIR spectrum [55].
In line with Fan et al.’s [56] findings, our investigation showed that SFCIT outperforms SFCID in estimating LNC across multiple growth stages, providing a more accurate reflection of wheat LNC information (Figure 6). As wheat biochemical properties change over time, complex canopy heterogeneity causes variations in spectral responses. Three-band combinations respond better to these changes than two-band combinations, improving correlation with LNC and the ability to estimate LNC. This also clarifies why LNC estimation models constructed using VIs have better precision than SFCID but worse precision than SFCIT (Table 5). Another important factor contributing to this diversity is the variations in feature combination formulas. The study found that using the same band information but different feature combination formulas has varying effects on mitigating the growth stage effect. Zheng et al. [55] reported similar results when estimating LNC. The results indicate that band information and feature combination formulas concurrently influence the ability of SFCIs to estimate LNC across multiple growth stages.
Furthermore, with a correlation coefficient of r = 0.780, the study preliminarily determined that SFCIT1 (RE, R, NIR) is the most promising feature combination index for estimating LNC across multiple growth stages. The formulas in Table 4 indicate that SFCIT1 (RE, R, NIR) is equivalent to an improved NDVI index (called the Modified Vegetation Index, MVI), where the numerator changes from (NIR-R) in NDVI to (RE-R), while the denominator stays the same. The correlation coefficient (r) between SFCIT1 and wheat LNC across multiple growth stages increased by 268% compared to NDVI.
M V I = ( R E R ) / ( N I R + R )
Using the RE band, which is sensitive to leaf chlorophyll [57], rather than the NIR band, which is strongly reflected by leaves [13], capitalizes on the physiological fact that nitrogen is a key component of chlorophyll and is closely linked to it. Additionally, the RE band has a lower reflectance rate than the NIR band regarding vegetation spectral characteristics. MVI showed a generally acceptable match and a favorable response to LNC across wheat growth stages (Figure 12a). The MVI and LNC density curves exhibited a similar pattern, gradually increasing and peaking when LNC was around 3 and MVI was around 0.3, before declining. Figure 12b shows a poor match with scattered data points between the NDVI and LNC across multiple growth stages. Moreover, the NDVI density curve peaked between 0.8 and 1.0, exhibiting a state of hyper-aggregation in this range. The canopy heterogeneity during the different growth stages of wheat might be responsible for this. NDVI may reach saturation during the reproductive growth stage, when the wheat canopy is closed, with minimal overall variation and diminished spectral sensitivity. However, the FCIs in this study were developed based on a two-year dataset of wheat LNC during the Jointing, Booting, Early filling and Late filling stages. Future work will include validating their performance on other crops and agronomic indicators at different experimental sites and attempting to refine them into remote sensing indices with potential for spatiotemporal transferability.
In summary, the FCIs developed in this study consider both the vegetative and reproductive growth stages, efficiently adapting to variations in LNC throughout wheat growth. The Jointing, Booting, Early and Late filling stages of a two-year wheat LNC dataset were the basis for developing these FCIs. Future work will verify their efficacy on other crops and agronomic indicators across diverse experimental sites and attempt to enhance them into remote sensing indices capable of spatiotemporal transferability.

4.2. Contribution of Texture Information to LNC Estimation across Multiple Growth Stages

Texture, which reflects the spatial arrangement of crop canopy structure without relying on brightness, is frequently combined with spectral information to construct crop information estimation models, improving model performance [58,59]. Our study (Figure 7) supports the widely accepted notion that a weak correlation exists between Tm and agronomic parameters [58]. Thus, developing reliable models for crop phenotypic estimation using just Tm is challenging. This study used Tm to construct 12 sensitive TFCIs across four growth stages of wheat. The findings indicate that NIR information is superior to other bands in estimating LNC, as the six Tm with the highest correlation with LNC were primarily found in the NIR band [13]. Guo et al. [60] discovered that Con had the highest accuracy in extracting maize heading date. Liu et al. [23] demonstrated that Con outperformed other Tm in estimating rice above-ground biomass (AGB). The study’s optimal TFCID and TFCIT treatments primarily consisted of Mea, Cor, Con, and Dis. This is consistent with Liu et al. [61], who identified Mea, Con, and Dis as essential parameters for estimating winter wheat AGB. Mea and Cor are low-frequency information reflectors within the window that depict internal information about the growth and development of winter wheat. They show the parts of the plant growing quickly and consistently, documenting the developmental variations in wheat at various growth stages. Con and Dis focus on high-frequency information, demonstrated by Liu et al. [23] to help estimate crop information, such as the degree of gray-level fluctuations and the relationship between pixel distances and diagonal. Sensitive Tm enhanced the response to LNC across multiple growth stages by employing feature combination formulas, which reflected the changes in LNC over these times. In line with Yang et al.’s [45] findings, our investigation discovered that all 12 TFCIs correlated more with LNC than Tm. It could be attributed to the feature combination formulae highlighting crop canopy information by minimizing interference from soil background, solar angle, terrain, and shadows after optimized band information [62,63]. Our study confirms the feasibility of optimizing Tm using feature combination formulas, providing a practical approach to enhance Tm’s responsiveness to LNC. Sarker et al. [64] also suggested that texture information processed by formulas could improve the estimation accuracy of forest biomass. Furthermore, the study indicated that TFCIT had a higher correlation with LNC than both Tm and TFCID. In contrast to TFCID and Tm, TFCIT provides an extra dimension of texture information [45], capturing the changes in wheat LNC over time in more detail and further boosting the responsiveness to LNC.

4.3. The Significance of Combining Spectral and Texture Information

We found that the precision of LNC models constructed by combining spectral and texture information was higher than when using either spectral or texture information alone (Table 7), which is similar to the findings of Freitas et al. [25] and Zhang et al. [65] regarding other physiological and biochemical parameters. Spectral and texture information reflect different aspects of LNC changes, and integrating data from multiple feature types into a more comprehensive feature set can enhance the performance of predictive models and increase their interpretability [26]. However, spectral and texture information integration does not always result in improved model performance. Using five machine learning algorithms and two ensemble learning algorithms, Shu et al. [66] estimated corn leaf area index, fresh weight, and dry weight. They discovered that the combined spectral and texture information decreased the estimation accuracy, with texture information demonstrating higher estimation capability than spectral information. Liu et al. [23] found that integrating spectral and texture information for estimating rice AGB did not improve model precision. Multiple factors influence this phenomenon. (1) Different experimental settings directly affect the precision of spectral or texture information acquisition, and incorporating less precise data into the model may diminish model accuracy [67]. In particular, distinct crop types and varieties may result in variations in canopy structure [68], which can alter the correlation between spectral and texture information and crop physiological and biochemical parameters. All of this could have an impact on the accuracy of estimation models. Different crop planting directions [69] and different UAV data acquisition times [70] can cause different canopy shadows in remote sensing images, while different crop planting densities [71] directly affect canopy structure arrangement. Climate conditions [72], sensor types [66], image resolution [73], crop growth stages [74], and different UAV flight altitudes [75] also affect the precision of spectral and texture information. (2) Machine learning algorithms, also referred to as “black box” models, differ in the precision of the models they construct [76]. By changing the model input variables, feature selection, a critical step in machine learning algorithms, can directly affect the precision of estimation models. Multiple-feature models are not always stable, and Liu et al. [77] found that the number of variables in a model does not always equate to its performance. Overlapping features can cause data redundancy, reducing model performance. Zhou et al. [67] discovered that combining agronomic practice information (API) with spectral and texture features to estimate rice yield decreased model precision. The contribution and mutual influence of multiple feature characteristics affect the performance of models that incorporate spectral and texture information. However, this study aimed to explore the potential of feature combination formulas in estimating LNC across multiple growth stages, and thus, feature selection was not a priority. The study selected features using the standard Pearson correlation analysis method, focusing primarily on the response capability of spectral and texture information to LNC while neglecting the mutual influence of features within the estimation model. Future work will explore the relationship between feature interactions and model performance to improve accuracy.
In summary, the significance of combining spectral and texture information in this work lies in the ability to estimate wheat LNC more accurately and reliably. Spectral information reveals the biochemical and physiological state of crops [19], while texture information reflects the spatial arrangement and structural characteristics of the crop canopy [23]. Integrating these two data types allows the model to better account for the complex relationships between crop growth, canopy structure, and environmental factors [78], leading to more precise estimation of crop traits. This integrated approach leverages the strengths of both spectral and texture analyses, resulting in a more detailed understanding of crop health and nutritional status [71]. Spectral indices may be affected by factors such as soil background and crop canopy, and including texture information can mitigate these effects. On the other hand, texture information can reveal additional insights about the canopy’s microstructure that spectral information alone may not capture [23]. This integrated method can lead to more effective crop management strategies, optimized fertilization, and higher crop yields and quality. It also encourages the development of more powerful remote sensing tools for precision agriculture, enabling farmers to make informed decisions based on comprehensive and accurate data.

4.4. The Comparability of Various Machine Learning Algorithms in Estimating LNC

Different machine learning algorithms are suited to different environments due to their inherent limitations. In particular, the PLSR algorithm is sensitive to outliers, affecting the model’s stability and predictive power [79]. In addition, inappropriate selection of model parameters (number of components, regularization parameters) might reduce estimation performance. While the RFR algorithm reduces the risk of overfitting based on individual trees, it can still occur with high-dimensional datasets [79,80]. The SVR algorithm requires the storage of support vectors, which can be memory-intensive for large datasets. Moreover, SVR operations require considerable time and computational resources [71]. Selecting an appropriate kernel function for GPR can be challenging since different kernel functions may be suitable for various data types. However, there are no universal guidelines for determining the optimal kernel function. Furthermore, GPR’s performance on large-scale datasets is relatively average, since its computational complexity rises with the number of data points [81]. This study used four machine learning algorithms, PLSR, RFR, SVR, and GPR, to construct LNC estimation models for multiple growth stages of wheat. We discovered that the optimal algorithm for estimating LNC across multiple wheat growth stages seems to depend on the data type, which is consistent with the conclusions of Yu et al. [82] that the effectiveness of RFR and SVR models in estimating wheat N content is related to the type of imagery. Despite diverse feature input conditions, the RFR algorithm demonstrated high robustness in LNC estimation models using spectral information, with high R2, RPD, and low RMSE. The model utilizing VIs + SFCID + SFCIT as input variables had the highest precision, with R2 = 0.738, RMSE = 0.653%, and RPD = 1.952. Li et al. [71] confirmed the stability of the RFR algorithm in monitoring the crop nitrogen nutritional status, using the RFR algorithm combined with spectral information to construct a nitrogen monitoring model for wheat, with specific performance indicators of R2 = 0.74, RMSE = 4.59 mg g−1, and RPD = 1.25. Compared to this, the RFR model in this study showed a similar R2 but a significantly higher RPD, which may be related to the features included in the model.
The accuracy of LNC estimation may be improved by integrating SFCID and SFCIT, which can reflect crop LNC information [71]. The results of this study indicate that the RFR algorithm is better suited for estimating LNC using spectral information, owing to improved model performance and stability. The SVR algorithm outperformed PLSR, RFR, and GPR in constructing wheat LNC estimation models based on texture information. Among the four feature input sets of texture information, SVR consistently had the highest R2, RPD, and the smallest RMSE, (R2 = 0.688, RMSE = 0.714%, and RPD = 1.783). This precision is lower than that of the SPAD estimation model constructed by Xie et al. [83] using the SVR algorithm combined with texture features based on the Litchi Fruit Growth Period but higher than the model built using the combination of the Litchi Fruit Growth Period and the Autumn Shoot Period. Models based on a single growth period are more robust, as they do not have to account for the impact of canopy heterogeneity across multiple growth stages on model estimation, further demonstrating the potential of the TFCIs developed in this study for LNC estimation. When integrated with texture information, the SVR model constructed in this study outperformed the model that only used Tm as an input variable alone (Table 6).
Interestingly, with the combined spectral and texture information dataset, the SVR algorithm performed well in constructing LNC estimation models utilizing texture information, presumably because half of the feature information was present. These results are consistent with the findings of Zhu et al. [84], who used vegetation indices and texture features in conjunction with machine learning algorithms to construct a wheat scab-monitoring model and found that the SVR algorithm had the highest model accuracy. This could be because the SVR algorithm, which applies the structural risk minimization principle [85], performs better at predicting LNC across various growth stages than RFR since it can manage the non-linear mapping relationship between texture information and LNC.

4.5. Limitations and Future Research Perspectives

The study entailed a two-year field trial of winter wheat with three high-yielding varieties and four nitrogen gradients, using feature combination formulas to construct SFCIs and TFCIs sensitive to LNC at several growth stages. Integrating these indices with four machine learning algorithms yielded better LNC estimation across growth stages, which can be improved further. With the rapid development of sensor technology, the fusion of multi-source remote sensing data can enhance the accuracy of crop nitrogen status estimation [71]. Future research will investigate using several sensors (such as RGB, hyperspectral, and LiDAR) for collaborative observation to improve LNC estimation performance in winter wheat. The remote sensing platform used in this study is relatively unique, and the limits of UAV working hours and flight altitude restrict its application potential on a large regional scale. The consistent development of satellite remote sensing technology provides a solid foundation for large-scale agricultural surveillance. Future studies will incorporate satellite remote sensing platforms and determine how to integrate the advantages of various remote sensing platforms. In addition, our research identified a vegetation index, MVI, with the potential to estimate LNC across multiple growth stages. It would be interesting to test its performance in the future for other agronomic parameters, such as LAI and AGB. Although this study achieved adequate precision in estimating LNC across multiple growth stages using two years of trial data, the single trial location limits its generalizability, and future work will test the model’s transferability across different trial sites.
The integration of spectral and texture information to enhance LNC estimation accuracy in winter wheat across several growth stages still has limitations, primarily due to two factors. First, soil noise significantly impacts the early growth stages of wheat. When UAVs acquire remote sensing data during the early growth stages, the exposed soil background increases sensor noise, lowering sensor precision [86]. Second, after wheat heading, UAV imagery consists predominantly of leaves, spikes, and a small amount of soil, and the complex spectral mixing reduces spectral sensitivity [16]. Therefore, future research will focus on using various sensor signal-processing algorithms or removing soil background pixels to minimize the impact of soil background. We would also employ mixed spectral decomposition techniques to eliminate the effects of spectral mixing in the later growth stages, thereby enhancing model accuracy.

5. Conclusions

This study used multispectral remote sensing data to constructed feature combination indices (FCIs) sensitive to LNC across multiple growth stages based on multispectral remote sensing data and compared the performance of spectral and texture information in building LNC estimation models using four machine learning algorithms: PLSR, RFR, SVR, and GPR. It also examined the potential of estimating LNC by combining spectral and texture information. The results indicate that the combination of Red, Red edge, and Near-infrared bands has a high potential for estimating LNC across multiple growth stages, effectively capturing wheat’s developmental changes over time. Texture metrics such as Mea, Cor, Con, and Dis are highly sensitive to wheat LNC while showing modest resilience to canopy heterogeneity across various growth stages. The SFCIs and TFCIs constructed using feature combination formulas significantly improved the response to LNC across growth stages. With a correlation coefficient increase of 268%, a preliminary finding of a vegetation index, MVI, demonstrated significant improvement over NDVI, correcting the over-saturation concerns of NDVI in time-series analysis and displaying outstanding potential for LNC estimation. In addition, spectral information performed better than textural information in estimating LNC across multiple growth stages. Integrating spectral and texture information increased LNC estimation performance across growth stages, with the SVR algorithm achieving the highest precision (R2 = 0.786, RMSE = 0.589%, and RPD = 2.162). Our study has made it possible to precisely monitor LNC over multiple crop growth stages, providing scientific guidance for more accurate field nitrogen fertilization management and refined crop nutrition management.

Author Contributions

Conceptualization, X.S. and X.L.; Methodology, X.S., J.L. (Jun Li), W.W. (Weiqiang Wang) and Y.S.; Software, X.S., H.Y. and Y.Z.; Validation, Y.Z.; Formal analysis, Y.N. and W.W. (Wenhui Wang); Investigation, Q.M.; Resources, X.S.; Data curation, Y.N., H.Y., J.L. (Jun Li), W.W. (Weiqiang Wang) and Y.S.; Writing—original draft, X.S.; Writing—review & editing, X.S., Y.Z., Q.M., J.L. (Jikai Liu), W.W. (Wenhui Wang) and X.L.; Visualization, Y.Z.; Supervision, Q.M., J.L. (Jikai Liu) and X.L.; Project administration, J.L. (Jikai Liu) and X.L.; Funding acquisition, J.L. (Jikai Liu), W.W. (Wenhui Wang) and X.L. All authors have read and agreed to the published version of the manuscript.

Funding

This research was funded by Scientific research projects in higher education institutions of Anhui Province (no. 2023AH051855; 2022AH051623); Anhui Province Crop Intelligent Planting and Processing Technology Engineering Research Center Open Research Project (no. ZHKF03); Natural Science Foundation of Hebei Province (no. C2023408010); Scientific research projects in higher education institutions of Hebei Province (no. QN2024158).

Data Availability Statement

The data presented in this study are available on request from the corresponding author due to the need for follow-up studies.

Conflicts of Interest

The authors declare no conflicts of interest.

References

  1. Edae, E.A.; Byrne, P.F.; Haley, S.D.; Lopes, M.S.; Reynolds, M.P. Genome-wide association mapping of yield and yield components of spring wheat under contrasting moisture regimes. Theor. Appl. Genet. 2014, 127, 791–807. [Google Scholar] [CrossRef] [PubMed]
  2. Ma, F.; Xu, Y.; Wang, R.; Tong, Y.; Zhang, A.; Liu, D.; An, D. Identification of major QTLs for yield-related traits with improved genetic map in wheat. Front. Plant Sci. 2023, 14, 1138696. [Google Scholar] [CrossRef] [PubMed]
  3. Hansen, P.M.; Schjoerring, J.K. Reflectance measurement of canopy biomass and nitrogen status in wheat crops using normalized difference vegetation indices and partial least squares regression. Remote Sens. Environ. 2003, 86, 542–553. [Google Scholar] [CrossRef]
  4. Lu, N.; Wu, Y.; Zheng, H.; Yao, X.; Zhu, Y.; Cao, W.; Cheng, T. An assessment of multi-view spectral information from UAV-based color-infrared images for improved estimation of nitrogen nutrition status in winter wheat. Precis. Agric. 2022, 23, 1653–1674. [Google Scholar] [CrossRef]
  5. Tan, C.; Guo, W.; Wang, J. Predicting grain protein content of winter wheat based on landsat TM images and leaf nitrogen Content. In Proceedings of the 2011 International Conference on Remote Sensing, Environment and Transportation Engineering, Nanjing, China, 24–26 June 2011; IEEE: Piscataway, NJ, USA, 2011; pp. 5165–5168. [Google Scholar] [CrossRef]
  6. Ma, X.; Chen, P.; Jin, X. Predicting wheat leaf nitrogen content by combining deep multitask learning and a mechanistic model using UAV hyperspectral images. Remote Sens. 2022, 14, 6334. [Google Scholar] [CrossRef]
  7. Zhu, Y.; Liu, J.; Tao, X.; Su, X.; Li, W.; Zha, H.; Wu, W.; Li, X. A Three-Dimensional Conceptual Model for Estimating the Above-Ground Biomass of Winter Wheat Using Digital and Multispectral Unmanned Aerial Vehicle Images at Various Growth Stages. Remote Sens. 2023, 15, 3332. [Google Scholar] [CrossRef]
  8. Wang, W.; Zheng, H.; Wu, Y.; Yao, X.; Zhu, Y.; Cao, W.; Cheng, T. An assessment of background removal approaches for improved estimation of rice leaf nitrogen concentration with unmanned aerial vehicle multispectral imagery at various observation times. Field Crop. Res. 2022, 283, 108543. [Google Scholar] [CrossRef]
  9. Mutanga, O.; Adam, E.; Adjorlolo, C.; Abdel-Rahman, E.M. Evaluating the robustness of models developed from field spectral data in predicting African grass foliar nitrogen concentration using WorldView-2 image as an independent test dataset. Int. J. Appl. Earth Obs. Geoinf. 2015, 34, 178–187. [Google Scholar] [CrossRef]
  10. Song, D.; Gao, D.; Sun, H.; Qiao, L.; Zhao, R.; Tang, W.; Li, M. Chlorophyll content estimation based on cascade spectral optimizations of interval and wavelength characteristics. Comput. Electron. Agric. 2021, 189, 106413. [Google Scholar] [CrossRef]
  11. Eitel, J.; Long, D.S.; Gessler, P.E.; Smith, A. Using in-situ measurements to evaluate the new RapidEye™ satellite series for prediction of wheat nitrogen status. Int. J. Remote Sens. 2007, 28, 4183–4190. [Google Scholar] [CrossRef]
  12. Huang, S.; Miao, Y.; Yuan, F.; Gnyp, M.L.; Yao, Y.; Cao, Q.; Wang, H.; Lenz-Wiedemann, V.I.; Bareth, G. Potential of RapidEye and WorldView-2 satellite data for improving rice nitrogen status monitoring at different growth stages. Remote Sens. 2017, 9, 227. [Google Scholar] [CrossRef]
  13. Gao, D.; Qiao, L.; An, L.; Zhao, R.; Sun, H.; Li, M.; Tang, W.; Wang, N. Estimation of spectral responses and chlorophyll based on growth stage effects explored by machine learning methods. Crop J. 2022, 10, 1292–1302. [Google Scholar] [CrossRef]
  14. Xu, S.; Xu, X.; Zhu, Q.; Meng, Y.; Yang, G.; Feng, H.; Yang, M.; Zhu, Q.; Xue, H.; Wang, B. Monitoring leaf nitrogen content in rice based on information fusion of multi-sensor imagery from UAV. Precis. Agric. 2023, 1–23. [Google Scholar] [CrossRef]
  15. Walter, J.; Edwards, J.; McDonald, G.; Kuchel, H. Photogrammetry for the estimation of wheat biomass and harvest index. Field Crop. Res. 2018, 216, 165–174. [Google Scholar] [CrossRef]
  16. Su, X.; Wang, J.; Ding, L.; Lu, J.; Zhang, J.; Yao, X.; Cheng, T.; Zhu, Y.; Cao, W.; Tian, Y. Grain yield prediction using multi-temporal UAV-based multispectral vegetation indices and endmember abundance in rice. Field Crop. Res. 2023, 299, 108992. [Google Scholar] [CrossRef]
  17. Yin, C.; Lv, X.; Zhang, L.; Ma, L.; Wang, H.; Zhang, L.; Zhang, Z. Hyperspectral UAV images at different altitudes for monitoring the leaf nitrogen content in cotton crops. Remote Sens. 2022, 14, 2576. [Google Scholar] [CrossRef]
  18. Ten Harkel, J.; Bartholomeus, H.; Kooistra, L. Biomass and crop height estimation of different crops using UAV-based LiDAR. Remote Sens. 2019, 12, 17. [Google Scholar] [CrossRef]
  19. Yao, X.; Zhu, Y.; Tian, Y.; Feng, W.; Cao, W. Exploring hyperspectral bands and estimation indices for leaf nitrogen accumulation in wheat. Int. J. Appl. Earth Obs. Geoinf. 2010, 12, 89–100. [Google Scholar] [CrossRef]
  20. Yang, H.; Hu, Y.; Zheng, Z.; Qiao, Y.; Zhang, K.; Guo, T.; Chen, J. Estimation of Potato Chlorophyll Content from UAV Multispectral Images with Stacking Ensemble Algorithm. Agronomy 2022, 12, 2318. [Google Scholar] [CrossRef]
  21. Fan, Y.; Feng, H.; Yue, J.; Jin, X.; Liu, Y.; Chen, R.; Bian, M.; Ma, Y.; Song, X.; Yang, G. Using an optimized texture index to monitor the nitrogen content of potato plants over multiple growth stages. Comput. Electron. Agric. 2023, 212, 108147. [Google Scholar] [CrossRef]
  22. Jay, S.; Gorretta, N.; Morel, J.; Maupas, F.; Bendoula, R.; Rabatel, G.; Dutartre, D.; Comar, A.; Baret, F. Estimating leaf chlorophyll content in sugar beet canopies using millimeter-to centimeter-scale reflectance imagery. Remote Sens. Environ. 2017, 198, 173–186. [Google Scholar] [CrossRef]
  23. Liu, J.; Zhu, Y.; Song, L.; Su, X.; Li, J.; Zheng, J.; Zhu, X.; Ren, L.; Wang, W.; Li, X. Optimizing window size and directional parameters of GLCM texture features for estimating rice AGB based on UAVs multispectral imagery. Front. Plant Sci. 2023, 14, 1284235. [Google Scholar] [CrossRef]
  24. Fu, Y.; Yang, G.; Song, X.; Li, Z.; Xu, X.; Feng, H.; Zhao, C. Improved estimation of winter wheat aboveground biomass using multiscale textures extracted from UAV-based digital images and hyperspectral feature analysis. Remote Sens. 2021, 13, 581. [Google Scholar] [CrossRef]
  25. Freitas, R.G.; Pereira, F.R.; Dos Reis, A.A.; Magalhães, P.S.; Figueiredo, G.K.; Do Amaral, L.R. Estimating pasture aboveground biomass under an integrated crop-livestock system based on spectral and texture measures derived from UAV images. Comput. Electron. Agric. 2022, 198, 107122. [Google Scholar] [CrossRef]
  26. Li, Z.; Zhou, X.; Cheng, Q.; Fei, S.; Chen, Z. A Machine-Learning Model Based on the Fusion of Spectral and Textural Features from UAV Multi-Sensors to Analyse the Total Nitrogen Content in Winter Wheat. Remote Sens. 2023, 15, 2152. [Google Scholar] [CrossRef]
  27. Rouse, J.W.; Haas, R.H.; Schell, J.A.; Deering, D.W. Monitoring vegetation systems in the Great Plains with ERTS. Nasa Spec. Publ. 1974, 351, 309. [Google Scholar]
  28. Birth, G.S.; McVey, G.R. Measuring the color of growing turf with a reflectance spectrophotometer 1. Agron. J. 1968, 60, 640–643. [Google Scholar] [CrossRef]
  29. Inoue, Y.; Sakaiya, E.; Zhu, Y.; Takahashi, W. Diagnostic mapping of canopy nitrogen content in rice based on hyperspectral measurements. Remote Sens. Environ. 2012, 126, 210–221. [Google Scholar] [CrossRef]
  30. Yuan, W.; Meng, Y.; Li, Y.; Ji, Z.; Kong, Q.; Gao, R.; Su, Z. Research on rice leaf area index estimation based on fusion of texture and spectral information. Comput. Electron. Agric. 2023, 211, 108016. [Google Scholar] [CrossRef]
  31. Di Gennaro, S.F.; Toscano, P.; Gatti, M.; Poni, S.; Berton, A.; Matese, A. Spectral comparison of UAV-Based hyper and multispectral cameras for precision viticulture. Remote Sens. 2022, 14, 449. [Google Scholar] [CrossRef]
  32. Kumar, S.; Gautam, G.; Saha, S.K. Hyperspectral remote sensing data derived spectral indices in characterizing salt-affected soils: A case study of Indo-Gangetic plains of India. Environ. Earth Sci. 2015, 73, 3299–3308. [Google Scholar] [CrossRef]
  33. Peñuelas, J.; Gamon, J.A.; Fredeen, A.L.; Merino, J.; Field, C.B. Reflectance indices associated with physiological changes in nitrogen-and water-limited sunflower leaves. Remote Sens. Environ. 1994, 48, 135–146. [Google Scholar] [CrossRef]
  34. Gitelson, A.A.; Viña, A.; Arkebauer, T.J.; Rundquist, D.C.; Keydan, G.; Leavitt, B. Remote estimation of leaf area index and green leaf biomass in maize canopies. Geophys. Res. Lett. 2003, 30. [Google Scholar] [CrossRef]
  35. Zhou, L.; He, H.; Sun, X.; Zhang, L.; Yu, G.; Ren, X.; Wang, J.; Zhao, F. Modeling winter wheat phenology and carbon dioxide fluxes at the ecosystem scale based on digital photography and eddy covariance data. Ecol. Inform. 2013, 18, 69–78. [Google Scholar] [CrossRef]
  36. Broge, N.H.; Leblanc, E. Comparing prediction power and stability of broadband and hyperspectral vegetation indices for estimation of green leaf area index and canopy chlorophyll density. Remote Sens. Environ. 2001, 76, 156–172. [Google Scholar] [CrossRef]
  37. Blackburn, G.A. Spectral indices for estimating photosynthetic pigment concentrations: A test using senescent tree leaves. Int. J. Remote Sens. 1998, 19, 657–675. [Google Scholar] [CrossRef]
  38. Hunt, E.R.; Cavigelli, M.; Daughtry, C.S.; Mcmurtrey, J.E.; Walthall, C.L. Evaluation of digital photography from model aircraft for remote sensing of crop biomass and nitrogen status. Precis. Agric. 2005, 6, 359–378. [Google Scholar] [CrossRef]
  39. Dash, J.; Curran, P.J.; Tallis, M.J.; Llewellyn, G.M.; Taylor, G.; Snoeij, P. Validating the MERIS Terrestrial Chlorophyll Index (MTCI) with ground chlorophyll content data at MERIS spatial resolution. Int. J. Remote Sens. 2010, 31, 5513–5532. [Google Scholar] [CrossRef]
  40. Hassan, M.A.; Yang, M.; Rasheed, A.; Jin, X.; Xia, X.; Xiao, Y.; He, Z. Time-series multispectral indices from unmanned aerial vehicle imagery reveal senescence rate in bread wheat. Remote Sens. 2018, 10, 809. [Google Scholar] [CrossRef]
  41. Zhou, M.; Zheng, H.; He, C.; Liu, P.; Awan, G.M.; Wang, X.; Cheng, T.; Zhu, Y.; Cao, W.; Yao, X. Wheat phenology detection with the methodology of classification based on the time-series UAV images. Field Crop. Res. 2023, 292, 108798. [Google Scholar] [CrossRef]
  42. Richardson, A.J.; Everitt, J.H. Using spectral vegetation indices to estimate rangeland productivity. Geocarto Int. 1992, 7, 63–69. [Google Scholar] [CrossRef]
  43. Chen, J.M. Evaluation of vegetation indices and a modified simple ratio for boreal applications. Can. J. Remote Sens. 1996, 22, 229–242. [Google Scholar] [CrossRef]
  44. Huete, A.R. A soil-adjusted vegetation index (SAVI). Remote Sens. Environ. 1988, 25, 295–309. [Google Scholar] [CrossRef]
  45. Yang, N.; Zhang, Z.; Zhang, J.; Guo, Y.; Yang, X.; Yu, G.; Bai, X.; Chen, J.; Chen, Y.; Shi, L. Improving estimation of maize leaf area index by combining of UAV-based multispectral and thermal infrared data: The potential of new texture index. Comput. Electron. Agric. 2023, 214, 108294. [Google Scholar] [CrossRef]
  46. Tian, Y.C.; Yao, X.; Yang, J.; Cao, W.X.; Hannaway, D.B.; Zhu, Y. Assessing newly developed and published vegetation indices for estimating rice leaf nitrogen concentration with ground-and space-based hyperspectral reflectance. Field Crop. Res. 2011, 120, 299–310. [Google Scholar] [CrossRef]
  47. Chappelle, E.W.; Kim, M.S.; McMurtrey III, J.E. Ratio analysis of reflectance spectra (RARS): An algorithm for the remote estimation of the concentrations of chlorophyll a, chlorophyll b, and carotenoids in soybean leaves. Remote Sens. Environ. 1992, 39, 239–247. [Google Scholar] [CrossRef]
  48. Herrmann, I.; Pimstein, A.; Karnieli, A.; Cohen, Y.; Alchanatis, V.; Bonfil, D.J. LAI assessment of wheat and potato crops by VENμS and Sentinel-2 bands. Remote Sens. Environ. 2011, 115, 2141–2151. [Google Scholar] [CrossRef]
  49. Yu, N.; Li, L.; Schmitz, N.; Tian, L.F.; Greenberg, J.A.; Diers, B.W. Development of methods to improve soybean yield estimation and predict plant maturity with an unmanned aerial vehicle based platform. Remote Sens. Environ. 2016, 187, 91–101. [Google Scholar] [CrossRef]
  50. Wu, Z.; Luo, J.; Rao, K.; Lin, H.; Song, X. Estimation of wheat kernel moisture content based on hyperspectral reflectance and satellite multispectral imagery. Int. J. Appl. Earth Obs. Geoinf. 2024, 126, 103597. [Google Scholar] [CrossRef]
  51. Sun, A.Y.; Wang, D.; Xu, X. Monthly streamflow forecasting using Gaussian process regression. J. Hydrol. 2014, 511, 72–81. [Google Scholar] [CrossRef]
  52. Duan, B.; Liu, Y.; Gong, Y.; Peng, Y.; Wu, X.; Zhu, R.; Fang, S. Remote estimation of rice LAI based on Fourier spectrum texture from UAV image. Plant Methods 2019, 15, 1–12. [Google Scholar] [CrossRef]
  53. Chen, X.; Li, F.; Shi, B.; Chang, Q. Estimation of Winter Wheat Plant Nitrogen Concentration from UAV Hyperspectral Remote Sensing Combined with Machine Learning Methods. Remote Sens. 2023, 15, 2831. [Google Scholar] [CrossRef]
  54. Carlson, T.N.; Ripley, D.A. On the relation between NDVI, fractional vegetation cover, and leaf area index. Remote Sens. Environ. 1997, 62, 241–252. [Google Scholar] [CrossRef]
  55. Zheng, H.; Li, W.; Jiang, J.; Liu, Y.; Cheng, T.; Tian, Y.; Zhu, Y.; Cao, W.; Zhang, Y.; Yao, X. A comparative assessment of different modeling algorithms for estimating leaf nitrogen content in winter wheat using multispectral images from an unmanned aerial vehicle. Remote Sens. 2018, 10, 2026. [Google Scholar] [CrossRef]
  56. Fan, Y.; Feng, H.; Yue, J.; Liu, Y.; Jin, X.; Xu, X.; Song, X.; Ma, Y.; Yang, G. Comparison of Different Dimensional Spectral Indices for Estimating Nitrogen Content of Potato Plants over Multiple Growth Periods. Remote Sens. 2023, 15, 602. [Google Scholar] [CrossRef]
  57. Jiang, J.; Johansen, K.; Stanschewski, C.S.; Wellman, G.; Mousa, M.A.; Fiene, G.M.; Asiry, K.A.; Tester, M.; McCabe, M.F. Phenotyping a diversity panel of quinoa using UAV-retrieved leaf area index, SPAD-based chlorophyll and a random forest approach. Precis. Agric. 2022, 23, 961–983. [Google Scholar] [CrossRef]
  58. Zhang, J.; Qiu, X.; Wu, Y.; Zhu, Y.; Cao, Q.; Liu, X.; Cao, W. Combining texture, color, and vegetation indices from fixed-wing UAS imagery to estimate wheat growth parameters using multivariate regression methods. Comput. Electron. Agric. 2021, 185, 106138. [Google Scholar] [CrossRef]
  59. Liu, Y.; Feng, H.; Yue, J.; Fan, Y.; Bian, M.; Ma, Y.; Jin, X.; Song, X.; Yang, G. Estimating potato above-ground biomass by using integrated unmanned aerial system-based optical, structural, and textural canopy measurements. Comput. Electron. Agric. 2023, 213, 108229. [Google Scholar] [CrossRef]
  60. Guo, Y.; Fu, Y.H.; Chen, S.; Bryant, C.R.; Li, X.; Senthilnath, J.; Sun, H.; Wang, S.; Wu, Z.; de Beurs, K. Integrating spectral and textural information for identifying the tasseling date of summer maize using UAV based RGB images. Int. J. Appl. Earth Obs. Geoinf. 2021, 102, 102435. [Google Scholar] [CrossRef]
  61. Liu, Y.; Liu, S.; Li, J.; Guo, X.; Wang, S.; Lu, J. Estimating biomass of winter oilseed rape using vegetation indices and texture metrics derived from UAV multispectral images. Comput. Electron. Agric. 2019, 166, 105026. [Google Scholar] [CrossRef]
  62. Tucker, C.J. Red and photographic infrared linear combinations for monitoring vegetation. Remote Sens. Environ. 1979, 8, 127–150. [Google Scholar] [CrossRef]
  63. Huete, A.R.; Jackson, R.D.; Post, D.F. Spectral response of a plant canopy with different soil backgrounds. Remote Sens. Environ. 1985, 17, 37–53. [Google Scholar] [CrossRef]
  64. Sarker, L.R.; Nichol, J.E. Improved forest biomass estimates using ALOS AVNIR-2 texture indices. Remote Sens. Environ. 2011, 115, 968–977. [Google Scholar] [CrossRef]
  65. Zhang, X.; Zhang, K.; Sun, Y.; Zhao, Y.; Zhuang, H.; Ban, W.; Chen, Y.; Fu, E.; Chen, S.; Liu, J. Combining spectral and texture features of UAS-based multispectral images for maize leaf area index estimation. Remote Sens. 2022, 14, 331. [Google Scholar] [CrossRef]
  66. Shu, M.; Fei, S.; Zhang, B.; Yang, X.; Guo, Y.; Li, B.; Ma, Y. Application of UAV multisensor data and ensemble approach for high-throughput estimation of maize phenotyping traits. Plant Phenomics 2022. [Google Scholar] [CrossRef]
  67. Zhou, L.; Meng, R.; Yu, X.; Liao, Y.; Huang, Z.; Lü, Z.; Xu, B.; Yang, G.; Peng, S.; Xu, L. Improved Yield Prediction of Ratoon Rice Using Unmanned Aerial Vehicle-Based Multi-Temporal Feature Method. Rice Sci. 2023, 30, 247–256. [Google Scholar] [CrossRef]
  68. Guan, S.; Fukami, K.; Matsunaka, H.; Okami, M.; Tanaka, R.; Nakano, H.; Sakai, T.; Nakano, K.; Ohdan, H.; Takahashi, K. Assessing correlation of high-resolution NDVI with fertilizer application level and yield of rice and wheat crops using small UAVs. Remote Sens. 2019, 11, 112. [Google Scholar] [CrossRef]
  69. Meggio, F.; Zarco-Tejada, P.J.; Miller, J.R.; Martín, P.; González, M.R.; Berjón, A. Row orientation and viewing geometry effects on row-structured vine crops for chlorophyll content estimation. Can. J. Remote Sens. 2008, 34, 220–234. [Google Scholar] [CrossRef]
  70. Li, D.; Chen, J.M.; Zhang, X.; Yan, Y.; Zhu, J.; Zheng, H.; Zhou, K.; Yao, X.; Tian, Y.; Zhu, Y. Improved estimation of leaf chlorophyll content of row crops from canopy reflectance spectra through minimizing canopy structural effects and optimizing off-noon observation time. Remote Sens. Environ. 2020, 248, 111985. [Google Scholar] [CrossRef]
  71. Li, R.; Wang, D.; Zhu, B.; Liu, T.; Sun, C.; Zhang, Z. Estimation of nitrogen content in wheat using indices derived from RGB and thermal infrared imaging. Field Crop. Res. 2022, 289, 108735. [Google Scholar] [CrossRef]
  72. Duan, B.; Fang, S.; Gong, Y.; Peng, Y.; Wu, X.; Zhu, R. Remote estimation of grain yield based on UAV data in different rice cultivars under contrasting climatic zone. Field Crop. Res. 2021, 267, 108148. [Google Scholar] [CrossRef]
  73. Liu, Y.; Feng, H.; Yue, J.; Jin, X.; Li, Z.; Yang, G. Estimation of potato above-ground biomass based on unmanned aerial vehicle red-green-blue images with different texture features and crop height. Front. Plant Sci. 2022, 13, 938216. [Google Scholar] [CrossRef] [PubMed]
  74. Wu, Q.; Zhang, Y.; Zhao, Z.; Xie, M.; Hou, D. Estimation of Relative Chlorophyll Content in Spring Wheat Based on Multi-Temporal UAV Remote Sensing. Agronomy 2023, 13, 211. [Google Scholar] [CrossRef]
  75. Yin, Q.; Zhang, Y.; Li, W.; Wang, J.; Wang, W.; Ahmad, I.; Zhou, G.; Huo, Z. Estimation of Winter Wheat SPAD Values Based on UAV Multispectral Remote Sensing. Remote Sens. 2023, 15, 3595. [Google Scholar] [CrossRef]
  76. Xiong, J.; Lin, C.; Cao, Z.; Hu, M.; Xue, K.; Chen, X.; Ma, R. Development of remote sensing algorithm for total phosphorus concentration in eutrophic lakes: Conventional or machine learning? Water Res. 2022, 215, 118213. [Google Scholar] [CrossRef] [PubMed]
  77. Liu, J.; Zhu, Y.; Tao, X.; Chen, X.; Li, X. Rapid prediction of winter wheat yield and nitrogen use efficiency using consumer-grade unmanned aerial vehicles multispectral imagery. Front. Plant Sci. 2022, 13, 1032170. [Google Scholar] [CrossRef] [PubMed]
  78. Xu, T.; Wang, F.; Shi, Z.; Xie, L.; Yao, X. Dynamic estimation of rice aboveground biomass based on spectral and spatial information extracted from hyperspectral remote sensing images at different combinations of growth stages. ISPRS-J. Photogramm. Remote Sens. 2023, 202, 169–183. [Google Scholar] [CrossRef]
  79. Metz, M.; Abdelghafour, F.; Roger, J.; Lesnoff, M. A novel robust PLS regression method inspired from boosting principles: RoBoost-PLSR. Anal. Chim. Acta. 2021, 1179, 338823. [Google Scholar] [CrossRef] [PubMed]
  80. Li, Z.; Chen, Z.; Cheng, Q.; Duan, F.; Sui, R.; Huang, X.; Xu, H. UAV-based hyperspectral and ensemble machine learning for predicting yield in winter wheat. Agronomy 2022, 12, 202. [Google Scholar] [CrossRef]
  81. Pan, Y.; Zeng, X.; Xu, H.; Sun, Y.; Wang, D.; Wu, J. Evaluation of Gaussian process regression kernel functions for improving groundwater prediction. J. Hydrol. 2021, 603, 126960. [Google Scholar] [CrossRef]
  82. Yu, J.; Wang, J.; Leblon, B.; Song, Y. Nitrogen estimation for wheat using UAV-based and satellite multispectral imagery, topographic metrics, leaf area index, plant height, soil moisture, and machine learning methods. Nitrogen 2021, 3, 1–25. [Google Scholar] [CrossRef]
  83. Xie, J.; Wang, J.; Chen, Y.; Gao, P.; Yin, H.; Chen, S.; Sun, D.; Wang, W.; Mo, H.; Shen, J. Estimating the SPAD of Litchi in the Growth Period and Autumn Shoot Period Based on UAV Multi-Spectrum. Remote Sens. 2023, 15, 5767. [Google Scholar] [CrossRef]
  84. Zhu, W.; Feng, Z.; Dai, S.; Zhang, P.; Wei, X. Using UAV multispectral remote sensing with appropriate spatial resolution and machine learning to monitor wheat scab. Agriculture 2022, 12, 1785. [Google Scholar] [CrossRef]
  85. Camps-Valls, G.; Bruzzone, L.; Rojo-Álvarez, J.L.; Melgani, F. Robust support vector regression for biophysical variable estimation from remotely sensed images. IEEE Geosci. Remote Sens. Lett. 2006, 3, 339–343. [Google Scholar] [CrossRef]
  86. Xu, X.; Fan, L.; Li, Z.; Meng, Y.; Feng, H.; Yang, H.; Xu, B. Estimating leaf nitrogen content in corn based on information fusion of multiple-sensor imagery from UAV. Remote Sens. 2021, 13, 340. [Google Scholar] [CrossRef]
Figure 1. Study location and field experimental layout.
Agronomy 14 01052 g001
Figure 2. UAV (a), plates that correct 5%, 10%, 20%, and 40% reflectivity of calibrate differences (b).
Agronomy 14 01052 g002
Figure 3. Flow chart of wheat LNC estimation modelling method.
Agronomy 14 01052 g003
Figure 4. Description of LNC for different growth stages of winter wheat, where J–LF stands for Jointing, Booting, Early filling, and Late filling.
Agronomy 14 01052 g004
Figure 5. Correlation between LNC and VIs across multiple growth stages. (a) Variation in correlation at four growth stages. (b) Correlation analysis results across multiple growth stages. *** indicates p < 0.001, ** indicates p < 0.01, and * indicates p < 0.05.
Agronomy 14 01052 g005
Figure 6. Correlation analysis results between SFCIs and LNC. SFCID (af), SFCIT (gl).
Agronomy 14 01052 g006
Figure 7. Correlation analysis of Tm with LNC across multiple growth stages.
Agronomy 14 01052 g007
Figure 8. Correlation analysis results between TFCIs and LNC. TFCID (af), TFCIT (gl).
Agronomy 14 01052 g008
Figure 9. Scatter plot of fit for winter wheat LNC estimation model based on spectral and textural information.
Agronomy 14 01052 g009
Figure 10. Feature importance of the optimal estimation model for LNC across multiple growth stages.
Agronomy 14 01052 g010
Figure 11. Importance of feature types in the optimal estimation model for LNC across multiple growth stages.
Agronomy 14 01052 g011
Figure 12. Scatter plot fit of MVI and NDVI against wheat LNC across multiple growth stages: (a) MVI-LNC, (b) NDVI-LNC.
Agronomy 14 01052 g012
Table 1. Detailed information regarding the winter wheat field trial and sampling times.
Growing SeasonVarietyN Treatments (kg/ha)Sampling Stage
Exp. 1
2021
V1: Huaimai 44
V2: Yannong 999
V3: Ningmai 13
N0 (0)
N1 (100)
N2 (200)
N3 (300)
Jointing (J, 14 March)
Booting (B, 8 April)
Early filling (EF, 9 May)
Late filling (LF, 24 May)
Exp. 1
2022
V1: Huaimai 44
V2: Yannong 999
V3: Ningmai 13
N0 (0)
N1 (100)
N2 (200)
N3 (300)
Jointing (J, 16 March)
Booting (B, 10 April)
Early filling (EF, 5 May)
Late filling (LF, 21 May)
Table 2. Vegetation indices used in this paper.
NameAbbreviationsFormulationReferences
Normalized Difference Vegetation IndexNDVI(NIR − R)/(NIR + R)[27]
Coloration IndexCI(R − B)/R[32]
Normalized Pigment Chlorophyll ratio IndexNPCI(R − B)/(R + B)[33]
Green Chlorophyll Vegetation IndexGCVINIR/G − 1[34]
Greenness IndexGIG/R[35]
Triangular Vegetation IndexTVI0.5 × (120 × (RE − G) − 200 × (R − G))[36]
Plant Senescence Reflectance IndexPSRI(R − G)/RE[37]
Blue Red pigment IndexBRIB/R[38]
MERIS Terrestrial Chlorophyll IndexMTCI(NIR − RE)/(RE − R)[39]
Normalized Difference Red-Edge IndexNDREI(RE − G)/(RE + G)[40]
Table 3. Texture metrics extracted based on the GLCM method.
NumberingAbbreviationTmFormulationDescription
1MeaMean i = 0 N 1 j = 0 N 1 i × p i , j The mean value in the texture
2VarVariance i j i u 2 p i , j The size of the texture change
3HomHomogeneity i j 1 1 + i j 2 p i , j The homogeneity of grey level in the texture
4ConContrast n = 0 N g 1 n 2 i = 1 N g j = 1 N g p i , j | i j | = n The clarity in the texture
Same as contrast
5DisDissimilarity n = 1 N g 1 n i = 1 N g j = 1 N g p i , j | i j | = n The similarity of the pixels in the texture
6EntEntropy i j p i , j log p i , j The diversity of the pixels in the texture
7SemSecond moment i j p i , j 2 The uniformity of greyscale in
the texture
8CorCorrelation i j i , j p i , j μ i μ j σ i σ j The consistency in the texture
Note: The parameters ui, uj, σi, and σj represent the average and standard deviation of the row and column sums of the GLCM, i and j represent the row and column indices, respectively, while p denotes a matrix. p(i, j) signifies the ratio of the value at the corresponding row and column in the matrix to the sum of all values within the matrix.
Table 4. Formulation and basis used for constructing feature combination indices (FCIs) in this study.
TypeAbbreviationFormulationReferences
Spectral feature combination indices (SFCIs)
Texture feature combination indices (TFCIs)
SFCID 1
TFCID 1
(λ1 − λ2)/(λ1 + λ2)[27]
SFCID 2
TFCID 2
λ1 − λ2[42]
SFCID 3
TFCID 3
λ1/λ2[28]
SFCID 4
TFCID 4
(λ1 × λ1 − λ2)/(λ1 × λ1 + λ2)[43]
SFCID 5
TFCID 5
(λ1 − λ2)/λ1[32]
SFCID 6
TFCID 6
1.5 × (λ1 − λ2)/(λ1 + λ2 + 0.5)[44]
SFCIT 1
TFCIT 1
(λ1 − λ2)/(λ2 + λ3)[45]
SFCIT 2
TFCIT 2
λ1/(λ2 + λ3)[46]
SFCIT 3
TFCIT 3
λ1/(λ2 × λ3)[47]
SFCIT 4
TFCIT 4
(λ1 × λ2)/λ3[45]
SFCIT 5
TFCIT 5
(λ1 + λ2)/λ3[45]
SFCIT 6
TFCIT 6
(λ1 − λ2)/(λ2 − λ3)[39]
Note: SFCID is a SFCI composed of two spectral bands, while SFCIT is a SFCI constructed from three spectral bands. Similarly, TFCID is a TFCI composed of two texture metrics, and TFCIT is a TFCI constructed from three texture metrics.
Table 5. Model validation statistics for estimating LNC across multiple growth stages of winter wheat using spectral information.
Data TypeNumberMetricsPLSRRFRSVRGPR
VIs6R20.5300.6990.6410.528
RMSE (%)0.8730.7060.7620.875
RPD1.4591.8031.6701.455
SFCID6R20.4460.5360.5380.461
RMSE (%)0.9620.8700.8690.938
RPD1.3241.4631.4651.357
SFCIT6R20.6610.6940.6680.655
RMSE (%)0.7440.7040.7370.748
RPD1.7111.8081.7271.702
VIS SFCID SFCIT18R20.6710.7380.6960.682
RMSE (%)0.7330.6530.7030.721
RPD1.7371.9521.8131.768
Note: VIs represent Vegetation Indices, SFCID are SFCIs composed of two spectral bands, and SFCIT are SFCIs composed of three spectral bands.
Table 6. Model validation statistics for estimating LNC across multiple growth stages of winter wheat using texture information.
Data TypeNumberMetricsPLSRRFRSVRGPR
Tm6R20.3500.3190.3910.355
RMSE (%)1.0351.0541.0061.030
RPD1.2301.2081.2661.237
TFCID6R20.5560.5420.5600.556
RMSE (%)0.8540.8740.8640.852
RPD1.4921.4571.4741.495
TFCIT6R20.5790.6220.6260.591
RMSE (%)0.8280.7830.7850.816
RPD1.5371.6271.6211.561
Tm TFCID TFCIT18R20.6450.6590.6880.679
RMSE (%)0.7610.7440.7140.722
RPD1.6751.7111.7831.763
Note: Tm represents texture metrics, TFCID are TFCIs composed of two texture metrics, and TFCIT are TFCIs composed of three texture metrics.
Table 7. Performance evaluation of winter wheat estimation models based on combination of spectral information and texture information.
Data TypeNumberMetricsPLSRRFRSVRGPR
Spectral information
(VIs SFCID SFCIT)
18R20.6710.7380.6960.682
RMSE (%)0.7330.6530.7030.721
RPD1.7371.9521.8131.768
Texture information
(Tm TFCID TFCIT)
18R20.6450.6590.6880.679
RMSE (%)0.7610.7440.7140.722
RPD1.6751.7111.7831.763
Spectral and texture information36R20.7470.7830.7860.775
RMSE (%)0.6380.5960.5890.604
RPD1.9952.1392.1622.108
Disclaimer/Publisher’s Note: The statements, opinions and data contained in all publications are solely those of the individual author(s) and contributor(s) and not of MDPI and/or the editor(s). MDPI and/or the editor(s) disclaim responsibility for any injury to people or property resulting from any ideas, methods, instructions or products referred to in the content.

