Article

Modeling of Water, Heat, and Nitrogen Dynamics in Summer Maize under Broad Furrow Irrigation and the Mechanism of Enzyme Activity Response

1
School of Water Conservancy, North China University of Water Resources and Electric Power, Zhengzhou 450046, China
2
Collaborative Innovation Center for the Efficient Utilization of Water Resources, Zhengzhou 450046, China
*
Author to whom correspondence should be addressed.
Agronomy 2024, 14(5), 1044; https://doi.org/10.3390/agronomy14051044
Submission received: 4 April 2024 / Revised: 8 May 2024 / Accepted: 10 May 2024 / Published: 14 May 2024
(This article belongs to the Section Water Use and Irrigation)

Abstract

:
This study explores the impact of water and nitrogen management on the dynamics of water, heat, and nitrogen in farmland soil. It also explores the correlations soil factors, enzyme activity, and crop yield. To achieve this, field experiments and HYDRUS model simulations were conducted in the broad furrow irrigation system of the Yinhuang Irrigation Area. The experiment involved three irrigation levels (60%, 70%, and 80% of field water holding capacity, labeled as W1, W2, and W3, respectively) and three nitrogen application rates (120, 220, and 320 kg·ha−1, labeled as N1, N2, and N3). Results indicated that the HYDRUS model, optimized using field trial data, accurately represented soil dynamics. Soil profile water and nitrogen exhibited greater variation in the root zone (0–40 cm) than in the deeper layers (40–100 cm). Water–nitrogen coupling predominantly influenced water and nitrogen content changes in the soil, with minimal effect on soil temperature. Soil enzyme activities at the trumpet, silking, and maturity stages were significantly affected by water–nitrogen coupling, displaying an initial increase and subsequent decrease over the reproductive period. The highest summer maize yield, reaching 10,928.52 kg·ha−1 under the W2N2 treatment, was 46.64% higher than that under the W1N1 treatment. The redundancy analysis revealed a significant positive correlation between soil nitrate nitrogen content and soil enzyme activity (p < 0.05). Furthermore, there was a significant positive correlation between soil enzyme activity and both maize yields (p < 0.01). This underscores that appropriate water and nitrogen management can effectively enhance yield while improving the soil environment. These findings offer valuable insights for achieving high yields of summer maize in the Yellow River Basin.

1. Introduction

Maize, a pivotal food, feed, and industrial resource, stands as China’s foremost crop. Its cultivation is integral to the country’s agricultural stability and food security [1]. In the Yellow River Basin, a key summer maize region, soil nitrogen contamination [2] and diminished crop economic efficiency impede sustainable agricultural advancement [3,4]. The dual objectives of improving yield and economic gain, underpinned by efficient water and nitrogen utilization, are vital for the sustainable progression of the region’s summer maize industry.
Optimal water and nitrogen management can markedly elevate maize yields [5,6]. Maintaining suitable soil water levels enhances the root zone environment, bolstering root growth and maize yield. Conversely, overuse of nitrogen fertilizer disrupts crop nutrient balance, reducing yields [7]. Additionally, water and nitrogen stress influence crop consumption, growth, and soil enzyme activities in the root zone, while canopy development affects energy distribution, water–heat dynamics, and root water absorption. Soil enzymes, primarily from root exudates and microbial activity, are key in organic matter decomposition and nutrient cycling, reflecting soil health in response to water and nitrogen management [8].
Soil enzymes, as some of the most active organic components in soil, are active polymer substances with biocatalytic capabilities and a protein nature [9]. They serve as crucial biological indicators for assessing soil fertility by reflecting the soil’s capacity to convert nutrients such as nitrogen and phosphorus [10]. For example, soil catalase breaks down organic matter to produce water and oxygen, enhancing the redox reaction in soil. This process improves the availability of nitrogen, phosphorus, potassium, and other elements, facilitating nutrient absorption by crops and potentially increasing crop yield [11]. Soil sucrase, a hydrolytic enzyme, catalyzes the conversion of sucrose into monosaccharides, which are then available for absorption by organisms. The enzymatic products of soil sucrase activity are closely linked to soil nutrient content (e.g., organic matter, nitrogen, and phosphorus), microbial population, and soil respiration intensity [12]. Additionally, urease plays a key role in the conversion of urea to nitrogen, which is available for plant uptake [13].
Previous research has demonstrated that soil enzyme activities are responsive to variations in nitrogen levels. For instance, Ren et al. [14] observed maximum urease and phosphatase activities at a nitrogen application of 165 kg·ha−1, whereas Mi et al. [15] found that excess irrigation attenuated urease activity. Xiao et al. [16] noted that increased nitrogen application elevated soil urease activity but led to a rise and subsequent fall in catalase and phosphatase activities. These findings underscore the complexity of managing nitrogen levels for optimal crop and soil health.
Traditional field experiments, with their prolonged duration and susceptibility to various factors, often fall short of comprehensively depicting the interplay between soil hydrothermal conditions and water–nitrogen management. Thus, integrating experiments with modeling approaches becomes imperative. Wang et al. [17] employed the water heat carbon and nitrogen simulator (WHCNS) model for simulating soil water–heat–salt dynamics in irrigated farmland. Su et al. [18] utilized COMSOL Multiphysics 6.2 software to develop a coupled soil water–heat–oxygen model for storage and pit irrigation. Wang et al. [19] used the HYDRUS model to analyze water–salt dynamics across dunes and adjacent barren lands over time. Notably, HYDRUS facilitates one-dimensional, two-dimensional, and three-dimensional soil hydrothermal coupling models [20]. Tamás et al. [21] developed a three-dimensional hydrodynamic model within the HYDRUS environment to facilitate the modeling of temporal and spatial variations in the water balance (WB) at a maize cultivation site in Hungary. Abdullah et al. [22] calibrated and validated the two-dimensional numerical model, HYDRUS-2D, to simulate water flow, nitrogen transport, and distribution at the Mahdasht maize farm in Iran. Farshad et al. [23] employed the HYDRUS-2D model to investigate water movement and nutrient transport in maize subsurface drip irrigation (SDI) roots under various irrigation and fertilizer management practices. Additionally, Nasrin et al. [24] assessed the effectiveness of a convolutional neural network (CNN) in modeling nitrate uptake in maize and estimating nitrate loss from surface drip irrigation across three different textured soils, using a CNN trained on the output from the HYDRUS-2D simulation model.
In summary, current research utilizing the HYDRUS model predominantly focuses on the dynamics of water, nitrogen, and salt, yet there is limited exploration into the development of numerical models that address hydrothermal nitrogen movements under varying water–nitrogen regimes in the Yellow River Basin. Consequently, this study explores the integration of minimal irrigation and nitrogen application thresholds. It involves nine distinct water and nitrogen application systems, through which comparative field experiments on summer maize are conducted. Building on field measurement data, a HYDRUS model of water movement, nitrogen transport, and heat transfer is constructed. This model is used to investigate the effects of water and nitrogen coupling on soil water, heat, and nitrogen transport, as well as enzyme activity under broad furrow irrigation. Based on the results of redundancy analysis, the effects of soil environmental factors on summer maize yield were elucidated. The findings aim to propose an optimal water and nitrogen management system for summer maize in the Yellow River Basin, providing essential technical references to ensure crop yield in this key production region.

2. Materials and Methods

2.1. Overview and Soil Characteristics of the Study Area

The field study was conducted from June to September in both 2021 and 2022 at the Laboratory of Efficient Water Use in Agriculture, North China University of Water Resources and Hydropower (113°46′56.27138″, 34°47′2.43629″). The site has an annual average precipitation of 624.3 mm and average air temperature of 14.5 °C. The experimental area’s groundwater depth exceeds 15 m. The top 100 cm of soil is stratified into five layers, with their basic physical properties detailed in Table 1.

2.2. Experimental Design

This study utilized Zhengdan 958, a summer maize variety, for field testing. The sowing and maturity dates varied over two years: sown on 8 June 2022, with harvest on September 17, and sown on 10 June 2023, with harvest on September 19. The experimental layout adopted a split-zone design comprising two primary factors: irrigation limits and nitrogen application levels. The main zone focused on irrigation, establishing three thresholds based on soil water holding capacity: 60% (W1), 70% (W2), and 80% (W3). The sub-zone pertained to nitrogen levels, categorized into low (120 kg·ha−1, N1), medium (220 kg·ha−1, N2), and high (320 kg·ha−1, N3) nitrogen applications. For fertilization, a compound fertilizer (N-15, P-15, K-15) served as the base, complemented by urea with a 46% nitrogen mass fraction for topdressing, and 1 group was set up for blank control treatment. Maize was manually sown with a row spacing of 50 cm and a plant spacing of 30 cm. The specific arrangements of these treatments are detailed in Table 2. Three replicates were established for each treatment and arranged randomly. The phenological periods of summer maize were categorized based on the distinct characteristics observed for each period in the field. A phenological period was considered reached when 50% of the maize exhibited the corresponding traits. Details of these phenological divisions are provided in Table 3. Meteorological data recorded during the experimental period are presented in Figure 1. Additionally, the field was equipped with drainage ditches to facilitate water removal.

2.3. Measurement Items and Methods

2.3.1. Soil Water Content

Soil water content was periodically measured at 7-day intervals during the reproductive stage of summer maize. Time domain reflectometry (TDR, TRIME-PICO IPH 2, IMKO, Ettlingen, Germany) was employed for this purpose on soil samples that were rate-dried. Measurements were conducted across five layers, each 20 cm thick.

2.3.2. Soil Temperature

Temperature monitoring probes (5TE probe, Decagon, Mansfield, TX, USA) were installed in vertical profiles at the center of each plot. These probes were positioned at depths of 10, 30, 50, 70, and 90 cm and connected to an EM50 data collector (Decagon, Mansfield, TX, USA). This setup facilitated the collection of average soil temperature data for the following soil horizons: 0–20, 20–40, 40–60, 60–80, and 80–100 cm, with data recorded every 30 min.

2.3.3. Soil Ammonium Nitrogen and Nitrate Nitrogen Contents

At each growth stage of summer maize, soil samples were collected using a soil auger from five layers (each 20 cm deep). The samples were leached with a 1 mol/L KCL solution, and the resulting leachate was analyzed for ammonium and nitrate nitrogen contents using a UV (SP-723, Shanghai Spectrum Instrument Co, Shanghai, China) spectrophotometer.

2.3.4. Soil Enzyme Activities

During the maize’s reproductive periods, soil samples (0–20 cm depth) from each treatment plot were collected to assess soil enzyme activities. Urease activity was determined using the phenol sodium hypochlorite colorimetric method, catalase by the potassium permanganate titrimetric method, and sucrase via the 3,5-dinitrosalicylic acid colorimetric method [25].

2.3.5. Summer Maize Yield and Components

Upon maturation of the summer maize, ten plants per plot were randomly selected for yield analysis. Parameters such as ear length, ear thickness, and thousand grain weight were measured. The total mass was weighed post-drying, and the yield per unit area was subsequently calculated.

2.4. Model Construction

HYDRUS is a Microsoft Windows-based modeling environment for the analysis of water flow and solute transport in variably saturated porous media. The software package includes computational finite element models for simulating the one-, two-, and three-dimensional movement of water, heat, and multiple solutes in variably saturated media. The model includes a parameter optimization algorithm for inverse estimation of a variety of soil hydraulic and/or solute transport parameters (only for the standard modules). The model is supported by an interactive graphics-based interface for data preprocessing, generation of structured and unstructured finite element mesh, and graphic presentation of the results.

2.4.1. Governing Equation

This study’s model incorporates equations for water and nitrogen transport under broad furrow irrigation. Water transport is based on the unsaturated soil water movement equation. Soil hydraulic conductivity, K(θ), is calculated using the van Genuchten–Mualem (VG-M) model [26].
θ t = x [ D ( θ ) θ x ] + z [ D ( θ ) θ z ] + K ( θ ) z S ( x , z , h )
K ( θ ) = { K s S e l [ 1 ( 1 S e 1 / m ) m ] 2 h < 0 K s h 0
S e = { θ θ r θ s θ r = l ( 1 + | α h | n ) m h < 0 1 h 0
where Ks is the soil saturated hydraulic conductivity, cm/min; α is the reciprocal of the air-entry suction value, /cm; m and n are shape coefficients, with m = 1 − 1/n; l is the soil hydraulic characteristic curve fitting coefficient, 0.5; and c is the mass concentration of soil solution, g/cm3.
The convection–dispersion governing partial differential equations for unsaturated nitrogen transport and transformation in summer maize are as follows [27]:
Urea nitrogen:
( θ · C u r e a ) t = x ( θ D xx C u r e a x x + θ D xz C u r e a z ) + 1 x ( θ D xx C u r e a x x + θ D xz C u r e a z ) + z ( θ D xx C u r e a x x + θ D xz C u r e a z ) ( q x C u r e a x + q x C u r e a x + q z C u r e a z ) μ w , u r e a θ C u r e a  
Ammonium nitrogen:
( θ C N H 4 + ) t + ρ s N H 4 + t = x ( θ D x x C N H 4 + x + θ D x z C N H 4 + z ) + 1 x ( θ D x x C N H 4 + x + θ D x z C N H 4 + z ) + z ( θ D z z C N H 4 + x + θ D x z C N H 4 + z ) ( q C N H 4 + x + q C N H 4 + x + q C N H 4 + z ) + μ w , u r e a θ C u r e a ( μ w , N H 4 + θ C N H 4 + + μ s , N H 4 + ρ S N H 4 + ) μ w , N H 4 + θ C N H 4 + + γ w , N H 4 + θ + γ s , N H 4 + ρ S C N H 4 +
Nitrate nitrogen:
( θ C N O 3 ) t = x i ( θ D x x C N O 3 x + θ D x z C N O 3 z ) + 1 x ( θ D x x C N O 3 x + θ D x z C N O 3 z ) + z ( θ D x x C N O 3 x + θ D x z C N O 3 z ) ( q C N O 3 x + q C N O 3 x + q C N O 3 z ) + ( μ w , N H 4 + θ C N H 4 + + μ s , N H 4 + ρ S N H 4 + ) ( μ w , N O 3 + μ s , N O 3 ) θ C N O 3 S C N O 3
Note: μ w , u r e a is the first-order kinetic reaction coefficient for urea hydrolysis, /d; μ w , N H 4 + is the liquid phase first-order kinetic reaction coefficient for ammonium nitrogen, /d; μ w , N H 4 + and μ s , N H 4 + are, respectively, the second-order kinetic reaction coefficients of ammonium nitrogen liquid and solid phases involved in nitrogen nitrification, /d; γ w , N H 4 + are, respectively, the zero-order kinetic reaction coefficients of nitrogen transformation (mineralization reaction and biological immobilization), /d; and μ w , N O 3 and μ s , N O 3 are, respectively, the denitrification reaction coefficients of liquid and solid nitrate nitrogen (a first-order reaction).
The water uptake by summer maize is represented through the Feddes model [28].
S ( x , z , h ) = α ( x , z , h ) b ( x , z ) T P L
where α(x,z,h) is the dimensionless water stress response function of root water uptake; b(x, z) is the root water uptake distribution function (L/d); TP is crop potential transpiration rate, cm/d; and L is the maximum width of root zone distribution.
The reference crop evapotranspiration (ET0) is calculated using the Penman–Monteith equation, reliant on meteorological data from proximate weather stations in the experimental vicinity. Then, the PET of the crop is subsequently calculated using the single crop coefficient method, followed by using the Beer’s law to separate the potential evaporation and potential transpiration components [29].
For soil heat transport, the heat conduction equation is utilized [30,31].
C ρ ( θ ) T t = 1 r r [ r λ r z ( θ ) T z ] + z [ λ r z ( θ ) T x ] C w q x T z
where Cρ(θ) is the volumetric heat capacity of soil solid phase, J/(g·°C); Cw indicates the volumetric heat capacity of soil liquid phase, J/(g·°C); T represents the soil temperature, °C; λxz stands for the soil thermal conductivity, cm; and qx symbolizes the soil water heat flux, cm.
The equation assumes the negligible influence of gaseous water diffusion in the soil. The volumetric heat capacity of the soil’s solid phase is expressed as follows:
C p ( θ ) = ( 1 . 92 θ n + 2.51 θ o + 4.18 θ ) × 10 6
where θn is the volume fraction of solid phase in soil, cm3/cm3; θ0 indicates the volume fraction of organic matter in soil, cm3/cm3; and θ represents the volumetric water content of soil, cm3/cm3. Additionally, the soil’s thermal conductivity, a function of its water content, is defined as follows:
λ ( θ ) = b 1 + b 2 θ + b 3 θ 0.3
where b1, b2, and b3 are regression parameters for various soil thermal properties.

2.4.2. Model Parameter

The model parameters were derived from field measurements conducted in 2022, encompassing soil water content, ammonium nitrogen, nitrate nitrogen, and temperature in summer maize treatments. Utilizing the HYDRUS inversion module, this study extrapolated parameters pertinent to soil hydraulic properties, solute transport, and soil thermal properties. These parameters are elaborated in Table 4, Table 5 and Table 6.

2.4.3. Initial and Boundary Conditions

  • Initial conditions
It is assumed that the initial soil water, nitrogen content, and temperature are uniformly distributed across the study area. The initial conditions are formally expressed as follows:
θ ( r , z , t ) = θ k ( 0 r L , 0 z H , t = 0 )
c ( r , z , t ) = c k ( 0 r L , 0 z H , t = 0 )
T ( r , z , t ) = T k ( 0 r L , 0 z H , t = 0 )
where θk is the soil initial volumetric water content, cm3/cm3; ck denotes the soil initial nitrate nitrogen (ammonium nitrogen) content, mg/cm3; Tk represents the soil initial temperature, 20 °C; r indicates the radial coordinate, cm; z is the vertical coordinate and specified as positive downward, cm; L symbolizes the horizontal distance of the simulation area, 0 ≤ L ≤ 75 cm; and H signifies the soil depth, the depth of the simulation calculation area, 0 ≤ H ≤ 100 cm.
2.
Boundary conditions
The geometric structure and boundary conditions of the model are illustrated in Figure 2.
{ K ( h ) h z K ( h ) = σ ( t ) ( 0 x w , z = 100 , 0 < t < T ) ( θ D x x c 1 x + θ D x z c 1 x ) + q x c 1 = q x c a ( 0 x w , z = 100 , 0 < t < T ) ( θ D z z c 1 z + θ D x z c 1 x ) + q z c 1 = q x c a ( 0 x w , z = 100 , 0 < t < T )
where ca is urea nitrogen mass concentration of the fertilizer solution, mg/m3; T is time of water flow recession in the furrow, h; σ(t) is the constant flow boundary flux at irrigation points during irrigation, 3 cm/d. For the model area, the lateral (left and right) boundaries were designated as zero flux boundaries, indicating no movement of substances across these borders. The lower boundary was set as a free drainage boundary, allowing for the natural movement of water and solutes.

3. Results

3.1. Model Validation

Model validation was conducted using the 2023 field experiment data, particularly from W1N1, W2N2, and W3N3 treatments. The comparison between measured and simulated values for soil water content, ammonium nitrogen, nitrate nitrogen, and temperature at various depths during the maize’s reproductive stage is depicted in Figure 3. Despite modifications in soil hydraulic, solute transport, and thermal property parameters, the model maintained high accuracy.
Table 7 presents an error analysis of the model, demonstrating a coefficient of determination above 0.7 for each index, and indicating low mean absolute error (MAE) and root mean square error (RMSE) levels. The order of agreement between simulated and measured values was water content > nitrate nitrogen > ammonium nitrogen > temperature.

3.2. Distribution Patterns and Modeling of Hydrothermal Nitrogen in Soil Profiles

3.2.1. Soil Profile’s Water Distribution Pattern

Maintaining the same lower limit of irrigation, the increase in nitrogen application did not significantly alter the soil profile’s water distribution; thus, analyses focused on treatments W1N1, W2N2, and W3N3 for brevity. Figure 4 illustrates that various factors, including crop root uptake, ground evaporation, furrow irrigation, precipitation during the reproductive period, and soil structure differences, influenced water distribution in the surface soil layer (0–40 cm). Conversely, the water content at depths of 40–100 cm remained largely unaffected by rainfall and irrigation. An increase in the lower limit of irrigation was associated with a rise in peak soil water content; notably, the W3N3 treatment exhibited an increase of 5.77% (0.02cm3·cm−3) compared to the W1N1 treatment. During the transition from the milk stage to physiological maturity in summer maize, deeper soil layers (80–100 cm) consistently retained higher water content than surface layers (0–20 cm).

3.2.2. Characteristics of Ammonium Nitrogen Distribution in Soil Profiles

Figure 5 presents the vertical distribution of ammonium nitrogen across the 0–100 cm soil profile for each treatment during the summer maize’s reproductive period. This figure reveals a predominant concentration of ammonium nitrogen within the top 40 cm of soil, with minimal impact from irrigation and fertilization on the 40–100 cm depth range. Following the second fertilization, W1N3 treatment showed a 25.75% increase in the ammonium nitrogen distribution range compared to W1N2. The peak ammonium nitrogen concentration in the W3N3 treatment reached 1.287 mg·cm−3. The soil’s ammonium nitrogen profile was notably influenced by factors like the lower limit of irrigation, timing, and amount of nitrogen fertilizer. Ammonium nitrogen concentration reached its maximum five days post-urea application.

3.2.3. Characteristics of Nitrate Nitrogen Distribution in Soil Profiles

Figure 6 illustrates the vertical distribution of nitrate nitrogen in the 0–100 cm soil profile for each treatment during the summer maize growth period. Notably, distinct differences in nitrate nitrogen distribution patterns across treatments are evident. The W1N3 treatment had a peak nitrate nitrogen content of 2.533 mg·cm−3. Furthermore, the nitrate nitrogen content in W1N3’s soil remained elevated post-harvest, suggesting that excessive fertilizer use could result in residual soil nitrogen. During the reproductive phase of summer maize, intense short-term rainstorms facilitated the downward movement of nitrate nitrogen, leading to leaching. Therefore, modifying the fertilization strategy by increasing the frequency of applications and reducing the quantity per application could mitigate nitrogen leaching in future experiments, especially during short, intense rainstorms.

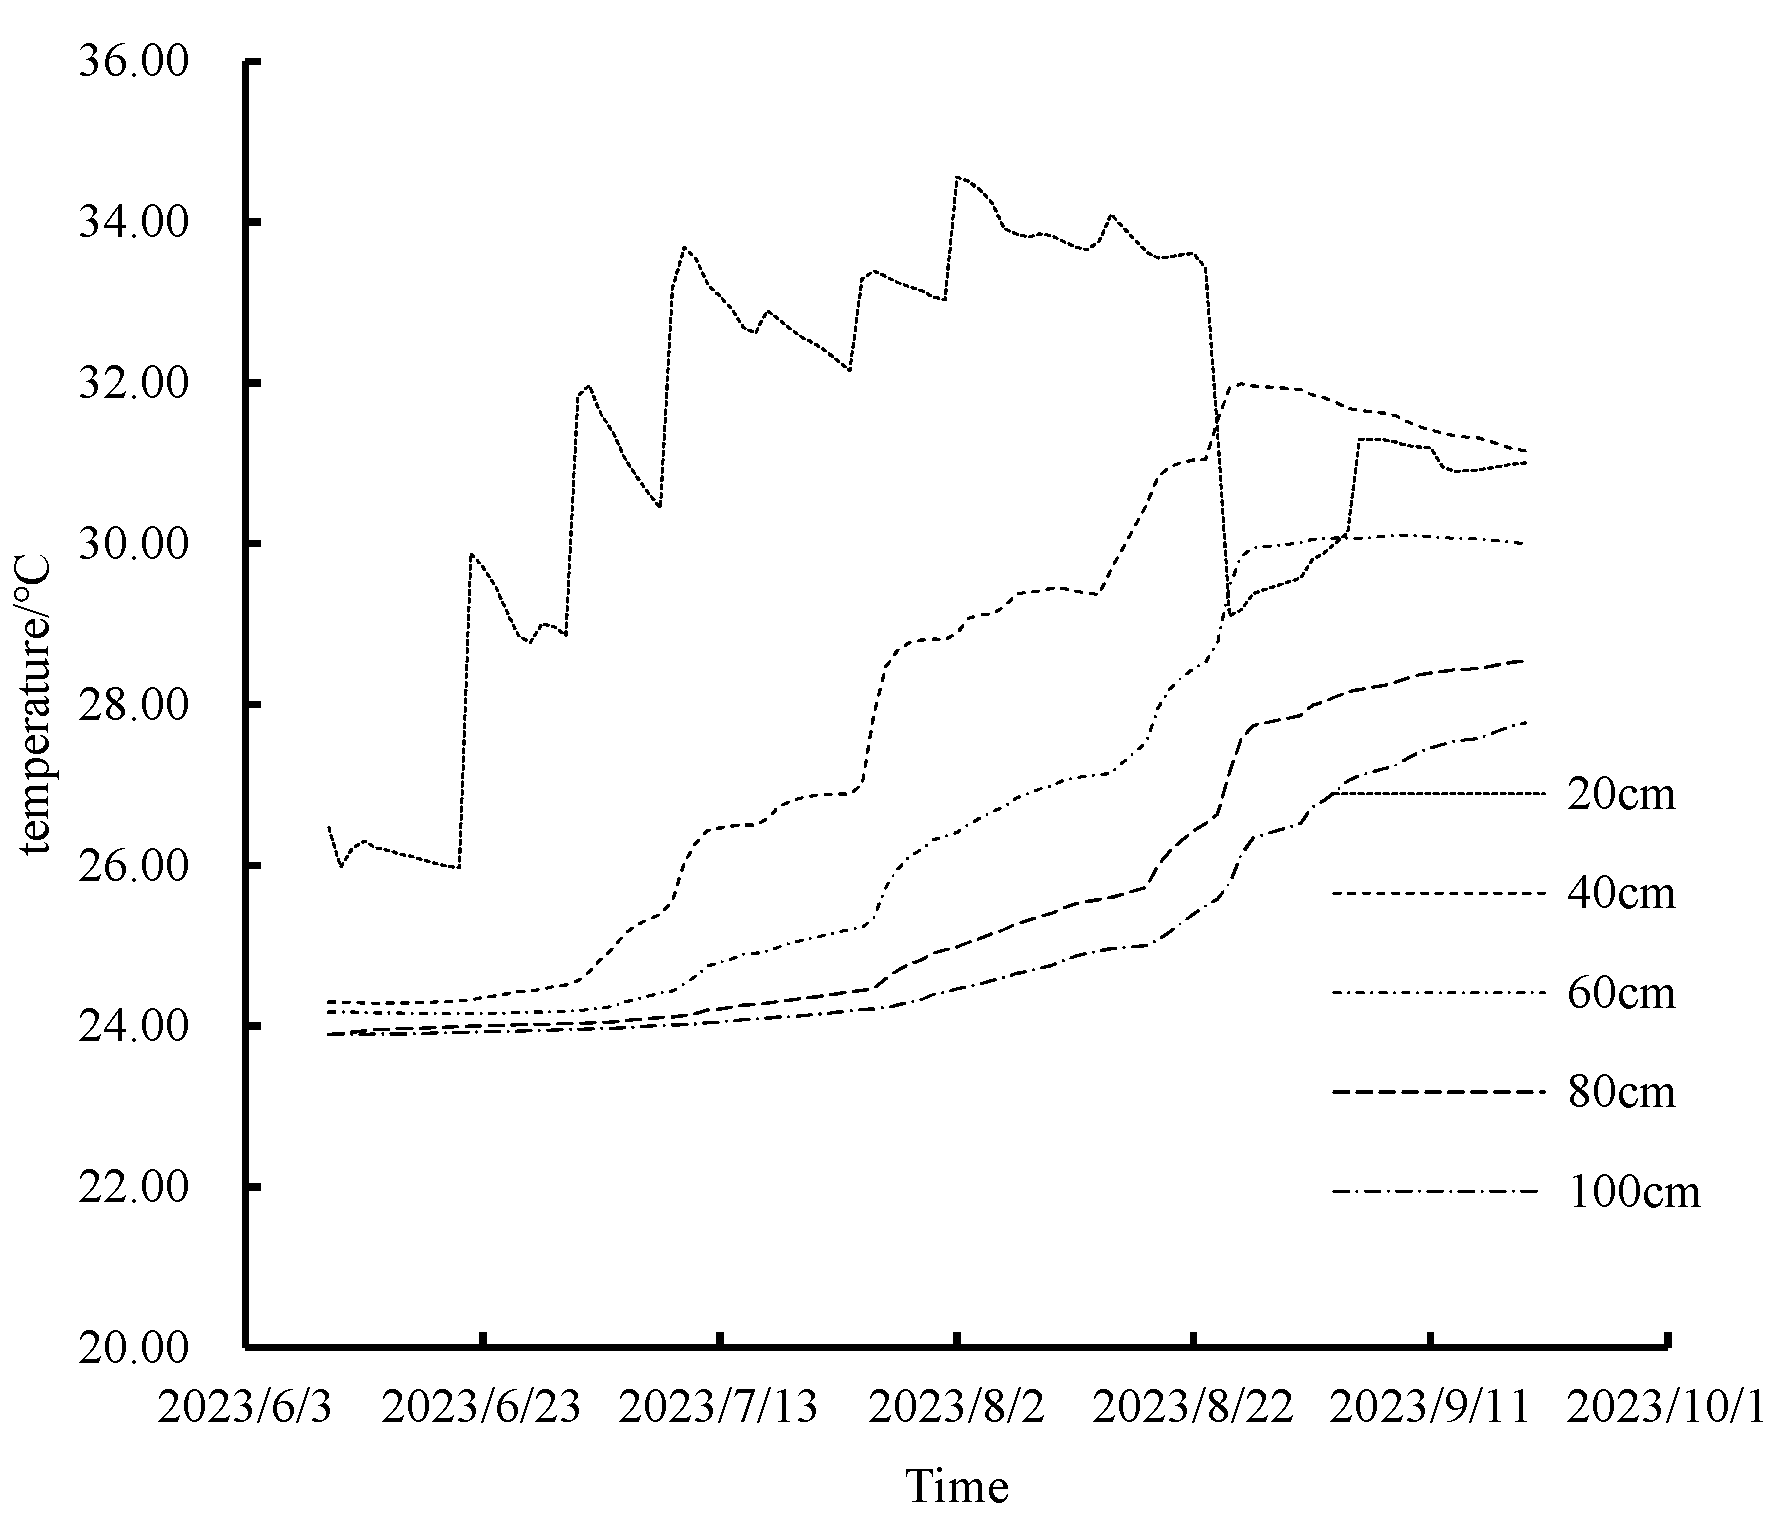
3.2.4. Analysis and Modeling of Temperature Dynamic Patterns in Soil Profiles

Temperature analysis from the summer maize experiment indicated minimal variations (less than 0.6 °C) between treatments for the same period and soil layer. The impact of varied water and nitrogen application systems on soil temperature changes was marginal. Consequently, to streamline the discussion, the W2N2 treatment was utilized as a representative example for analyzing temporal temperature changes across different soil layers. As depicted in Figure 7, temperature fluctuations in the shallow soil layer (0–20 cm) were considerably more pronounced than in deeper layers. Throughout the growth period, soil temperatures below 40 cm exhibited an upward trend. In contrast, surface soil temperatures slightly declined towards the end of the period. This pattern can be attributed to initial low crop canopy cover, allowing for direct sunlight exposure and minor diurnal temperature variations. Conversely, from blister stage to physiological maturity in summer maize, increasing canopy cover led to higher intercepted solar radiation and attenuated temperature fluctuations in the shallow soil layer.

3.3. Enzyme Activity Response Mechanisms under Different Water and Nitrogen Application Regimes

Table 8 demonstrates the significant effects of the lower irrigation limit, nitrogen application, and their interaction on soil enzyme activities at the trumpet, silking, and maturity stages of summer maize. Specifically, these factors showed highly significant impacts (p < 0.01) on overall soil enzyme activities. Notably, during the nodulation stage, the nitrogen application significantly influenced urease activity (p < 0.05), while both the lower limit of irrigation and its interaction with nitrogen application exhibited highly significant effects (p < 0.01) on this enzyme activity. This pattern was consistent throughout all fertility periods, with the lower irrigation limit’s impact on enzyme activity surpassing that of nitrogen application.
At the sowing stage, initial soil water content variations did not significantly affect urease and catalase activities. However, the lower limit of irrigation significantly influenced sucrase activity (p < 0.05). Analyzing urease activity patterns, an increase followed by a decrease was observed across all reproductive stages, correlating with the elevation of the lower irrigation limit. This trend was also apparent in the nodulation, trumpet, and silking stages, responding to increases in nitrogen application. Remarkably, urease activity peaked during the trumpet stage, where the W2N2 treatment recorded the highest activity at 1.82 mg·g−1·d−1, a respective increase of 111.62% and 10.98% over the W1N1 and W3N3 treatments.
Peroxidase activity throughout the maize’s fertility stages followed a similar increasing-then-decreasing pattern in response to both nitrogen application and the lower limit of irrigation. The peak activity occurred at the silking stage, with the W2N2 treatment reaching a maximum of 4.06 mg·g−1·h−1, marking increases of 89.72% and 37.62% compared to the W1N1 and W3N3 treatments, respectively. In terms of soil sucrase activity, there was an observed increase and subsequent decrease at the sowing, nodulation, and trumpet stages, influenced by varying lower irrigation limits. Conversely, at the silking and maturity stages, sucrase activity consistently increased with the elevation of the irrigation limit. Notably, at the trumpet stage, sucrase activity in the W2N2 treatment peaked at 36.61 mg·g−1·d−1, surpassing the W1N1 and W3N3 treatments by 57.19% and 38.83%, respectively.

3.4. Effect of Water–Nitrogen Coupling on Yield and Components of Summer Maize

Table 9 illustrates that both the lower irrigation limit and nitrogen application, as well as their interaction, significantly influenced (p < 0.01) the yield and its components in summer maize. The lower irrigation limit exerted a more pronounced effect than nitrogen application on these parameters. Examining the yield components, it was found that under consistent irrigation limits, summer maize exhibited a trend in fruit length, thousand grain weight, and overall yield, ranking as N2 > N3 > N1. Concurrently, grain numbers increased and then decreased with escalating nitrogen application. When applying the same nitrogen levels, the pattern for fruit length, thousand grain weight, and yield followed N2 > N3 > N1. Notably, once soil water control and nitrogen application reached certain thresholds, further augmenting the irrigation limit or nitrogen amount did not significantly enhance summer maize yield. The highest yield of 10,928.52 kg·ha−1 was observed in the W2N2 treatment, while the lowest yield of 7453.35 kg·ha−1 occurred in the W1N1 treatment.

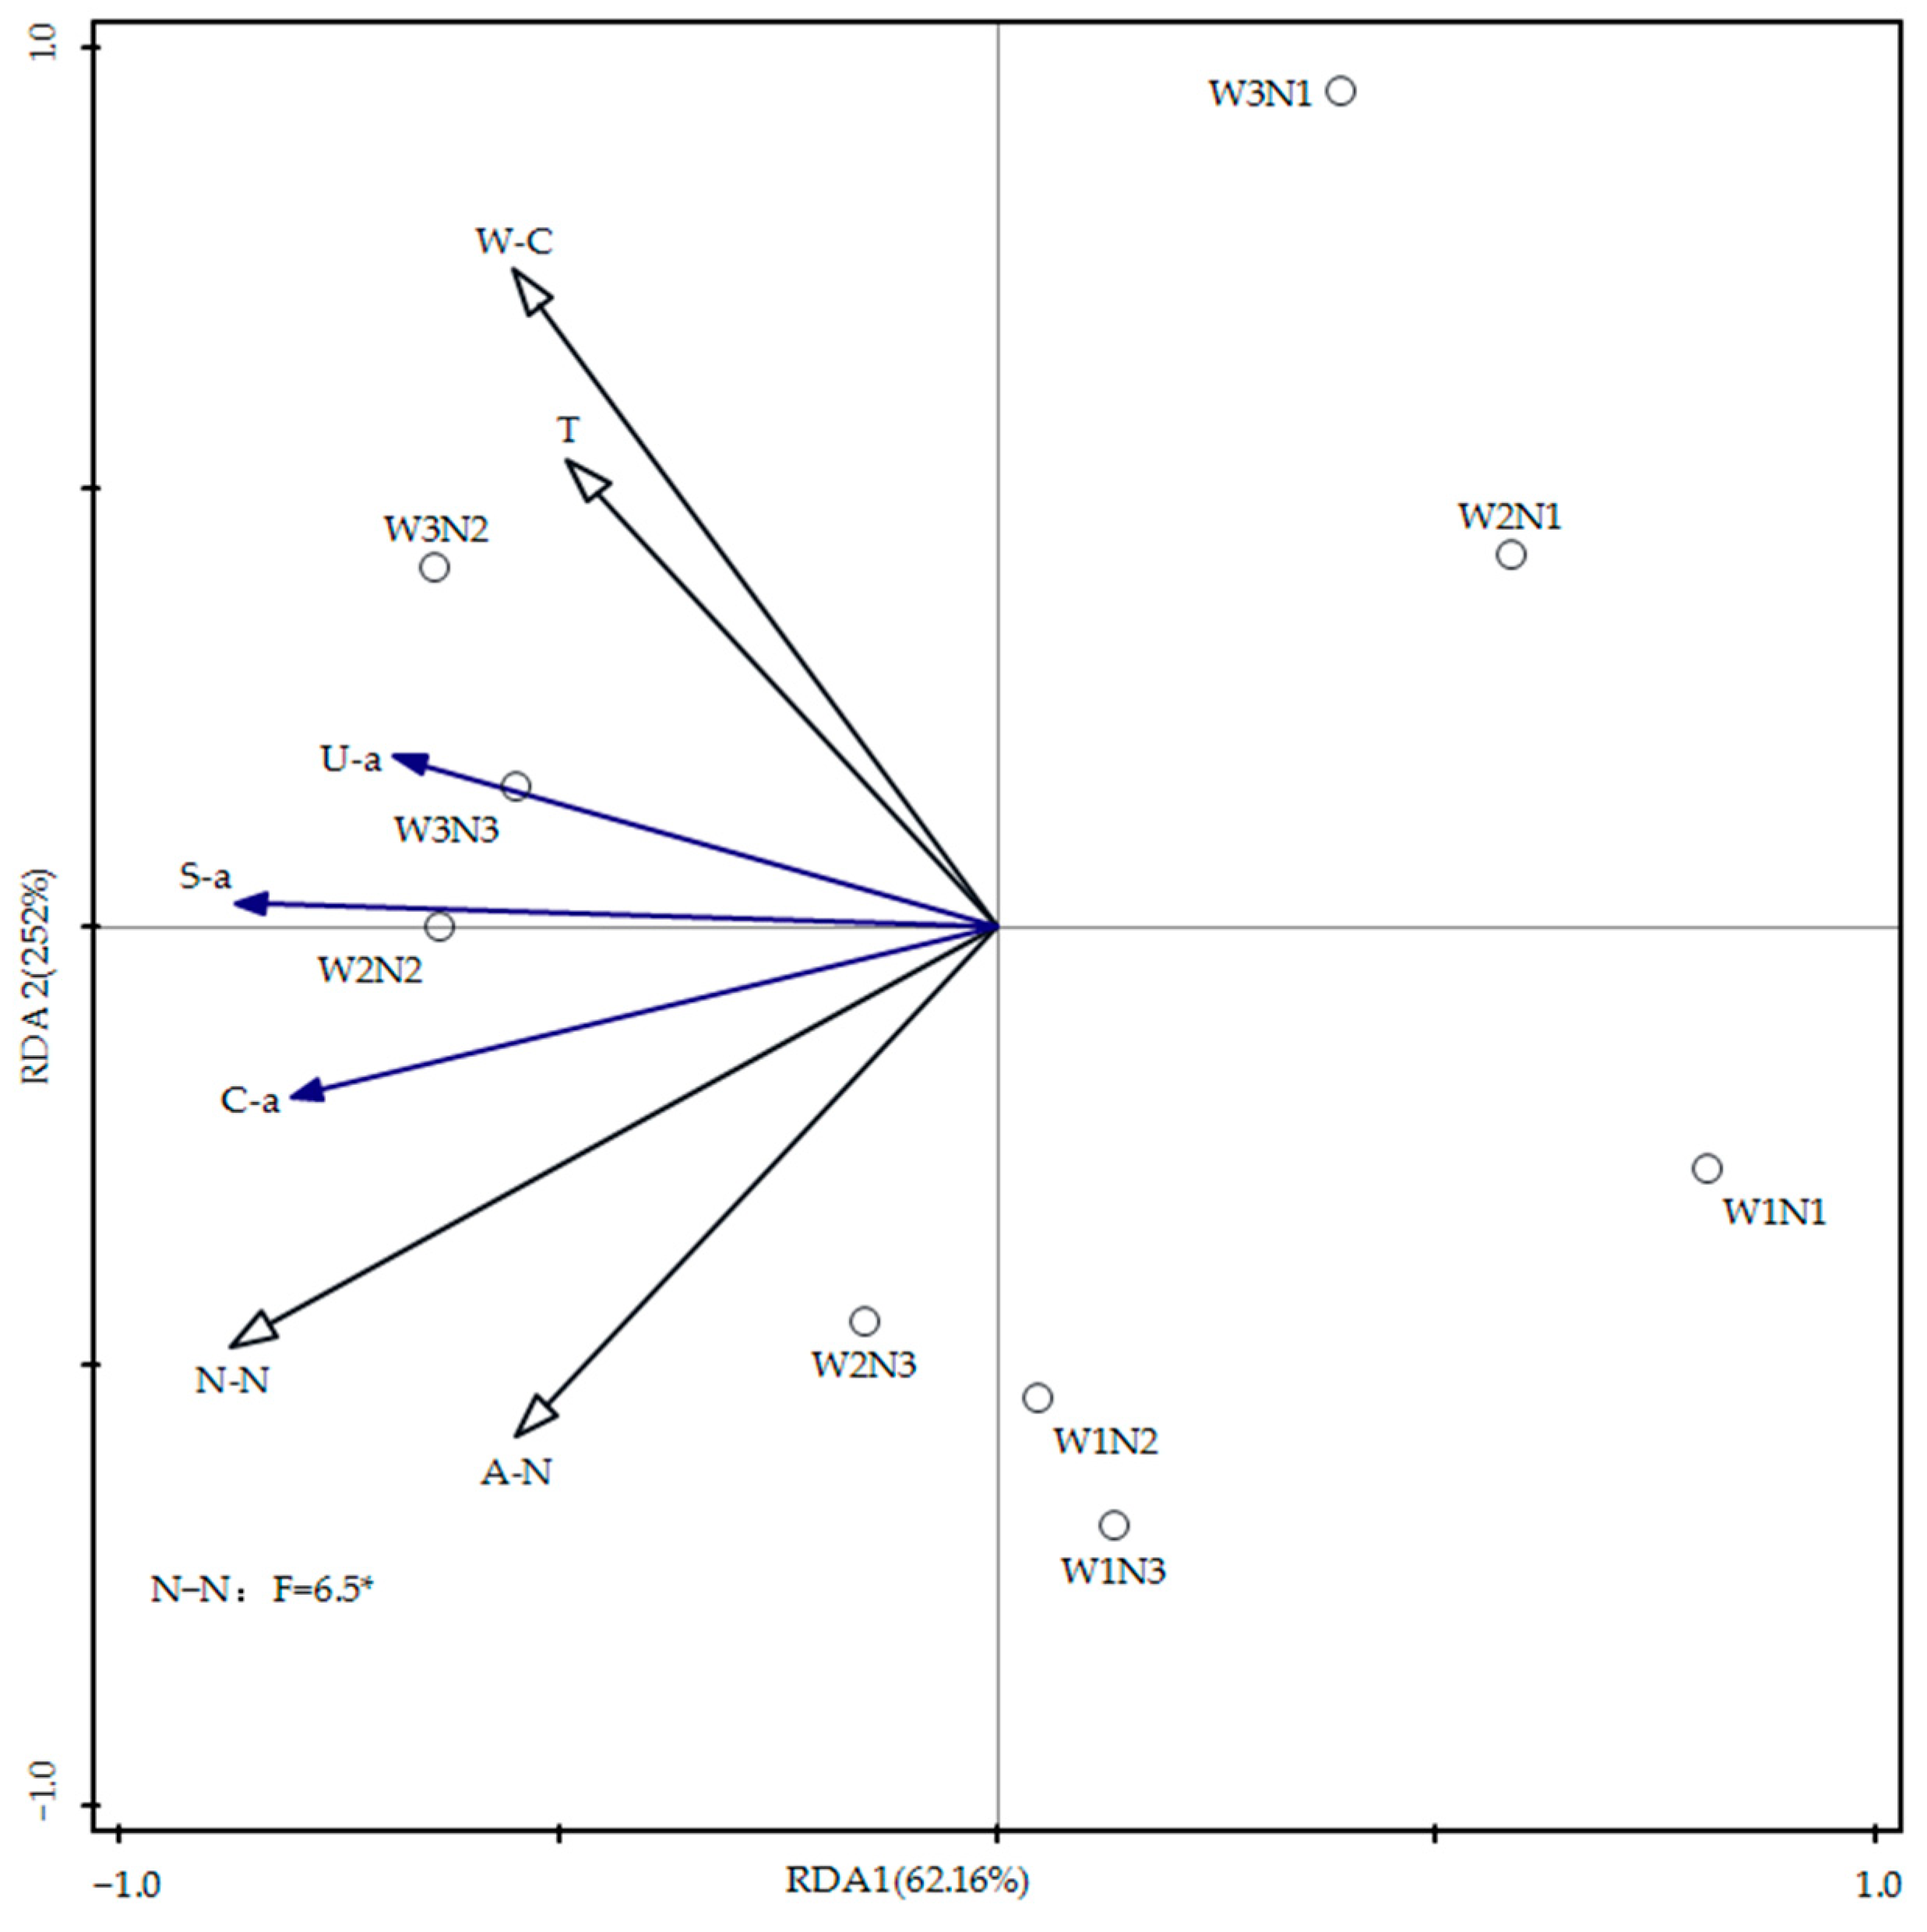
3.5. Redundancy Analysis of Soil Moisture, Nitrogen, Temperature, and Enzyme Activity

The effects of soil water content, nitrogen, and temperature on soil enzyme activities were investigated using redundancy analysis (RDA), with results presented in Figure 8. In the figure, blue arrows represent the response variables (urease activity, catalase activity, and sucrase activity), and black arrows denote the explanatory variables (soil water content, ammonium nitrogen, nitrate nitrogen content, and temperature). The cosine value of the angle between arrows reflects the correlation between variables: an angle greater than 90° indicates a negative correlation, an angle less than 90° suggests a positive correlation, and an angle close to 90° indicates a weak correlation. RDA1 and RDA2 explained 62.16% and 2.52% of the variation in soil enzyme activities in 2023, respectively. The acute angles between the arrows representing soil water content, ammonium nitrogen, nitrate nitrogen content, temperature, and those representing urease activity, catalase activity, and sucrase activity suggest a positive correlation. Notably, there was a significant positive correlation between nitrate nitrogen and soil enzyme activities (p < 0.05).

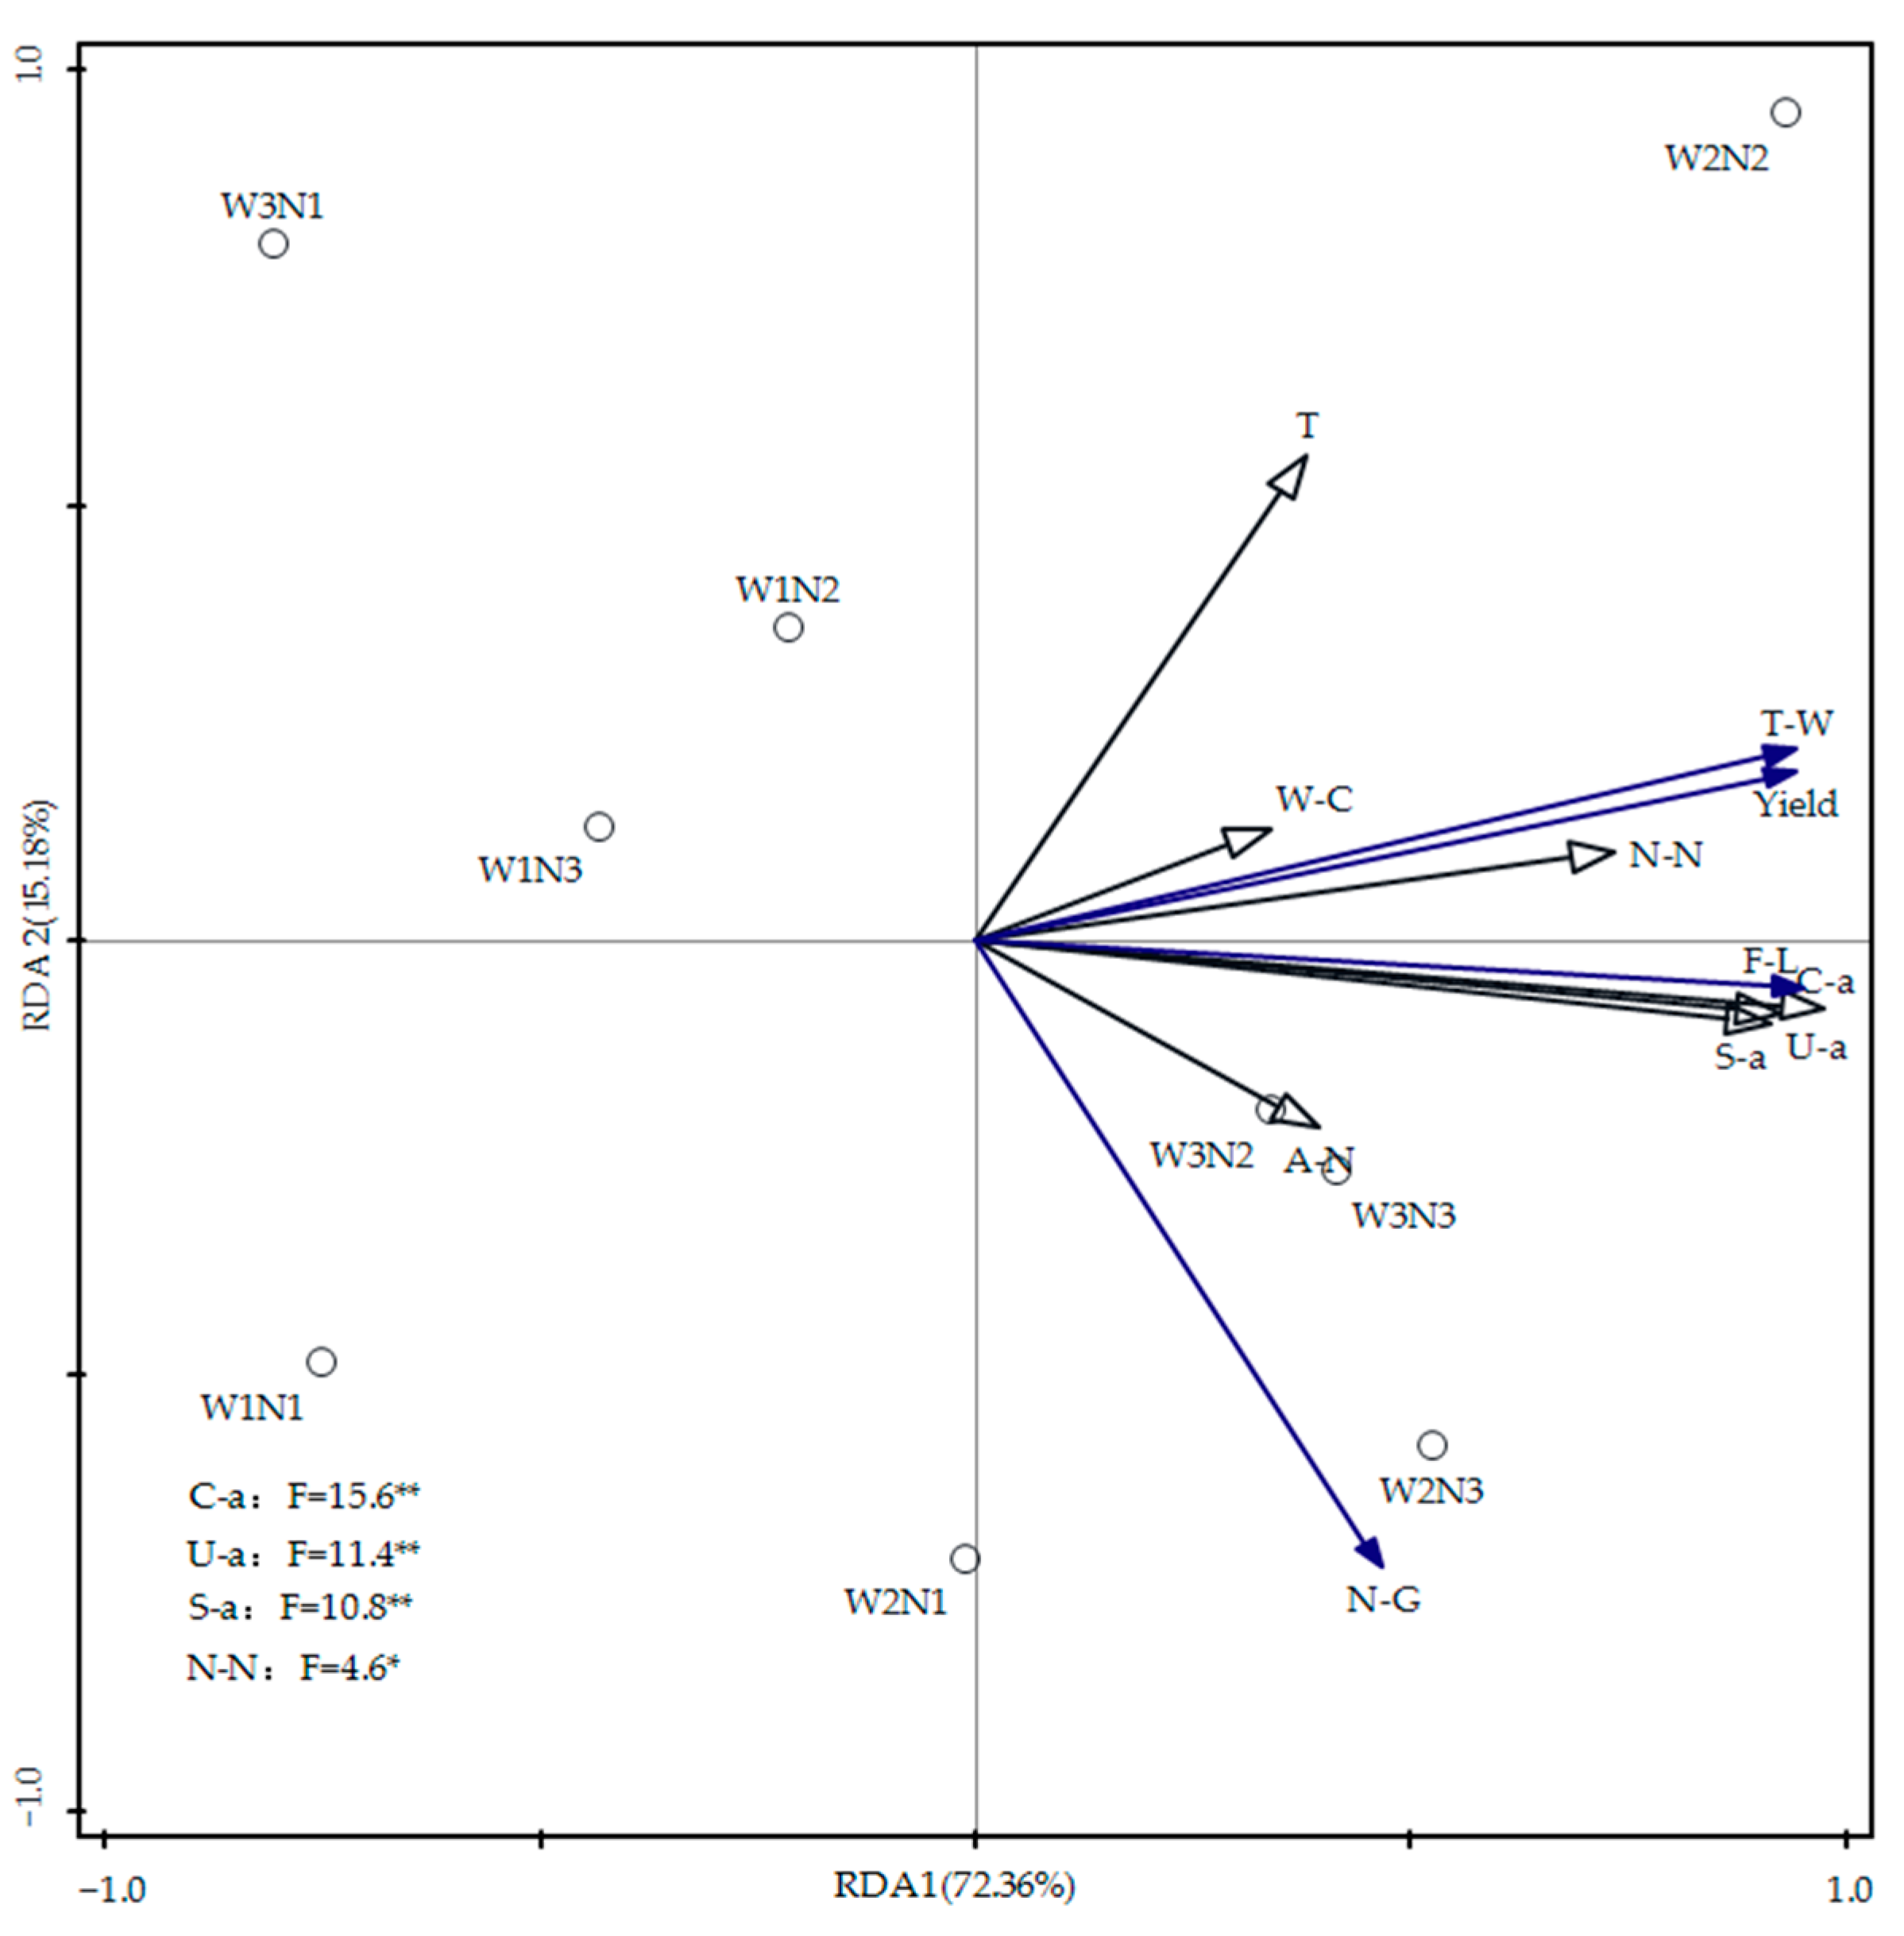
3.6. Redundancy Analysis of Soil Moisture, Nitrogen, Temperature, Enzyme Activity, and Summer Maize Yield

The effects of soil water content, nitrogen, temperature, and enzyme activity on summer maize yield and its components were analyzed using RDA, with results displayed in Figure 9. In the figure, blue arrows represent the response variables (summer maize yield, fruit length, number of grains, and thousand kernel weight), and black arrows denote the explanatory variables (soil water content, ammonium nitrogen, nitrate nitrogen, temperature, urease activity, catalase activity, and sucrase activity). RDA1 and RDA2 explained 72.36% and 15.18% of the variation in maize yields in 2023, respectively. The acute angles between the arrows representing soil water content, ammonium nitrogen, nitrate nitrogen content, temperature, and enzyme activities, and those representing maize yield, fruit length, and thousand grain weight indicate positive correlations. Conversely, the obtuse angle between the arrow for soil temperature and the number of grains suggests an inverse relationship between soil temperature and the number of grains. Notably, nitrate nitrogen content showed the smallest angle with yield factors, suggesting a stronger correlation with maize yield. As soil enzyme activity increased, there was a corresponding rise in summer maize yield. This study also found a highly significant positive correlation between soil urease, sucrase, and catalase activities and maize yield and components (p < 0.01), as well as a significant positive correlation between soil nitrate nitrogen content and maize yield and components (p < 0.05).

4. Discussion

The interplay between hydrothermal nitrogen dynamics and soil enzyme activities is a complex yet significant aspect, as evidenced by the marked influence of hydrothermal nitrogen on soil enzymatic processes [32]. Nitrogen movement, encompassing convection, molecular diffusion, and hydrodynamic dispersion, is intricately tied to water movement within the soil, thereby influencing nitrogen distribution [33]. Fertilizer concentration, closely related to soil infiltration capacity [34], affects water movement by altering this capacity. Furthermore, water status and phase changes in soil critically determine its thermal properties. Soil temperature, influencing the physical properties of water, like viscosity, surface tension, and osmotic pressure, affects both the total soil water potential and soil water movement [35]. Soil enzyme activities play a pivotal role in nitrogen transformation processes, reflecting the intensity and direction of soil biochemical processes [36].
Our application of the rate-optimized HYDRUS model for simulating soil hydrothermal nitrogen transport yielded coefficients of determination above 0.7 between modeled and observed values, aligning with existing research 16. This model indicates that soil nitrogen distribution is primarily influenced by irrigation and fertilization, with a hierarchy of simulation accuracy observed: water content > nitrate nitrogen > ammonium nitrogen > temperature. The model’s limited success in simulating temperature is attributed to soil’s spatial heterogeneity and the absence of a crop growth model, neglecting crop growth’s influence on soil temperature [37]. This resulted in overestimated soil temperature simulations compared to actual measurements. Notably, nitrate nitrogen, mainly present as anions, shows a broader distribution range than ammonium nitrogen due to its lack of exchange reactions with soil colloid-borne anions, allowing for deeper transport with water. Contrastingly, ammonium nitrogen predominantly resides within the 0–40 cm soil depth due to adsorption. However, in the W3 treatment, its distribution range exceeded that in the W1 treatment. This was attributed to higher rainfall during the summer maize season, maintaining elevated soil water content, thus hastening water movement and solute transport to deeper soil layers, while simultaneously reducing nitrogen adsorption, thereby affecting model simulations [27].
Different depths of soil temperatures remained relatively consistent despite variations in water and nitrogen application. This can be attributed to summer maize’s capacity to uniformly cover the soil surface in each treatment, effectively shielding it from direct sunlight. It was observed that broad furrow irrigation increased the heat exchange interface; however, soil temperature changes were predominantly influenced by air temperature, exhibiting a highly significant correlation with it. As noted by Song and Wang [38], soil temperature decreased with depth, and this correlation weakened as soil depth increased.
Proper water and nitrogen supply positively influenced the growth and yield of summer maize. Adequate hydration and nitrogen are crucial for maize root development [39]. Excessive soil fertilizer concentration leads to high nitrogen stress, causing cellular water loss, plasmolysis, and potentially root apoptosis, ultimately hampering nitrogen uptake from the soil. In our study, the W2 treatment, balancing soil moisture and aeration, outperformed the W1 and W3 treatments in yield and growth components under specific N application conditions. This suggests that optimal water and nitrogen supply, rather than excess, is key to maximizing maize yield [40,41]. When nitrogen application significantly exceeds crop requirements, residual nitrogen, susceptible to leaching, remains in the soil due to irrigation or precipitation [42].
Soil enzyme activities throughout the reproductive cycle of maize initially increased and then decreased. In the early stages of sowing and nodulation, rising soil temperatures and rapid plant growth necessitated increased nutrient absorption. This, coupled with water and fertilizer inputs, enhanced soil biomass and respiration, boosting enzyme activities and facilitating peroxide decomposition. As maize matures, aboveground nutrient growth stabilizes, root activity declines, necessitating less water and fertilizer, thereby diminishing soil biomass and enzyme activities [32]. Our findings indicated a first increase and then a decrease in soil peroxidase activity with rising nitrogen fertilizer application under a set irrigation quota. Appropriate nitrogen levels activate enzymes, enhancing their activity, whereas excessive nitrogen can inhibit enzyme reactions and microbial synthesis, reducing enzyme activities. Thus, medium N application seems more favorable for soil peroxidase activity under fixed irrigation conditions, mitigating the adverse effects of hydrogen peroxide on crops [43]. This contrasts with Shi et al.’s findings [44], where peroxidase activity was higher in non-fertilized and non-irrigated treatments. Our study, however, shows higher peroxidase activity after managed water and nitrogen applications, possibly due to different irrigation methods preserving soil oxygen levels. Our research also demonstrated that water–fertilizer coupling significantly raised soil urease, sucrase, and catalase activities, following an initial increase and subsequent decrease pattern, deviating from Treseder’s findings [45]. Increased soil moisture can foster the flow of enzyme-promoting reactants but may also lead to closed pore formation, inhibiting microbial activities.
Soil nutrients serve as a crucial source of plant nutrients and the basis for growth and development, thereby influencing crop yield and quality to a certain extent [46,47]. In this study, we analyzed the redundancy between soil moisture, nitrogen, temperature, enzyme activity, and summer maize yield and its components. The results indicated positive correlations among soil moisture, nitrogen, temperature, enzyme activity, and summer maize yield. Soil enzyme activity and nitrate nitrogen content emerged as the primary factors influencing summer maize yield. The significant positive correlation between soil nitrate nitrogen content and enzyme activities is consistent with existing research [48]. This impact is likely due to the water–nitrogen treatment enhancing plant growth and nutrient uptake through the modulation of soil properties and soil bacterial communities, thereby boosting maize yield [49]. Soil nutrients impact crop yield to varying extents; catalase, urease, sucrase, and nitrate nitrogen were identified as the top four soil environmental factors contributing most significantly to maize yield and its components in this study.

5. Conclusions

(1)
The rate-optimized HYDRUS model effectively simulated soil water, heat, and nitrogen dynamics, with all R2 not falling below 0.7. The model proved to be suitable for the simulation of water movement, nitrogen transport transformation, and heat transport.
(2)
This study identified a positive correlation between soil hydrothermal nitrogen dynamics and enzyme activities, with increased water–nitrogen application enhancing soil enzyme activities. Soil urease, catalase, sucrase activities, and nitrate nitrogen concentration emerged as the primary factors influencing variations in summer maize yields and constituent elements, demonstrating significant positive correlations. Based on the analysis of the effects of water and nitrogen application on summer maize yield and soil properties, the W2N2 regime was determined to be the optimal water and nitrogen application system.

Author Contributions

Writing—original draft preparation, T.L.; Conceptualization, Writing—review and editing, S.W.; Validation, M.Y. All authors have read and agreed to the published version of the manuscript.

Funding

This work was financially supported by the General Project of the National Natural Science Foundation of China, No. 52079051; the Key Scientific Research Project of Henan Province Colleges and Universities, Nos. 22A570004 and 23A570006; the Program for Innovative Research Team (in Science and Technology) in University of Henan Province (24IRTSTHN012); and the Innovation Fund for Doctoral Students of North China University of Water Resources and Electric Power (NCWUBC202302); Henan Provincial Water Conservancy Science and Technology Research Project (GG202336).

Data Availability Statement

Data is contained within the article.

Acknowledgments

Thanks to all the reviewers as well as the editors for their help.

Conflicts of Interest

The authors declare no conflicts of interest.

References

  1. Zheng, Y.; Liu, Y.; Yin, J.; Chang, Z.; Wang, Y.; Liu, L.; Tian, Y.; Chen, W.; Wang, L.; Hao, L. Effects of moisture and CO2 on photosynthetic performance and water utilisation in maize. J. Agric. Eng. 2023, 39, 71–81. [Google Scholar]
  2. Teng, Y.; Kong, F.; Chen, Y.; Chen, S.; Xiong, H.; Zhu, K.; Yang, Z. Meta-analysis of the effects of combined application of organic and chemical fertilizers on soil nitrogen leaching. Trans. Chin. Soc. Agric. Eng. 2022, 38, 81–88. [Google Scholar]
  3. Xu, R.; Shi, J.; Hao, D.; Ding, Y.; Gao, J. Research on temporal and spatial differentiation and impact paths of agricultural grey water footprints in the Yellow River Basin. Water 2022, 14, 2759. [Google Scholar] [CrossRef]
  4. Qing, Y.; Zhao, B.; Wen, C. The Coupling and Coordination of Agricultural Carbon Emissions Efficiency and Economic Growth in the Yellow River Basin, China. Sustainability 2023, 15, 971. [Google Scholar] [CrossRef]
  5. Qin, Z.; Zhang, Z.; Sun, D.; Song, J.; Zhang, Z.; Li, T. Effect of water and nitrogen coupling on rice yield and nitrogen absorption and utilization in black soil. Trans. Chin. Soc. Agric. Mach. 2021, 52, 324–335, 357. [Google Scholar]
  6. Gu, X.; Li, Y.; Huang, P.; Du, Y.; Fang, H.; Chen, P. Effects of planting patterns and nitrogen application rates on yield, water and nitrogen use efficiencies of winter oilseed rape. Trans. Chin. Soc. Agric. Eng. 2018, 34, 113–123. [Google Scholar]
  7. Gao, S.; Liu, T.; Wang, S.; Li, Y.; Ding, J.; Liu, Y.; Wang, D.; Li, H. Optimizing Fertilizer Management Practices in Summer Maize Fields in the Yellow River Basin. Agronomy 2023, 13, 2236. [Google Scholar] [CrossRef]
  8. Zhu, Y.; Chen, W.; Song, X.; Liu, P.; Sun, R.; Yue, X. Analysis of the dynamic evolution of soil quality in reclaimed abandoned salt fields in the Yellow River Delta. J. Appl. Basic Eng. Sci. 2021, 29, 545–561. [Google Scholar]
  9. Liu, S.; Xia, X.; Chen, G.; Mou, D.; Che, S.; Li, Y. Research progress of soil enzymes. Chin. Agron. Bull. 2011, 27, 1–7. [Google Scholar]
  10. Li, Y.; Niu, W.; Dyck, M.; Wang, J.; Zou, X. Yields and Nutritional of Greenhouse Tomato in Response to Different Soil Aeration Volume at two depths of Subsurface drip irrigation. Sci. Rep. 2016, 6, 39307. [Google Scholar] [CrossRef] [PubMed]
  11. Fang, Y.; Shouliang, Y.; Yang, X.; Li, J.; Hai, Y.; Zi, L.; Fan, K.; Pan, G. The Richness and Diversity of Catalases in Bacteria. Front. Microbiol. 2021, 12, 645477. [Google Scholar]
  12. Li, T.F.; Liu, C.Y.; Jin, X.M.; Cao, X. Effects of different cultivation strategies on soil nutrients and bacterial diversity in kiwifruit orchards. Eur. J. Hortic. Sci. 2022, 87, 1–8. [Google Scholar]
  13. Kang, N.; Siegfried, A.P. Soil Moisture and Temperature Effects on Granule Dissolution and Urease Activity of Urea with and without Inhibitors—An Incubation Study. Agriculture 2022, 12, 2037. [Google Scholar] [CrossRef]
  14. Ren, J.; Liu, X.; Han, F.; Kong, F.; Li, J.; Peng, H.; Li, Q. Effects of nitrogen application levels on soil enzyme activities and fruit quality in dry loess sand-covered apple orchards. J. Agric. Eng. 2019, 35, 206–213. [Google Scholar]
  15. Mi, G.; Yuan, L.; Gong, Y.; Zhang., F.; Ren., H. Effects of different water and nitrogen supply on soil enzyme activity and biological environment of tomato in solar greenhouse. J. Agric. Eng. 2005, 21, 124–127. [Google Scholar]
  16. Xiao, X.; Zhu, W.; Xiao, L.; Deng, Y.; Zhao, Y.; Wang, J. Improvement of soil enzyme activity and soil microbiota carbon and nitrogen in rice-based agricultural fields by appropriate water and nitrogen treatments. J. Agric. Eng. 2013, 29, 91–98. [Google Scholar]
  17. Wang, Y.; Mao, X.; Chen, S.; Bao, L. Experimentation and simulation of soil hydrothermal salinity dynamics and growth of oil sunflower in farmland irrigated by brackish water border. J. Agric. Eng. 2021, 37, 76–86. [Google Scholar]
  18. Su, Y.; Guo, X.; Hu, F.; Sun, X.; Ma, J.; Lei, T. Numerical simulation of soil water-heat-oxygen distribution in orchards under pit irrigation. J. Irrig. Drain. 2023, 42, 67–74. [Google Scholar]
  19. Wang, G.; Shi, H.; Li, X.; Yan, J.; Miao, Q.; Chen, N.; Wang, W. Simulation and assessment of water and salt transport in desert oasis based on HYDRUS-1D model. J. Agric. Eng. 2021, 37, 87–98. [Google Scholar]
  20. Šimůnek, J.I.R.K.A.; Van Genuchten, M.T.; Šejna, M. The HYDRUS Software Package for Simulating Two- and Three Dimensional Movement of Water, Heat, and Multiple Solutes in Variably-Saturated Porous Media; Technical Manual, Version 3.0; PC Progress: Prague, Czech Republic, 2020. [Google Scholar]
  21. Tamás, M.; Zsolt, F.; Erika, B.; János, T.; Attila, N. Modeling of soil moisture and water fluxes in a maize field for the optimization of irrigation. Comput. Electron. Agric. 2023, 213, 108159. [Google Scholar]
  22. Balkhi, A.; Ebrahimian, H.; Ghameshlou, A.N.; Amin, M. Modeling of nitrate and ammonium leaching and crop uptake under wastewater application considering nitrogen cycle in the soil. Model. Earth Syst. Environ. 2022, 9, 901–911. [Google Scholar] [CrossRef]
  23. Farshad, K.; Javad, B.; Vahid, R.; Nasrin, A. Field evaluation and numerical simulation of water and nitrate transport in subsurface drip irrigation of corn using HYDRUS-2D. Irrig. Sci. 2023, 42, 327–352. [Google Scholar]
  24. Nasrin, A.; Javad, B.; Vahid, R.; Habib, K.; Sally, E.; Dirk, M.; Tiago, B.; He, H. CNN deep learning performance in estimating nitrate uptake by maize and root zone losses under surface drip irrigation. J. Hydrol. 2023, 625, 130148. [Google Scholar]
  25. Guan, S. Soil Enzymes and Their Research Methods; Agricultural Press: Beijing, China, 1986. [Google Scholar]
  26. Schaap, M.G.; Van Genuchten, M.T. A Modified Mualem–van Genuchten Formulation for Improved Description of the Hydraulic Conductivity Near Saturation. Vadose Zone J. 2006, 5, 27–34. [Google Scholar] [CrossRef]
  27. Wang, S.; Liu, T.; Yang, J.; Wu, C.; Zhang, H. Simulation Effect of Water and Nitrogen Transport under Wide Ridge and Furrow Irrigation in Winter Wheat Using HYDRUS-2D. Agronomy 2023, 13, 457. [Google Scholar] [CrossRef]
  28. Feddes, R.A.; Kowalik, P.J.; Zaradny, H. Simulation of Field Water Use and Crop Yield; Centre for Agricultural Publishing and Documentation: Wageningen, The Netherlands, 1978. [Google Scholar]
  29. Monteith, J.L. Principles of environmental physics. Plant Growth Regul. 1991, 10, 177–178. [Google Scholar] [CrossRef]
  30. Sophocleous, L. Analysis of water and heat flow in unsaturated-saturated porous media. Water Resour. Res. 1979, 15, 1195–1206. [Google Scholar] [CrossRef]
  31. Chung, O.; Horton, R. Soil heat and water flow with a partial surface mulch. Water Resour. 1987, 23, 2175–2186. [Google Scholar] [CrossRef]
  32. Chen, S.; Huang, D.; Zhang, E.; Zhu, J.; Guo, X. Effects of straw compartmentalisation and water-nitrogen management on soil inorganic nitrogen and enzyme activities. J. Irrig. Drain. 2022, 41, 45–54. [Google Scholar]
  33. Wang, Q.; Wang, W.; Wang, Z.; Zhang, J.; Li, Y. Determination of technique parameters for saline-alkali soil through drip irrigation under film. Trans. Chin. Soc. Agric. Eng. 2001, 17, 47–50. [Google Scholar]
  34. Shi, X.; Wang, Q.; Su, Y. Effects of slight saltwater quality on the characteristics of soil water and salt transference. Arid Land Geogr. 2005, 28, 100–104. [Google Scholar]
  35. Lei, C.D.; Yang, S.X.; Xie, S.C. Soil Hydrodynamics; Tsinghua University Press: Beijing, China, 1988. [Google Scholar]
  36. Jin, Y.; Li, X.; Cai, Y.; Hu, H.; Liu, Y.; Fu, S.; Zhang, B. Effects of straw return with fertiliser on enzyme activity and microbial community structure in rice-oil rotation soil. Environ. Sci. 2021, 42, 3985–3996. [Google Scholar]
  37. Wei, W.; Dai, F.; Zhang, F.; Zhang, S.; Shi, R.; Liu, Y.; Shen, P. Agronomic optimisation of dryland maize in full-film twomonade furrow based on numerical simulation of hydrothermal effect. J. China Agric. Univ. 2020, 25, 19–28. [Google Scholar]
  38. Song, C.; Wang, Y. Characteristics of soil temperature in wetland ecosystems in response to air temperature and its effect on CO2 emission. J. Appl. Ecol. 2006, 17, 4625–4629. [Google Scholar]
  39. Li, M.; Hu, T.; Cui, X.; Luo, L.; Lu, J. Comprehensive effects of irrigation water and nitrogen levels for controlled release fertilizer with different release periods on winter wheat yield. Trans. Chin. Soc. Agric. Eng. 2020, 36, 153–161. [Google Scholar]
  40. Wang, H.; Su, W.; Zhao, X.; Aimulaguli, K.; Sun, S.; Xue, L.; Zhang, J. Effect of different irrigation and nitrogen application on yield, water and nitrogen use efficiency of spring wheat sown in winter. J. Triticeae Crops 2022, 42, 1381–1390. [Google Scholar]
  41. Mi, X.; Shi, L.; He, G.; Wang, Z. Fertilizer reduction potential and economic benefits of crop production for smallholder farmers in Shaanxi Province. Sci. Agric. Sin. 2021, 54, 4370–4384. [Google Scholar]
  42. Zhai, Y.Q.; Ma, K.; Jia, B.; Wei, X.; Yun, B.; Ma, J.; Zhang, H.; Ji, L.; Li, J. Distribution of nitrate nitrogen in drip-irrigated maize soils with different precipitation years, loss of nitrogen, and nitrogen uptake and utilisation. Chin. J. Ecol. Agric. 2023, 31, 765–775. [Google Scholar]
  43. Xu, G.; Lu, D.; Sun, H.; Wang, H.; Li, Y. Effects of coupled dry and wet alternate irrigation and nitrogen application on the inter-root environment of rice. J. Agric. Eng. 2017, 33, 186–194. [Google Scholar]
  44. Shi, X.; De, Y.; Ding, M.; Liu, X.; Wang, Z.; Liu, Y.; Xiang, P.; Yang, Q. Characteristics of soil carbon and nitrogen content, enzyme activity and yield of Panax pseudoginseng under water and fertiliser control. Agric. Res. Arid Reg. 2024, 42, 76–86. [Google Scholar]
  45. Treseder, K.K. Nitrogen additions and microbial biomass: Ameta analysis of ecosystem studies. Ecol. Lett. 2008, 11, 1111–1120. [Google Scholar] [CrossRef] [PubMed]
  46. Wang, C.Y.; Wang, K.Y.; Wang, H.R.; Zhao, M.D.; Zhou, Y.K. Nutrients and ecological stoichiometry characteristics of typical wetland soils in the lower Yellow River. Environ. Sci. 2024, 45, 1674–1683. [Google Scholar]
  47. Yu, Y.H.; Li, Y.T.; Wu, Y.G.; Wang, X.J.; Song, Y.P.; Deng, X.H. Effects of soil and leaf traits on peel quality of Zanthoxylum planispinum ‘dintanensis’. J. For. Environ. 2023, 43, 8–16. [Google Scholar]
  48. Zhai, C.; Feng, X.; Liu, C.; Li, Y.; Fan, J.; Zhang, J.; Meng, Q. Linkages of Enzymatic Activity and Stoichiometry with Soil Physical-Chemical Properties under Long-Term Manure Application to Saline-Sodic Soil on the Songnen Plain. Agronomy 2023, 13, 2972. [Google Scholar] [CrossRef]
  49. Li, Y.; Han, T.; Liu, K.; Huang, T.; Han, D.; Xiao, G.; Zhang, W. Response of soil enzyme activity and rice yield to tilling of winter green manure in a red soil paddy field. J. Plant Nutr. Fertil. 2023, 29, 1313–1322. [Google Scholar]
Figure 1. Meteorological data for 2022–2023.
Agronomy 14 01044 g001
Figure 2. The geometric structure and boundary conditions of the model.
Agronomy 14 01044 g002
Figure 3. Comparison of simulated and measured values of water content, ammonium nitrogen, nitrate nitrogen, and temperature.
Agronomy 14 01044 g003
Figure 4. Dynamic changes in soil water content at different depths.
Agronomy 14 01044 g004
Figure 5. Dynamic changes of ammonium nitrogen in soil profiles of each treatment.
Agronomy 14 01044 g005
Figure 6. Dynamic changes in nitrate nitrogen in soil profiles of each treatment.
Agronomy 14 01044 g006
Figure 7. Dynamic changes of soil profile temperature under W2N2 treatment.
Agronomy 14 01044 g007
Figure 8. Redundancy analysis of soil moisture, nitrogen, temperature, and enzyme activity. Note: W-C represents the soil water content, T represents the soil temperature, U-a represents urease, S-a represents sucrase, C-a represents catalase, N-N represents nitrate nitrogen, and A-N represents ammonium nitrogen. * indicates a significant correlation at the p < 0.05 level.
Agronomy 14 01044 g008
Figure 9. Redundancy analysis of soil moisture, nitrogen, temperature, enzyme activity, and summer maize yield. Note: F-L represents the fruit length, N-G represents the number of grains, and T-W represents the thousand grain weight. ** indicates a significant correlation at the p < 0.01 level; * indicates a significant correlation at the p < 0.05 level.
Agronomy 14 01044 g009
Table 1. Basic physical properties and physicochemical parameters of the soil.
Soil Depth (cm)Characteristic Parameters of the SoilParticle Size Composition (%)Physicochemical Parameters of the Tested Soil
Dry Bulk Weight of the Soil (g/cm3)Soil Field Capacity (V/V%)Soil Organic Matter (m/m%)Average Content of Total Nitrogen (%)ClaySiltSandAmmonium Nitrogen (mg·kg−1)Nitrate Nitrogen (mg·kg−1)
0–201.4633.30.830.04742519.527.95
20–401.4734.20.860.05743507.857.64
40–601.4731.60.820.03644498.466.35
60–801.4632.50.580.02646486.896.12
80–1001.4832.40.520.01215836.316.48
Table 2. Different water and fertilizer treatments for summer maize.
TreatmentIrrigation SchemeNumber of Topdressing (Times)Base FertilizerNitrogen Application Rate (kg·ha−1)
Lower Limit of IrrigationIrrigation Norm (mm)Jointing StageTrumpet StageFlowering StageFooting
W1N160% of θs3025532.532.5/120
W1N260% of θs82.5/82.5120
W1N360% of θs/132.5132.5120
W2N170%of θs32.5/32.5220
W2N270%of θs/82.582.5220
W2N370%of θs132.5132.5/220
W3N180%of θs/32.532.5320
W3N280%of θs82.582.5/320
W3N380%of θs132.5/132.5320
Note: θs—soil water holding capacity.
Table 3. Summer maize phenological period classification for 2022–2023.
Phenological Period20222023Characteristics
Emergence6/8–6/176/10–6/20The germinal sheath is exposed to the ground.
First leaf6/15–6/266/19–6/30First leaf fully expanded.
Third leaf6/23–7/56/27–7/8The third leaf is fully expanded, at which point the growing point of the corn is still underground.
Sixth leaf7/3–7/157/4–7/17The sixth leaf is fully expanded, and the male spike cone begins to elongate.
Twelfth leaf7/14–8/37/15–8/1
Tasseling7/29–8/107/26–8/12The last branch of the male spike is visible before silking.
Silking8/5–8/138/6–8/15Filaments of female spikes begin to show bracts.
Blister stage8/11–8/258/12–8/27The volume of the kernel in the middle of the cob is basically built up and the endosperm is clear and pulpy.
Milk stage8/23–9/108/24–9/11Maize kernels turn yellow, and the endosperm is milky then mushy.
Physiological maturity9/7–9/179/8–9/19Plants with dry, hard kernels; black layer at the base of the kernel; disappearance of the milkline.
Table 4. Parameters of soil hydraulic properties.
Soil Depth
(cm)
θr (cm3·cm−3)θs (cm3·cm−3)α (cm−1)nKs (cm·day−1)
0–200.0310.38320.01431.353137.7
20–400.38950.01341.278629.8
40–600.40320.01391.495732.1
60–800.38370.01471.385433.9
80–1000.38430.01391.529542.2
Table 5. Soil solute transport parameters.
Soil Depth
(cm)
μ w , u r e a (d)Kd
(cm3·mg−1)
μ w , N H 4 + (d) μ w , N H 4 +
(d)
μ s , N H 4 +
(d)
μ w , N O 3
(d)
μ s , N O 3
(day−1)
γ w , N H 4 +
(mg·cm−3·d−1)
200.560.00320.020.20.20.040.043 × 10−5
400.550.00350.0250.30.30.030.037 × 10−5
600.540.00350.030.260.260.030.035 × 10−6
800.580.00320.0280.270.270.040.044 × 10−6
1000.570.00370.370.360.360.050.053 × 10−6
Table 6. Parameters of soil thermal characteristics.
Soil Depth
(cm)
Solid (%)b1b2b3Cn (J∙s−1∙°C−1)C0 (J∙s−1∙°C−1)Cw (J∙s−1∙°C−1)
200.61687.26 × 10101.17 × 10114.58 × 10113.98 × 10105.2 × 10108.67 × 1010
400.61055.43 × 10108.4 × 10103.53 × 10113.44 × 10104.8 × 10107.57 × 1010
600.59684.32 × 10107.7 × 10103.47 × 10112.56 × 10104.21 × 10107.37 × 1010
800.61638.45 × 10101.21 × 10113.65 × 10112.47 × 10103.95 × 10106.27 × 1010
1000.61571.13 × 10111.27 × 10112.54 × 10111.95 × 10103.64 × 10107.27 × 1010
Table 7. Error analysis of measured and simulated soil volumetric water content, ammonium nitrogen, nitrate nitrogen, and temperature values.
TreatmentClassificationMAERMSER2
W1N1Water content0.01140.01150.7844
Ammonium nitrogen0.00960.00280.7176
Nitrate nitrogen0.04240.08530.792
Temperature1.46991.63380.7344
W2N2Water content0.00990.00970.8045
Ammonium nitrogen0.00790.02720.7332
Nitrate nitrogen0.08090.16280.8026
Temperature1.51611.64460.7185
W3N3Water content0.00930.01020.8179
Ammonium nitrogen0.0350.09110.7619
Nitrate nitrogen0.17140.28420.7928
Temperature1.27351.56060.7163
Table 8. Variation characteristics of soil enzyme activities under water and nitrogen coupling.
TreatmentSeeding StageNodulation StageTrumpet StageSilking StageMaturity Stage
UreaseCatalaseSucraseUreaseCatalaseSucraseUreaseCatalaseSucraseUreaseCatalaseSucraseUreaseCatalaseSucrase
W1N10.84 bc0.88 b21.671.05 de1.26 ef24.56 bc0.86 d2.40 d23.29 d0.77 e2.14 e15.49 fg0.66 d1.74 f13.39 e
W1N20.85 bc0.94 ab21.311.18 c1.49 cd22.06 c0.92 d2.86 c24.04 d0.95 d3.02 bc19.53 e0.68 d2.06 d19.06 c
W1N30.81 cd0.95 ab21.870.92 f1.13 f14.41 d0.86 d0.98 f17.78 f0.67 e0.88 f17.49 ef0.52 e0.92 h10.05 f
W2N10.86 bc0.96 ab22.781.32 b1.39 de24.60 bc1.65 b3.02 c28.48 c1.41 b3.22 bc25.65 c0.93 bc2.92 b23.64 b
W2N20.84 bcd0.85 b22.891.43 a1.99 a32.06 a1.82 a4.02 a36.61 a1.72 a4.06 a35.17 a1.00 a3.27 a29.58 a
W2N30.95 a0.88 b22.491.40 ab1.79 b27.39 b1.81 a3.27 b30.98 bf1.68 a3.21 bc22.92 d0.96 ab3.05 b23.46 b
W3N10.85 bc0.91 ab21.510.93 f1.31 e17.17 d0.85 d2.56 d19.81 e0.98 cd2.55 d24.58 cd0.89 c1.87 ef16.83 d
W3N20.83 bcd1.06 a21.640.97 ef1.55 c26.34 b1.28 c3.25 b27.71 c0.92 d3.33 b33.54 a0.95 bc2.65 c30.59 a
W3N30.89 ab0.92 ab22.461.15 cd1.81 b25.41 b1.64 b3.13 b26.37 c1.08 c2.95 c27.78 b0.97 ab2.02 de31.08 a
CK0.76 d0.86 b21.240.93 f1.12 f21.85 c0.75 e2.09 e20.26 e0.67 e1.87 e13.54 g0.57 e1.50 g11.51 ef
W10.830.9221.61 b1.05 b1.29 c20.34 c0.88 c2.08 c21.70 c0.80 c2.01 c17.50 c0.62 b1.57 c14.16 b
W20.880.8922.72 a1.38 a1.72 a28.02 a1.76 a3.44 a30.25 a1.60 a3.49 a27.91 b0.97 a3.08 a25.56 a
W30.860.9621.87 ab1.01 b1.56 b22.97 b1.26 b3.04 b24.63 b0.99 b2.94 b28.63 a0.94 a2.18 b26.17 a
N10.850.9121.991.10 b1.32 c22.11 b1.12 c2.66 b23.86 b1.05 b2.64 b21.91 b0.83 ab2.17 b17.96 c
N20.840.9521.941.19 a1.68 a26.82 a1.34 b3.38 a29.45 a1.19 a3.47 a29.41 a0.87 a2.66 a26.41 a
N30.880.9122.271.16 ab1.57 b22.40 b1.44 a2.52 c25.04 b1.14 ab2.34 c22.73 b0.81 b2.00 c21.53 b
F
Lower limit of irrigation3.4941.9874.386 *91.434 **70.431 **53.419 **529.87 **274.601 **204.572 **452.612 **182.397 **238.379 **346.866 **512.757 **256.071 **
Nitrogen application2.3310.5650.4255.014 *50.295 **24.464 **73.395 **118.89 **62.798 **13.332 **111.234 **104.124 **9.653 **105.594 **100.91 **
Lower limit of irrigation × nitrogen application3.0312.7530.64510.308 **21.848 **27.339 **40.378 **73.71 **25.163 **16.461 **28.868 **15.6 **11.872 **29.278 **41.333 **
Note: Different lowercase letters in the same column indicate significant differences between treatments at the p < 0.05 level; ** indicates a significant correlation at the p < 0.01 level; * indicates a significant correlation at the p < 0.05 level; similarly hereinafter.
Table 9. Effects of water and nitrogen coupling on yield and yield components of summer maize.
TreatmentFruit LengthNumber of GrainsThousand Grain WeightYield
W1N116.46 e552 bc359.66 fg7453.35 f
W1N216.80 e567 ab386.50 e8215.30 e
W1N317.33 d530 cde366.00 f7285.37 f
W2N118.43 c573 ab413.66 d8891.25 d
W2N220.13 a540 cd539.50 a10,928.52 a
W2N318.40 c589 a462.00 b10,211.46 b
W3N115.90 f526 de364.00 fg7188.12 f
W3N218.86 c516 e430.66 c8335.14 e
W3N319.43 b571 ab428.16 cd9172.30 c
CK14.93 g493 f348.66 g6450.45 g
W116.87 c550.11 b370.72 c7651.34 c
W218.99 a567.78 a471.72 a10,010.41 a
W318.07 b538.11 b407.61 b8231.86 b
N116.93 b550.89 ab379.11 c7844.24 c
N218.60 a541.22 b452.22 a9159.65 a
N318.39 a563.89 a418.72 b8889.71 b
F
Lower limit of irrigation118.048 **13.041 **278.807 **512.007 **
Nitrogen application85.847 **7.575 **142.970 **163.574 **
Lower limit of irrigation × nitrogen application40.036 **13.984 **29.102 **48.440 **
Note: Different lowercase letters in the same column indicate significant differences between treatments at the p < 0.05 level; ** indicates a significant correlation at the p < 0.01 level.
Disclaimer/Publisher’s Note: The statements, opinions and data contained in all publications are solely those of the individual author(s) and contributor(s) and not of MDPI and/or the editor(s). MDPI and/or the editor(s) disclaim responsibility for any injury to people or property resulting from any ideas, methods, instructions or products referred to in the content.

