
A Novel Preparation Method of Composite Bolted T-Joint with High Bending Performance Based on the Prepreg-RTM Co-Curing Process


Abstract
1. Introduction
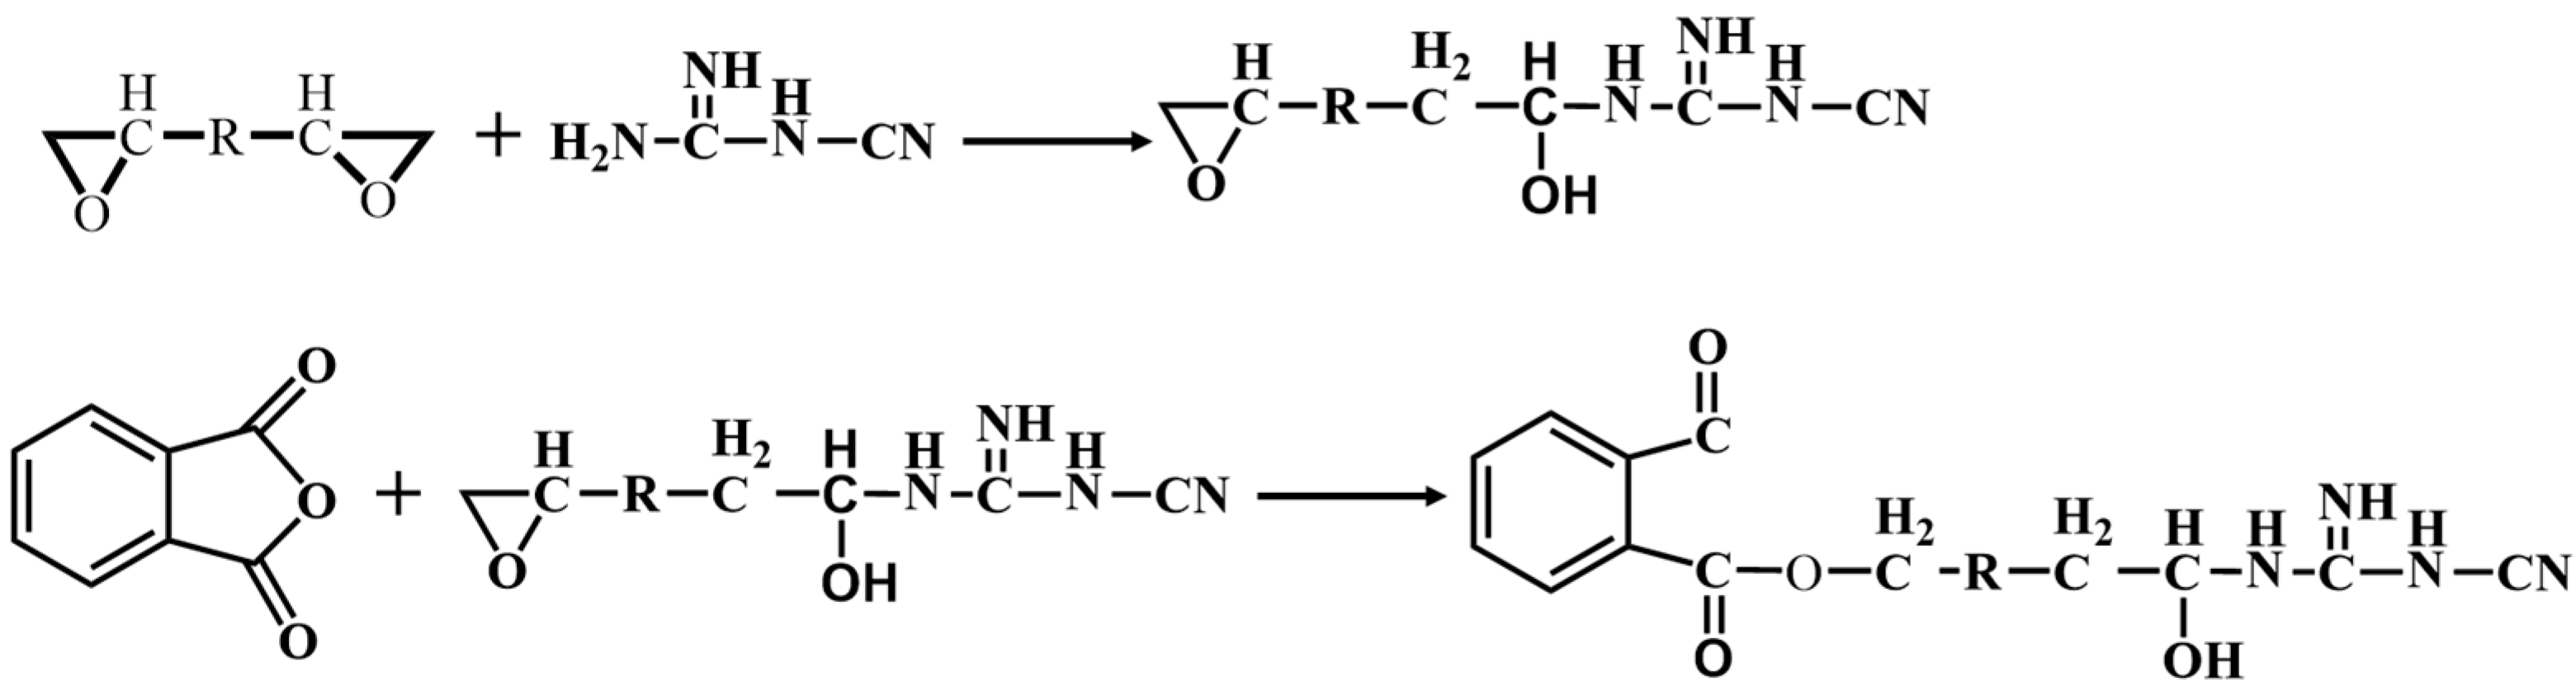
2. Co-Curing Resin System Analysis
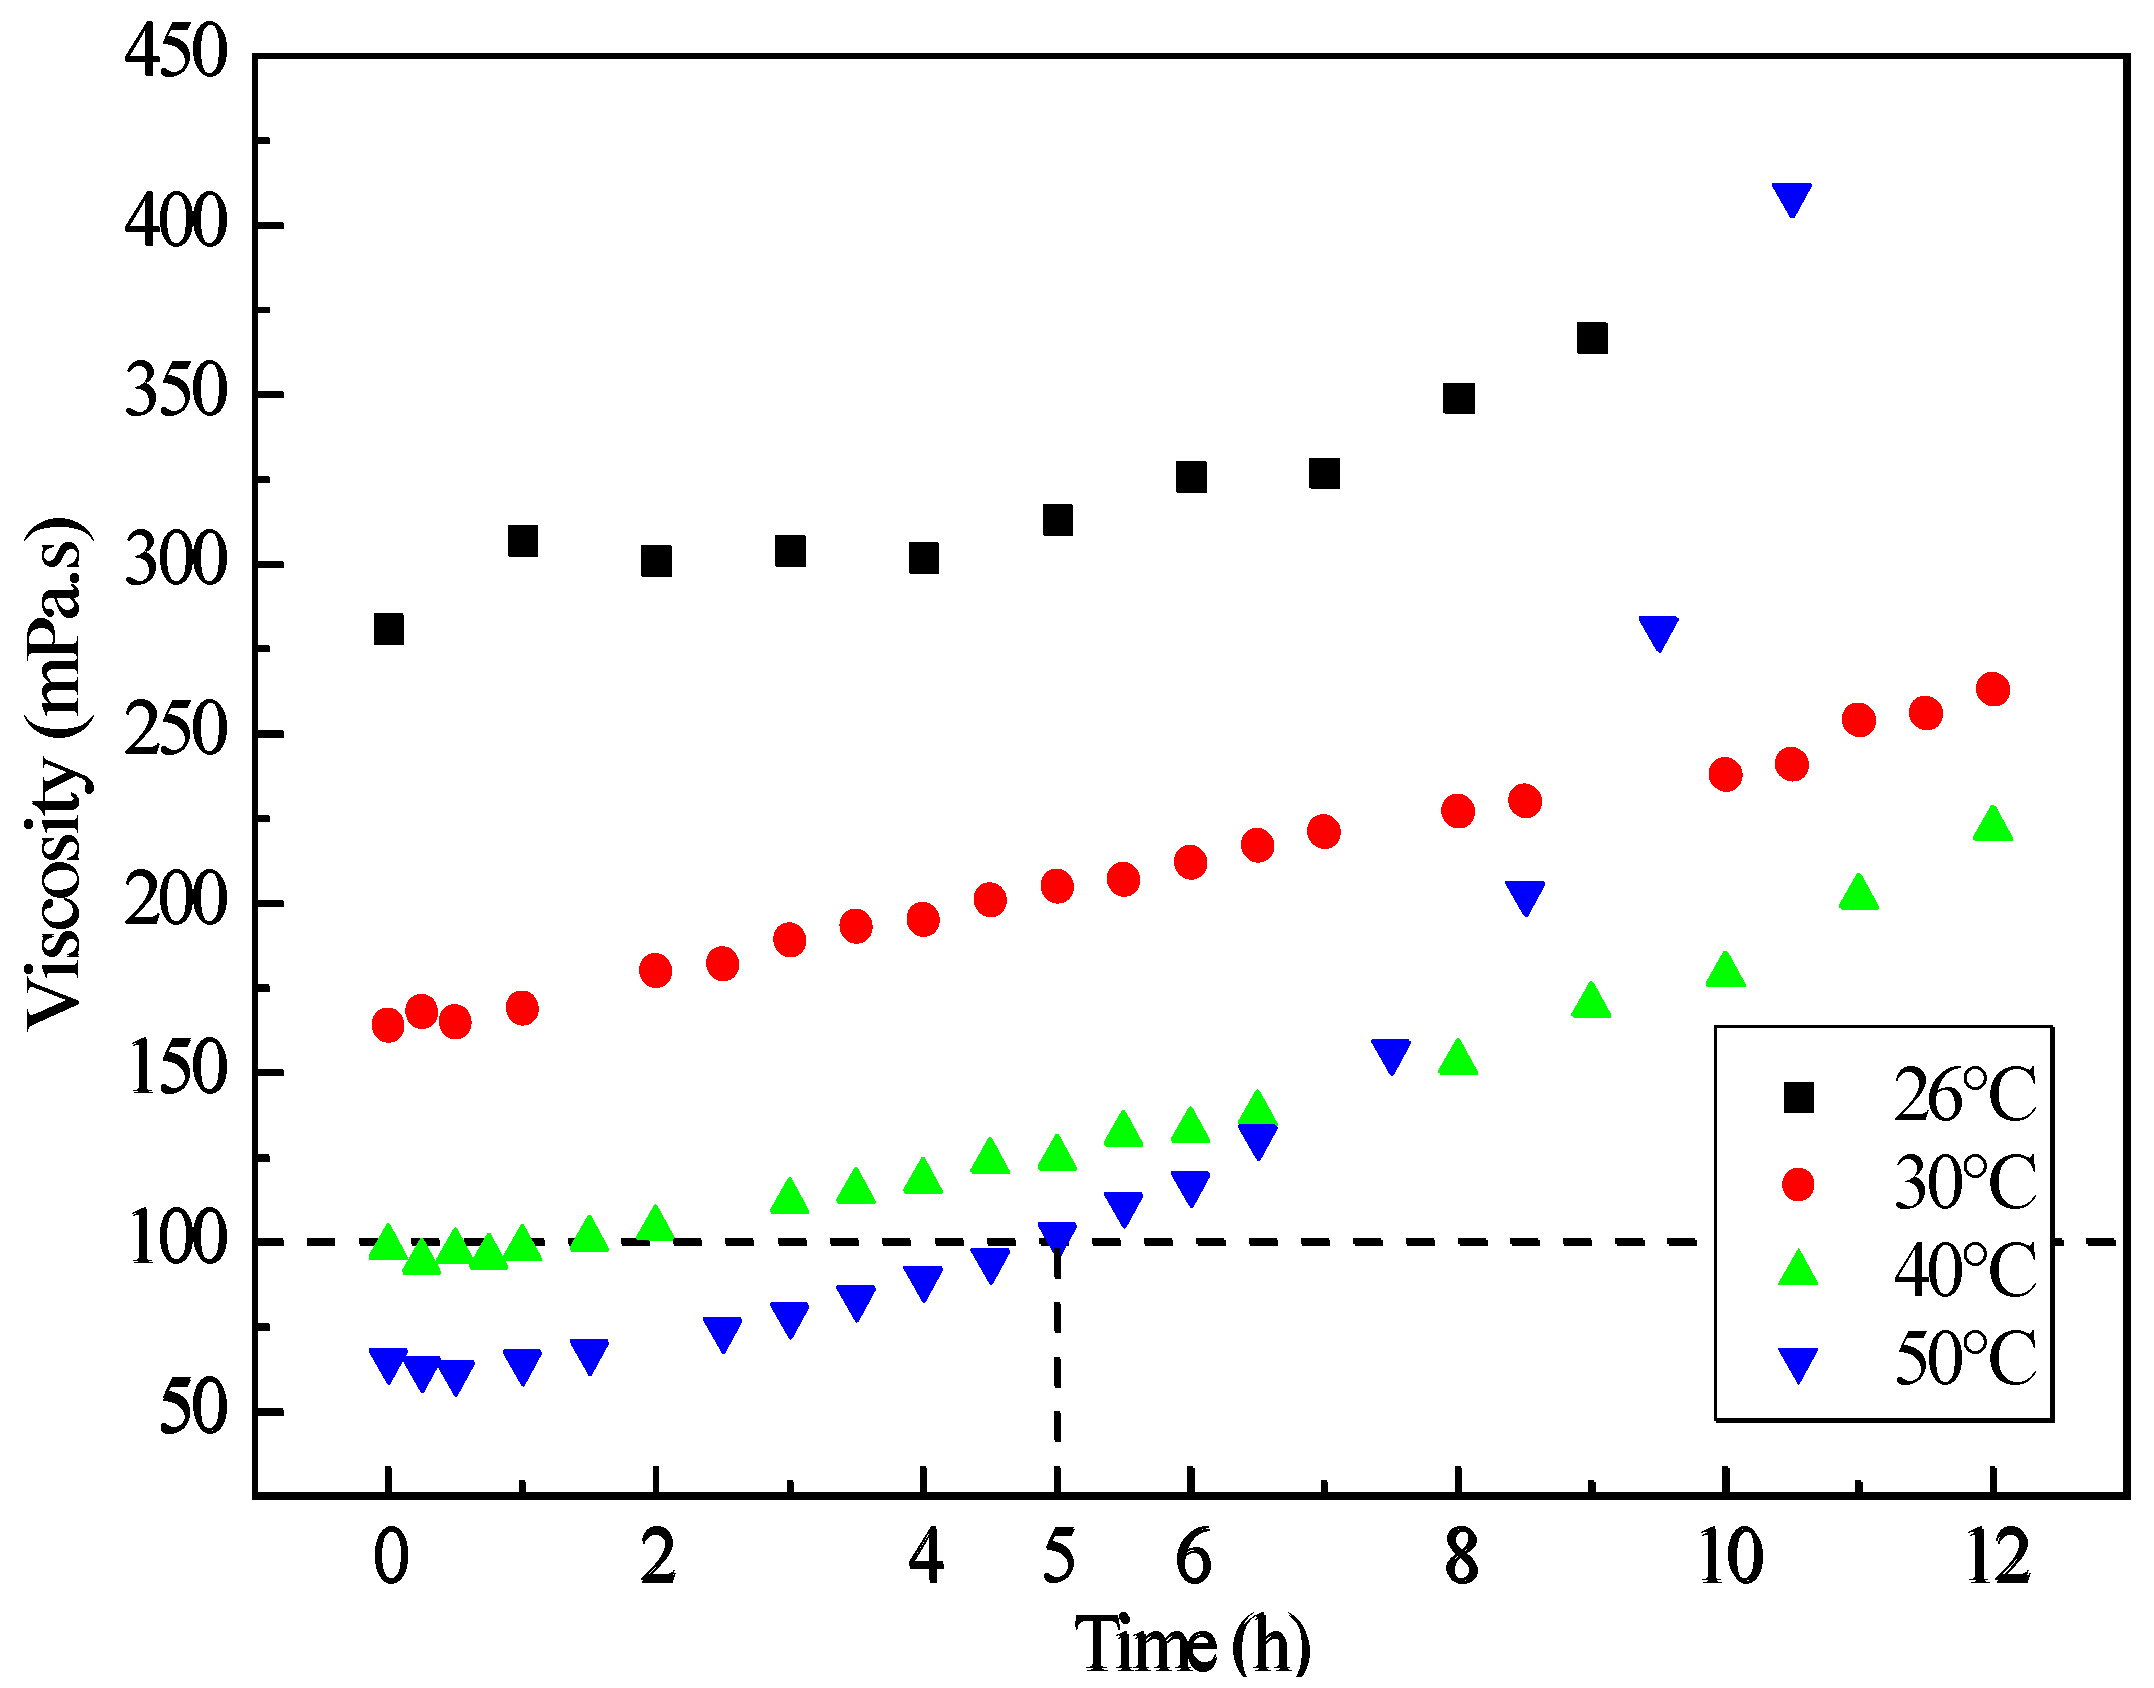
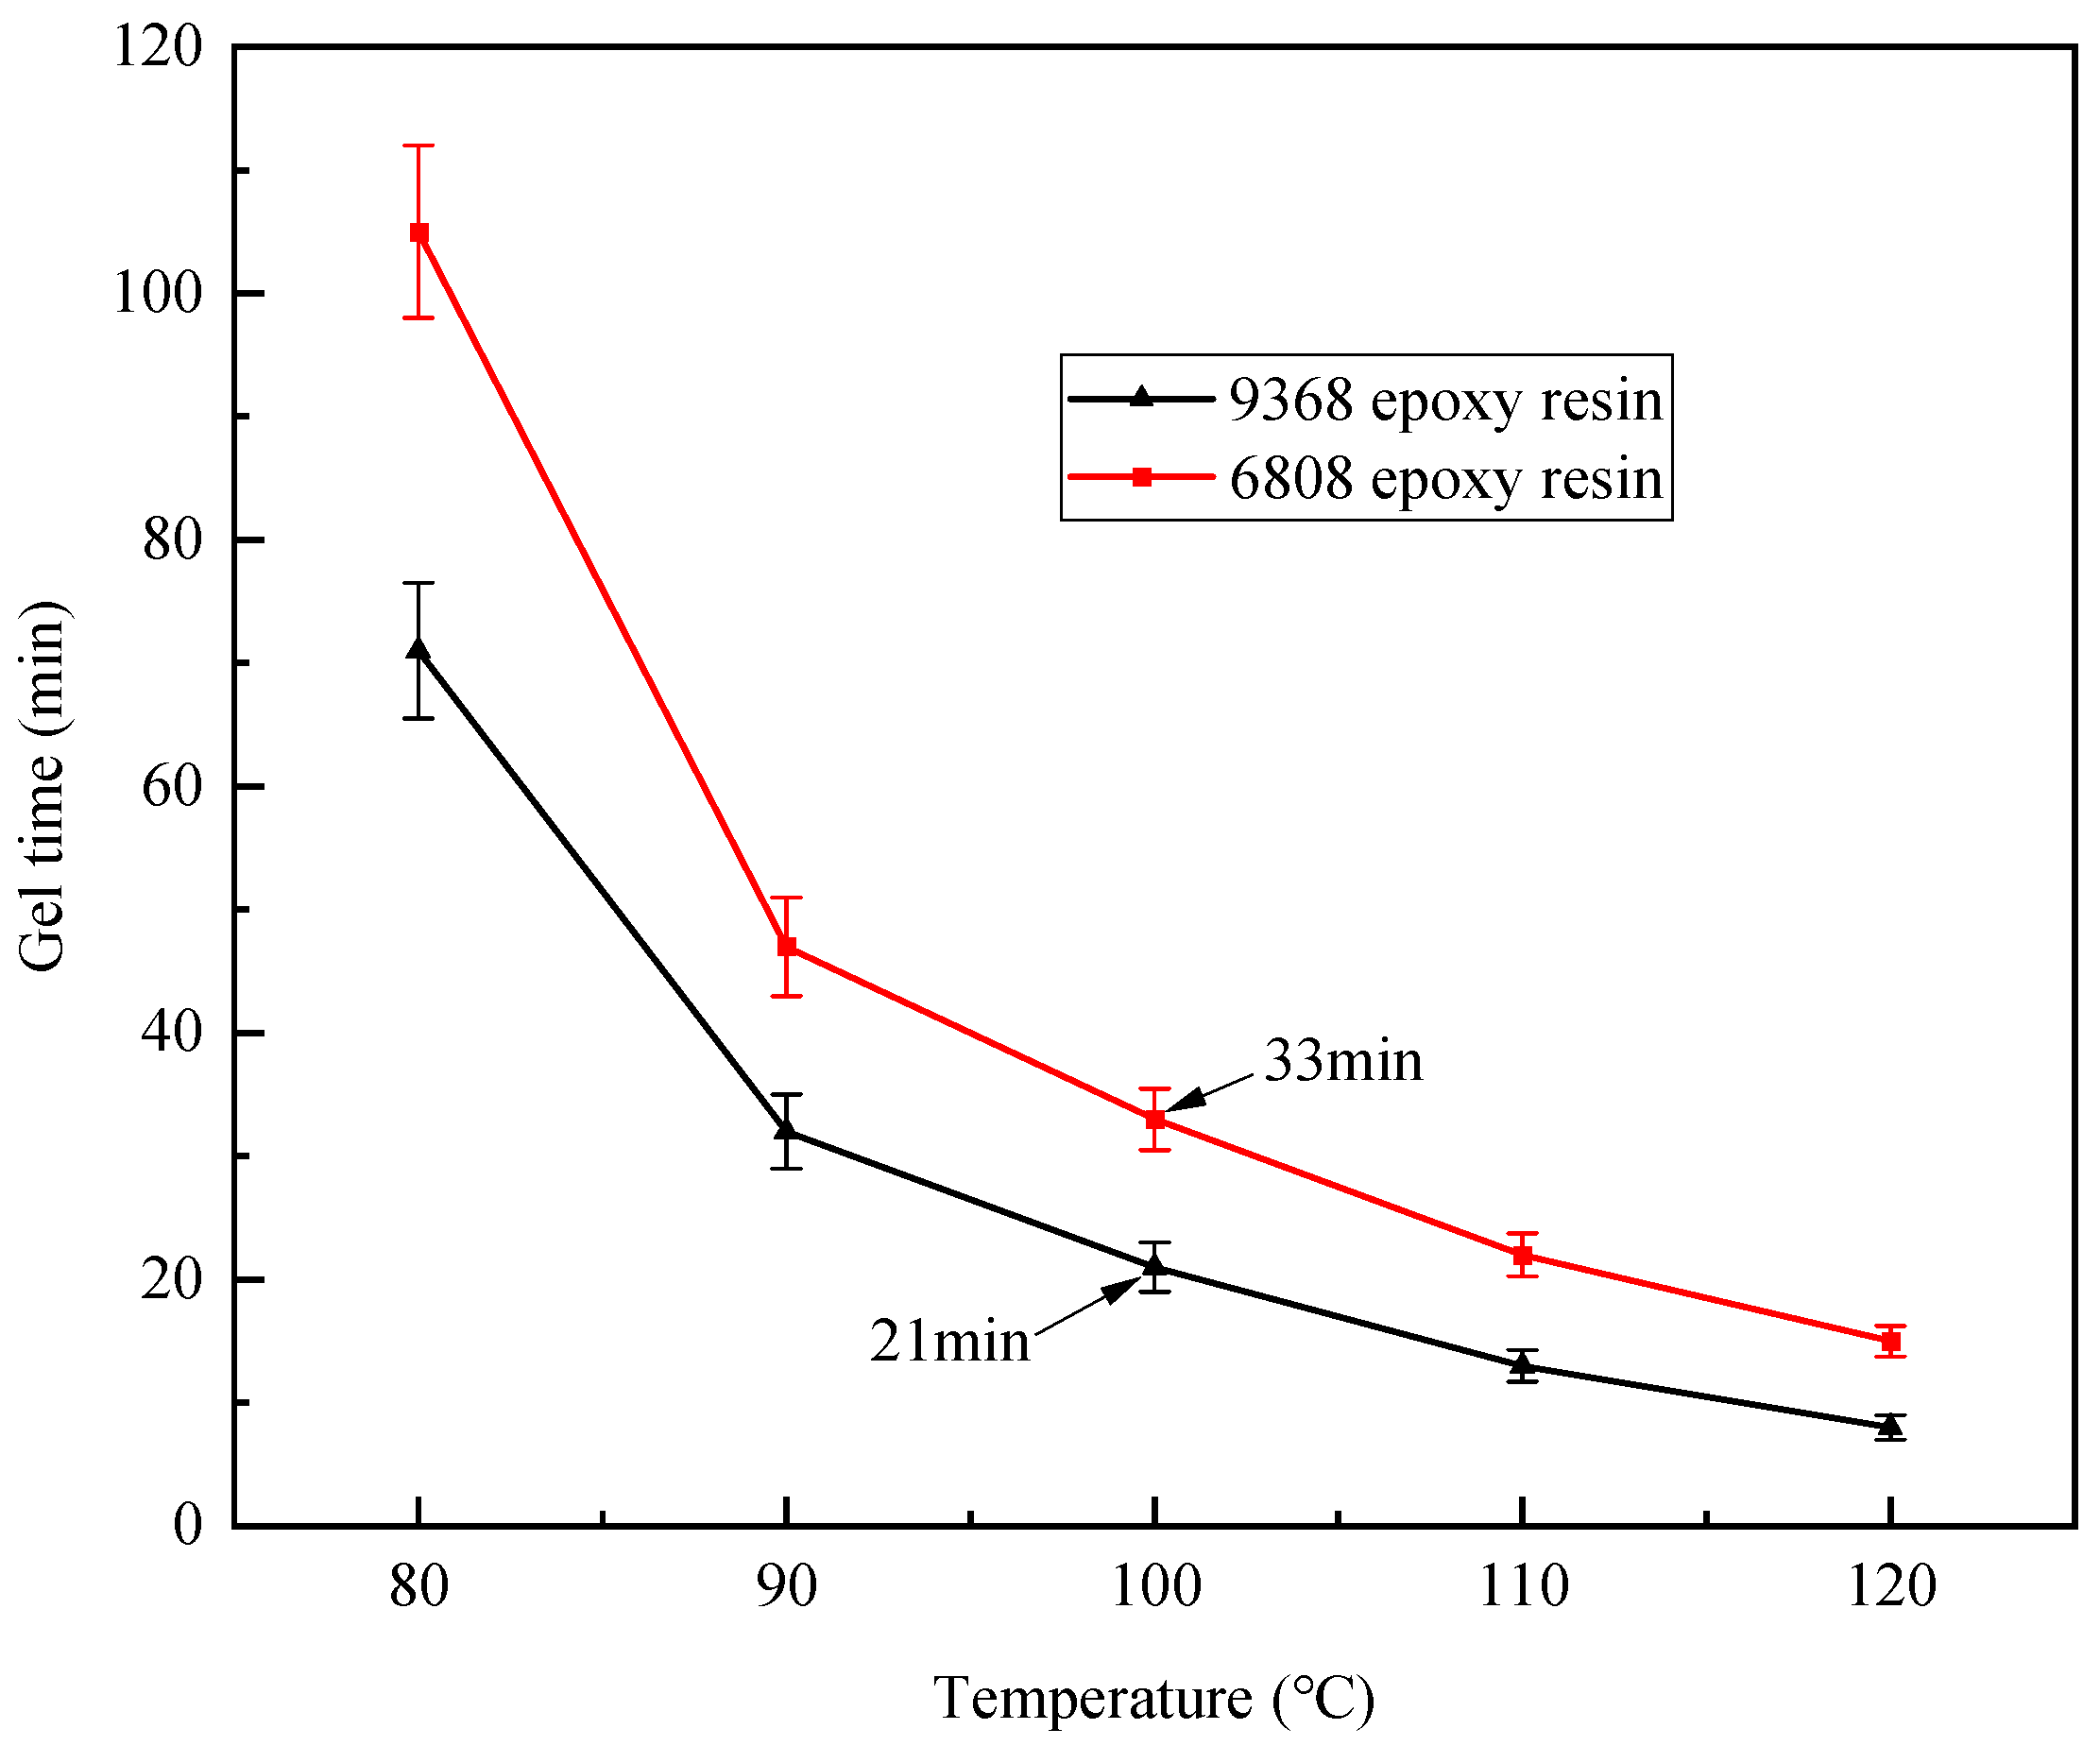
2.1. Test Methods
2.2. Co-Curing Resin System Design
2.3. Compatibility Analysis
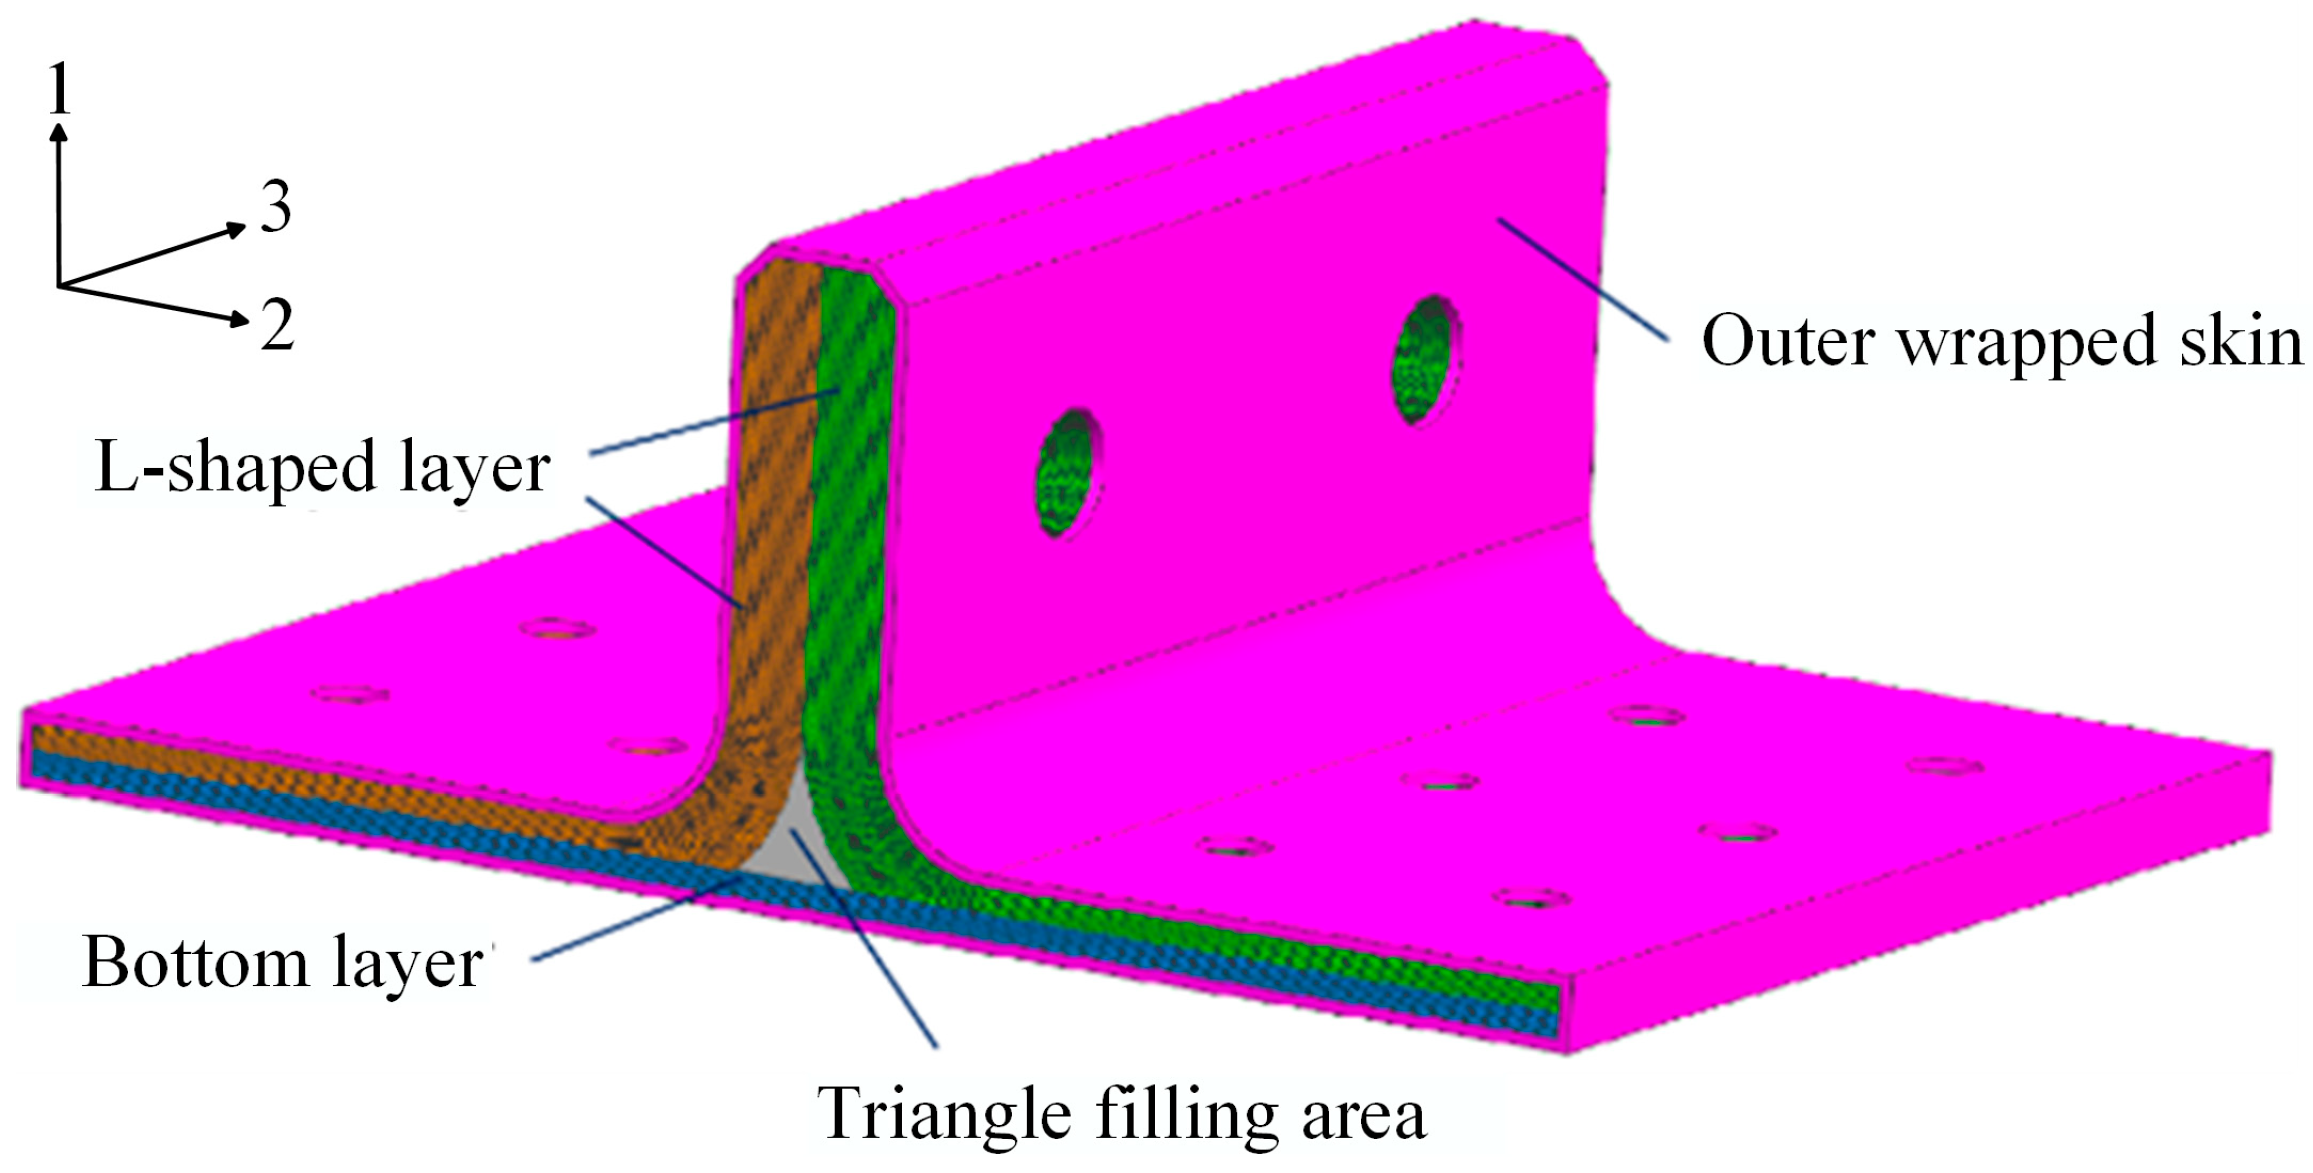
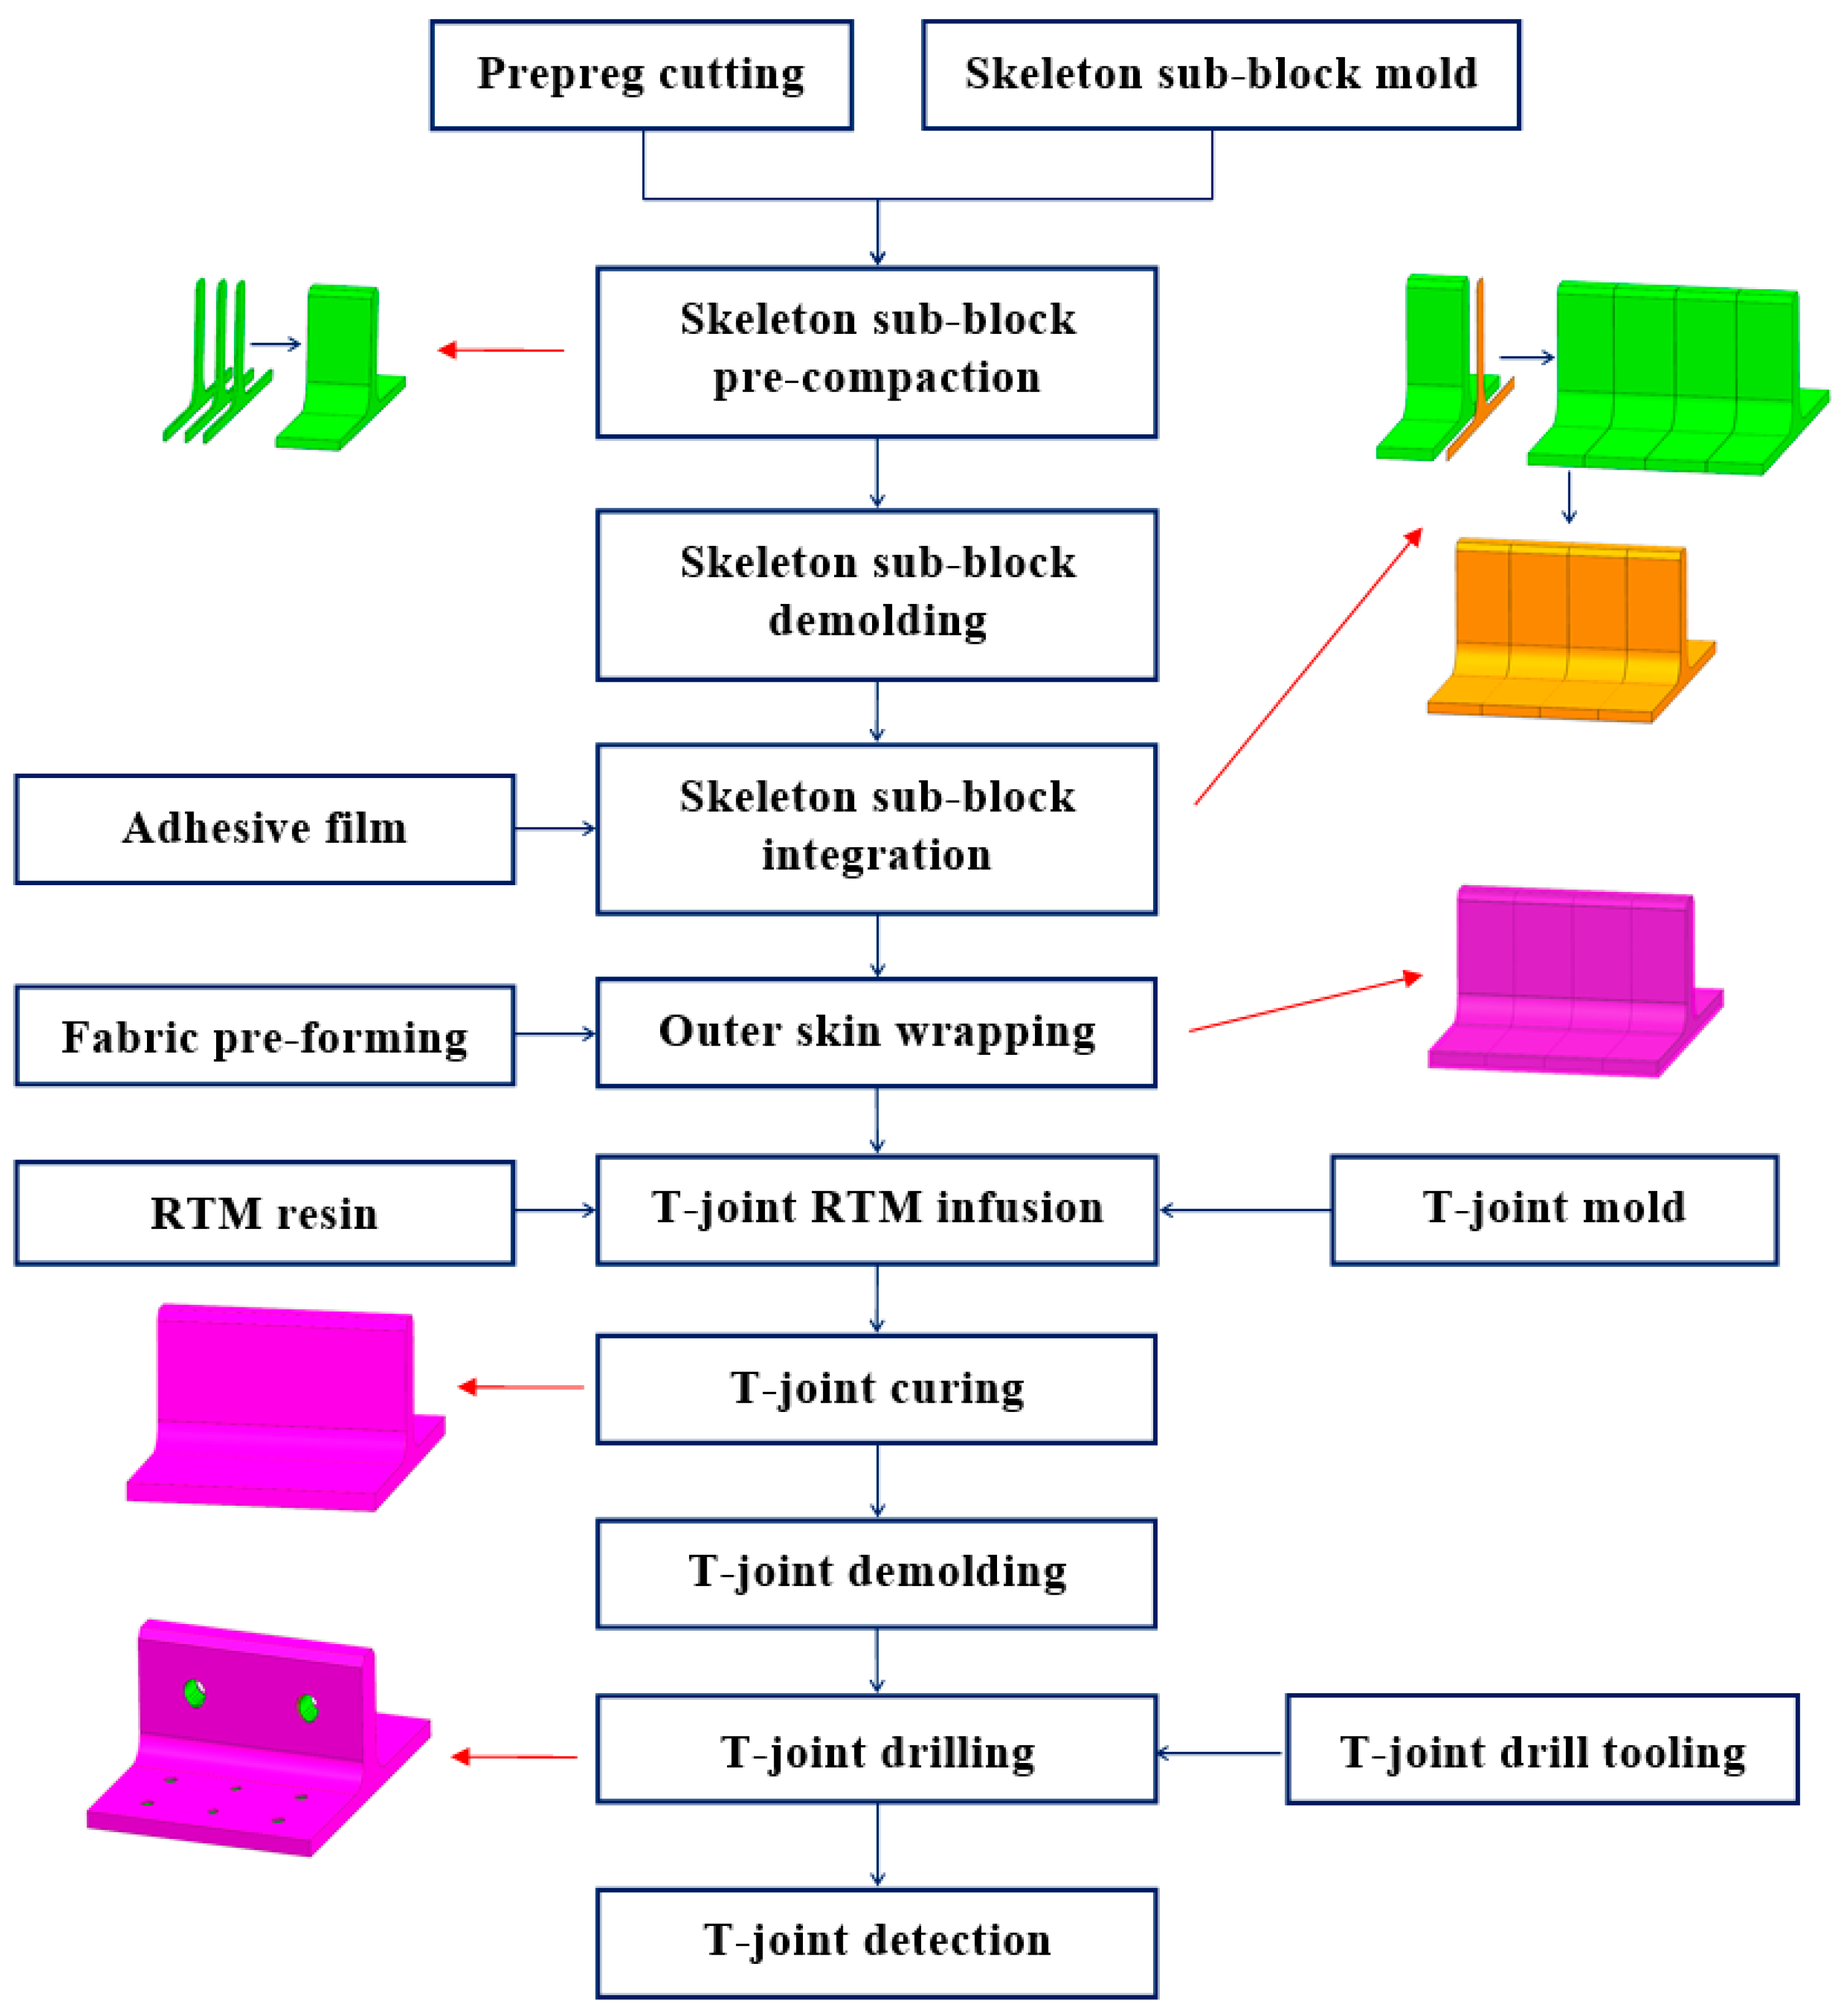
3. Process of Novel Configuration T-Joint
3.1. Process Design
3.2. RTM Injection Flow Analysis
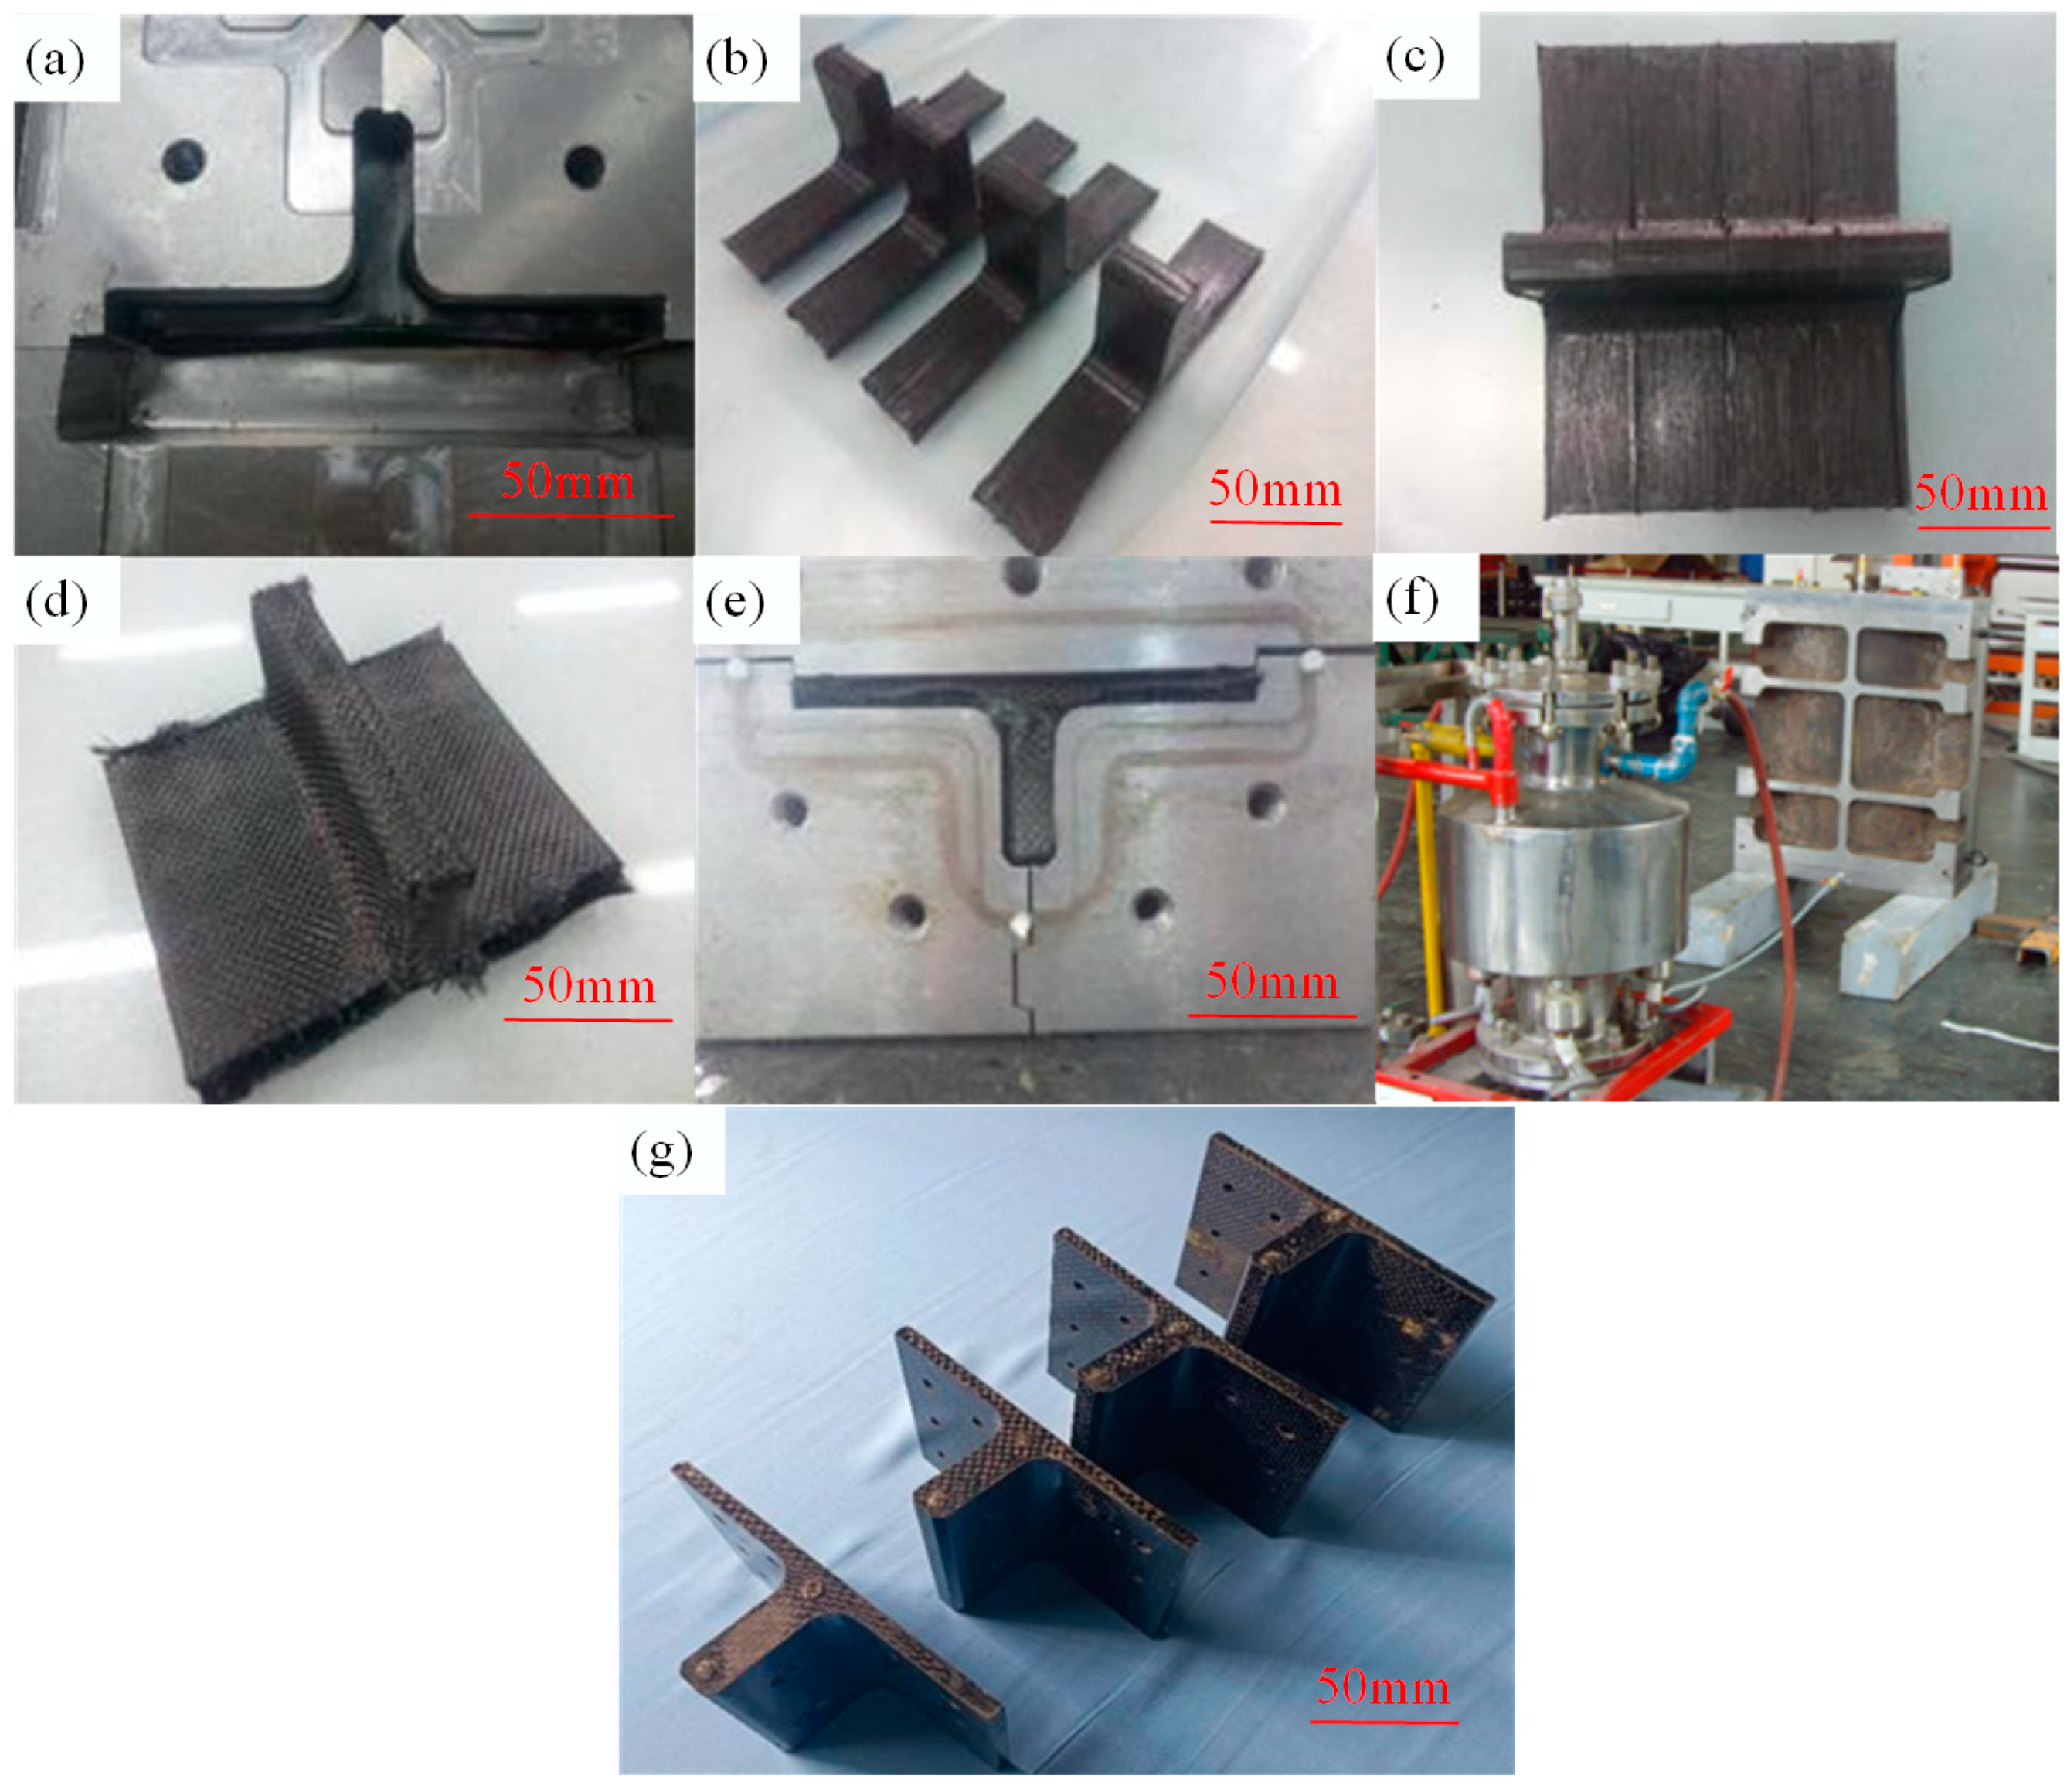
3.3. Preparation Procedure
4. Experiment
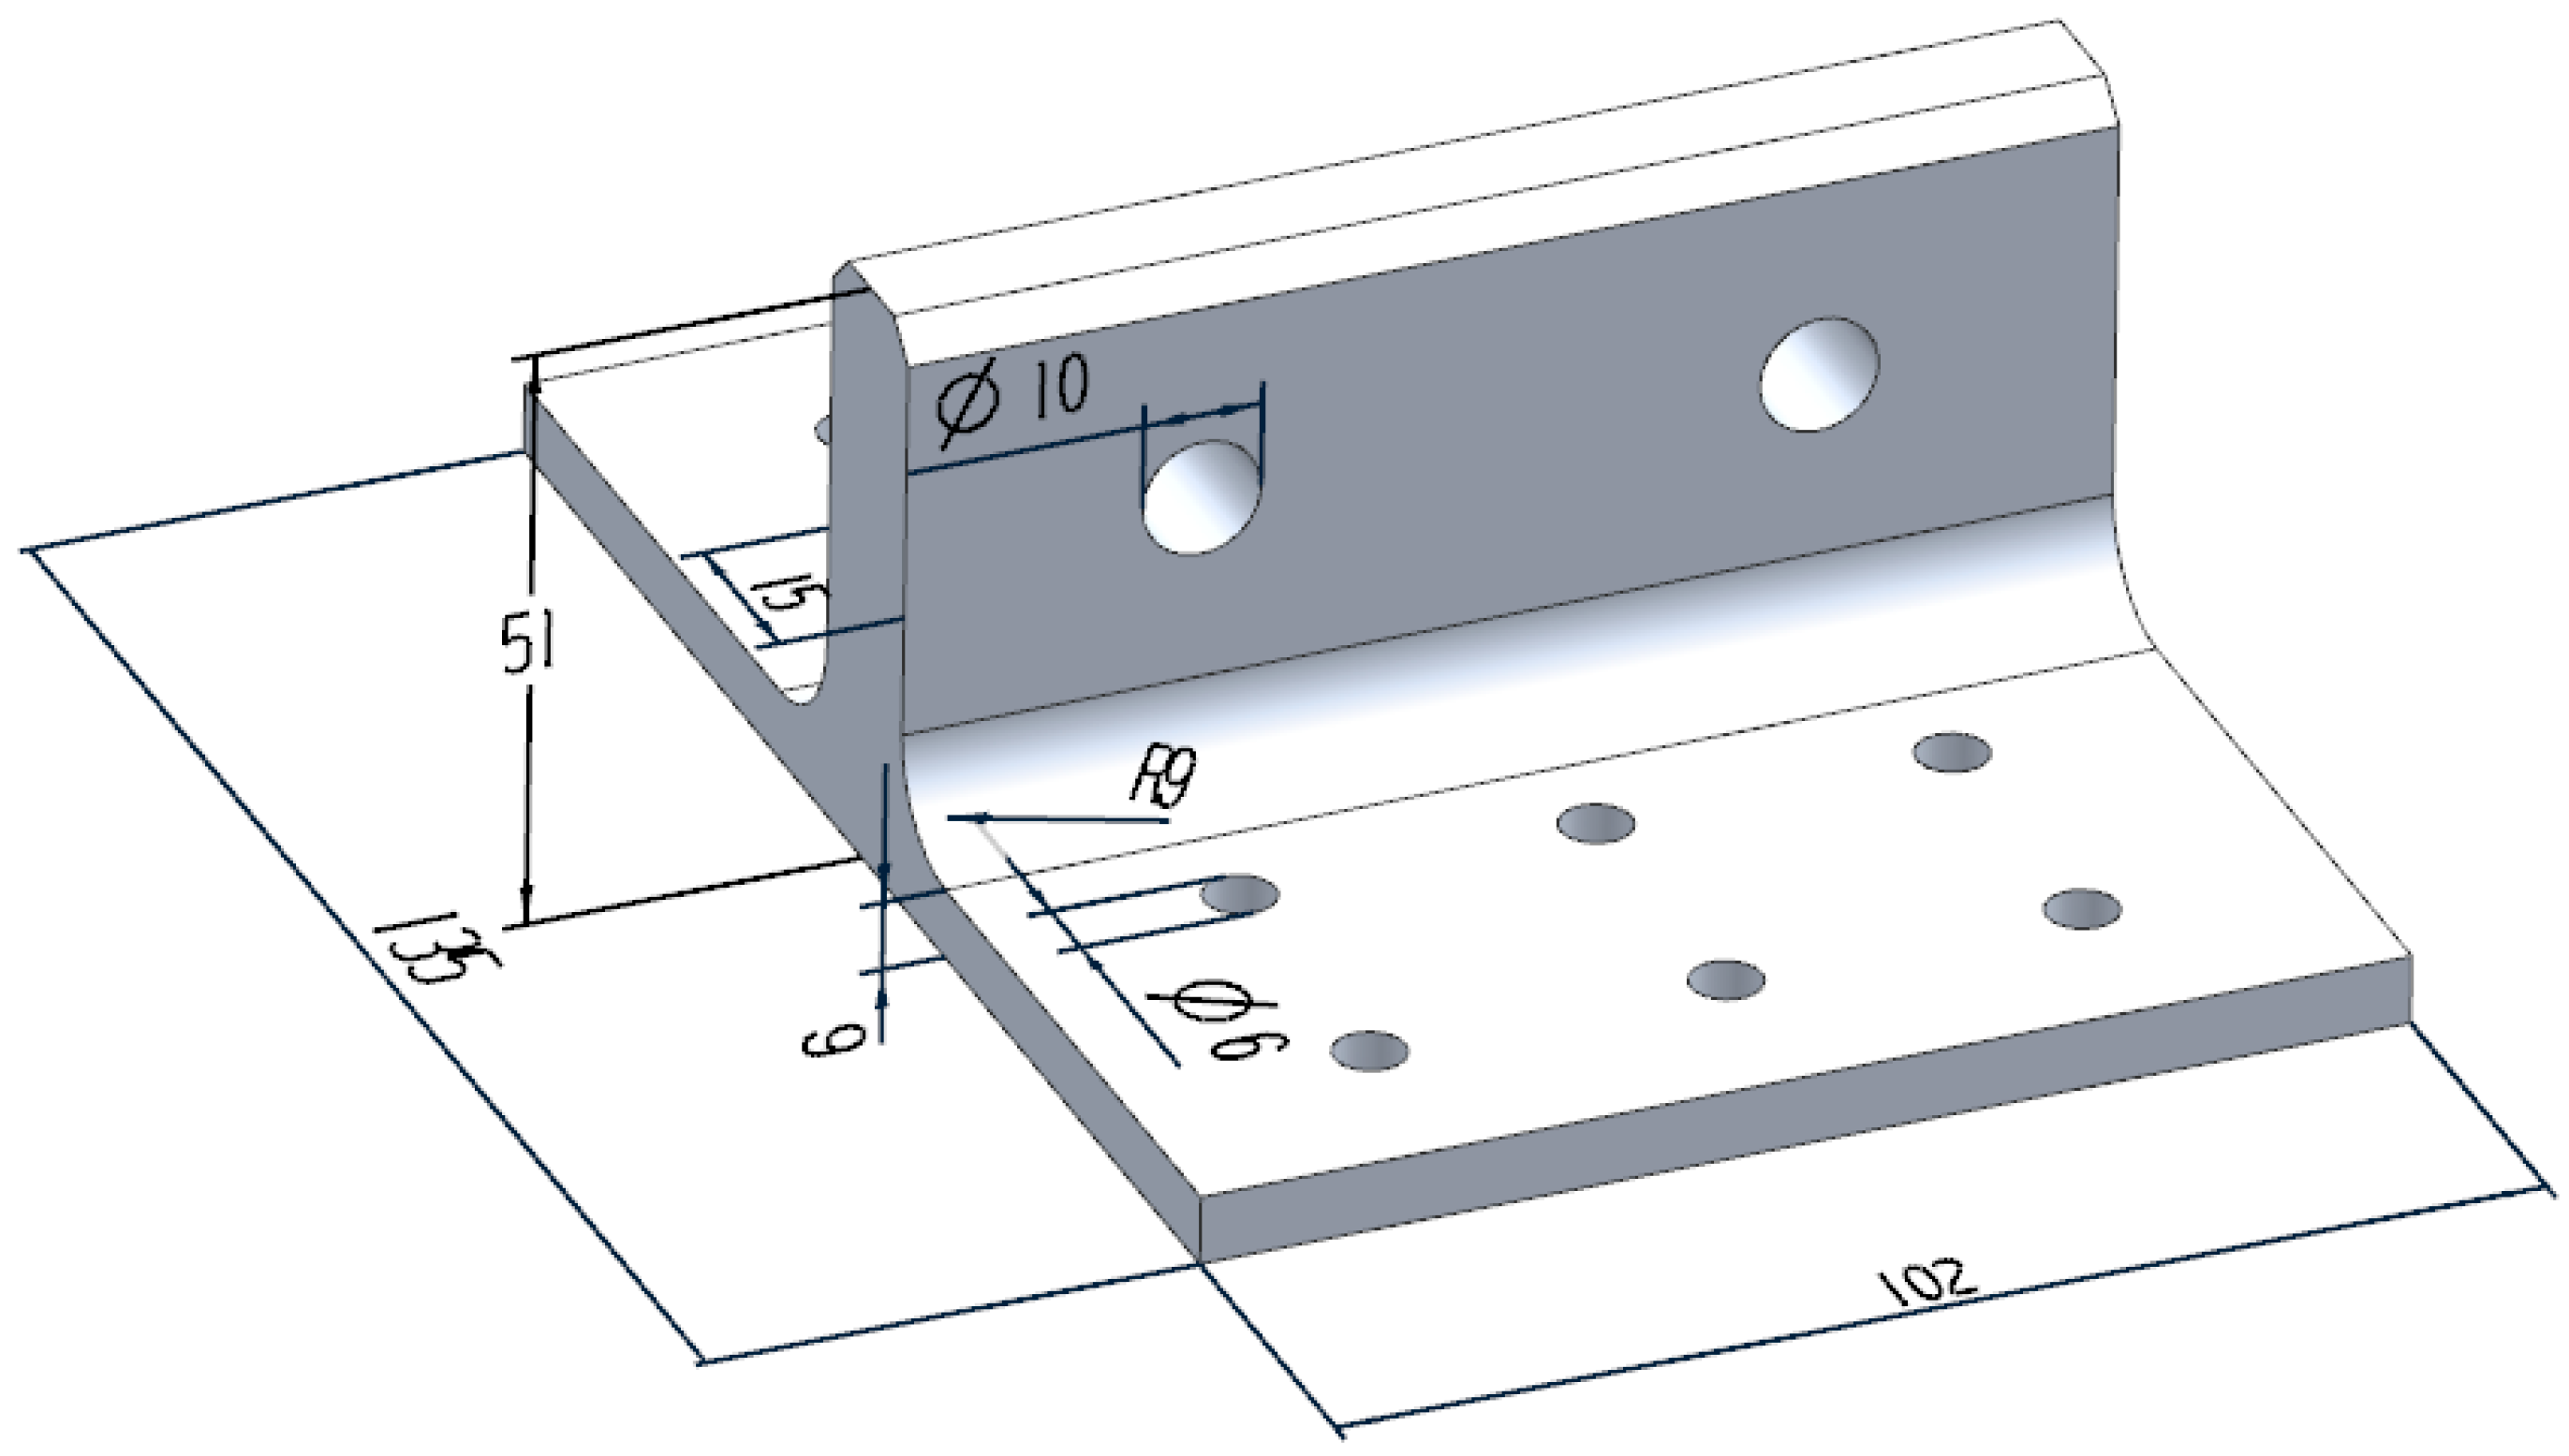
4.1. Specimens
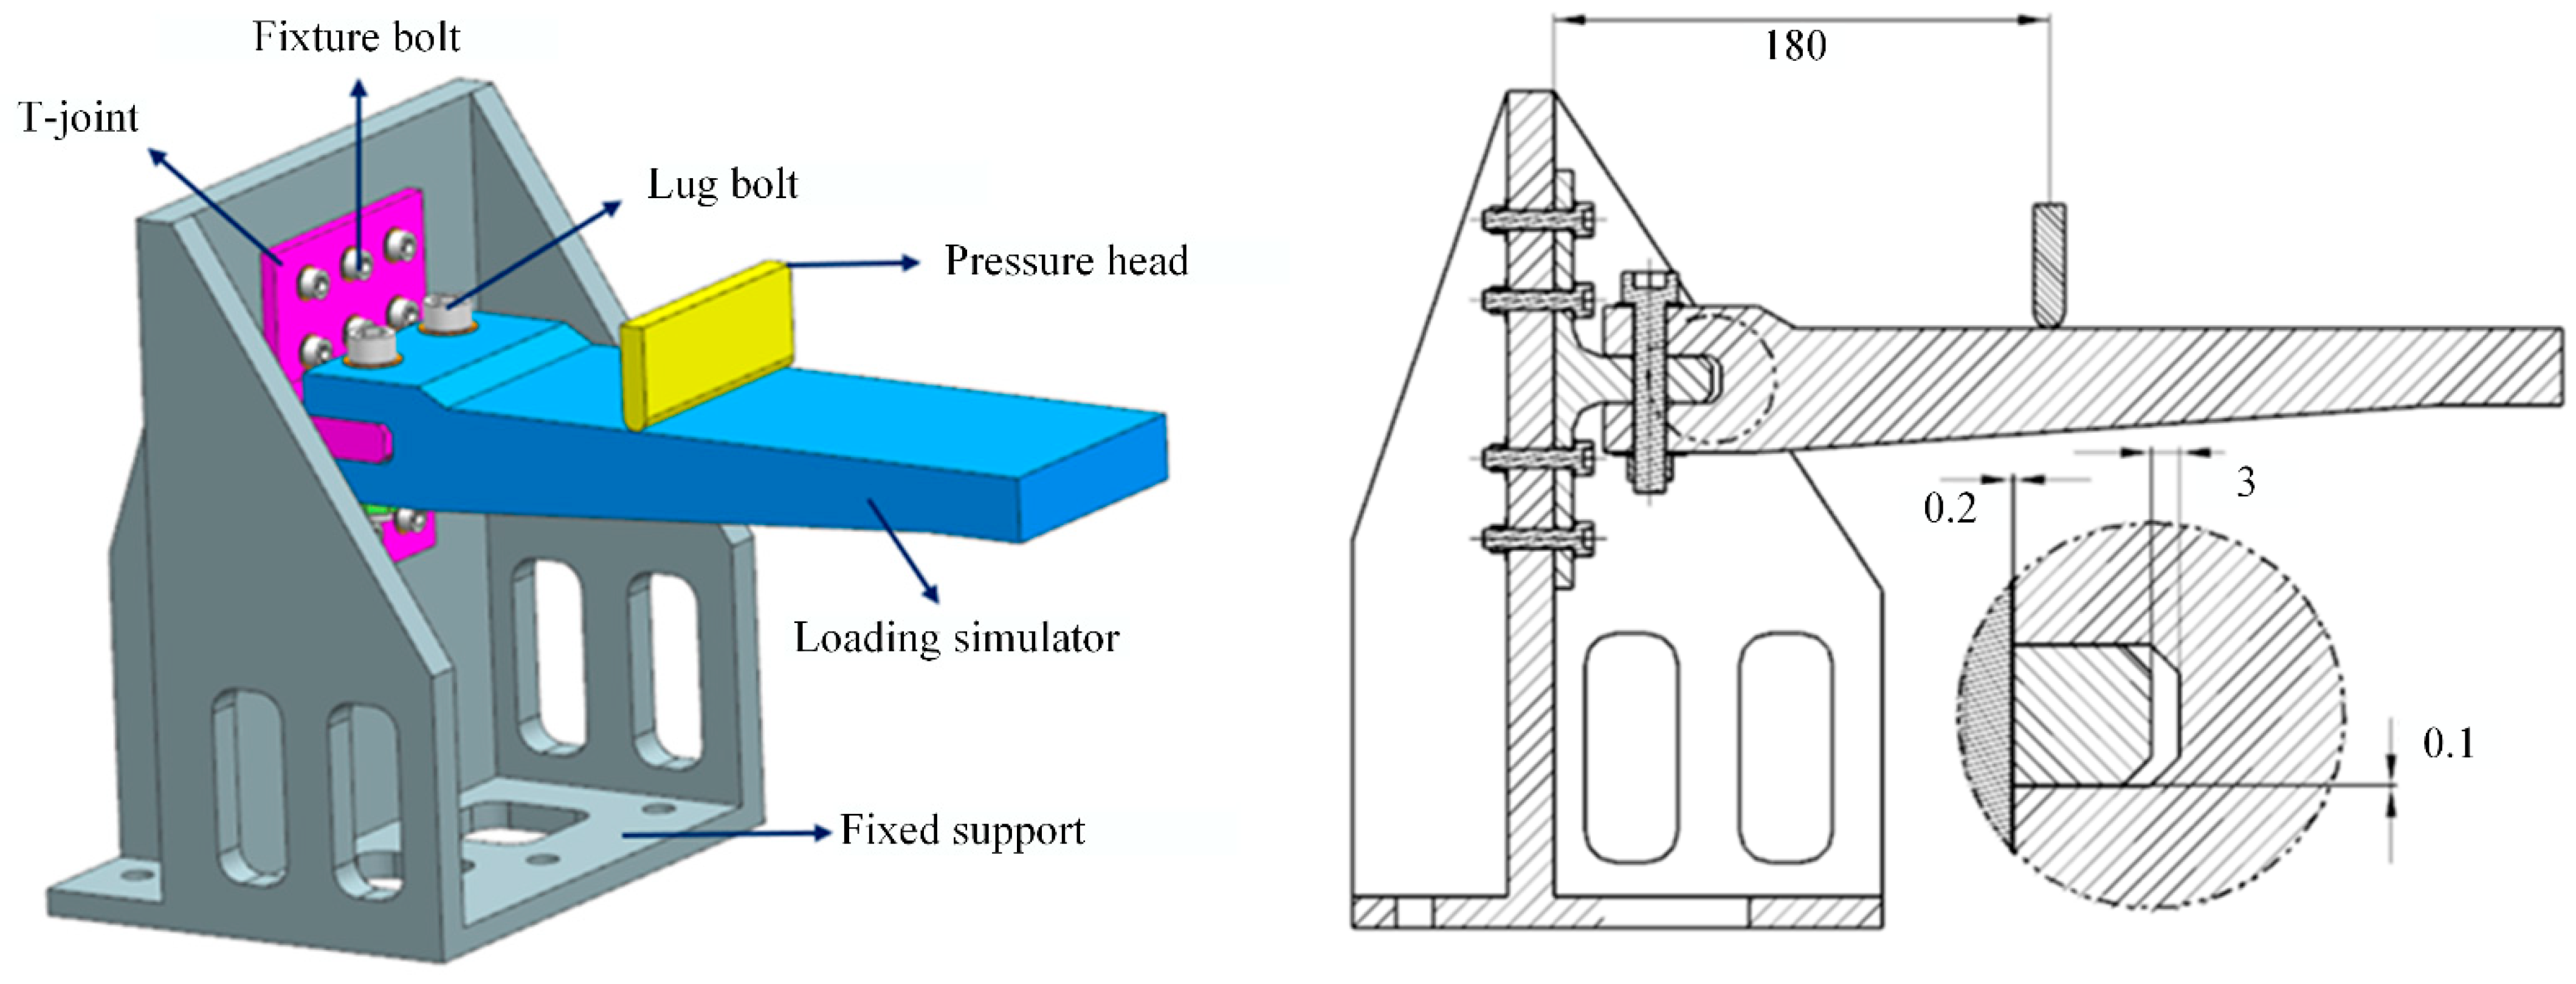
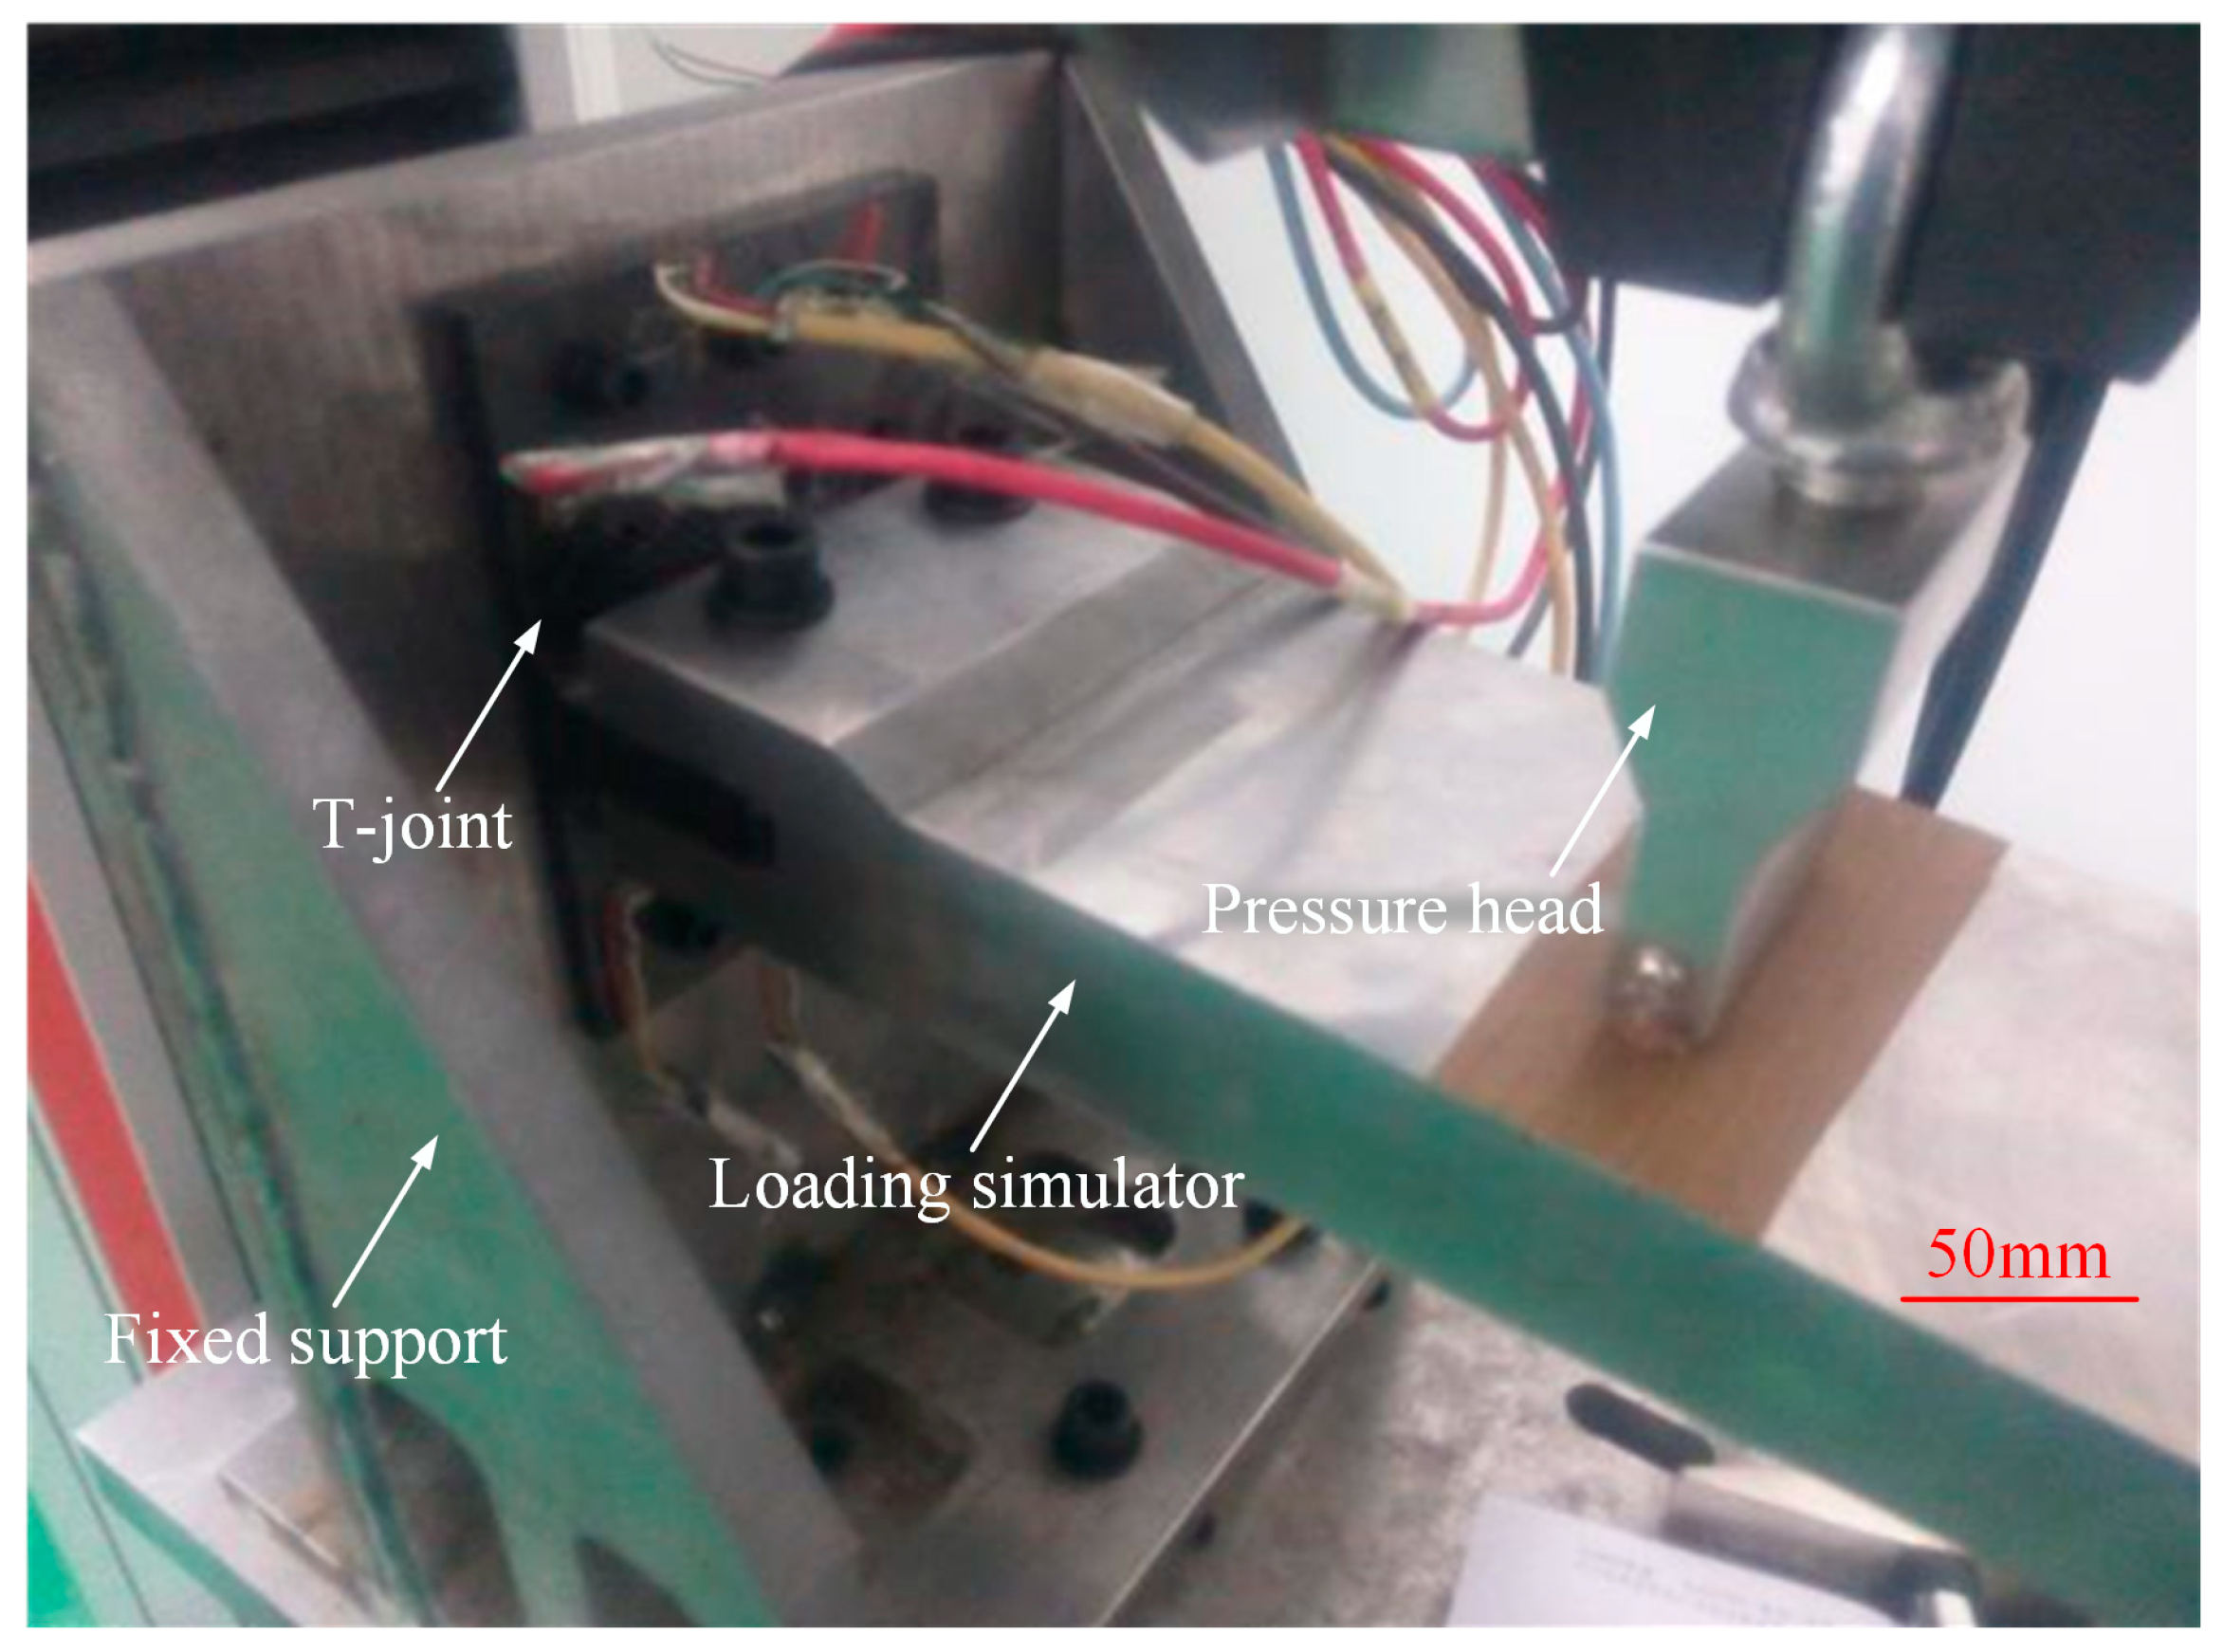
4.2. Test Procedure
5. Results and Discussion
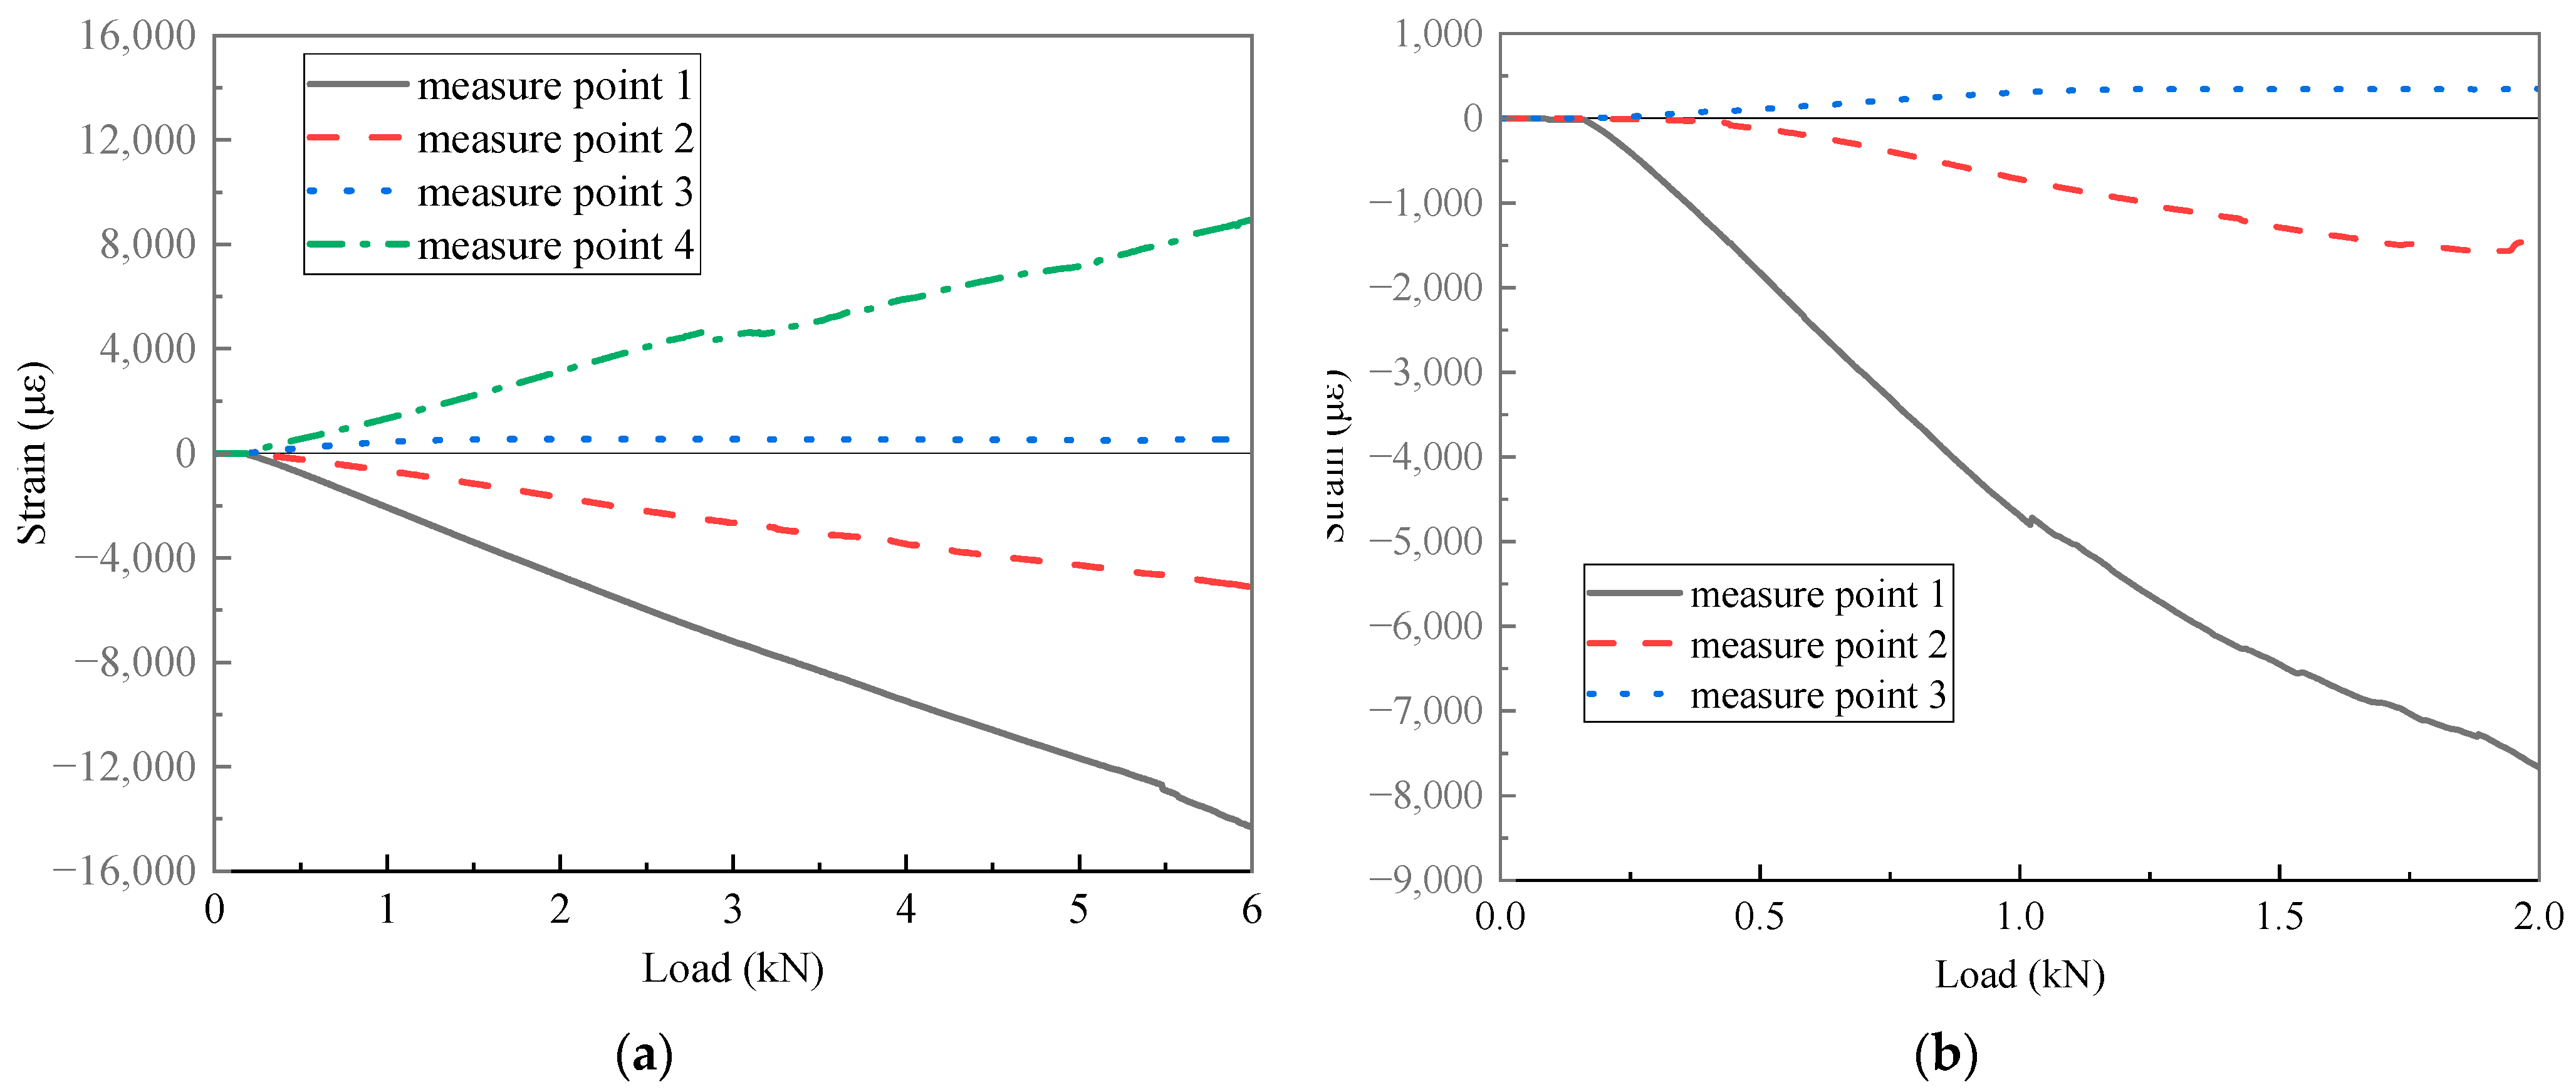
5.1. Interface Quality
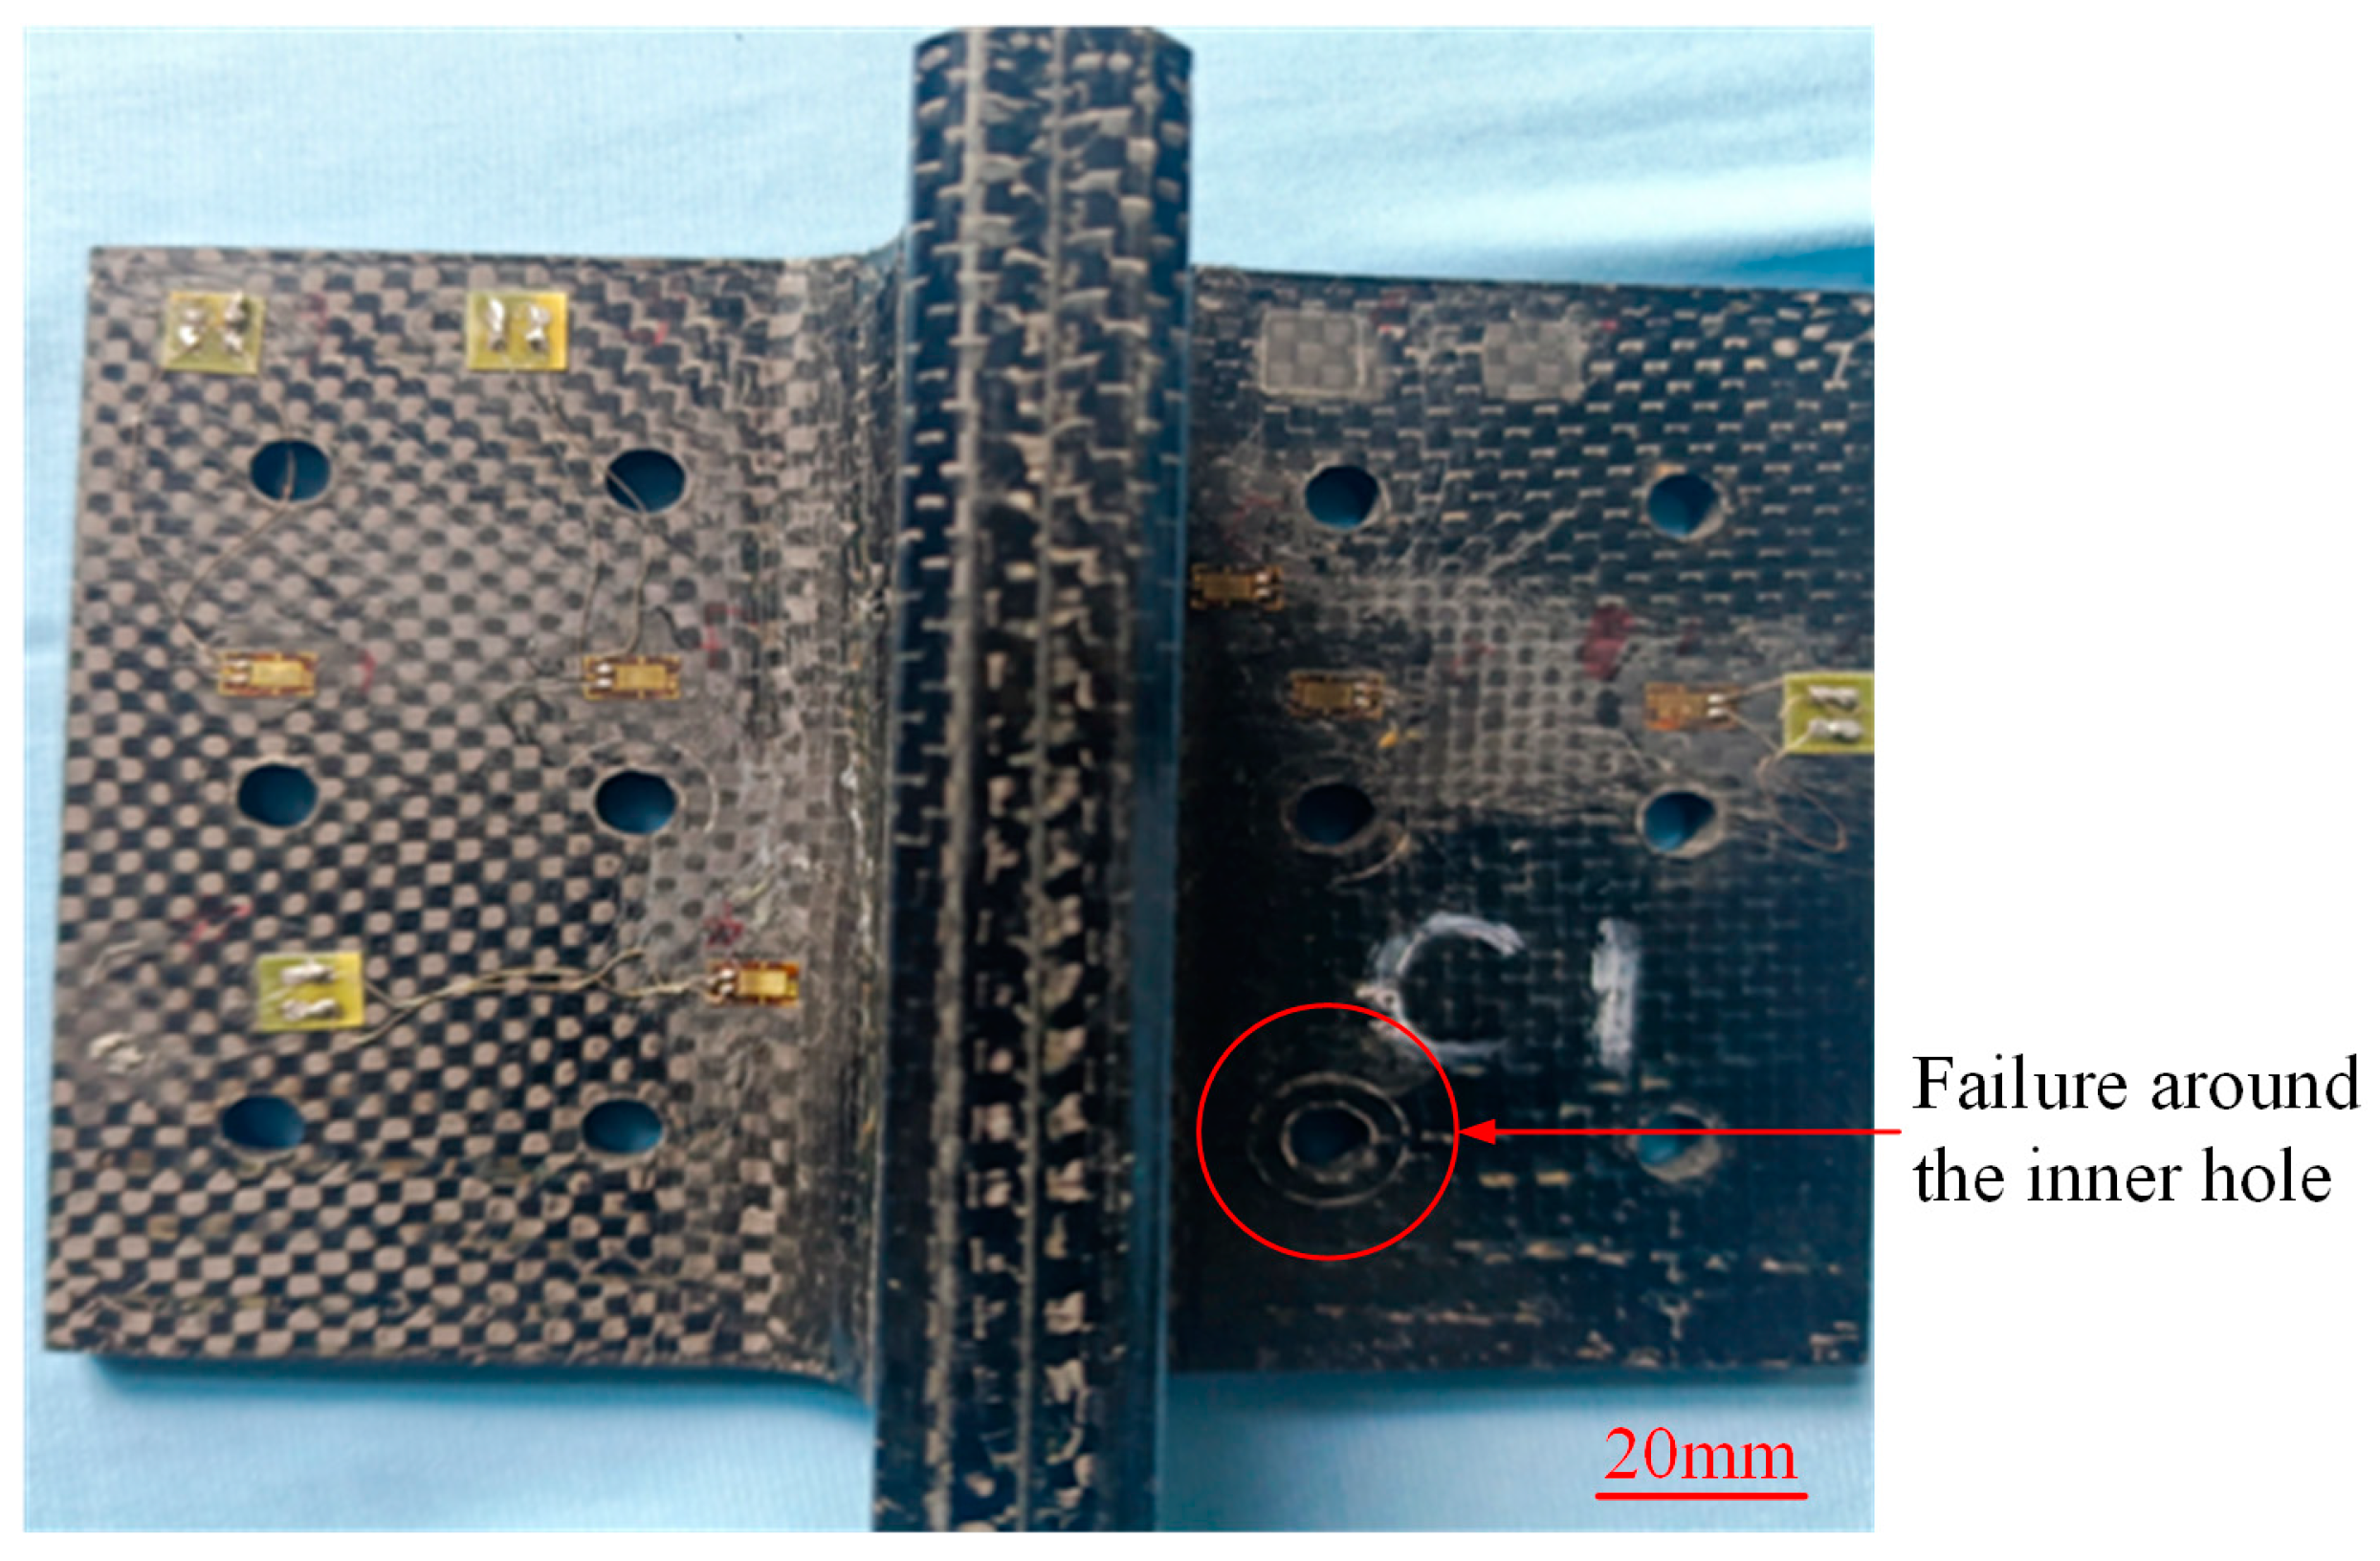
5.2. Failure Modes
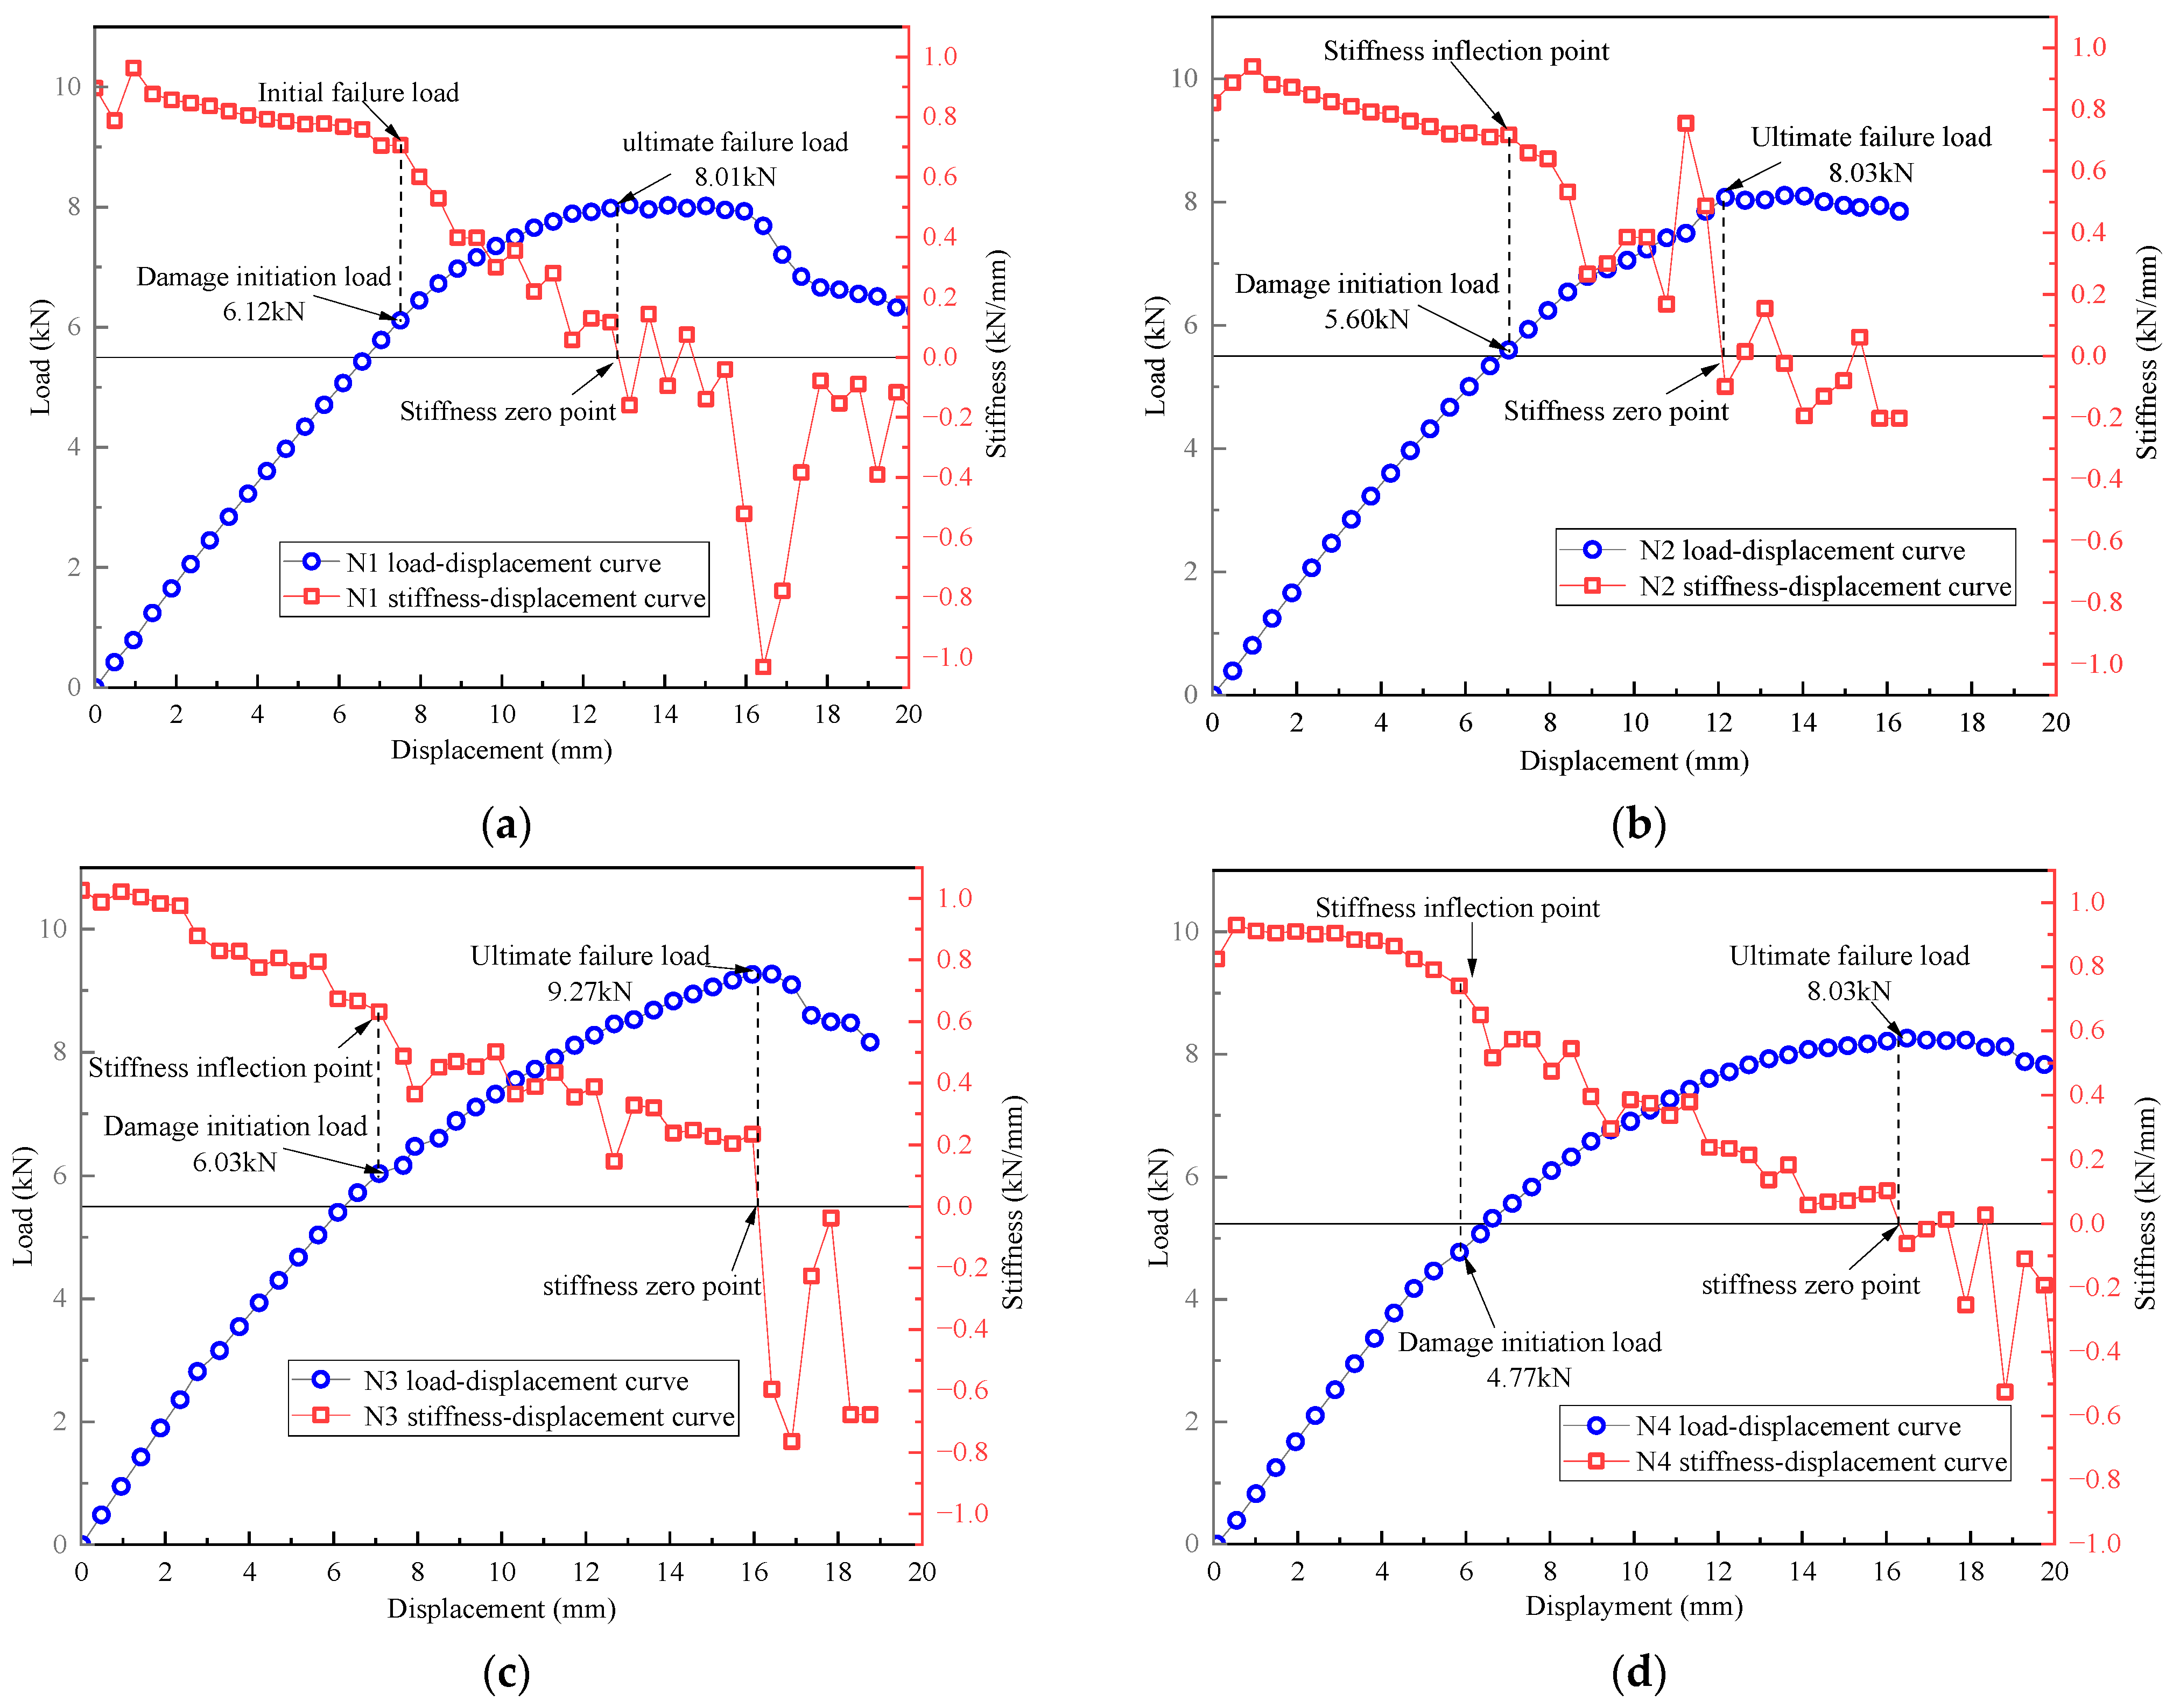
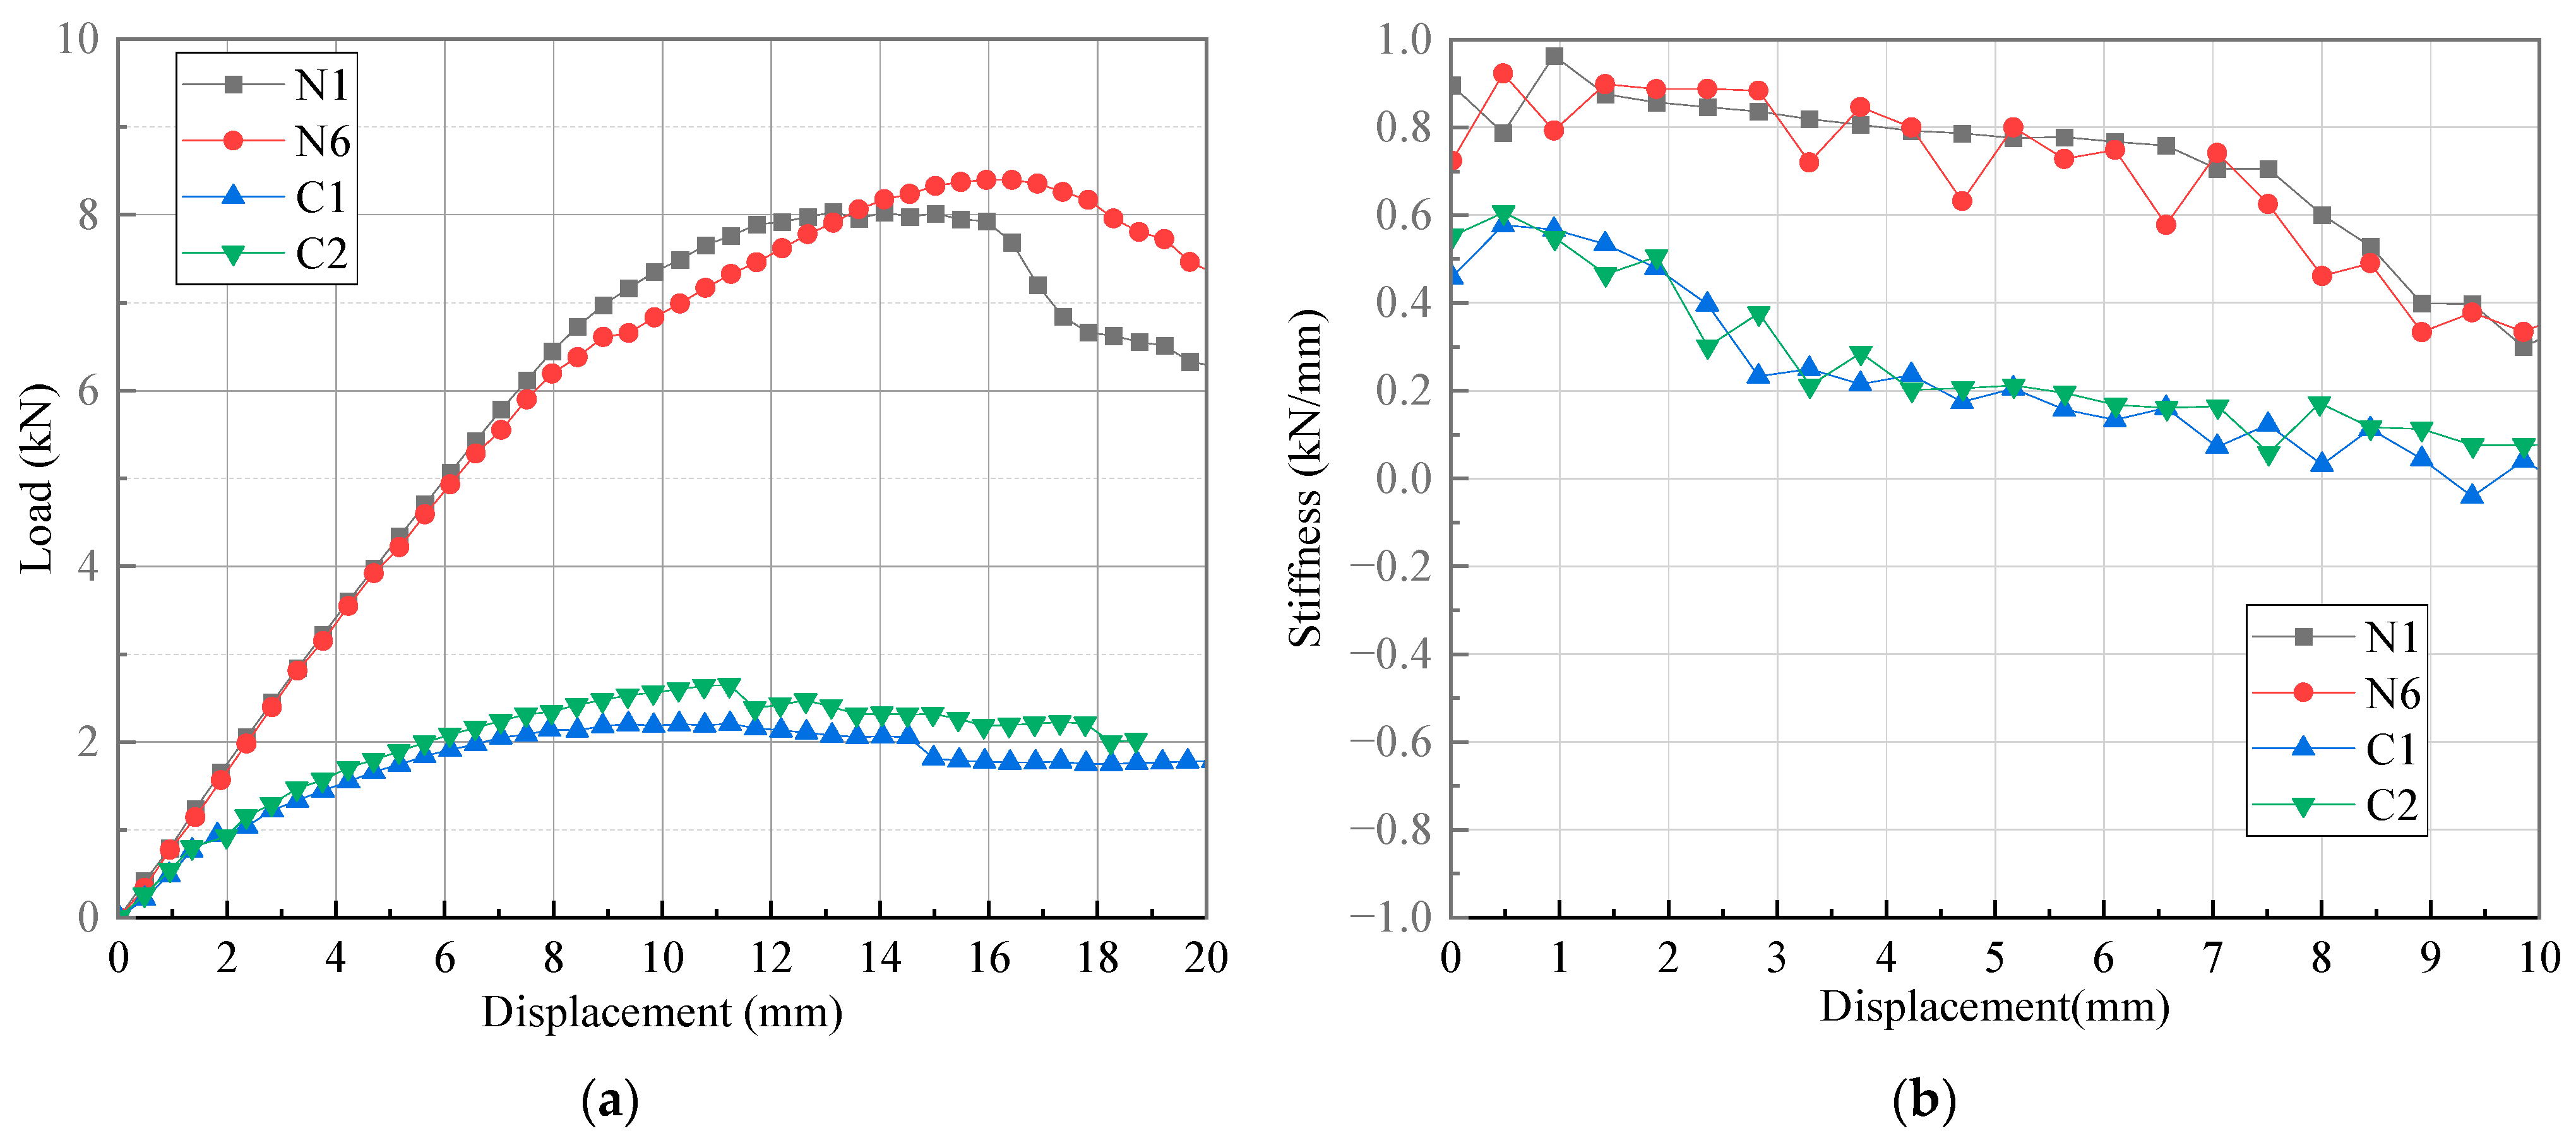
5.3. Bending Performances
5.4. Comparison among Three Types of Joints
5.5. Preparation Method Assessment
6. Conclusions
Author Contributions
Funding
Institutional Review Board Statement
Data Availability Statement
Conflicts of Interest
References
- Sápi, Z.; Butler, R.; Rhead, A. Filler materials in composite out-of-plane joints—A review. Compos. Struct. 2019, 207, 787–800. [Google Scholar] [CrossRef]
- Mrázová, M. Advanced Composite Materials of the Future in Aerospace Industry. Incas Bull. 2013, 5, 139–150. [Google Scholar] [CrossRef]
- McCarthy, M.; Stanley, W.; Lawlor, V. Bolt-Hole Clearance Test Results, Part 1: Static Tests; University of Limerick: Limerick, Ireland, 2001; pp. 1–86. [Google Scholar] [CrossRef]
- Peng, Y.Z. Research on Mechanical Properties of Composite T-Joints. Master’s Thesis, Nanjing University of Aeronautics and Astronautics, Nanjing, China, 2020. Available online: https://d.wanfangdata.com.cn/thesis/D02306639 (accessed on 15 August 2021).
- Thawre, M.M.; Pandey, K.N.; Dubey, A.; Verma, K.K.; Peshwe, D.R.; Paretkar, R.K.; Jagannathan, N.; Manjunatha, C.M. Fatigue life of a carbon fiber composite T-joint under a standard fighter aircraft spectrum load sequence. Compos. Struct. 2015, 127, 260–266. [Google Scholar] [CrossRef]
- Wu, H.; Xiao, J.Y.; Xing, S.L.; Wen, S.W.; Yang, F.B.; Yang, J.S. Numerical and experimental investigation into failure of T700/bismaleimide composite T-joints under tensile loading. Compos. Struct. 2015, 130, 63–74. [Google Scholar] [CrossRef]
- Zhao, L.B.; Gong, Y.; Zhang, J.Y. A survey on delamination growth behavior in fiber reinforced composite laminates. Acta Aeronaut. Astronaut. Sin. 2019, 40, 522509. [Google Scholar] [CrossRef]
- Wu, H.; Xiao, J.Y.; Xing, S.L.; Wen, S.W.; Yang, F.B.; Yang, J.S. Failure analysis of composite T-joints under bending load. J. Natl. Univ. Def. Technol. 2016, 38, 56–62. [Google Scholar] [CrossRef]
- Kim, C.H.; Jo, D.H.; Choi, J.H. Failure strength of composite T-joints prepared using a new 1-thread stitching process. Compos. Struct. 2017, 178, 225–231. [Google Scholar] [CrossRef]
- Bigaud, J.; Aboura, Z.; Martins, A.T.; Verger, S. Analysis of the mechanical behavior of composite T-joints reinforced by one side stitching. Compos. Struct. 2018, 184, 249–255. [Google Scholar] [CrossRef]
- Zhang, H.; He, R.; Hou, B.; Li, Y.L.; Cui, H.; Yang, W. Artificial hail ice impact damage of laminated composite T-joint with stitching reinforcement. Compos. Struct. 2021, 278, 114714. [Google Scholar] [CrossRef]
- Chen, B.; Dong, W.; Zhao, J.; Zhao, Y.; Wang, L.L.; Li, X.P.; Li, M.J.; Chen, P.H. Reinforcing effect of lock stitching with small density on the tensile properties of composite T-joints. Thin-Walled Struct. 2022, 177, 109411. [Google Scholar] [CrossRef]
- Cartie, D.D.R.; Dell’Anno, G.; Poulin, E.; Partridge, I.K. 3D reinforcement of stiffener-to-skin T-joints by Z-pinning and tufting. Eng. Fract. Mech. 2006, 73, 2532–2540. [Google Scholar] [CrossRef]
- Koh, T.M.; Feih, S.; Mouritz, A.P. Experimental determination of the structural properties and strengthening mechanisms of z-pinned composite T-joints. Compos. Struct. 2011, 93, 2222–2230. [Google Scholar] [CrossRef]
- Zhou, J.W.; Shi, Y.Y.; Zuo, Y.J.; Shan, C.W.; Gu, Z.Y. Experimental investigation into influences of Z-pin and deltoid on structural properties and damage tolerance of CFRP T-joints. Compos. Part B Eng. 2022, 237, 109875. [Google Scholar] [CrossRef]
- Bai, J.B.; Dong, C.H.; Xiong, J.J.; Luo, C.Y.; Chen, D. Progressive damage behaviour of RTM-made composite T-joint under tensile loading. Compos. Part B Eng. 2019, 160, 488–497. [Google Scholar] [CrossRef]
- Sapi, Z.; Hutchins, S.; Butler, R.; Rhead, A. Novel filler materials for composite out-of-plane joints. Compos. Struct. 2019, 229, 111382. [Google Scholar] [CrossRef]
- Hélénon, F.; Wisnom, M.R.; Hallett, S.R.; Trask, R.S. Numerical investigation into failure of laminated composite T-piece specimens under tensile loading. Compos. Part A Appl. Sci. Manuf. 2012, 43, 1017–1027. [Google Scholar] [CrossRef]
- Chen, G.; Li, Z.N.; Cheng, X.Q.; Kou, C.H. Study on Compressive Properties of Stitched Laminates. Acta Aeronaut. Astronaut. Sin. 2006, 27, 444. [Google Scholar] [CrossRef]
- Mouritz, A.P. Review of z-pinned composite laminates. Compos. Part A Appl. Sci. Manuf. 2007, 38, 2383–2397. [Google Scholar] [CrossRef]
- Li, C.H.; Yan, Y.; Cui, Y.B.; Qi, D.S.; Wen, Y.H. Experiment and simulation study on tensile properties of Z-pinned composite laminates. Acta Aeronaut. Astronaut. Sin. 2010, 31, 2435–2441. [Google Scholar]
- Zhang, T.; Luo, Z.T.; Li, K.N.; Cheng, X.Q. Experimental and Numerical Investigation of Prepreg-RTM Co-Curing Molding Composite Bolted T-joint under Bending Load. Preprints 2024, 2024021731. [Google Scholar] [CrossRef]
- Zhao, A.A.; Yang, W.K.; Yu, F.; Liu, W.H.; Lu, S.H. RTM Process for Large-Scale and High-Performances Composite Components. J. Nanjing Univ. Aeronaut. Astronaut. 2020, 52, 39–47. [Google Scholar] [CrossRef]
- Li, W.D.; Liu, G.; Bao, J.W.; Hu, X.L.; Yi, X. su Research of Processing Characteristics and Mechanical Properties of Semi-Prepreg RTM Composites. J. Aeronaut. Mater. 2014, 34, 57–62. [Google Scholar] [CrossRef]
- Fu, Y.; Yao, X. A Review on Manufacturing Defects and Their Detection of Fiber Reinforced Resin Matrix Composites. Compos. Part C Open Access 2022, 8, 100276. [Google Scholar] [CrossRef]
- Cheng, X.; Xiong, J.; Peng, B.; Cheng, Z.; Li, H. Mechanical Properties of RTM-Made Composite Cross-Joints. Chin. J. Aeronaut. 2009, 22, 211–217. [Google Scholar] [CrossRef]
- Xu, W.W.; Gu, Y.Z.; Li, M.; Ma, X.Q.; Zhang, D.M.; Zhang, Z.G. Co-curing Process Combining Resin Film Infusion with Prepreg and Co-cured Interlaminar Properties of Carbon Fiber Composites. J. Compos. Mater. 2014, 48, 1709–1724. [Google Scholar] [CrossRef]
- Akin, M.; Oztan, C.; Akin, R.; Coverstone, V.; Zhou, X. Co-cured Manufacturing of Multi-cell Composite Box Beam Using Vacuum Assisted Resin Transfer Molding. J. Compos. Mater. 2021, 55, 4469–4480. [Google Scholar] [CrossRef]
- Moretti, L.; Olivier, P.; Castanié, B.; Bernhart, G. Experimental Study and In-Situ FBG Monitoring of Process-Induced Strains during Autoclave Co-Curing, Co-Bonding and Secondary Bonding of Composite Laminates. Compos. Part A Appl. Sci. Manuf. 2021, 142, 106224. [Google Scholar] [CrossRef]
- ASTM D7028—07; Standard Test Method for Glass Transition Temperature (DMA Tg) of Polymer Matrix Composites by Dynamic Mechanical Analysis (DMA). ASTM International: West Conshohocken, PA, USA, 2015.
- GB/T 2794—2022; Determination for Viscosity of Adhesives. Standardization Administration: Beijing, China, 2022.
- GB/T 265—88; Petroleum Products—Determination of Kinematic Viscosity and Calculation of Dynamic Viscosity. Standardization Administration: Beijing, China, 1988.
- ASTM D3532/D3532M—19; Standard Test Method for Gel Time of Carbon Fiber-Epoxy Prepreg. ASTM International: West Conshohocken, PA, USA, 2019.
- ISO 11357—2: 2020; Plastics—Differential Canning Calorimetry (DSC)—Part 2: Determination of Glass Transition Temperature and Step Height. International Standard: Geneva, Switzerland, 2020.
- Deléglise, M.; Le Grognec, P.; Binetruy, C.; Krawczak, P.; Claude, B. Modeling of High Speed RTM Injection with Highly Reactive Resin with On-Line Mixing. Compos. Part A Appl. Sci. Manuf. 2011, 42, 1390–1397. [Google Scholar] [CrossRef]


| Specimen | Number of Specimens | Density (g/cm3) | Triangle Filling Area | Stacking Sequence of the Skin |
|---|---|---|---|---|
| N1 | 1 | 1.55 | \ | [((0/90)f)5] |
| N2 | 1 | [02/±45/(0/90)f] | ||
| N3 | 1 | [902/±45/(0/90)f] | ||
| N4 | 1 | [904/(0/90)f] | ||
| N5 | 1 | [(±45)2/(0/90)f] | ||
| N6 | 1 | [04/(0/90)f] | ||
| C1, C2 | 2 | 1.55 | Twisted fibers | [((0/90)f)5] |
| AL1, AL2 | 2 | 2.7 | \ | \ |
| Specimen | Novel T-Joint | Conventional T-Joint | Aluminum T-Joint | |||||||
|---|---|---|---|---|---|---|---|---|---|---|
| N1 | N2 | N3 | N4 | N5 | N6 | C1 | C2 | Al-1 | Al-2 | |
| Initial stiffness (kN/mm) | 0.85 | 0.87 | 0.99 | 0.91 | 0.95 | 0.89 | 0.56 | 0.54 | 1.07 | 1.12 |
| Average value | 0.91 | 0.55 | 1.10 | |||||||
| Relative value | 82.73% | 50.00% | 100% | |||||||
| Relative value with consideration of density * | 144.11% | 87.10% | 100% | |||||||
| Specimen | Novel T-Joint | Conventional T-Joint | ||||||
|---|---|---|---|---|---|---|---|---|
| N1 | N2 | N3 | N4 | N5 | N6 | C1 | C2 | |
| Damage initiation load (kN) | 6.12 | 5.60 | 6.03 | 4.77 | 4.79 | 5.56 | 0.93 | 0.93 |
| Average value | 5.48 | 0.93 | ||||||
| Relative value | 589.25% | 100% | ||||||
| Specimen | Novel T-Joint | Conventional T-Joint | Aluminum T-Joint | |||||||
|---|---|---|---|---|---|---|---|---|---|---|
| N1 | N2 | N3 | N4 | N5 | N6 | C1 | C2 | Al-1 | Al-2 | |
| Ultimate load (kN) | 8.01 | 8.03 | 9.27 | 8.03 | 8.34 | 8.40 | 2.20 | 2.64 | 7.11 | 6.90 |
| Average value | 8.35 | 2.42 | 7.01 | |||||||
| Relative value | 119.12% | 34.52% | 100% | |||||||
| Relative value with consideration of density * | 207.50% | 60.13% | 100% | |||||||
Disclaimer/Publisher’s Note: The statements, opinions and data contained in all publications are solely those of the individual author(s) and contributor(s) and not of MDPI and/or the editor(s). MDPI and/or the editor(s) disclaim responsibility for any injury to people or property resulting from any ideas, methods, instructions or products referred to in the content. |
© 2024 by the authors. Licensee MDPI, Basel, Switzerland. This article is an open access article distributed under the terms and conditions of the Creative Commons Attribution (CC BY) license (https://creativecommons.org/licenses/by/4.0/).
Share and Cite
Zhang, T.; Luo, Z.; Deng, J.; Pei, Y.; Cheng, X. A Novel Preparation Method of Composite Bolted T-Joint with High Bending Performance Based on the Prepreg-RTM Co-Curing Process. Polymers 2024, 16, 1259. https://doi.org/10.3390/polym16091259
Zhang T, Luo Z, Deng J, Pei Y, Cheng X. A Novel Preparation Method of Composite Bolted T-Joint with High Bending Performance Based on the Prepreg-RTM Co-Curing Process. Polymers. 2024; 16(9):1259. https://doi.org/10.3390/polym16091259
Chicago/Turabian StyleZhang, Tao, Zhitao Luo, Jinxin Deng, Yuchen Pei, and Xiaoquan Cheng. 2024. "A Novel Preparation Method of Composite Bolted T-Joint with High Bending Performance Based on the Prepreg-RTM Co-Curing Process" Polymers 16, no. 9: 1259. https://doi.org/10.3390/polym16091259
APA StyleZhang, T., Luo, Z., Deng, J., Pei, Y., & Cheng, X. (2024). A Novel Preparation Method of Composite Bolted T-Joint with High Bending Performance Based on the Prepreg-RTM Co-Curing Process. Polymers, 16(9), 1259. https://doi.org/10.3390/polym16091259