Article

Investigating the Inhibitory Factors of Sucrose Hydrolysis in Sugar Beet Molasses with Yeast and Invertase

1
Department of Process and Life Science Engineering, Division of Chemical Engineering, Lund University, 22100 Lund, Sweden
2
Department of Chemistry, Division of Biotechnology, Lund University, 22100 Lund, Sweden
3
Department of Botany and Microbiology, South Valley University, Qena 83523, Egypt
*
Author to whom correspondence should be addressed.
Catalysts 2024, 14(5), 330; https://doi.org/10.3390/catal14050330
Submission received: 25 April 2024 / Revised: 12 May 2024 / Accepted: 14 May 2024 / Published: 17 May 2024

Abstract

:
Sugar beet molasses is a low-value byproduct from the sugar industry. It contains significant amounts of sucrose (approx. 50% (w/w)), which can be used for many different applications, for example, as feedstock for the production of fuel (as ethanol) and biobased chemicals such as 5-hydoxymethyl furfural (HMF). To produce platform chemicals, sucrose is hydrolyzed into its monomeric C6 sugars: glucose and fructose. When comparing the hydrolysis rates of molasses with a pure sucrose solution, the specific reaction rate is much slower (Qp/x,60min = 93 and 70 gprod L−1 h−1 gcell−1 for pure sucrose and crude molasses, respectively) at the same sucrose concentration (300 g/L) and process conditions. To clarify why molasses inhibits the enzymatic hydrolysis rate, the influence of its viscosity and inorganic and organic composition was investigated. Also, the effects of molasses and treated molasses on pure enzymes, invertase (from Saccharomyces cerevisiae, 0.05 mg/mL), compared with hydrolysis using whole cells of Baker’s yeast (3 mg/mL), were tested. The results indicate an inhibitory effect of potassium (Qp/x,60min = 76 gprod L−1 h−1 gcell−1), generally at high salt concentrations (Qp/x,60min = 67 gprod L−1 h−1 gcell−1), which could be correlated to the solution’s high salt concentrations and possibly the synergistic effects of different ions when applying concentrations that were four times that in the molasses. Also, the viscosity and sucrose purity seem to have an effect, where pure sucrose solutions and thick juice from the sugar mill yielded higher hydrolysis rates (Qp/x,60min = 97 gprod L−1 h−1 gcell−1) than molasses-type solutions with a higher viscosity (Qp/x,60min = 70–74 gprod L−1 h−1 gcell−1). Attempting to further understand the effects of different components on the invertase activity, an in silico investigation was performed, indicating that high salt concentrations affected the binding of sucrose to the active site of the enzyme, which can result in a lower reaction rate. This knowledge is important for future scale-up of the hydrolysis process, since reduced hydrolysis rates require larger volumes to provide a certain productivity, requiring larger process equipment and thereby higher investment costs.

Graphical Abstract

1. Introduction

Sugar beet molasses is one of the major by-products produced in the sugar industry today [1,2]. Even though molasses contains approx. 50% sucrose, it is rich in many other organic compounds, such and salts [1,2]. Today, most molasses is used for ethanol production, animal feed, and yeast substrate, but molasses also has great potential to be upgraded to more valuable platform chemicals [3,4]. One of the top ten desired biobased platform chemicals is 5-(hydroxymethyl)furfural (HMF). HMF has a high functionality and applicability for producing different chemicals with a wide range of applications, such as polymers, biofuels, and pharmaceuticals [5,6,7]. Hence, HMF is identified as a very important biobased platform chemical for a vast number of valuable biobased chemicals for the future biobased economy.
To produce HMF from molasses, the sucrose must first be hydrolyzed into glucose and fructose. This can be done enzymatically using invertase, sucrose synthase, or acid hydrolysis [8,9]. Enzymatic hydrolysis is preferable to acid hydrolysis due to the degradation of glucose and fructose into other by-products when using acids, which limits the process yield and selectivity [9,10]. However, the enzymatic hydrolysis of sucrose in molasses, especially at higher concentrations, faces inhibition of the reaction rate [11,12,13,14,15,16]. It is yet unclear exactly what in the molasses inhibits the activity of the invertase enzyme, and that is further investigated in this work.
In one of our previous studies, the pretreatment of molasses using nanofiltration (NF) positively affected the reaction rate, indicating that the inhibitory compounds were of a low molecular weight [14]. It is well-known that molasses contains many different low-molecular-weight elements, both organic and inorganic, which could be problematic for the invertase enzyme [17]. For example, different elements have been shown to either have an inhibitory, neutral, or even promotional effect on invertase activity. See Table 1 for an overview of the previously reported effects of various elements on invertase.
Even though the studies reported in Table 1 have performed their respective assessments in different ways and using different microbial strains, the listed inhibitors affecting invertase are Ag+, Zn2+, Hg2+, K+, Na+, Cd2+, and Ba2+. The enzyme activity enhancers in the different studies are Al3+ and Co2+. Ni2+ is reported to have a neutral effect on invertase. Moreover, some elements are reported as inhibitors and promoters or neutral, including Mn2+, Ca2+, Cu2+, Mg2+, and Fe3+, which is somewhat contradictory. This conflict shows the complexity of the inhibition of the invertase enzyme and demonstrates the need for further research. However, not all of these elements are abundant in molasses [15,16,18,19,20,21,22,23,24].
Phenolic compounds are known to be present in molasses [25,26,27,28]. There are several different types of phenols and sugars in molasses. The inhibition of phenolic compounds depends on the phenol–enzyme interaction(s). It is known that various phenolic compounds have an inhibitory effect on various saccharide-hydrolyzing enzymes, including invertase, but in certain cases, phenols can also act as promoters [28,29].
The viscosity of a solution is also something that can affect the reaction kinetics. By increasing the viscosity, the mobility of molecules and enzymes in a solution is reduced. The high viscosity at high concentrations of molasses could lead to decreased accessibility for the substrate to the enzyme active site [30].
In this study, the invertase inhibition by sugar beet molasses is more thoroughly investigated. The present inorganic elements and potential organic inhibitors are investigated using pure sucrose solutions and compared with crude beet molasses and NF-purified molasses. The effects of the viscosity and the comparison between pure isolated invertase catalyst and whole cells (Saccharomyces cerevisiae) are also studied. Furthermore, an in silico analysis of the invertase enzyme and its interactions with sucrose in the presence and absence of different elements was performed to assess the effects of the various elements present in the molasses.

2. Results and Discussion

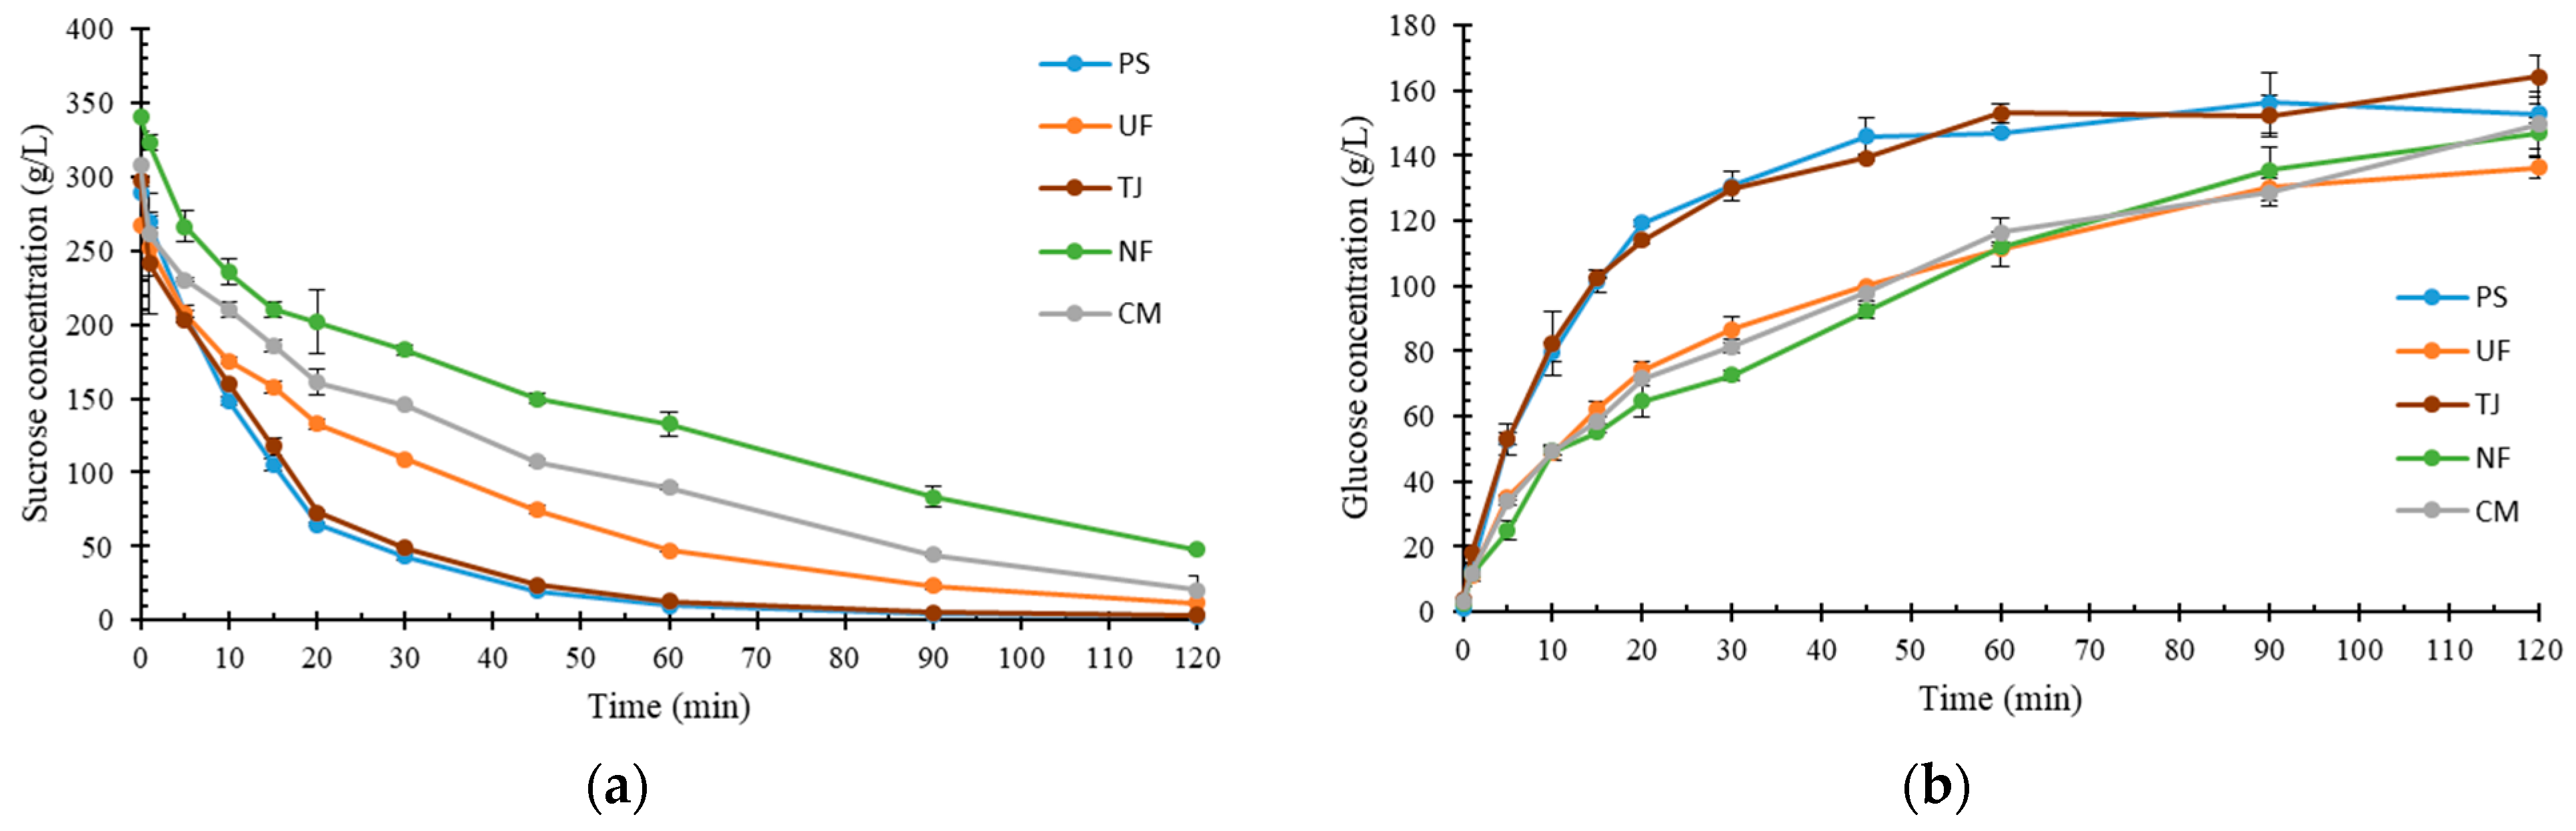
2.1. Molasses Composition

The molasses, as in one of our previous studies, was pretreated with either ultrafiltration (UF) or NF membranes. The UF molasses was a membrane permeate where the sucrose was separated from large-molecular-weight compounds using a 10 kDa nominal molecular weight cutoff ceramic tubular membrane. The molasses obtained from the NF process was a retentate, where sucrose was separated from the low-molecular-weight compounds using a ceramic tubular membrane with a nominal molecular weight cutoff of 200 Da. The entire membrane experimental procedure and setup is presented in Sjölin et al. (2022) [14]. The hydrolysis rates of these purified molasses samples were compared with crude molasses (CM), pure sucrose (PS, as a control), and thick juice (TJ), which is a purer sucrose stream obtained from the sugar refinery and located in the production process between the final evaporator (concentrate) and the crystallization step. It therefore contains the same elements as those in CM, but with a higher sucrose purity ratio.
The crude beet molasses was obtained from Örtofta Sugar Mill, Sweden, with only a 19% water content. Its main components were the same as in one of our previous studies (Sjölin et al., 2022), with 49% sucrose; 0.4% other sugars including glucose, fructose, and raffinose; 11% ash; 3.4% lactic acid; 1.1% acetic acid; 1.2% oligo- and polymeric glucose; and 10% total nitrogen, of which 1.5% were in salt form [14].
Furthermore, the ICP-OES and ICP-MS of the CM, NF molasses (retentate), UF molasses (permeate), and TJ are shown in Table 2. The results are normalized per gram of sucrose since the ratio between sucrose and impurities is of interest in this study.
The results of the ICP-OES showed high levels of potassium in all the molasses samples (67.62–60.05 mg/(L·gsucrose)) compared to only 5.74 mg/(L·gsucrose) in the TJ, but also relatively high concentrations of Na and Ca (9.5 mg/(L·gsucrose) and 2.17 mg/(L·gsucrose), respectively). However, the main difference between the crude and NF molasses was more profound with respect to the content of divalent ions compared to monovalent ones (for example, 2.17 mg/(L·gsucrose) and 3.33 mg/(L·gsucrose of Ca) for CM and NF, respectively). As divalent ions are larger in a water solution than monovalent ions, the divalent ions are more retained during the filtration process compared to the monovalent ions [31]. This indicates that the previously observed positive effects of molasses pretreatment with NF could be caused by a lower concentration of monovalent salts. Therefore, it is of significant interest to evaluate the monovalent ions concerning their effects on the enzymatic hydrolysis of the sucrose in molasses. The thick juice contained much lower amounts of salts compared to the molasses samples.
Furthermore, Cu was found at low concentrations, but since it had previously been identified as a possible inhibitor of enzymatic hydrolysis, it was assessed in the sucrose hydrolysis experiments using whole cells and invertase [15,18,19,20,21,23].
No Cd or Pb heavy metals in the different molasses samples were detected via ICP-MS analysis. On the other hand, the same analysis showed the presence of Fe and Zn in the molasses samples and TJ, and owing to their lower contents (Table 1), they were also neglected for further evaluation as inhibitors of enzymatic hydrolysis of sucrose.

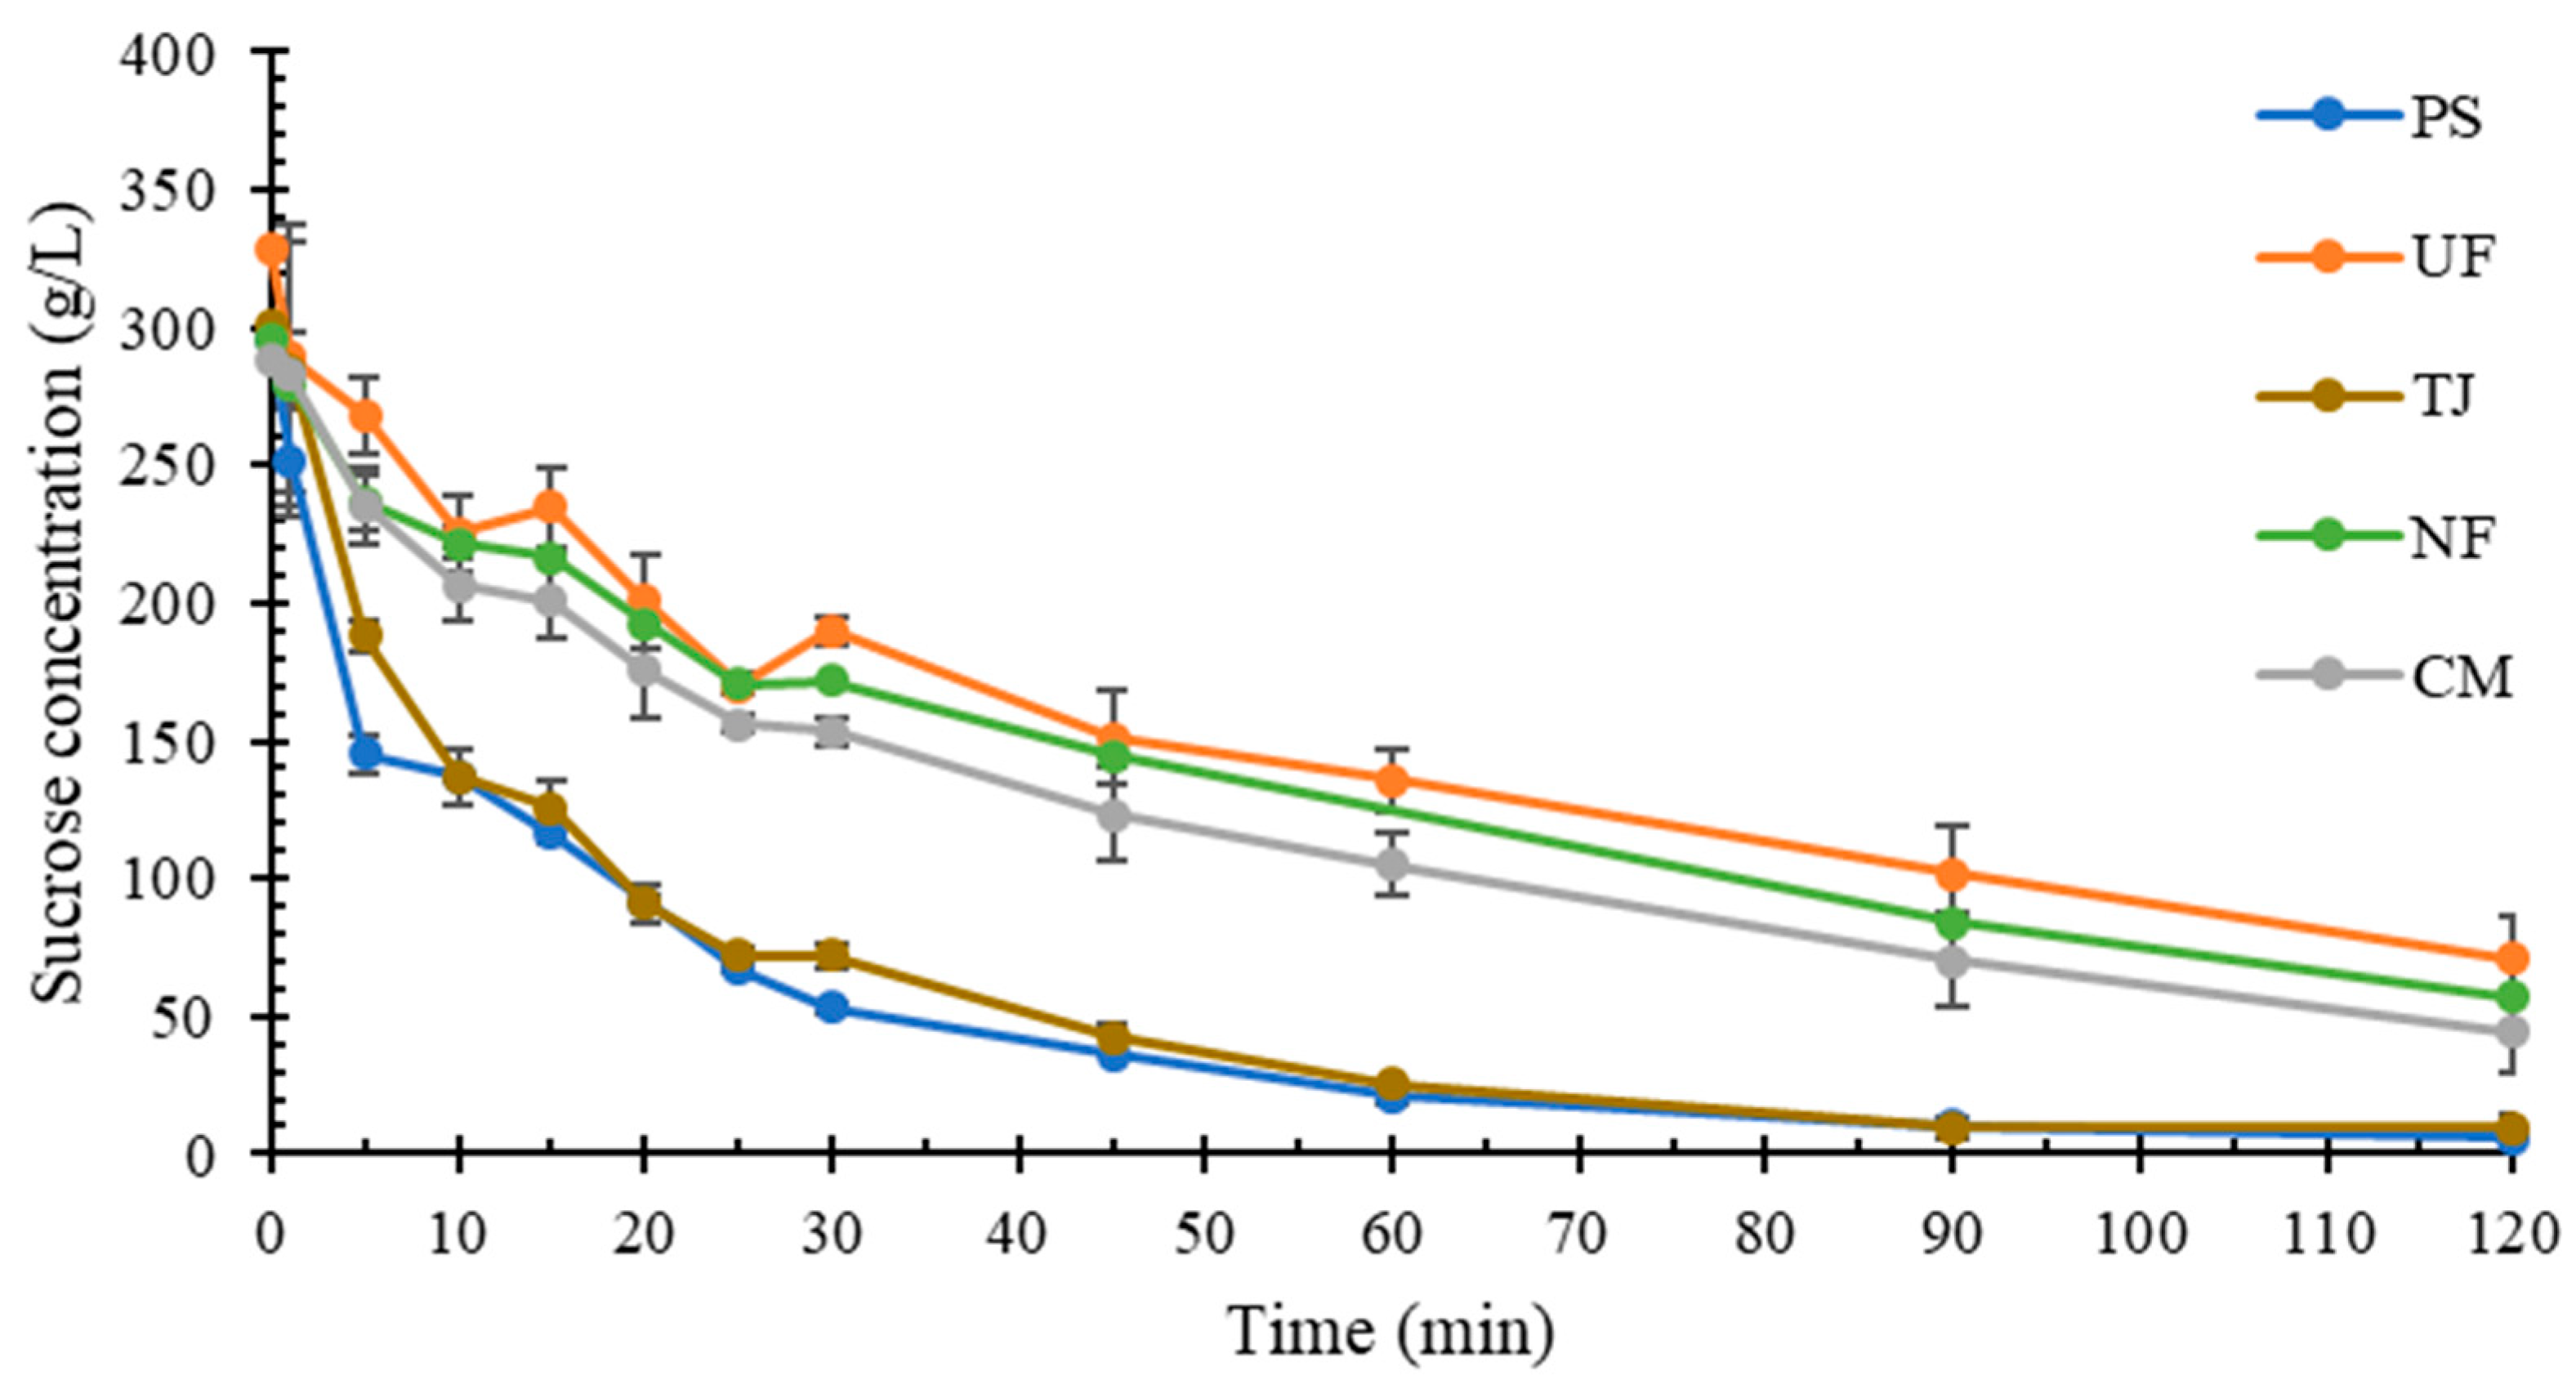
2.2. Impact of pH and Viscosity on Sucrose Hydrolysis

The starting sucrose concentration in all the feed types was approx. 300 g/L; however, the amount of impurities and the viscosity varied [14,32]. The viscosities of NF, UF, CM, TJ, and PS were 8.25 ± 0.06, 6.29 ± 0.04, 5.02 ± 0.01, 3.45 ± 0.01, and 2.576 ± 0.01 mPa·s at a 1000 s−1 shear rate, respectively. Water was used as a control, with a viscosity of 1.12 mPa·s at 20 °C. Also, the effects of the pH were studied by adjusting the pH to 4.5 (the optimum pH for sucrose hydrolysis using the invertase enzyme) [33,34], and the results are shown in Figure 1.
As shown in Figure 1, there was a difference in the hydrolysis rates related to viscosity, where CM, NF, and UF (high viscosity solutions) all showed slower reaction rates compared to PS and TJ (low-viscosity solutions). The specific productivities (Qp/x) after just 30 min were 169.0 and 156.7 gprod/(L·h·gcell) for PS and TJ, respectively, compared to 90.7, 96.1, and 106.0 gprod/(L·h·gcell) of NF, CM, and UF, respectively. The specific yields (Yp/x) for the whole experiment of 120 min were 105.7, 103.4, 84.6, 87.5, and 96.0 gprod/gcell for PS, TJ, NF, CM, and UF, respectively. There was no clear continuous correlation trend between the solutions and their respective viscosity measurements (other than the categories of high and low viscosity solution types); therefore, it is unknown whether there was something else in the molasses solutions that did not exist in the PS and had a much lower concentration in the TJ. It is well-known that solutions with a high viscosity negatively affect the reaction rate of biocatalysts due to their effects on the enzymatic structural conformation as well as the access of the substrate to the catalytic active site of the biocatalysts [30,35,36].
Furthermore, in comparison to one of our previous studies, it was also shown that the previous positive effects of NF on the hydrolysis rate were no longer profound [14]. This can be explained by the high buffering capacity of the molasses, where the initial pH was previously not adjusted and was approx. pH 9. The pH dropped more for the NF than the CM, since NF molasses contains fewer salts than CM, which approached more optimal pH ranges for the invertase enzyme [14]. As Figure 1 shows, there was no difference in the hydrolysis rate of sucrose in the NF or CM when the reaction was carried out under the optimum pH (4.5). This means that the previous positive effects of nanofiltration on molasses were possibly just a change in buffering capacity. Section 3.3 shows further the effects of the inorganic low-molecular-weight compounds present in the molasses.

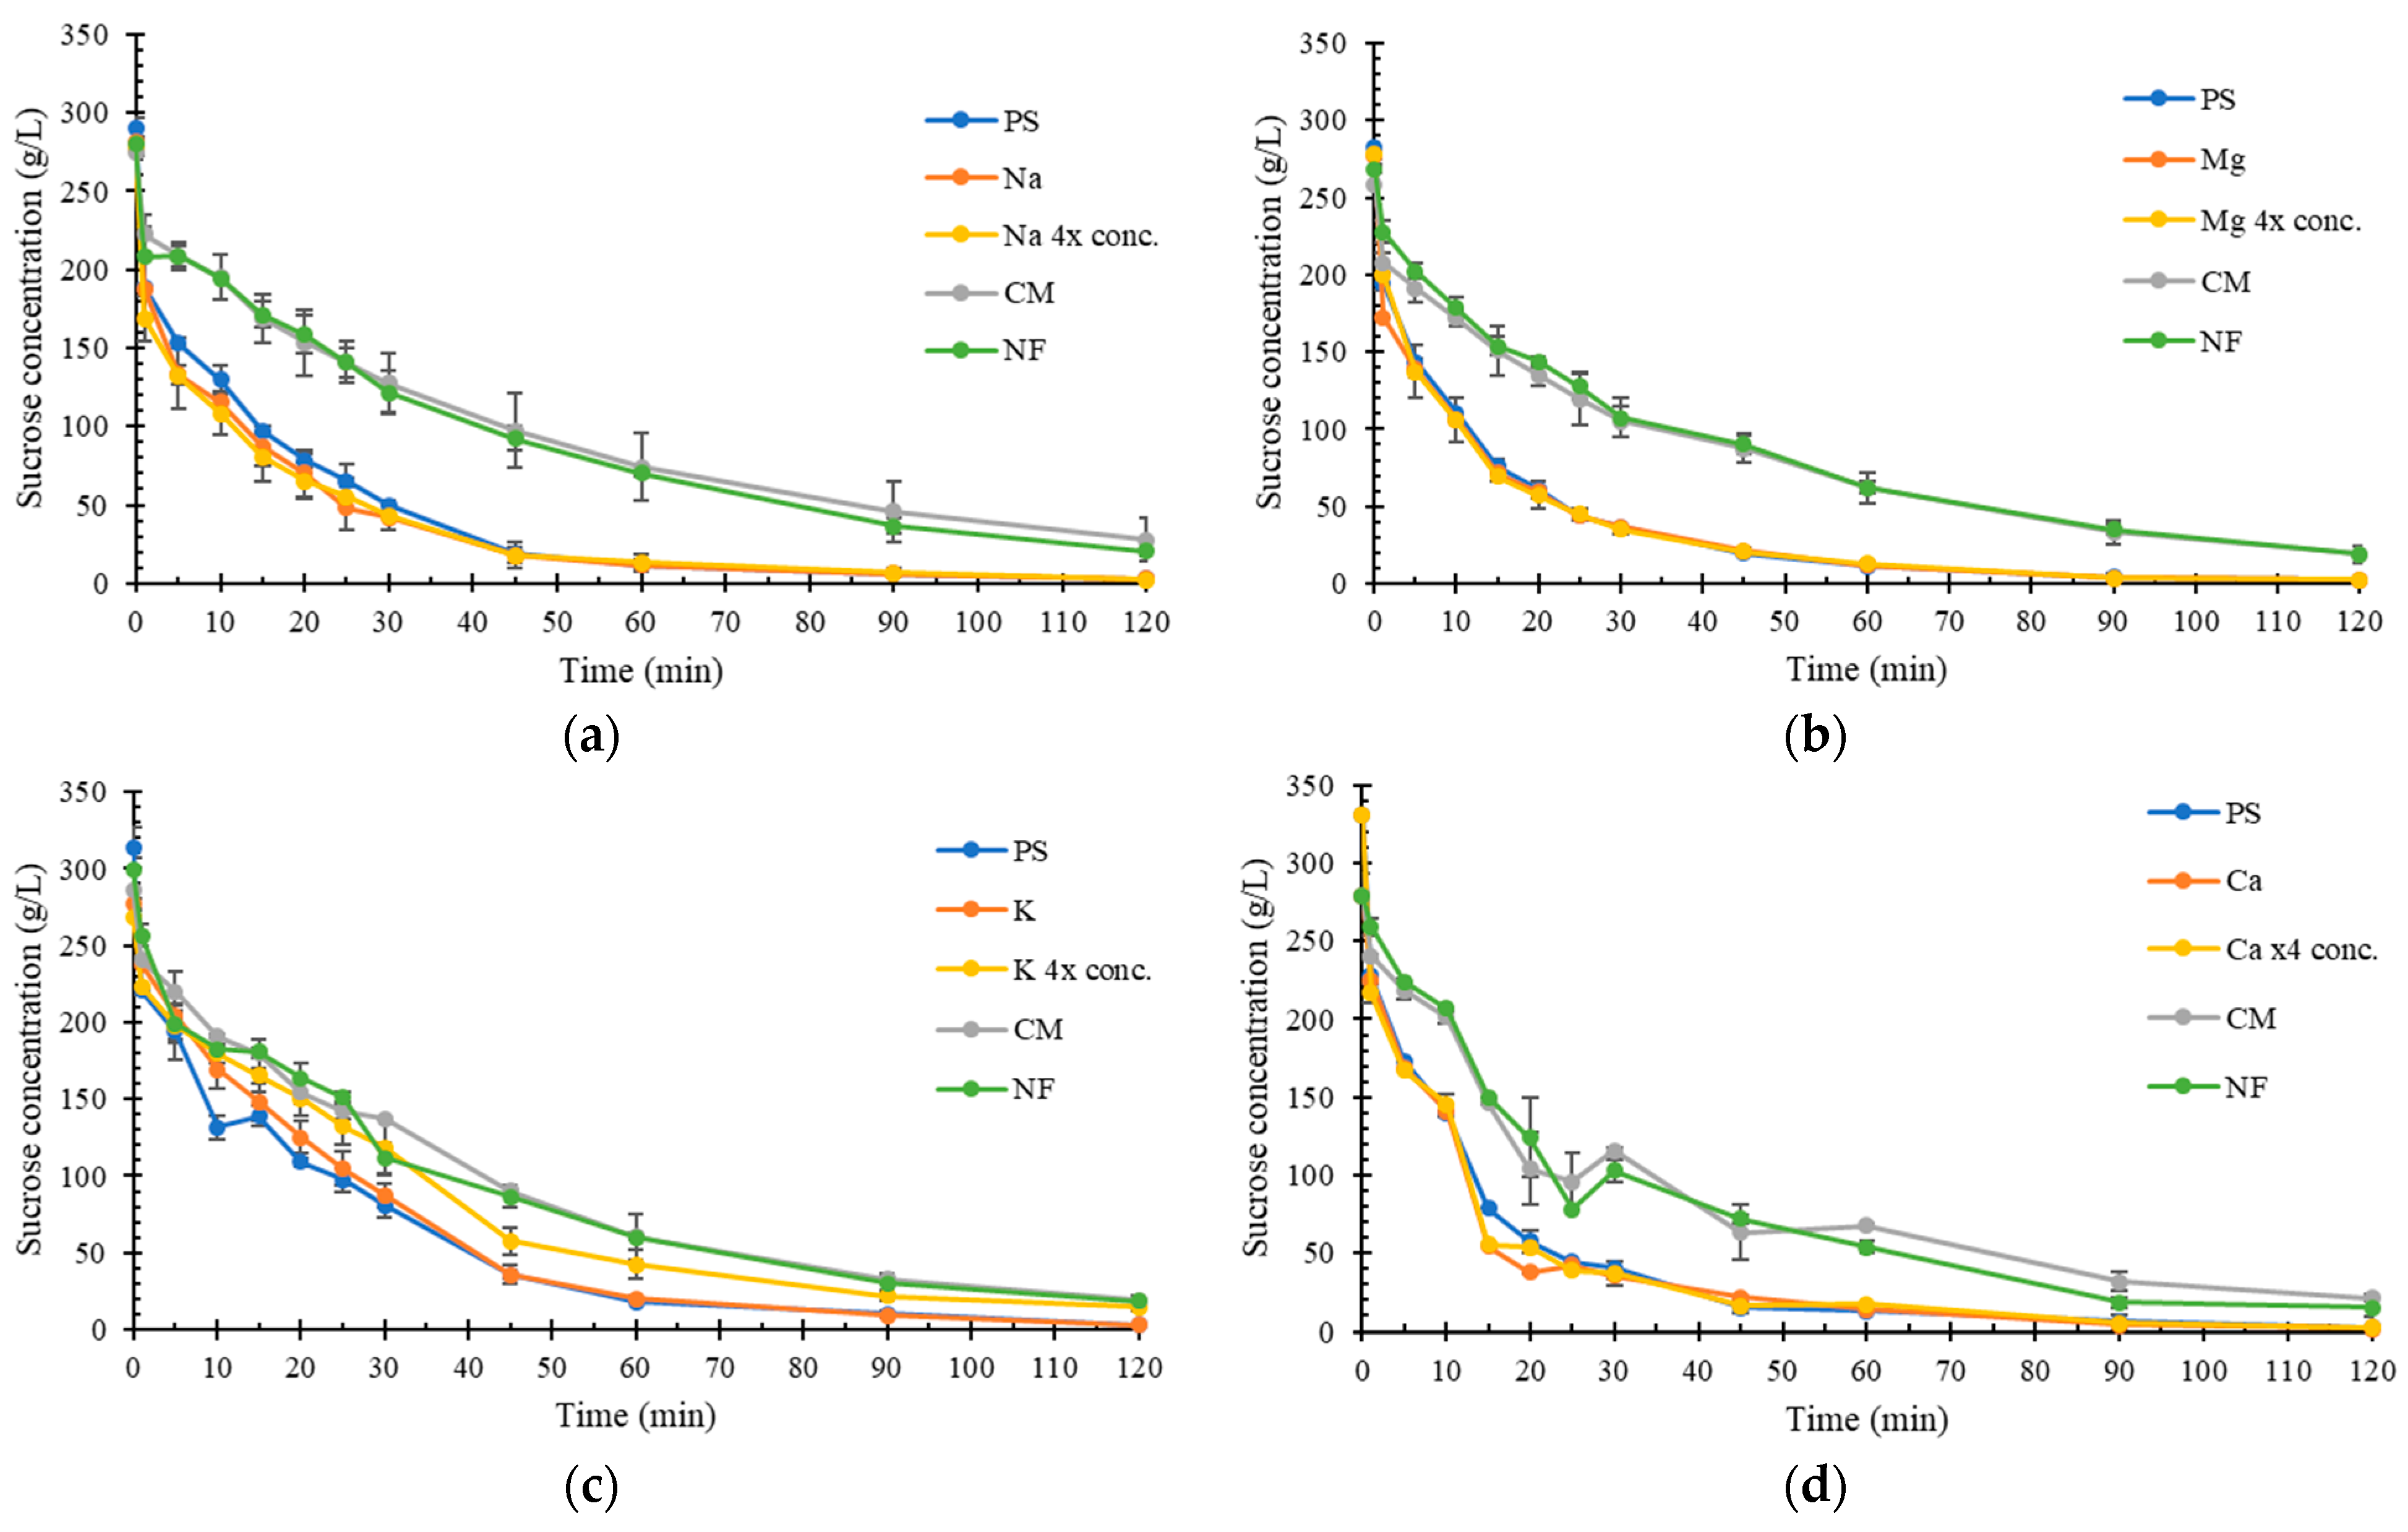
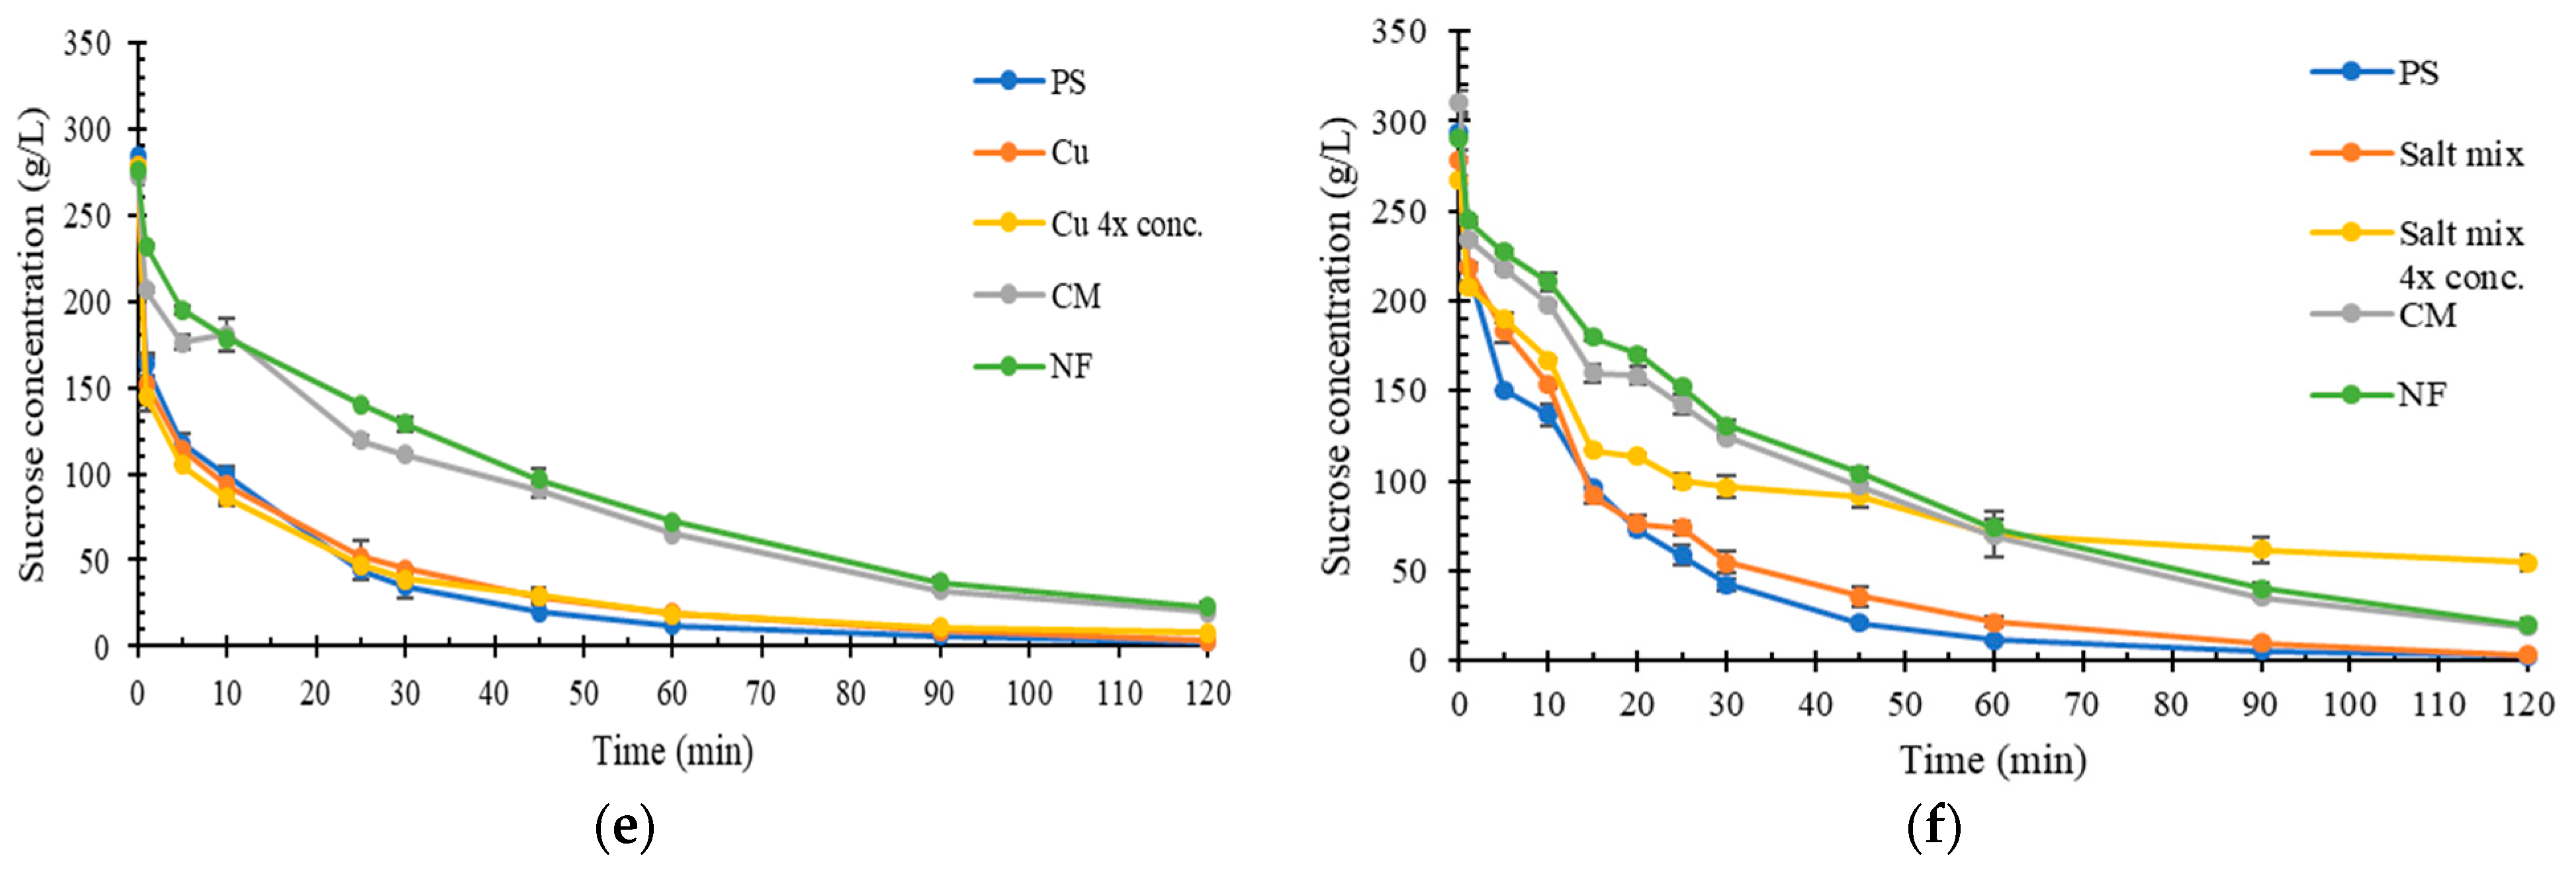
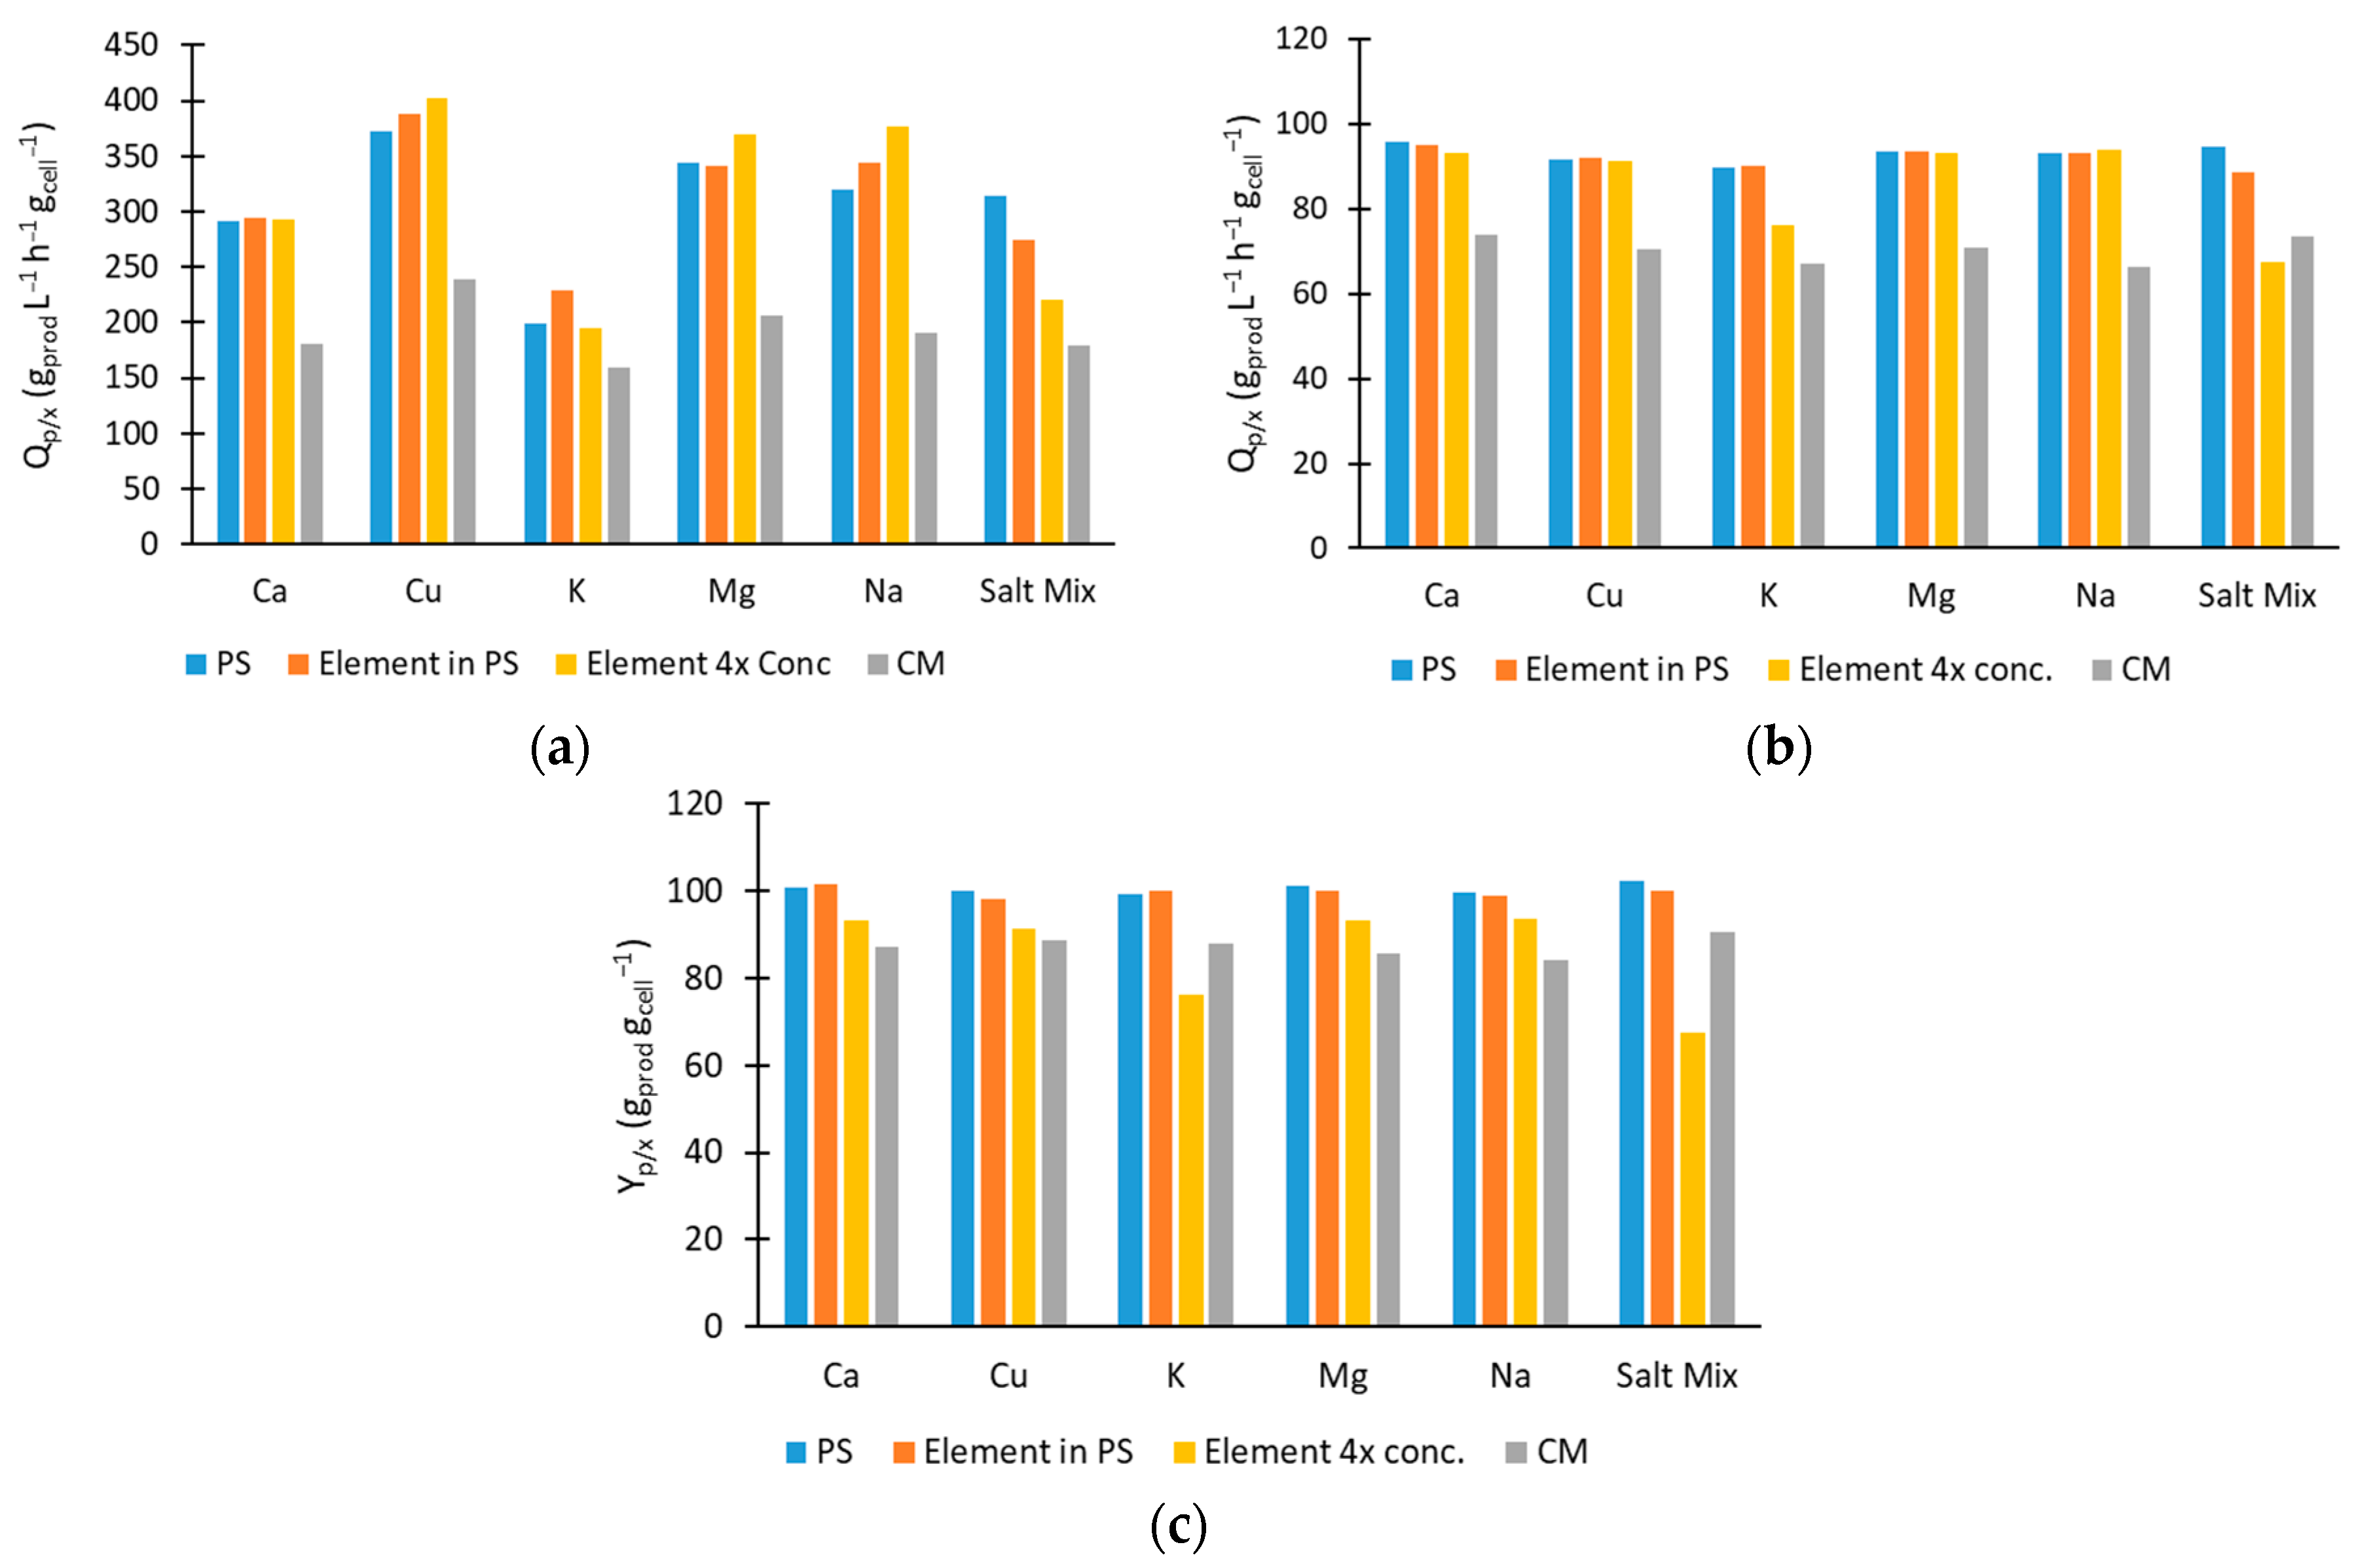
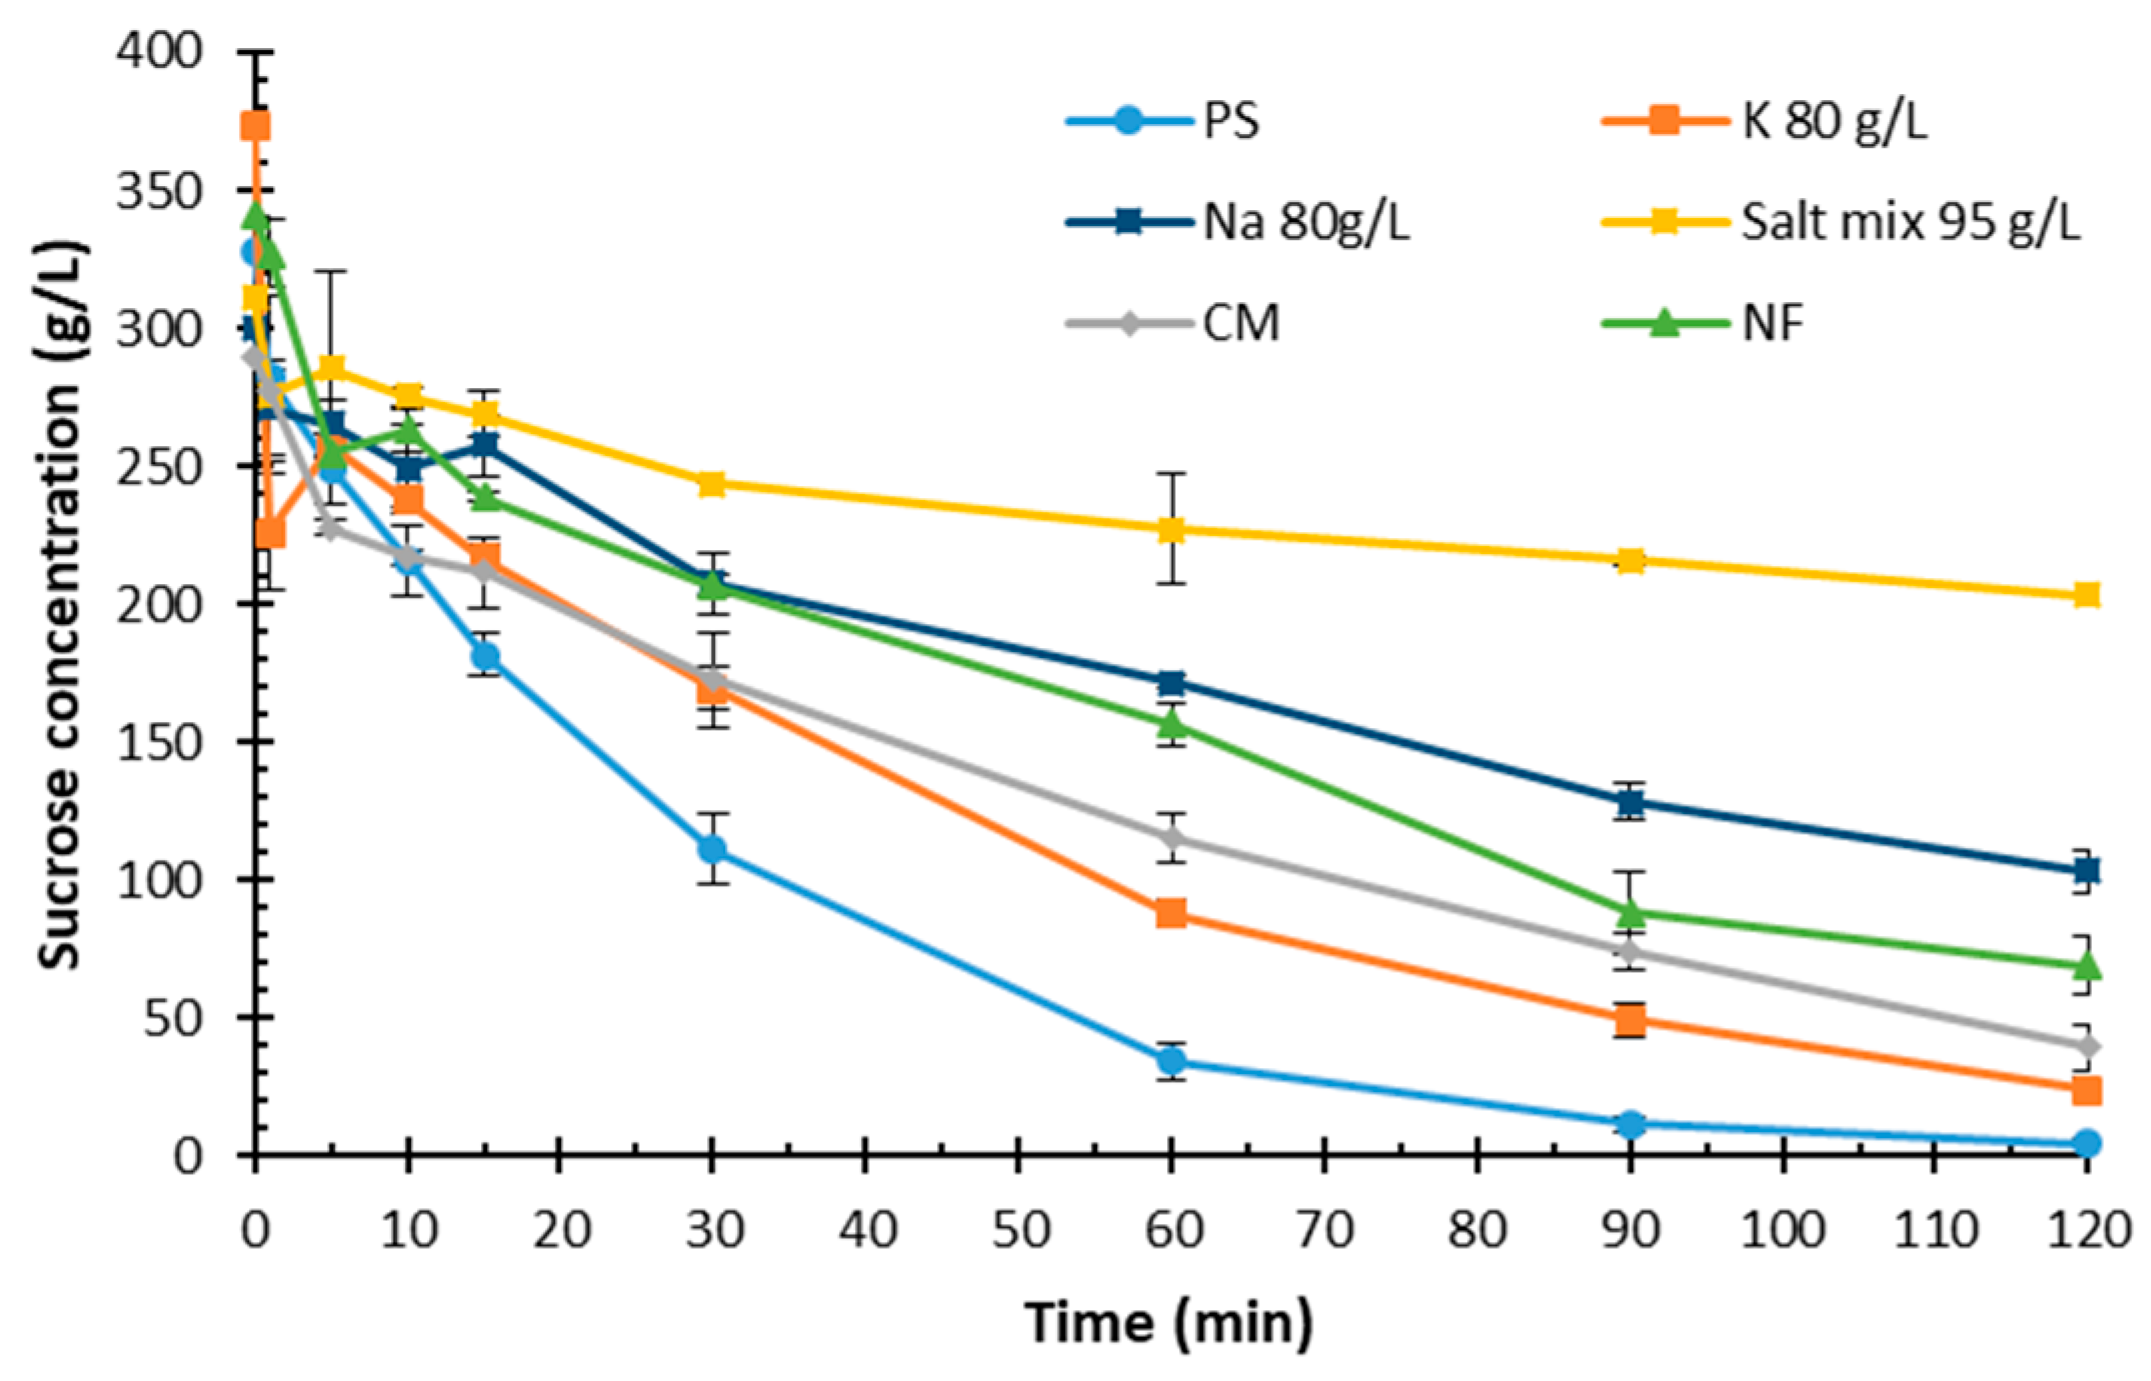
2.3. Impact of Inorganic Compounds on Sucrose Hydrolysis

In these experiments, each element was added individually and in a mix together with other elements to a sucrose solution (300 g/L) at the same element concentration and at a 4 times higher concentration than their concentration in the CM (Table 3). Then, their effects on the biocatalytic activity during sucrose hydrolysis using whole yeast cells and pure invertase was tested and compared with the sucrose hydrolysis in PS (control), CM, and NF molasses. All the experiments were performed at pH 4.5 and in duplicate.
The results shown in Figure 2 indicate that Na, Mg, Ca, or Cu at concentrations of 2.85, 0.018, 0.65, and 0.003 mg/mL, respectively, (Figure 2a,b,d,e) do not affect the hydrolysis rate of sucrose, as the reaction rates followed the rate of sucrose hydrolysis in PS. However, when considering high doses of K and the salt mix (Figure 2c,f), the reaction rate was lower than what was observed for PS but higher than that of the CM sample. With applying four times the element concentration found in the molasses, the reaction rate of sucrose hydrolysis with the 4× K spiked experiment yielded a hydrolysis rate between that of PS and CM. However, the 4× salt mix solution yielded an even lower hydrolysis rate for CM. As Figure 3a,b show, there is a general difference between the initial specific productivity (Qp/x,10min ranging between 160 and 402 gprod/(L·h·gcell)) and after 60 min of the reaction (Qp/x,60min < 100 gprod/(L·h·gcell)). In Figure 3b, one can see the difference in the specific reaction rate of PS, K, 4× K conc, mix salt, 4× mix salt conc., and CM, which corresponds to the results of Figure 2c,f. The specific yield (Yp/x) after 120 min (Figure 3c) also differed somewhat, especially for the 4× salt mix conc. (67.5 gprod/gcell), which was much lower than the specific yield obtained for PS (102.4 gprod/gcell) and interestingly even lower than that obtained for CM (90.7 gprod/gcell).
These data indicate that K and high salt concentrations contribute to the sucrose hydrolysis inhibition by yeast cells in molasses, but this is likely not the sole reason. It can also be an effect of the ionic strength, as K has the highest concentration, 20.29 mg/mL in the salt mix solution. Since the difference in ionic strength between K and the salt mix solutions is negligibly low, there can also be synergistic effects of the various salts on the invertase enzyme. When comparing these results to the previously mentioned studies, most of these observed results contradicted the previous results [15,18,19,20,21,22]. However, the doses of salts applied here, which correspond to the actual concentrations in molasses, were generally lower than what was used in the previous studies, which reported inhibitory effects of almost all the tested elements (Table 2). The most abundant salt in molasses was K, which was evaluated in a similar concentration range as in Takeshige and Ouchi’s paper (1995). Their observation regarding the impact of K on invertase confirms our results [19]. However, it has been found that salts, pH, and temperature play a critical role in the binding rate of sucrose to the active site of potato tuber invertase [37]. This explains our findings regarding the effects of salts on the hydrolysis of sucrose. In this study, we used the optimum pH and temperature, and the effects of the salts were studied in pure sucrose solution to avoid the effects of the other potential inhibitors present in molasses. In general, it is hard to compare our results to previous findings since the reaction conditions, such as the initial sucrose concentration, pH, reaction temperature, use of isolated enzymes, etc., are different in each study.

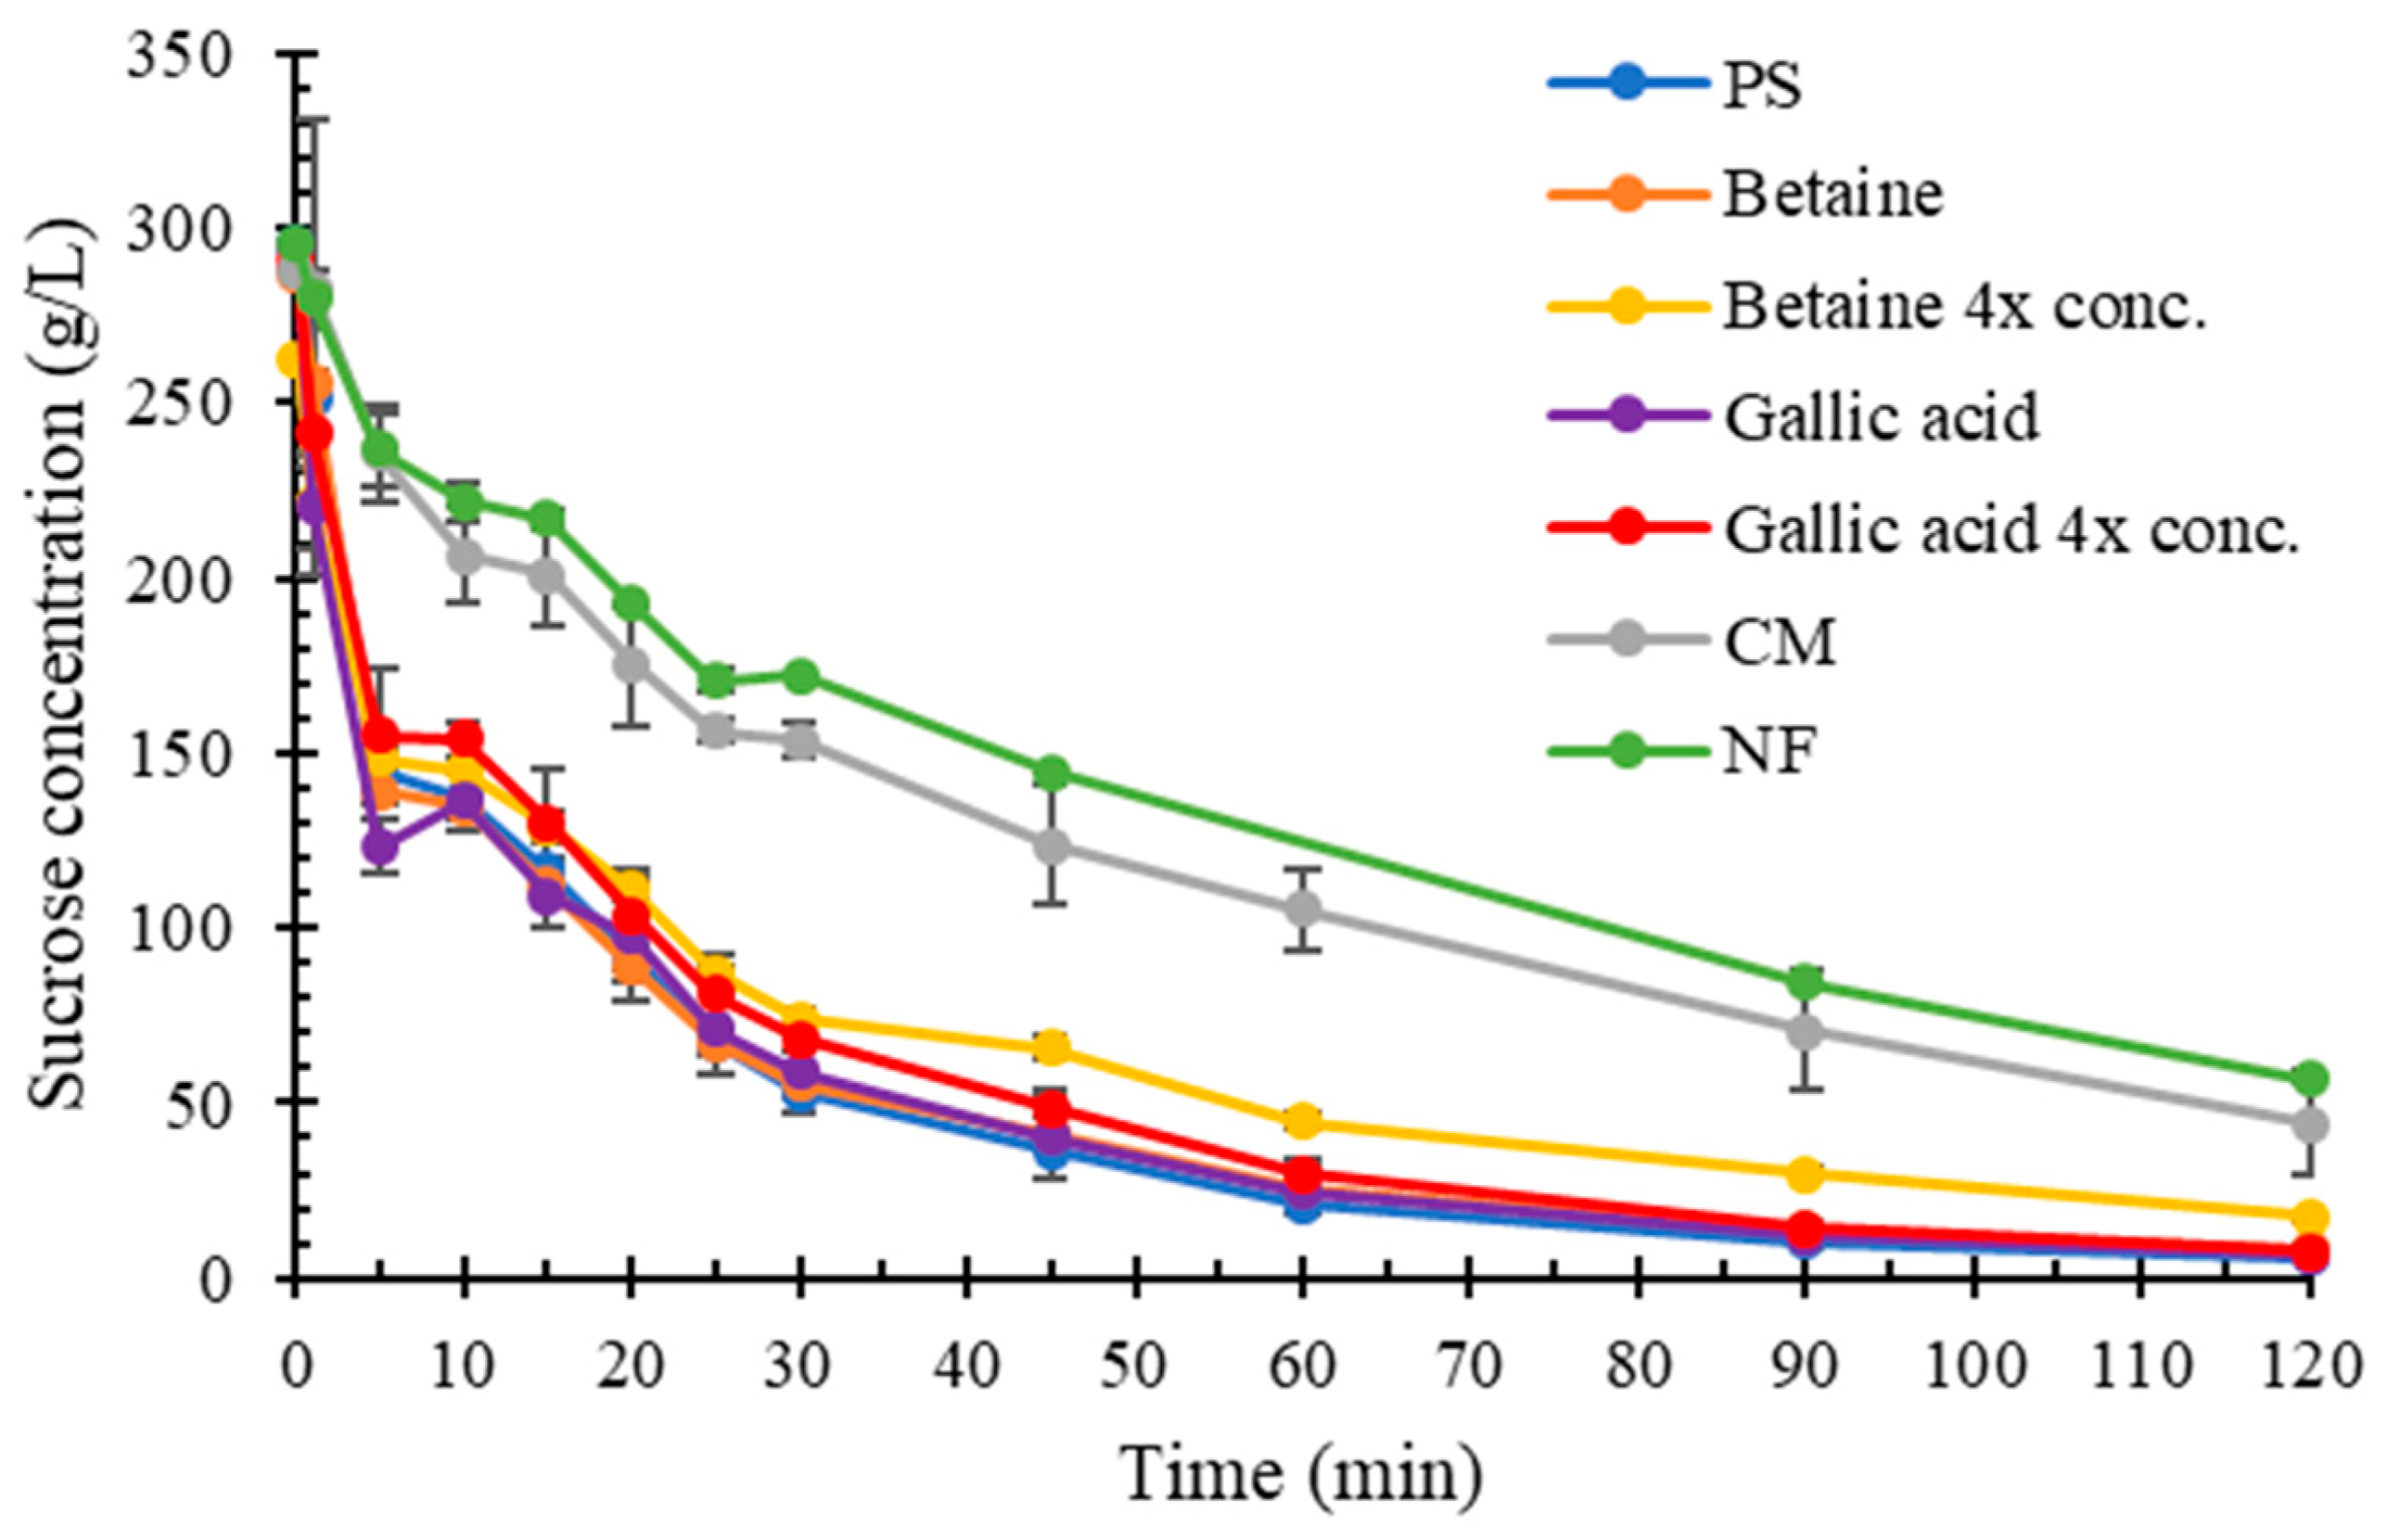
2.4. Impact of Organic Compounds on Sucrose Hydrolysis

The organic compounds in molasses were identified using LC-MS. The most abundant peak in the LC chromatogram from the LC-MS analysis was betaine (C5H11NO2, probability of 72% according to the Agilent Masshunter Qualitative Analysis B.08.00 compound identifier). As betaine was the most abundant compound, with a concentration of 37 g/L in the CM solution of 300 g/L of sucrose, it was selected for testing in the hydrolysis inhibition experiment. Betaine is well-known to be found in sugar beets, making the probability of its presence in molasses quite high [32,38,39]. The phenolic content of CM (at 300 g/L of sucrose) was determined to be 2.17 ± 0.05 g/L of gallic acid equivalents, which was like those observed in a previous study [25]. The hydrolysis inhibition results shown in Figure 4 show no major impact of betaine or gallic acid on the sucrose hydrolysis rate compared to PS. The specific productivity of sucrose hydrolysis after 30 min with PS, betaine, and gallic acid were 169.0, 166.0, and 162.2 gprod/(L·h·gcell), respectively, compared to 96.1 and 90.7 gprod/(L·h·gcell) for CM and NF, respectively.

2.5. Invertase as a Free Enzyme

The applied free enzyme dose, which corresponded to the content in 3 mg of Baker’s yeast, was determined to be 0.05 mg/mL of invertase (with 300 units/mg) (See Figure S1 in the Supplementary Information). Inhibition of sucrose hydrolysis in molasses could be observed even when using the soluble invertase, as seen in Figure 5a. However, there was a slight difference in the sucrose hydrolysis rates in this experiment between the different types of molasses, but this was due to slight differences in the starting concentration of sucrose, as proven by the glucose production rates (Figure 5b).
Furthermore, in comparison to Figure 1, the same difference in the hydrolysis rates between molasses subjected to different treatments (CM, UF, NF) and those of a high purity of sucrose (PS and TJ) was observed. Therefore, there was no difference between using the pure enzyme and whole cells in any of the solutions. Therefore, we conclude that using whole cells is still more beneficial for the further development of the sucrose hydrolysis process, especially with regard to scalability, process costs, and biocatalyst isolation afterwards.
To investigate if a similar impact of high concentrations of salts could be observed on free enzymes compared to when using yeast cells, an additional experiment was performed. As depicted in Figure 6, similar phenomena of 4× K concentrations could be observed to those shown in Figure 2c and Figure 3b, where the reaction rate approached that of CM and NF instead of PS. The hydrolysis rate of sucrose when subjected to the 4× salt mix concentration slowed down the hydrolysis rate more than that of CM and NF (Table 3, Qp/x,60min), which coincides with the previous observations shown in Figure 2f and Figure 3b. This finding aligns with the previously reported effect of salt concentration on the binding rate of invertase [37]. For more understanding of the binding rate of sucrose and invertase in the presence of the salts, an in silico analysis and MD simulation were carried out, which are explained in Section 3.6.
To investigate whether this was just an effect of ionic strength in the solution or there was a synergistic effect between the salts, a high dose (80 g/L) of Na was applied. Figure 6 and Table 3 show a reduced reaction rate (similar to CM and NF) by applying 80 g/L of Na compared to the lower concentration in Section 3.3. The concentration of 80 g/L of Na was the same weight dose as the 4× K concentration, but it yielded a lower reaction rate due to differences in molarity. This indicates that salt concentration (and thereby ionic strength) has an impact on the hydrolysis rate of invertase. However, the molarity of 80 g/L of Na is 3.48 M, which is a higher molarity than the molarity of the 4× salt mix concentration (2.64 M). However, the hydrolysis rate when applying the 4× salt mix concentration was still lower than that of the 80 g/L Na (Table 3). This demonstrates that the ionic strength of the solution is not the sole reason for a reduced hydrolysis rate. A synergistic effect between different salts could be a possible explanation for the effects seen in Figure 6. A possible reaction mechanism to this could be studied in future work.

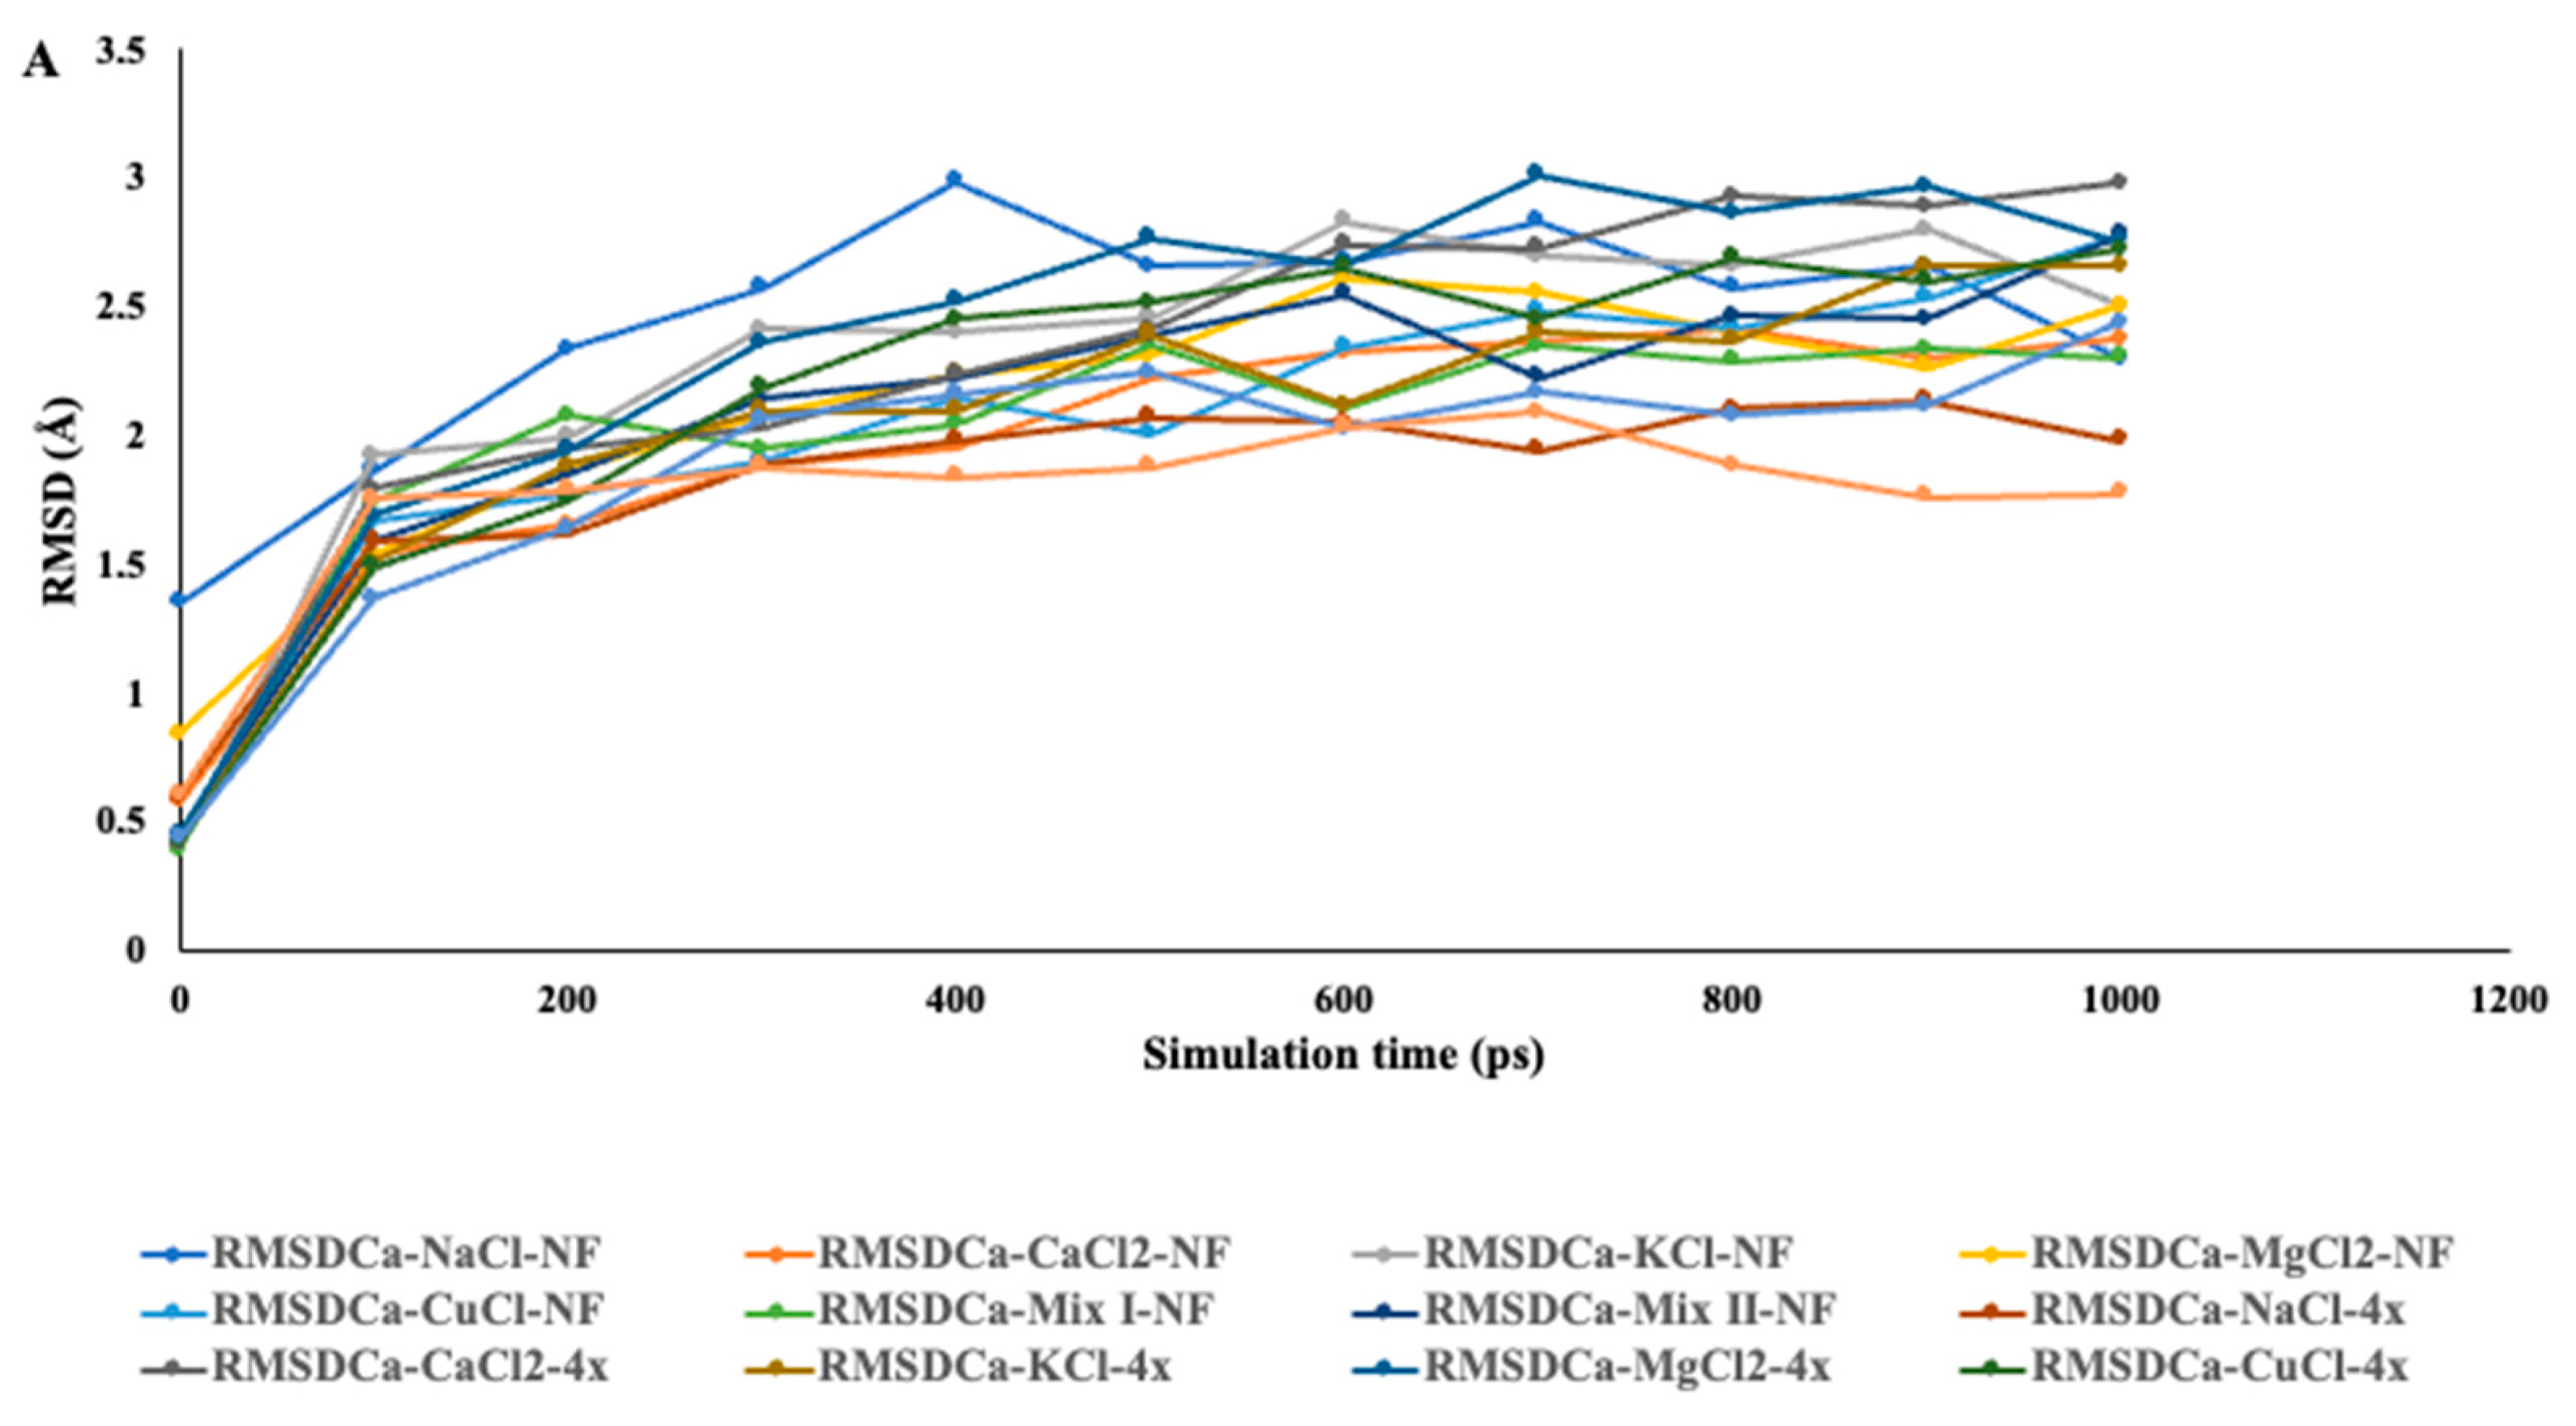
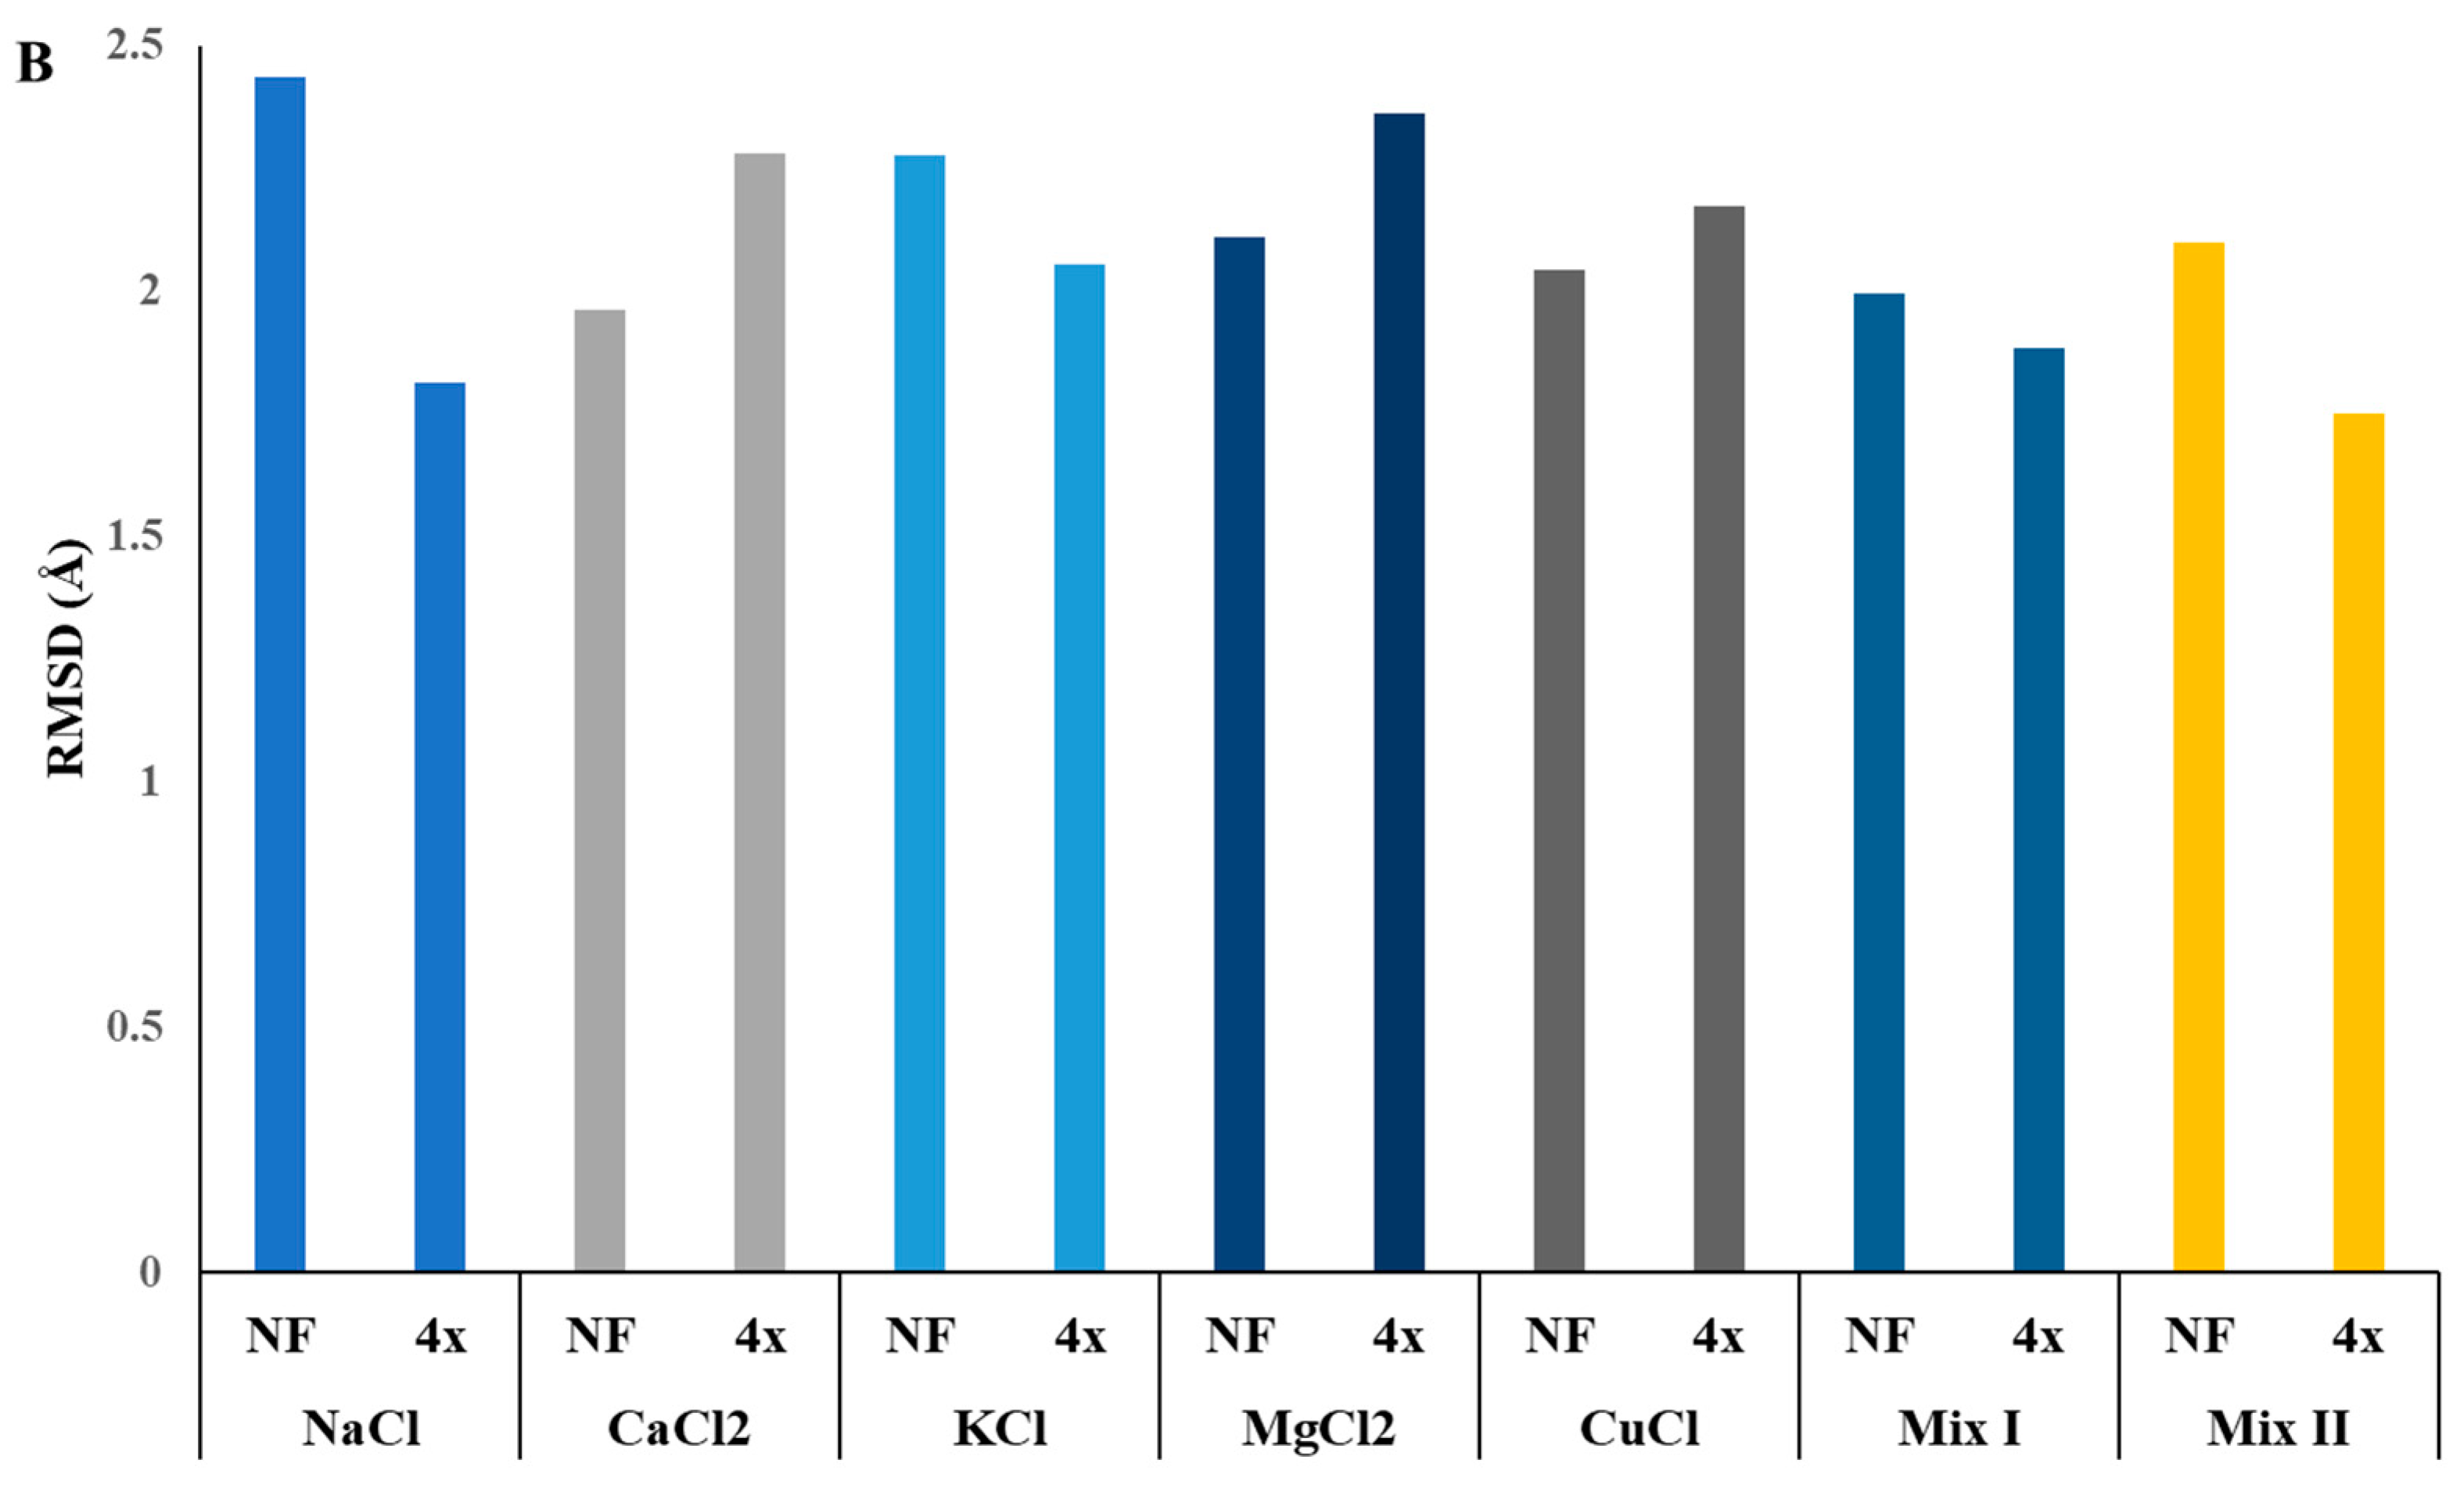
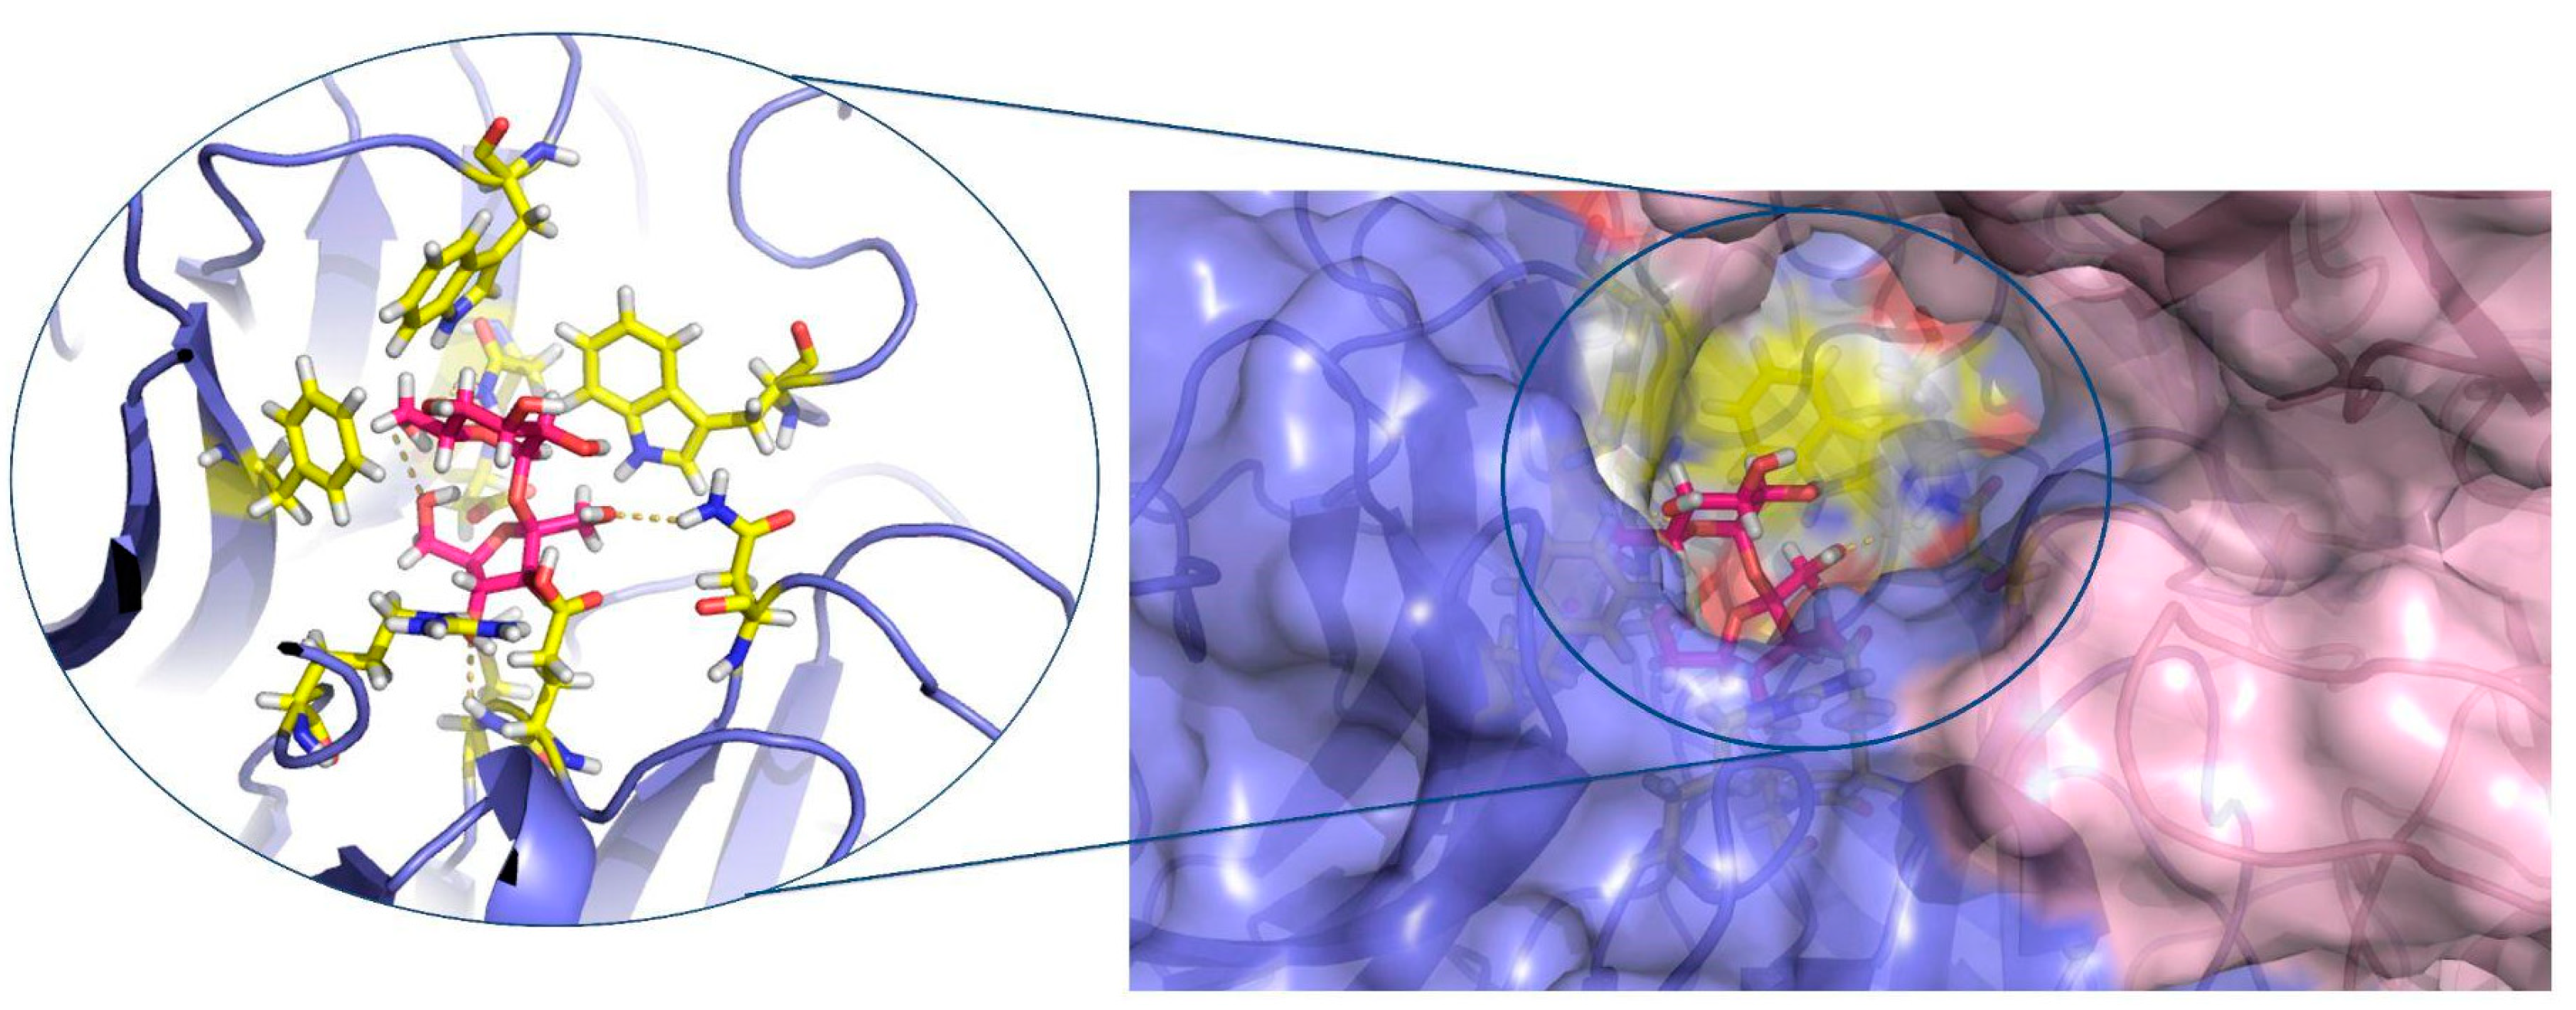
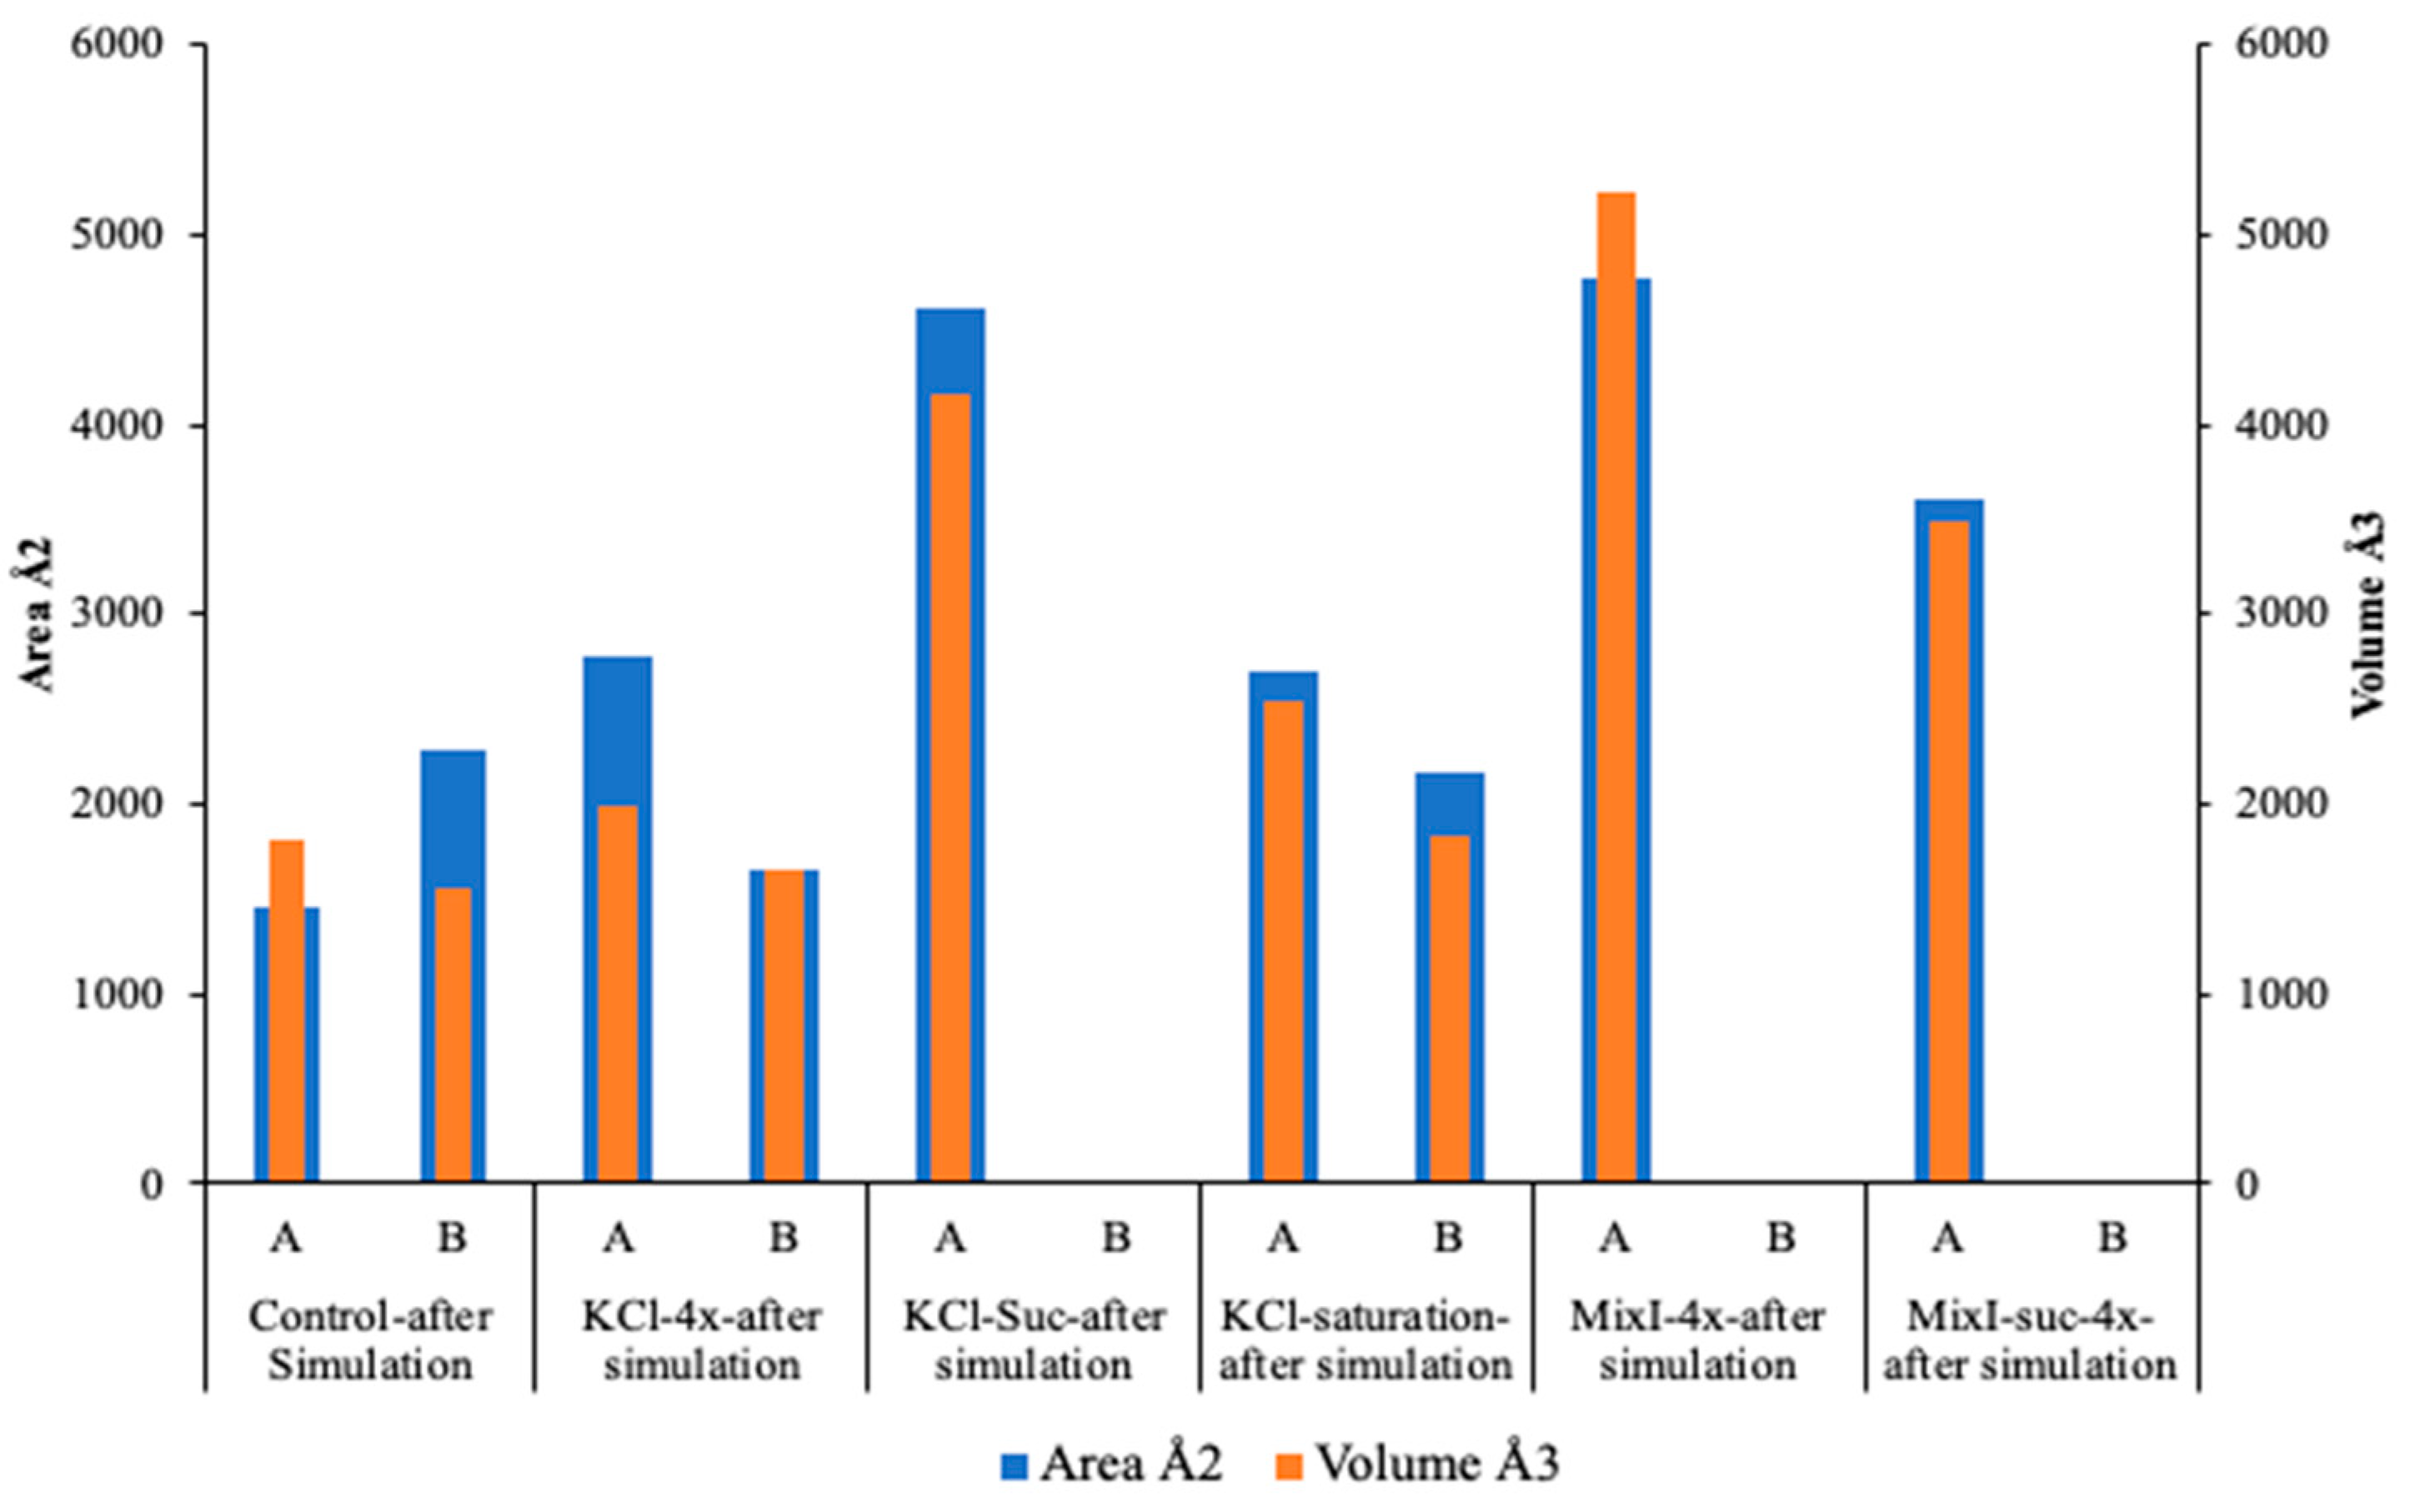
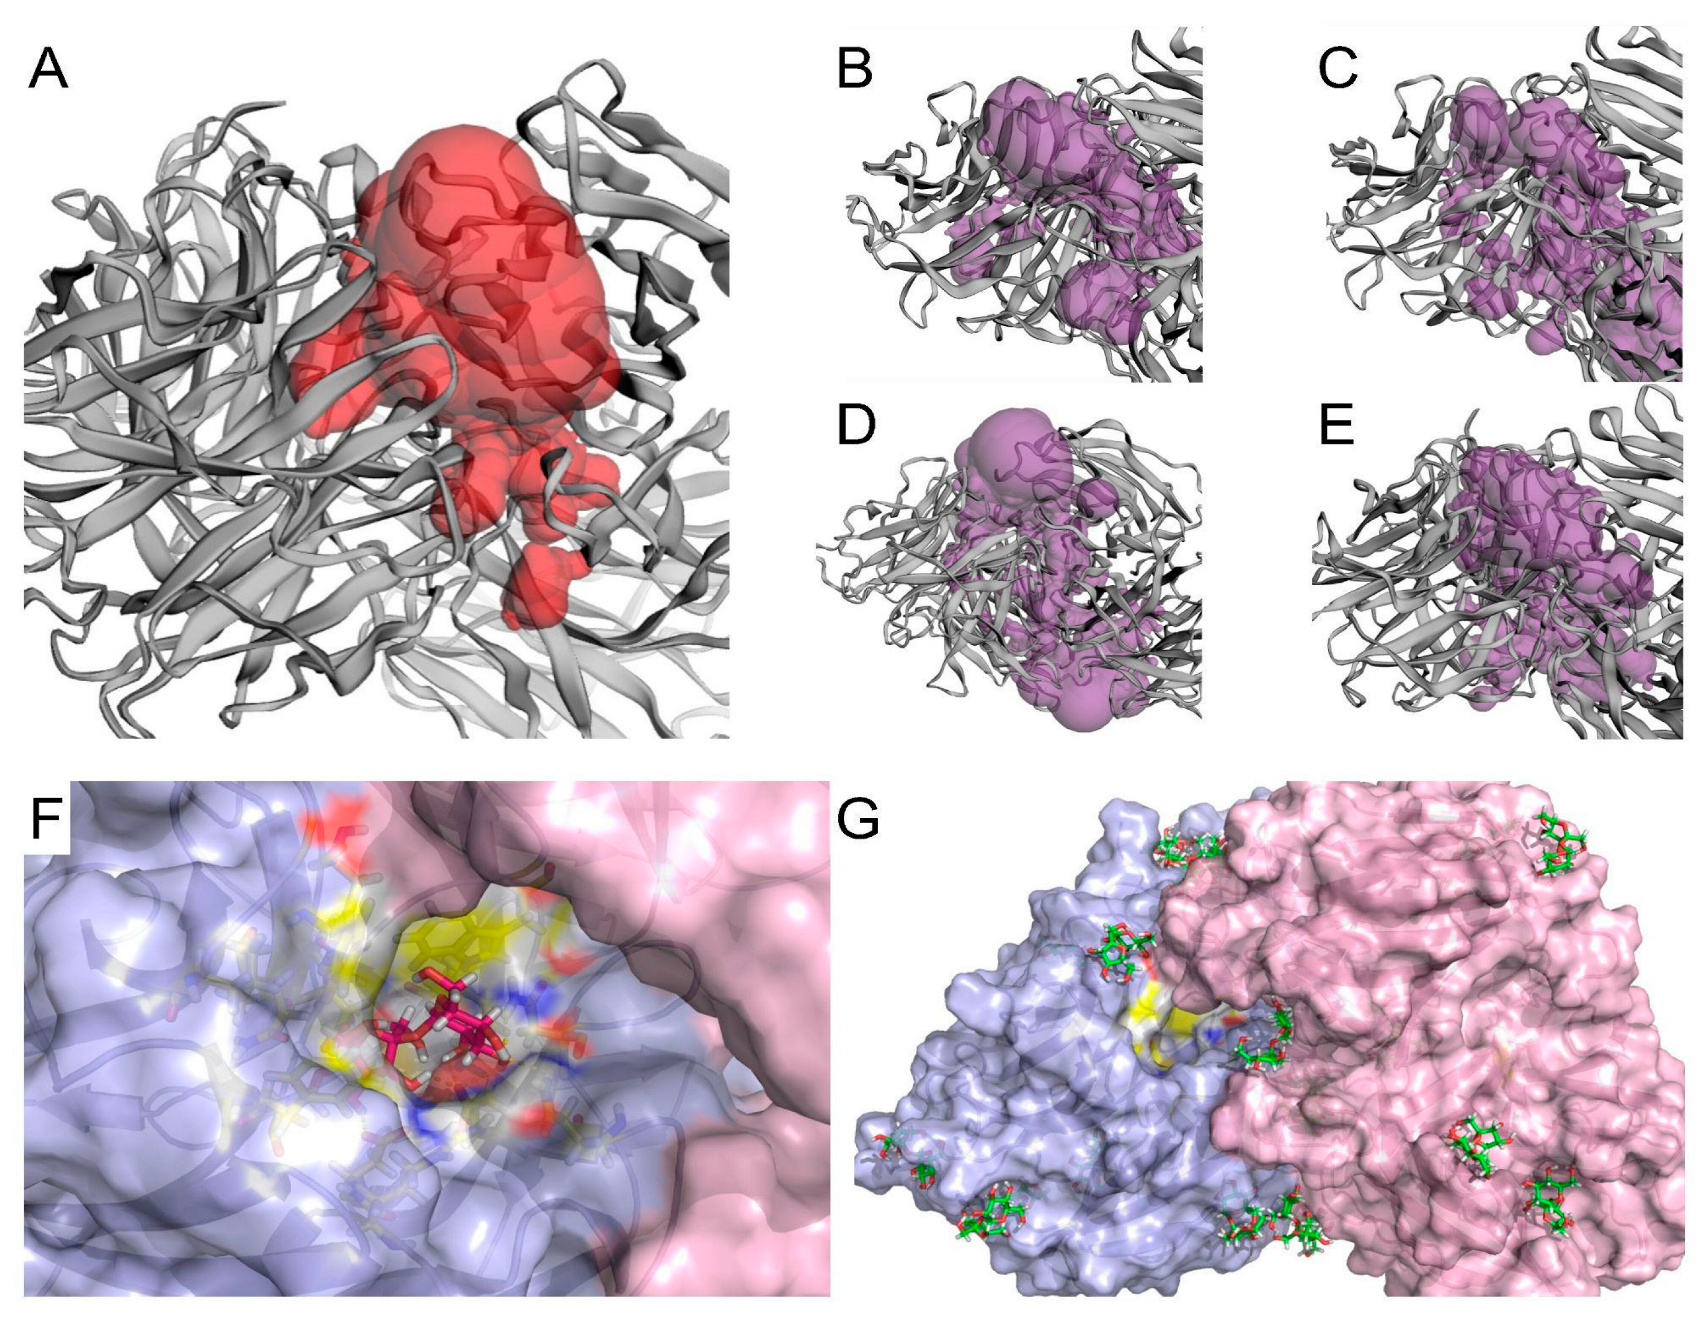
2.6. In Silico Investigation of Saccharomyces Cerevisiae Invertase

Attempting to understand the molecular interactions and potential inhibitory effects of some salts on the activity of invertase, computational investigations of the crystal structure of the enzyme were conducted. Initially, the octamer structure of the invertase derived from Saccharomyces cerevisiae was used in its entirety in the MD simulation studies, due to the importance of dimerization of dimerization in determining the substrate specificity and stability of the enzyme [40]. Overall, no significant deviation of the structure was observed (Figure S3), even in the presence of high concentrations of the salts and with a prolonged simulation time. However, certain salts were found to have the same effect at low and high concentrations (i.e., KCl, Mix I), whereas most of the salts increased the deviation of the structure at four times higher concentrations (CaCl2, MgCl2, CuCl). Surprisingly, NaCl and Mix II lowered the deviation of the structure at higher concentrations, which might be a result of increasing the rigidity of the structure at high concentrations of the salts rather than unfolding of the protein (Figure 7A,B). The most significant effect was observed with 7.25 g/L of NaCl (NF molasses concentration), followed by MgCl2, KCl, and CaCl2 at four times the baseline concentration.
Based on the results, the enzyme structure is seemingly stable under the tested conditions; however, this does not explain the experimentally observed effects of certain salts (e.g., KCl at 4× conc.) on the reaction rate. For a deeper understanding, dimers of the octamer structure were solely investigated. The crystal structures were MD simulated for 3 ns to regain the dynamic structure of the dimers, followed by docking of the sucrose. Dimer AB was the most stable throughout the 3 ns MD simulation, whereas GH was the highest in deviation (Figure S4); hence, AB was used for the docking study. The docking revealed the correct positioning of the sucrose within the active site pocket of both subunits A and B with binding energies of 3.69 and 2.21 Kcal/mol, respectively (Figure 8).
Since KCl showed a significant negative effect on the activity of the invertase experimentally, the computational study of its effect on the active site pocket was of interest, and MixI was also included in the investigation. The relaxed structure of subunit AB (2.5 ns snapshot) was used for calculating the area and volume of the active site pocket after treatment with different salts (Figure 9). Interestingly, KCl and Mix I resulted in distortion of the active site pocket, making it narrower, which would not be adequate for the accommodation of sucrose. Moreover, the cavity expanded, merging subunits A and B (Figure 10), which might explain the effects of the high salt concentration on the enzyme activity. Furthermore, redocking of the structure treated with different salt concentrations showed no productive binding of the sucrose within the active site pocket, whereas with the control structure (not treated with salts), productive binding was still possible with sucrose (Figure 10).

3. Materials and Methods

3.1. Molasses Pretreatment

The molasses, as in one of our previous studies, was pretreated with either UF or NF membranes. The UF molasses was a membrane permeate where the sucrose was separated from large-molecular-weight compounds, and the molasses obtained from the NF process was the retentate where sucrose was separated from low-molecular-weight compounds. The entire procedure and methods are presented in Sjölin et al. (2022) [14].

3.2. Impact of pH and Viscosity on Sucrose Hydrolysis

To minimize the impact of pH on the enzyme activity and to neglect the buffering capacity, all the types of feeds were pH adjusted to pH 4.5 (the pH that the hydrolysis solution stabilizes to) before any of the hydrolysis experiments using 2 M HCl [18,41].
The hydrolysis of sucrose experiments were performed in a 1 mL reaction volume in 4 mL vials, and all the experiments were performed in duplicate. Each vial contained aqueous solutions of CM, NF molasses, UF molasses, or TJ (a purer sucrose stream than molasses at the sugar refinery). All the solutions contained a sucrose concentration of approx. 300 g/L. Pure sucrose (PS) was used as the control, also containing a sucrose concentration of 300 g/L. Three milligrams of Saccharomyces cerevisiae (Kronjäst, Jästbolaget AB, Sollentuna, Sweden) were added to each reaction vial, and the hydrolysis was performed at 55 °C for 2 h. Sampling of 50 µL was regularly performed over time to assess the enzymatic hydrolysis rates.
The specific productivity (Qp/x) and specific yield (Yp/x) were calculated in the same way as described in Sjölin et al. (2022) [14].

3.3. Impact of Inorganic and Organic Compounds on Sucrose Hydrolysis

Different inorganic compounds were determined and measured in the CM, as described in Section 2.6. The most interesting and abundant compounds (Na+, K+, Mg2+, Ca2+, and Cu2+) were individually investigated for their effects on sucrose hydrolysis by Baker’s yeast. The synthetic solution was prepared by mixing the chloride salt of each of the chosen elements at the same concentration as present in CM and 4 times (4×) higher than their concentration in CM in a sucrose solution of 300 g/L. The sucrose hydrolysis experiments were carried out as described in Section 2.2. Through this strategy, it was possible to investigate the potential inhibitory effects of each single element and as a mix. These spiked elements’ impact on the sucrose hydrolysis rate by yeast was compared to the sucrose hydrolysis rates of PS, NF, and CM solutions.
Similarly, the impact of the most abundant organic compounds in CM on the sucrose hydrolysis rate was further assessed using yeast cells. The experiments were carried out as mentioned previously by studying the effects of different elements.

3.4. Invertase as a Free Enzyme

An investigation using isolated pure enzymes (I4504-1G, ≥300 units/mg solid, extracted from Saccharomyces cerevisiae, Sigma-Aldrich Co., St. Louis, MO, USA) instead of whole-cell invertase from Saccharomyces cerevisiae was performed. The hydrolysis tests were performed in accordance with Section 2.2. A dose of 0.05 mg/mL of pure enzyme was used, which corresponds to an equivalent yeast dose of 3 mg/mL (See Figure S1 in the Supplementary Information).
Additionally, to investigate whether high salt concentrations affect the free enzymes in similar ways to yeast cells, a hydrolysis experiment with K 4× concentration, mixed salt 4× concentration, and 80 g/L of Na was assessed and compared with PS, CM, and NF using the same procedure as in Section 2.2.

3.5. In Silico Investigation of Saccharomyces Cerevisiae Invertase

The crystal structure of Saccharomyces cerevisiae invertase was retrieved from the protein databank (PDB: 4eqv). YASARA structure was used for all the in silico investigations unless otherwise stated. The structure was cleaned by adding the missing hydrogen atoms and removing water molecules. The whole structure was energy minimized using the AMBER15IPQ forcefield before being used in the in silico experiments. Molecular dynamic (MD) simulations were used to investigate the effects of the different salts present in the CM solution. First, the whole structure (octamer) was used for the MD simulation. The simulation cell was defined with 10 Å around all the atoms, and the simulation cell was filled with either water (as a control, 0.997 g/mL density) or different concentrations of the salts (Table 4). The sucrose concentrations were 300 g/L. The pH was set to 4.5, the temperature was set at 55 °C, and the pressure was allowed to reach 1 bar. AMBER15IPQ forcefield was used to run the simulation, and the simulation was stopped after 1 ns. The analysis was performed based on the overall deviation of the alpha carbon backbone of the structure and fluctuation of the amino acid residues compared to the initial structure and the control simulation.
For the docking of sucrose, the octamer structure was divided into dimers [40] (AB; CD; EF; and GH) using the YASARA structure. The MD simulation was run for each dimer for 3 ns using AMBER15IPQ forcefield, the simulation cell was defined around all the atoms by 10 Å, and the simulation cell was filled with 0.997 g/mL of water containing 300 g/L of sucrose. Based on the structure deviation, three simulation snapshots were selected for running the docking study. The snapshots were energy minimized using the default setting of YASARA structure [42]. Docking was performed using Autodock and AMBER15IPQ forcefield, and 25 poses were selected. The docking was analyzed based on the productive binding mode within the active site and the binding energy [43]. Based on the docking results, dimer AB was selected for running further experiments. An MD simulation was run for the correct binding pose of sucrose in dimer AB for 2 ns, AMBER15IPQ was used as the forcefield, the simulation cell was defined with 10 Å around all the atoms, the pH was set to 4.5, the temperature was set to 55 °C, and the simulation cell was filled with water (for control) or different salt concentrations with the specified densities (Table 4). The volume and area of the active site pocket of the different dimers after the MD simulation were calculated using the Computed Atlas of Surface Topography of proteins online tool [44].

3.6. Analysis

Sucrose, fructose, and glucose were analyzed using a Shimadzu high-performance liquid chromatography (HPLC) system using a CarboSep CHO 782 as the analytical column (Concise Separations, San Jose, CA, USA) and a De-Ashing Bio-Rad microguard column as the pre-column (Bio-Rad Laboratories, Hercules, CA, USA). A mobile phase of deionized water was used at a flow rate of 0.6 mL/min at 70 °C.
The viscosity of the different sucrose solutions was measured using an MCR 302e rheometer (Anton Paar, Graz, Austria) equipped with a double gap bob and cup (CYLINDER B-DG26.7 and CUP C-DG26.7/SS/AIR, Anton Paar, Graz, Austria). The cup was filled with approximately 5 mL of sample, and the viscosity was measured at 20 °C at shear rates ranging from 0.1 to 1000 s−1.
The content of inorganic compounds was first determined using inductively coupled plasma optical emission spectroscopy (ICP-OES) for the most profound elements and inductively coupled plasma mass spectroscopy (ICP-MS) to determine the heavy metal contents of Pb and Cd for both CM and NF molasses. An Optima 8300 (Perkin Elmer, Waltham, MA, USA) was used for the ICP-OES analysis. An auxiliary flow of 0.5 L/min, a nebulizer flow of 0.65 mL/min, a sample flow rate of 1.5 mL/min, and a plasma flow of 10 L/min were used. The spray chamber was cyclonic, and a Mira Mist nebulizer was used. Each element analysis was performed in triplicate. The ICP-MS used was an Aurora Elite (Bruker Daltonik GmbH, Bremen, Germany). A plasma flow of 16.5 mL/min, an auxiliary flow of 1.4 L/min, a sheath gas flow of 0.2 L/min, and a nebulizer flow of 0.95 L/min were used. A total of 10 replicates per sample and 6 scans per replicate were performed.
For the identification of certain organic compounds present in the CM, liquid chromatography–mass spectroscopy (LC-MS) analysis was performed. The LC-MS consisted of an Agilent 1260 infinity system (Agilent Technologies, Santa Clara, CA, USA) including a DAD UV detector, infinity pump, and autosampler equipped with a Poroshell 120 EC-C18 analytical column (4 μm, 4.6 × 100 mm size, Agilent Technologies, Santa Clara, CA, USA), and connected to a 6545 Q-TOF LC/MS (Agilent Technologies, Santa Clara, CA, USA) with a mass range of 50–3000 m/z. A gradient of two different mobile phases, A and B, was run over 20 min, where eluent B increased from 5% to 100%. Eluent A contained 0.1% formic acid (VWR, Radnor, PA, USA) and 5% acetonitrile (Sigma-Aldrich, St. Louis, MO, USA) in Milli-Q water, and eluent B contained 0.1% formic acid (VWR, Radnor, PA, USA) in acetonitrile (SigmaAldrich, St. Louis, MO, USA). The flow was set to 0.5 mL/min, the injection volume to 1 μL, and the column oven temperature to 55 °C. From the complex matrix of molasses, the largest peak of the LC chromatogram was selected and identified using Agilent MassHunter Qualitative Analyses B.08.00 (Agilent Technologies, Santa Clara, CA, USA) software.
Since it is known that phenolic compounds are present in sugar beets as well as their possible impact on the invertase, the phenolic content was determined using the Folin-Ciocaltêu reagent method [25,26,27,28]. First, a 0.6 mL sample was mixed with 1.4 mL of deionized water and 2 mL of diluted Folin–Ciocaltêu reagent (which was pre-diluted by a factor 10 using deionized water) and mixed using a vortex mixer. After 5 min, 2 mL of a 7% Na2CO3 solution and an additional 0.8 mL of deionized water was added to the reaction vessel and mixed again using the vortex mixer. After 30 min of reaction time, the absorbance was measured at 765 nm using a Shimadzu UV-1800 spectrophotometer (Shimadzu Corporation, Kyoto, Japan). Gallic acid was used as a calibration standard, and all the samples were analyzed in triplicate [45].

4. Conclusions

In the types of complex compound matrices such as that of molasses, it is seldom just one factor that limits the process performance. Our previous observation of a positive effect of nanofiltration has been explained here as an effect of pH and the different buffering capacities of the various molasses types. However, even at stable pH levels, there was a significant difference between pure sucrose and molasses (both untreated CM and pretreated NF) with regard to sucrose hydrolysis.
When investigating the inorganic compounds, it was found that potassium, sodium, and in general high salt concentrations had an impact on the hydrolysis rates. However, this phenomenon was profound when the salt concentration was even higher than for the crude molasses sample, demonstrating that ionic strength is likely not the sole reason for the decreased enzymatic activity in molasses. Therefore, possible synergistic effects between different salts are probable, which was more profound during the experiments when using free enzymes compared to whole yeast cells. The in silico analysis confirms the experimental observation, where at high salt concentrations, the active site pocket is affected, preventing the substrate from properly binding. Hence, slow activity can be demonstrated.
There is also a possible impact of viscosity, since pure sucrose and thick juice yielded higher hydrolysis rates than the molasses-based solutions. However, there was also an obvious difference in sucrose purity, making the impact of viscosity uncertain.
There was no impact of gallic acid and betaine on the hydrolysis rate, and using free isolated enzymes worked just as well as whole yeast cells. This confirms that the use of whole cells is a suitable solution for further process development and scalability in the future. Moreover, using the whole cell hydrolysis of sucrose in molasses as well as the improvement of the hydrolysis process will lead to cost reductions during molasses pretreatment and potentially also during the production of HMF.

Supplementary Materials

The following supporting information can be downloaded at: https://www.mdpi.com/article/10.3390/catal14050330/s1, Figure S1: Determination of a suitable dose of pure invertase corresponding to 3 mg/mL of Baker’s Yeast; Figure S2: The LC chromatogram from the LC-MS analysis, where the largest peak eluting at 2.015 min corresponds to betaine; Figure S3: Root mean square deviation of the octamer structure with different salts and their different concentrations; Figure S4: Root mean square deviation of the four subunits after MD-simulation for 3 ns before docking experiments.

Author Contributions

Conceptualization, M.S. (Mikael Sjölin), M.S. (Mahmoud Sayed) and H.S.; methodology, M.S. (Mikael Sjölin), M.S. (Mahmoud Sayed), H.S. and M.I.; software, M.I.; validation, M.S. (Mikael Sjölin), M.S. (Mahmoud Sayed), M.D. and M.I.; formal analysis, M.S. (Mikael Sjölin), M.S. (Mahmoud Sayed), M.D. and M.I.; investigation, M.S. (Mikael Sjölin), M.S. (Mahmoud Sayed), M.D. and M.I.; resources, M.S. (Mikael Sjölin), M.S. (Mahmoud Sayed), H.S., R.H.-K. and O.W.; data curation, M.S. (Mikael Sjölin), M.S. (Mahmoud Sayed), M.D. and M.I.; writing—original draft preparation, M.S. (Mikael Sjölin); writing—review and editing, M.S. (Mikael Sjölin), M.S. (Mahmoud Sayed), M.I., H.S., O.W. and R.H.-K.; visualization, M.S. (Mikael Sjölin), M.D. and M.I.; supervision, O.W., M.S. (Mahmoud Sayed) and R.H.-K.; project administration, M.S. (Mikael Sjölin), M.S. (Mahmoud Sayed), R.H.-K. and O.W.; funding acquisition, M.S. (Mikael Sjölin), M.S. (Mahmoud Sayed), R.H.-K. and O.W. All authors have read and agreed to the published version of the manuscript.

Funding

This work was financially supported by Mistra (The Swedish Foundation for Strategic Environmental Research) funding for the research program Sustainable Plastics and Transition Pathways (STEPS, Project 2016/1489), and Richertska stiftelsen (project number 2022-00774).

Data Availability Statement

All the data presented in this study are available upon request by contacting the corresponding author by email: [email protected].

Acknowledgments

Nordic Sugar AB at Örtofta Sockerbruk is acknowledged for providing the molasses. Sofia Mebrahtu Wisén at the Department of Biology, Lund University, is acknowledged for the ICP-OES and ICP-MS analyses.

Conflicts of Interest

The authors declare no conflicts of interest.

References

  1. Zhang, S.; Wang, J.; Jiang, H. Microbial production of value-added bioproducts and enzymes from molasses, a by-product of sugar industry. Food Chem. 2021, 346, 128860. [Google Scholar] [CrossRef]
  2. Lipnizki, F. Membrane processes for sugar and starch processing. In Engineering Aspects of Membrane Separation and Application in Food Processing, 1st ed.; Field, R., Bekassy-Molnar, E., Lipnizki, F., Vatai, G., Eds.; Taylor & Francis Group, CRC Press: Boca Raton, FL, USA, 2016; pp. 241–267. [Google Scholar] [CrossRef]
  3. Beigbeder, J.B.; de Medeiros Dantas, J.M.; Lavoie, J.M. Optimization of yeast, sugar and nutrient concentrations for high ethanol production rate using industrial sugar beet molasses and response surface methodology. Fermentation 2021, 7, 86. [Google Scholar] [CrossRef]
  4. Milkessa, T.; Abate, D. Evaluation of Yeast Biomass Production Using Molasses and Supplements; LAP LAMBERT Academic Publishing: Saarbrücken, Germany, 2014. [Google Scholar]
  5. van Putten, R.-J.; Van Der Waal, J.C.; De Jong, E.; Rasrendra, C.B.; Heeres, H.J.; de Vries, J.G. Hydroxymethylfurfural, a versatile platform chemical made from renewable resources. Chem. Rev. 2013, 113, 1499–1597. [Google Scholar] [CrossRef] [PubMed]
  6. Wang, Y.; Brown, C.A.; Chen, R. Industrial production, application, microbial biosynthesis and degradation of furanic compound, hydroxymethylfurfural (HMF). AIMS Microbiol. 2018, 4, 261–273. [Google Scholar] [CrossRef] [PubMed]
  7. Iris, K.M.; Tsang, D.C. Conversion of biomass to hydroxymethylfurfural: A review of catalytic systems and underlying mechanisms. Biores. Technol. 2017, 238, 716–732. [Google Scholar] [CrossRef]
  8. Chibbar, R.N.; Jaiswal, S.; Gangola, M.; Båga, M. Carbohydrate Metabolism. In Encyclopedia of Food Grains, 2nd ed.; Wrigley, C.C., Corke, H., Seetharaman, K., Faubion, J., Eds.; Academic Press: Cambridge, MA, USA, 2016; pp. 161–173. [Google Scholar] [CrossRef]
  9. Bower, S.; Wickramasinghe, R.; Nagle, N.J.; Schell, D.J. Modeling sucrose hydrolysis in dilute sulfuric acid solutions at pretreatment conditions for lignocellulosic biomass. Biores. Technol. 2008, 99, 7354–7362. [Google Scholar] [CrossRef]
  10. Chen, H. Lignocellulose biorefinery feedstock engineering. In Lignocellulose Biorefinery Engineering, 1st ed.; Chen, H., Ed.; Woodhead Publishing: Sawston, UK, 2015; pp. 37–86. [Google Scholar] [CrossRef]
  11. Nakajima, M.; Nishizawa, K.; Nabetani, H. A forced flow membrane enzyme reactor for sucrose inversion using molasses. Bioprocess. Eng. 1993, 9, 31–35. [Google Scholar] [CrossRef]
  12. Combes, D.; Monsan, P. Sucrose hydrolysis by invertase. Characterization of products and substrate inhibition. Carbohydr. Res. 1983, 117, 215–228. [Google Scholar] [CrossRef]
  13. Zech, M.; Görisch, H. Invertase from Saccharomyces cerevisiae: Reversible inactivation by components of industrial molasses media. Enzyme Microb. Technol. 1995, 17, 41–46. [Google Scholar] [CrossRef]
  14. Sjölin, M.; Sayed, M.; Thuvander, J.; Lipnizki, F.; Hatti-Kaul, R.; Wallberg, O. Effect of membrane purification and concentration of sucrose in sugar beet molasses for the production of 5-hydroxymethylfurfural. Chem. Eng. Res. Des. 2022, 179, 365–373. [Google Scholar] [CrossRef]
  15. Plascencia-Espinosa, M.; Santiago-Hernández, A.; Pavón-Orozco, P.; Vallejo-Becerra, V.; Trejo-Estrada, S.; Sosa-Peinado, A.; Benitez-Cardoza, C.G.; Hidalgo-Lara, M.E. Effect of deglycosylation on the properties of thermophilic invertase purified from the yeast Candida guilliermondii MpIIIa. Process Biochem. 2014, 49, 1480–1487. [Google Scholar] [CrossRef]
  16. Essel, K.K.; Osei, Y.D. Investigation of Some Kinetic Properties of Commercial Invertase from Yeast. Nat. Prod. Chem. Res. 2014, 2, 6. [Google Scholar] [CrossRef]
  17. Šarić, L.C.; Filipčev, B.V.; Šimurina, O.D.; Plavšić, D.V.; Šarić, B.M.; Lazarević, J.M.; Milovanović, I.L. Sugar beet molasses: Properties and applications in osmotic dehydration of fruits and vegetables. Food Feed. Res. 2016, 43, 135–144. [Google Scholar] [CrossRef]
  18. Kumar, R.; Kesavapillai, B. Stimulation of extracellular invertase production from spent yeast when sugarcane pressmud used as substrate through solid state fermentation. SpringerPlus 2012, 1, 81. [Google Scholar] [CrossRef] [PubMed]
  19. Takeshige, K.; Ouchi, K. Factors affecting the ethanol productivity of yeast in molasses. J. Ferment. Bioeng. 1995, 79, 449–452. [Google Scholar] [CrossRef]
  20. Kaur, N.; Sharma, A.D. Production, optimization and characterization of extracellular invertase by an actinomycete strain. J. Sci. Ind. Res. 2005, 64, 515–519. [Google Scholar]
  21. Cuezzo de Ginés, S.; Maldonado, M.; Font de Valdez, G. Purification and characterization of invertase from lactobacillus reuteri CRL 1100. Curr. Microbiol. 2000, 40, 181–184. [Google Scholar] [CrossRef] [PubMed]
  22. Hargono, H.; Jos, B.; Abdullah, A.; Riyanto, T. Inhibition effect of Ca2+ ions on sucrose hydrolysis using invertase. Bull. Chem. React. Eng. Catal. 2019, 14, 646–653. [Google Scholar] [CrossRef]
  23. Maruyama, Y.; Onodera, K. Production and some properties of invertase isozymes of Fusarium oxysporum. J. Gen. Appl. Microbiol. 1979, 25, 361–366. [Google Scholar] [CrossRef]
  24. Rashad, M.M.; Nooman, M.U. Production, purification and characterization of extracellular invertase from Saccharomyses Cerevisiae NRRL Y-12632 by solid-state fermentation of red carrot residue. Aust. J. Basic. Appl. Sci. 2009, 3, 1910–1919. [Google Scholar]
  25. Bellido, C.; Lucas, S.; González-Benito, G.; García-Cubero, M.T.; Coca, M. Synergistic positive effect of organic acids on the inhibitory effect of phenolic compounds on Acetone-Butanol-Ethanol (ABE) production. Food Bioprod. Process. 2018, 108, 117–125. [Google Scholar] [CrossRef]
  26. Guimaraes, C.M.; GIao, M.S.; Martinez, S.S.; Pintado, A.I.; Pintado, M.E.; Bento, L.S.; Malcata, F.X. Antioxidant activity of sugar molasses, including protective effect against DNA oxidative damage. J. Food. Sci. 2007, 72, C039–C043. [Google Scholar] [CrossRef]
  27. Payet, B.; Shum Cheong Sing, A.; Smadja, J. Comparison of the concentrations of phenolic constituents in cane sugar manufacturing products with their antioxidant activities. J. Agric. Food Chem. 2006, 54, 7270–7276. [Google Scholar] [CrossRef]
  28. Polakovič, M.; Handriková, G.; Košík, M. Inhibitory effects of some phenolic compounds on enzymatic hydrolysis of sucrose. Biomass Bioenerg. 1992, 3, 369–371. [Google Scholar] [CrossRef]
  29. Stamogiannou, I.; Van Camp, J.; Smagghe, G.; Van de Walle, D.; Dewettinck, K.; Raes, K. Impact of phenolic compound as activators or inhibitors on the enzymatic hydrolysis of cellulose. Int. J. Biol. Macromol. 2021, 186, 174–180. [Google Scholar] [CrossRef]
  30. Uribe, S.; Sampedro, J.G. Measuring solution viscosity and its effect on enzyme activity. Biol. Proced. Online 2003, 5, 108–115. [Google Scholar] [CrossRef]
  31. Van der Bruggen, B.; Koninckx, A.; Vandecasteele, C. Separation of monovalent and divalent ions from aqueous solution by electrodialysis and nanofiltration. Water Res. 2004, 38, 1347–1353. [Google Scholar] [CrossRef]
  32. Sjölin, M.; Thuvander, J.; Wallberg, O.; Lipnizki, F. Purification of sucrose in sugar beet molasses by utilizing ceramic nanofiltration and ultrafiltration membranes. Membranes 2019, 10, 5. [Google Scholar] [CrossRef]
  33. Nilsson, U.; Öste, R.; Jägerstad, M. Cereal fructans: Hydrolysis by yeast invertase, in vitro and during fermentation. J. Cereal Sci. 1987, 6, 53–60. [Google Scholar] [CrossRef]
  34. Kulshrestha, S.; Tyagi, P.; Sindhi, V.; Yadavilli, K.S. Invertase and its applications–a brief review. J. Pharm. Res. 2013, 7, 792–797. [Google Scholar] [CrossRef]
  35. Kramers, H.A. Brownian motion in a field of force and the diffusion model of chemical reactions. Physica 1940, 7, 284–304. [Google Scholar] [CrossRef]
  36. Jacob, M.; Schmid, F.X. Protein folding as a diffusional process. Biochemistry 1999, 38, 13773–13779. [Google Scholar] [CrossRef] [PubMed]
  37. Anderson, R.S.; Ewing, E.E.; Senesac, A.H. Inhibition of potato tuber invertase by an endogenous inhibitor: Effects of salts, pH, temperature, and sugars on binding. Plant Physiol. 1980, 66, 451–456. [Google Scholar] [CrossRef] [PubMed]
  38. Escudero, I.; Ruiz, M.O. Extraction of betaine from beet molasses using membrane contactors. J. Membr. Sci. 2011, 372, 258–268. [Google Scholar] [CrossRef]
  39. Ghazi, I.; Fernandez-Arrojo, L.; Gomez De Segura, A.; Alcalde, M.; Plou, F.J.; Ballesteros, A. Beet sugar syrup and molasses as low-cost feedstock for the enzymatic production of fructo-oligosaccharides. J. Agric. Food Chem. 2006, 54, 2964–2968. [Google Scholar] [CrossRef] [PubMed]
  40. Sainz-Polo, M.A.; Ramírez-Escudero, M.; Lafraya, A.; González, B.; Marín-Navarro, J.; Polaina, J.; Sanz-Aparicio, J. Three-dimensional structure of Saccharomyces invertase: Role of a non-catalytic domain in oligomerization and substrate specificity. J. Biol. Chem. 2013, 288, 9755–9766. [Google Scholar] [CrossRef] [PubMed]
  41. Feng, S.; Bagia, C.; Mpourmpakis, G. Determination of proton affinities and acidity constants of sugars. J. Phys. Chem. A. 2013, 117, 5211–5219. [Google Scholar] [CrossRef]
  42. Krieger, E.; Joo, K.; Lee, J.; Lee, J.; Raman, S.; Thompson, J.; Tyka, M.; Baker, D.; Karplus, K. Improving physical realism, stereochemistry, and side-chain accuracy in homology modeling: Four approaches that performed well in CASP8. Proteins Struct. Funct. Bioinf. 2009, 77, 114–122. [Google Scholar] [CrossRef] [PubMed]
  43. Morris, G.M.; Goodsell, D.S.; Halliday, R.S.; Huey, R.; Hart, W.E.; Belew, R.K.; Olson, A.J. Automated docking using a Lamarckian genetic algorithm and an empirical binding free energy function. J. Comput. Chem. 1998, 19, 1639–1662. [Google Scholar] [CrossRef]
  44. Tian, W.; Chen, C.; Lei, X.; Zhao, J.; Liang, J. CASTp 3.0: Computed atlas of surface topography of proteins. Nucleic Acids Res. 2018, 46, W363–W367. [Google Scholar] [CrossRef]
  45. Everette, J.D.; Bryant, Q.M.; Green, A.M.; Abbey, Y.A.; Wangila, G.W.; Walker, R.B. Thorough study of reactivity of various compound classes toward the Folin− Ciocalteu reagent. J. Agric. Food Chem. 2010, 58, 8139–8144. [Google Scholar] [CrossRef]
Figure 1. Hydrolysis inhibition using 3 mg/mL of yeast and the effects of various viscosities, where PS = pure sucrose, UF = ultrafiltered molasses, TJ = thick juice, NF = nanofiltration retentate, and CM = crude molasses.
Catalysts 14 00330 g001
Figure 2. Effects of different salts on sucrose hydrolysis in pure sugar (PS) solution, nanofiltration retentate (NF), and crude molasses (CM). The elements added to the PS solution were (a) Na, (b) Mg, (c) K, (d) Ca, (e) Cu, and (f) a mix of them all.
Catalysts 14 00330 g002aCatalysts 14 00330 g002b
Figure 3. Specific productivity (Qp/x) after (a) 10 min reaction time and (b) 60 min reaction time; (c) the specific yield (Yp/x) after 120 min, where PS (=pure sucrose) was used as a control and CM (=crude molasses) was used as a reference.
Catalysts 14 00330 g003
Figure 4. Hydrolysis inhibition experimental results illustrating the effects of betaine and gallic acid, where PS = pure sucrose, NF = nanofiltration retentate, and CM = crude molasses.
Catalysts 14 00330 g004
Figure 5. Sucrose hydrolysis with invertase as a free enzyme shown as substrate consumption (a) and glucose product formation (b), where PS = pure sucrose, UF = ultrafiltered molasses, TJ = thick juice, NF = nanofiltration retentate, and CM = crude molasses.
Catalysts 14 00330 g005
Figure 6. Sucrose hydrolysis inhibition at high salt concentrations in the reaction using free enzyme.
Catalysts 14 00330 g006
Figure 7. Deviation of the alpha carbon backbone of the simulated octamer structure of the invertase enzyme. (A) Deviation throughout simulation time for the different salts with different concentrations. (B) Average root mean square deviation (RMSD) of the structures treated with different salts.
Catalysts 14 00330 g007aCatalysts 14 00330 g007b
Figure 8. Productive docking pose within subunit A. Subunit A surface in blue, subunit B in pink, active site residues in yellow, and sucrose in red sticks. H bonds formed between sucrose and the active site residues are shown in yellow dots (left side).
Catalysts 14 00330 g008
Figure 9. Area and volume calculated for the active site cavity of subunit AB after MD simulation with different salts concentrations.
Catalysts 14 00330 g009
Figure 10. MD simulation of subunit AB using different salts with different concentrations and their effects on the active site cavity and the binding of sucrose. (A) Geometry of active site entrance and pocket for subunit AB after MD simulation without the addition of salts. (B) Active site cavity after MD simulation adding 4 times KCl concentration and (C) additional sucrose. (D) Cavity within subunit AB after MD simulation, adding Mix I and (E) additional sucrose. (F) Docking of sucrose to the salts untreated and (G) treated enzyme structure.
Catalysts 14 00330 g010
Table 1. Overview of previous studies that have investigated the effects of various salts on invertase.
ReferenceInvertase OriginReaction
Conditions
Type of Element Effects on Invertase
InhibitionPromotion
Kumar and Kesavapillai (2012) [18]S. cerevisiae5 mM salt, pH 4–10, 10–60 °CZn2+, Mg2+, Cu2+Mn2+, Al3+, Fe3+
Plascencia-Espinosa et al. (2014) [15]Candida guilliermondiipH 5, 65 °C, 1–10 mM salt, 10% sucroseCu2+, Zn2+, Hg2+Mn2+, Co2+
Takeshige and Ouchi (1995) [19]S. cerevisiae10% sucrose, pH 5, 30 °CK+, Na+, Ca2+, Mg2+, Fe3+, Mn2+, Zn2+, Cu2+
Essel and Osei (2014) [16]S. cerevisiae0.1 mM salt, 40 °C, pH 5.5Ag+
Kaur and Sharma (2005) [20]Streptomyces1 mM salt, pH 5, 50–60 °CCu2+, Na+, Hg2+, Ca2+Co2+
Ginés, et al. (2000) [21]Lactobacillus reuteri1 mM salt, 0.1 M sucrose, pH 5, 30 °CCa2+, Cu2+, Cd2+, Hg2+
Hargono, et al. (2019) [22]S. cerevisiae10 g/L sucrose, 50 °C, pH 5Ca2+
Maruyama and Onodera (1979) [23]Fusarium oxysporum20 mM salt, 3% sucrose,
30 °C
Ca2+, Zn2+, Cu2+(Ni2+ and Co2+ neutral effect)
Rashad and Nooman (2009) [24]S. cerevisiae1 mM salt, 0.1 M sucrose, 30 °CHg2+, Ba2+, Zn2+, Fe2+Co2+, (Ni2+, Cu2+, Ca2+, and Mg2+ neutral effect)
Table 2. ICP-OES and ICP-MS results of three different molasses types (CM, UF, and NF), and thick juice (TJ). All results are normalized per gram of sucrose, with an analysis standard deviation of ±15%.
ElementAnalysis Wavelength
(nm)
Crude Molasses
(mg L−1 gsucrose−1)
Ultrafiltered Molasses
(mg L−1 gsucrose−1)
Nanofiltered
Molasses
(mg L−1 gsucrose−1)
Thick Juice
(mg L−1 gsucrose−1)
Ca317.9332.171.713.330.15
Cd228.8020.000.000.000.00
Cu327.3930.010.010.070.00
Fe238.2040.010.000.050.00
K766.49067.6264.8660.055.74
Mg285.2130.060.070.070.00
Na589.5929.509.078.280.60
P213.6170.520.470.580.07
Pb220.3530.000.000.000
Zn206.2000.020.020.030.01
Table 3. Specific productivity (in gprod L−1 h−1 gcell−1) at 10 min and 60 min reaction times, and specific yield (in gprod gcell−1) after 120 min when using free enzyme for the hydrolysis of pure sucrose (PS), PS with high concentrations of salts, crude molasses (CM), and nanofiltered molasses (NF).
PSK ×4 Conc.Na 80 g/LSalt Mix 4× conc.CMNF
Qp/x,10min14,56785486039368010,78812,391
Qp/x,60min556937272509157737804389
Yp/x,120min641554593863189149975658
Table 4. Concentrations of the different salts used in the MD simulation studies, whereas Salt Mix I is the sum of NaCl, CaCL2, KCl, MgCl2, and CuCl2, and Salt Mix II contains the same salt mix plus betaine and gallic acid. A 300 g/L sucrose concentration was used in all the studies.
NaCl (g L−1)CaCl2 (g L−1)KCl (g L−1)MgCl2 (g L−1)CuCl2 (g L−1)Salt Mix I (g L−1)Betaine (g L−1)Gallic Acid (g L−1)Salt Mix II (g L−1)
NF molasses7.252.3838.710.160.00448.5125.212.1775.89
NF 4× conc.25.4414.65152.670.830.26193.87100.848.68303.56
Disclaimer/Publisher’s Note: The statements, opinions and data contained in all publications are solely those of the individual author(s) and contributor(s) and not of MDPI and/or the editor(s). MDPI and/or the editor(s) disclaim responsibility for any injury to people or property resulting from any ideas, methods, instructions or products referred to in the content.

