
Geometrical Variation Analysis of Landslides in Different Geological Settings Using Satellite Images: Case Studies in Japan and Sri Lanka


Abstract
:1. Introduction
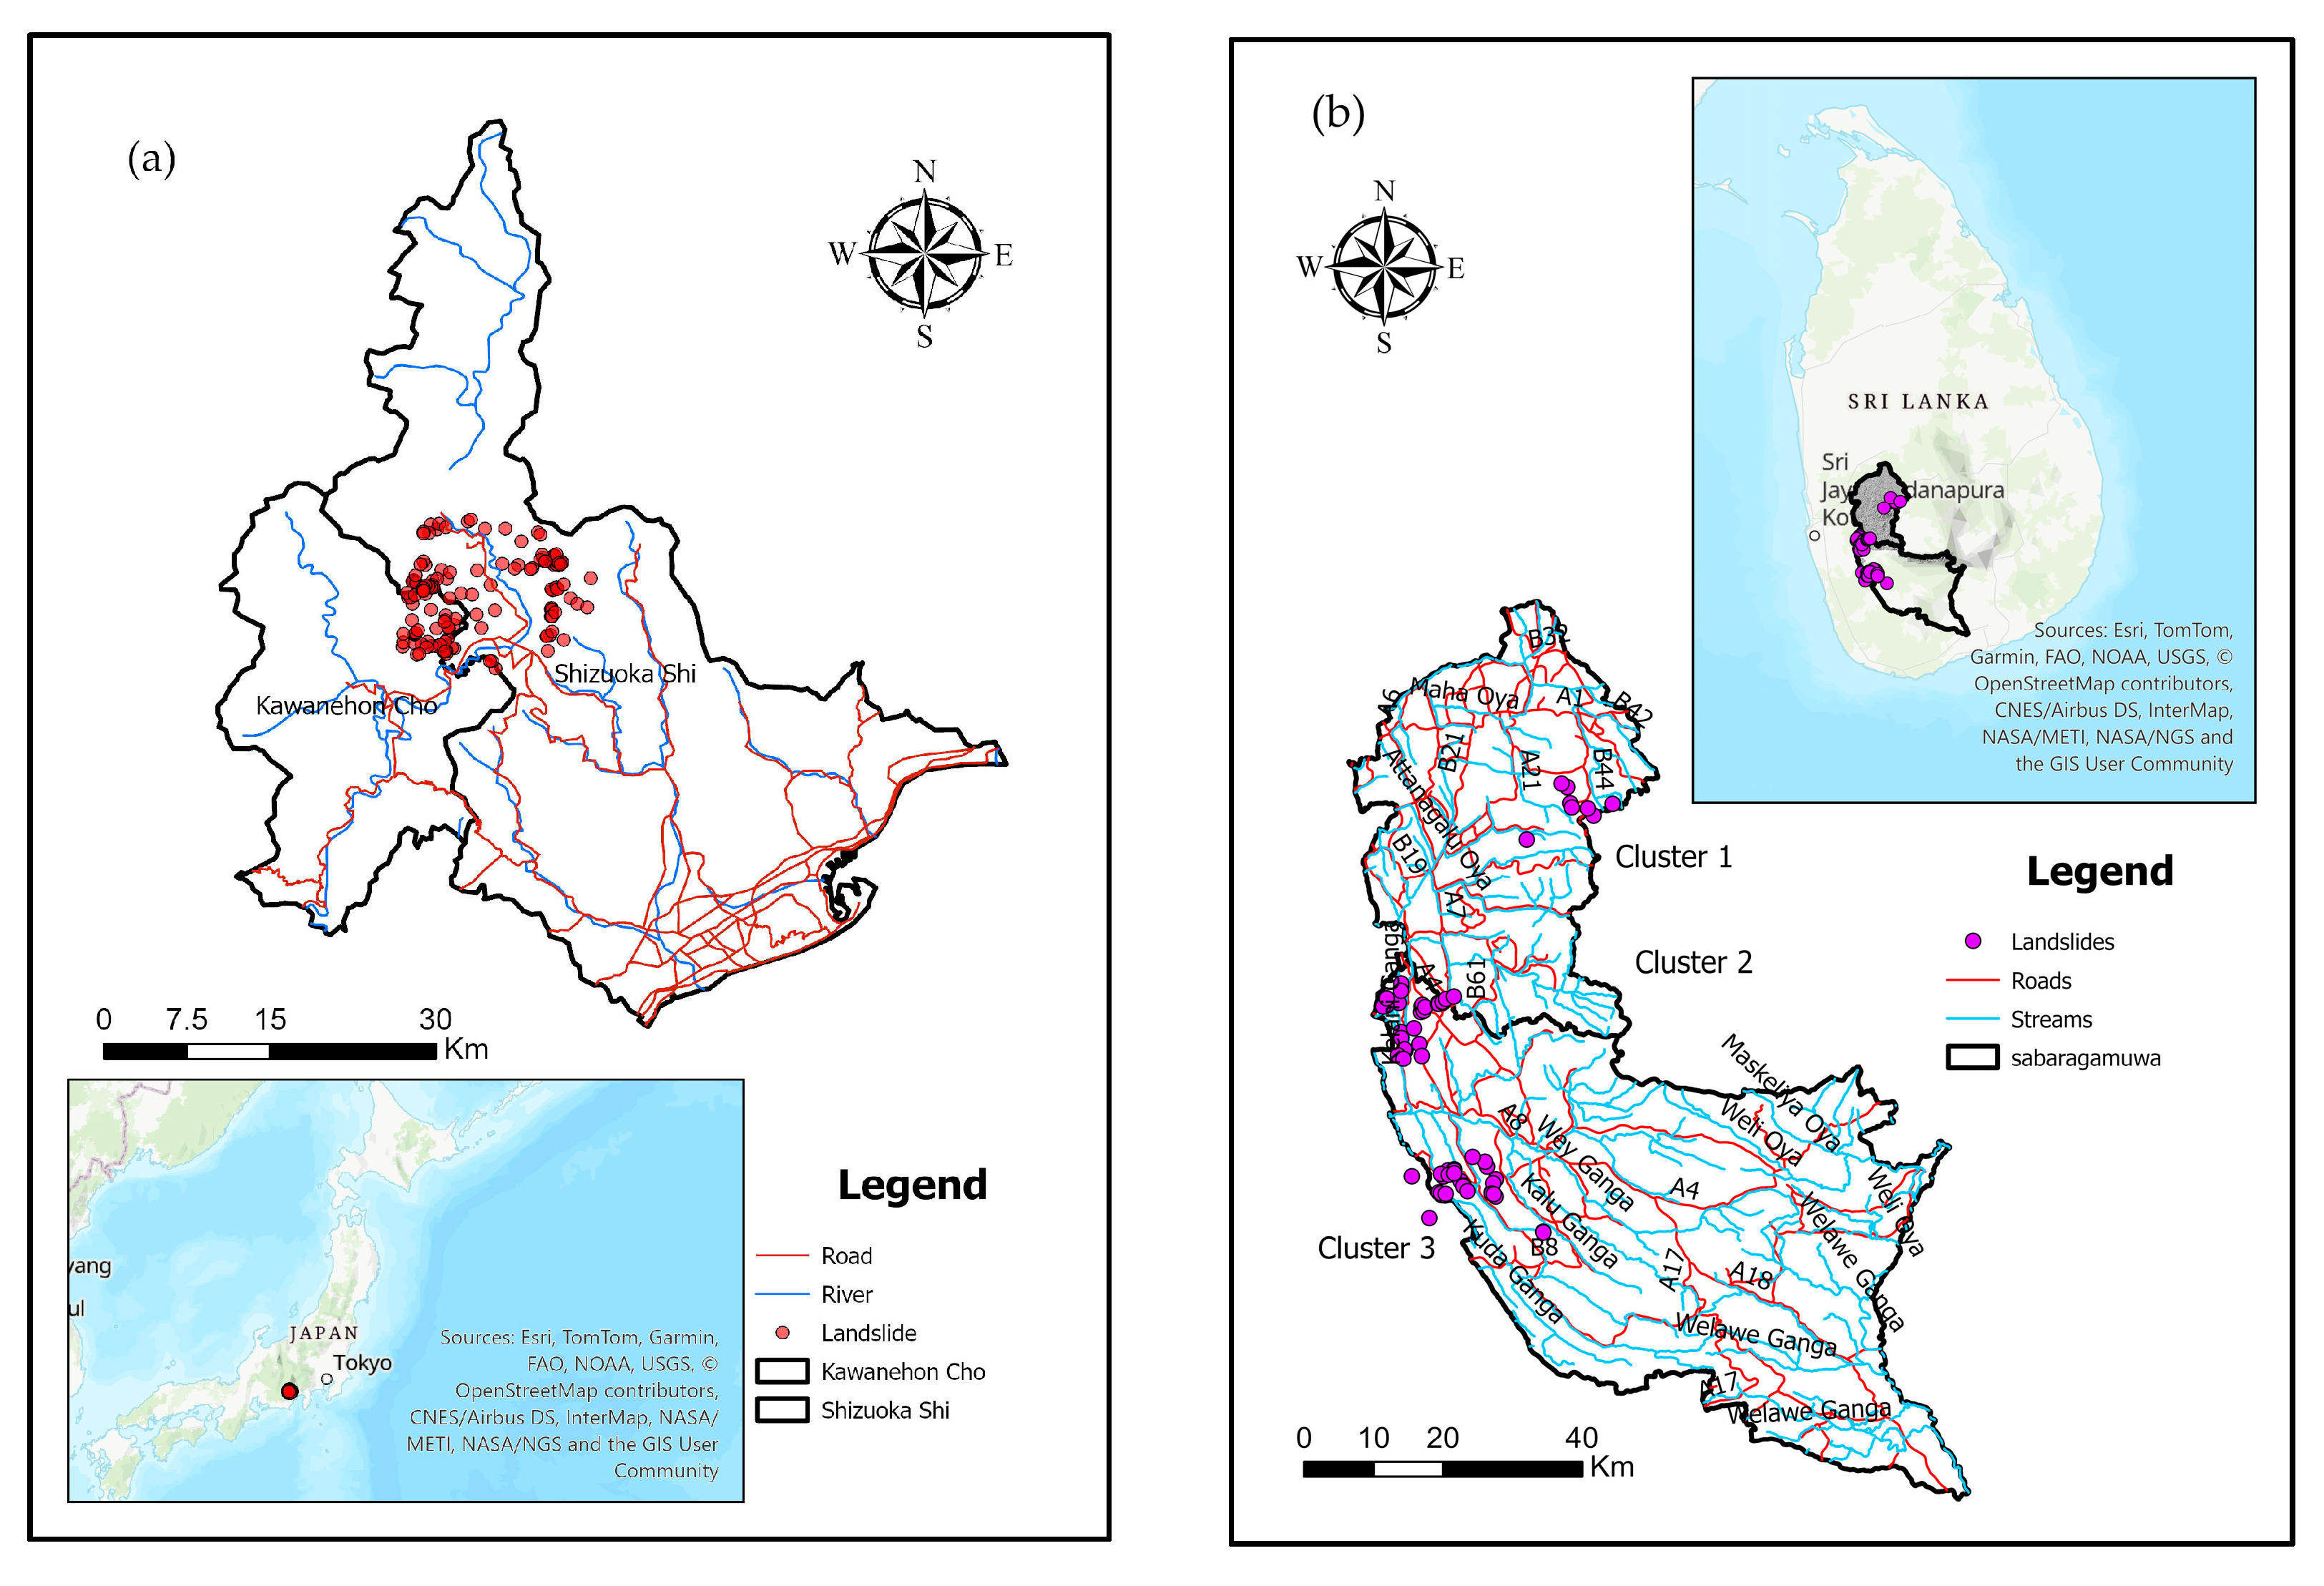
2. Study Area
2.1. Geology and Geological Age
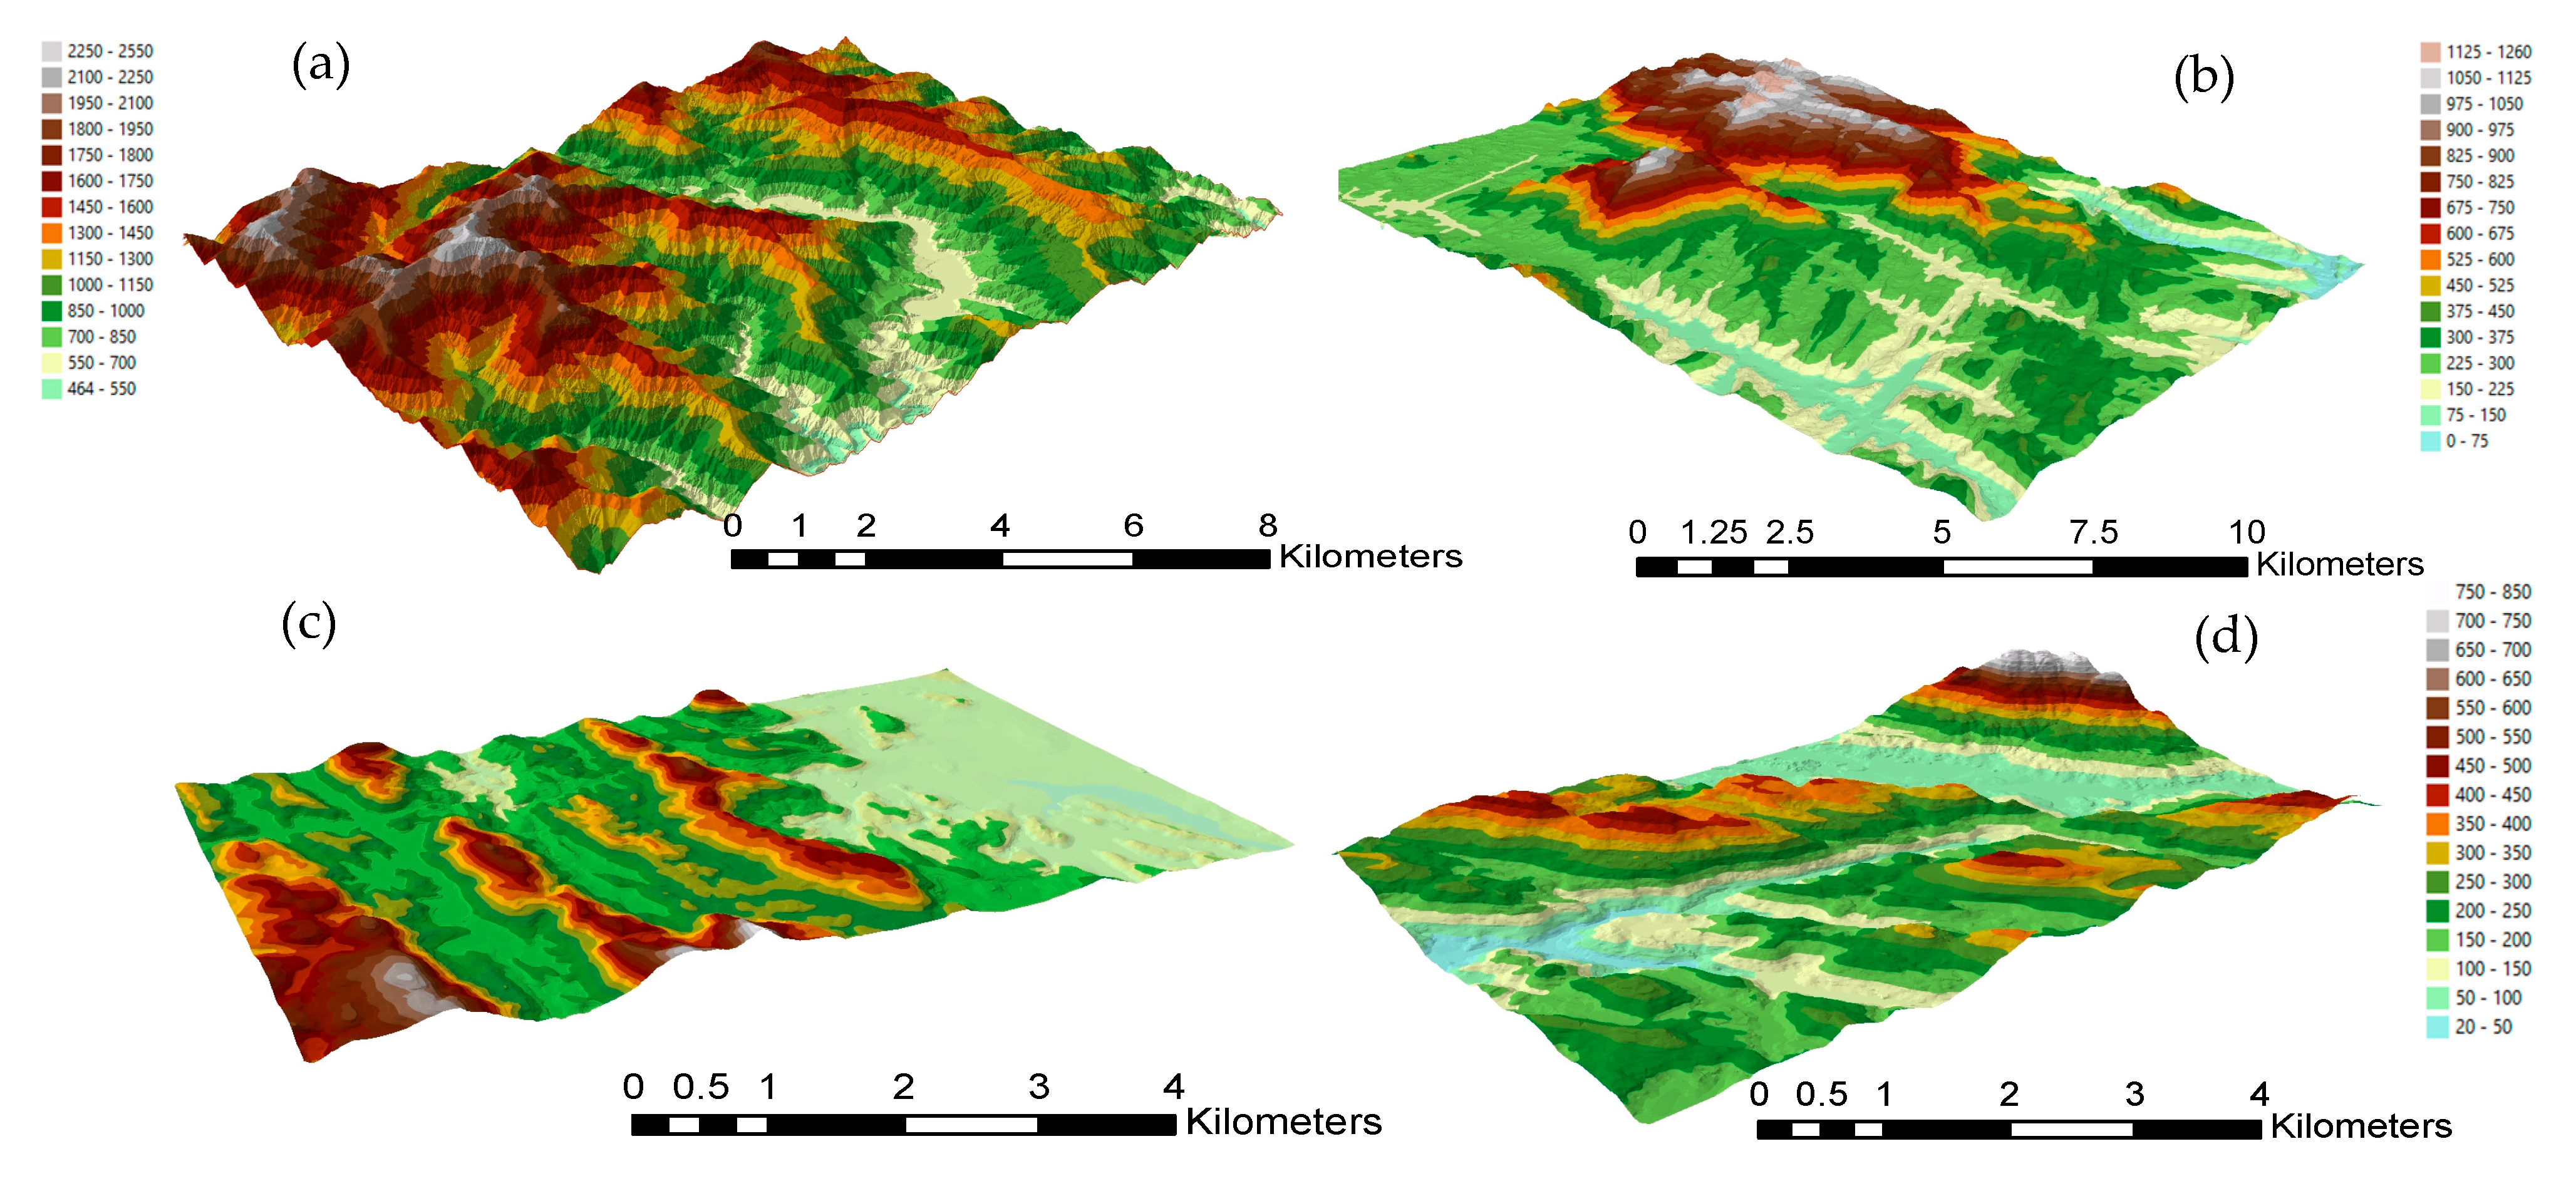
2.2. Topography and Climate
3. Materials and Methods
4. Results
4.1. Comparative Analysis of Landslide Characteristics Based on Rock Study Areas
4.1.1. Landslide Density
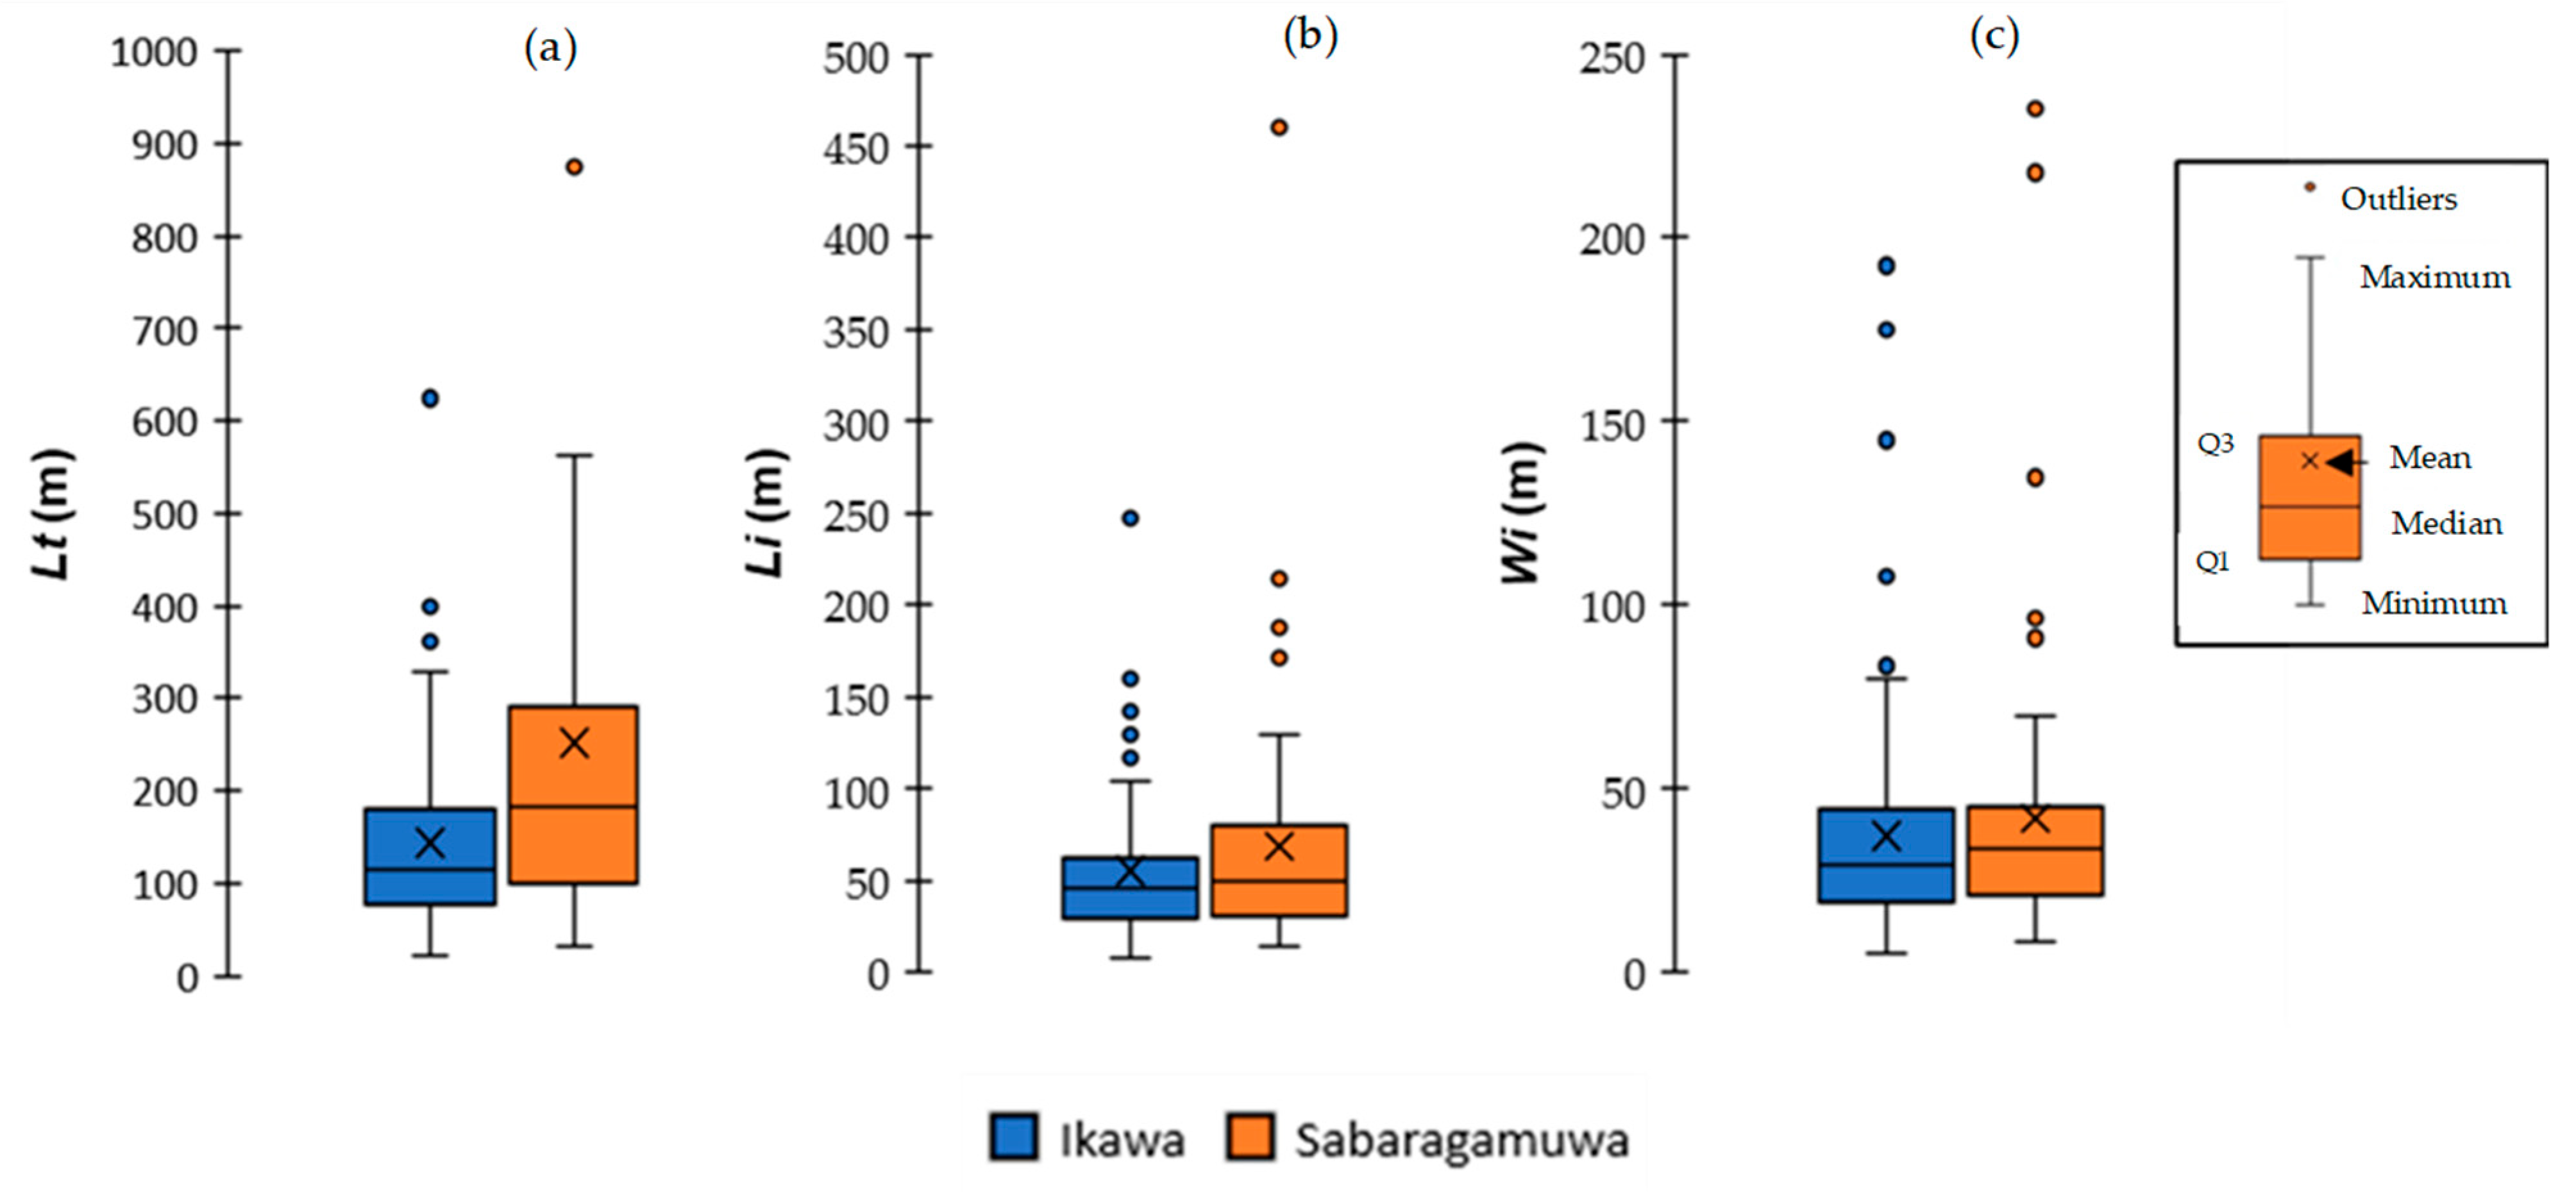
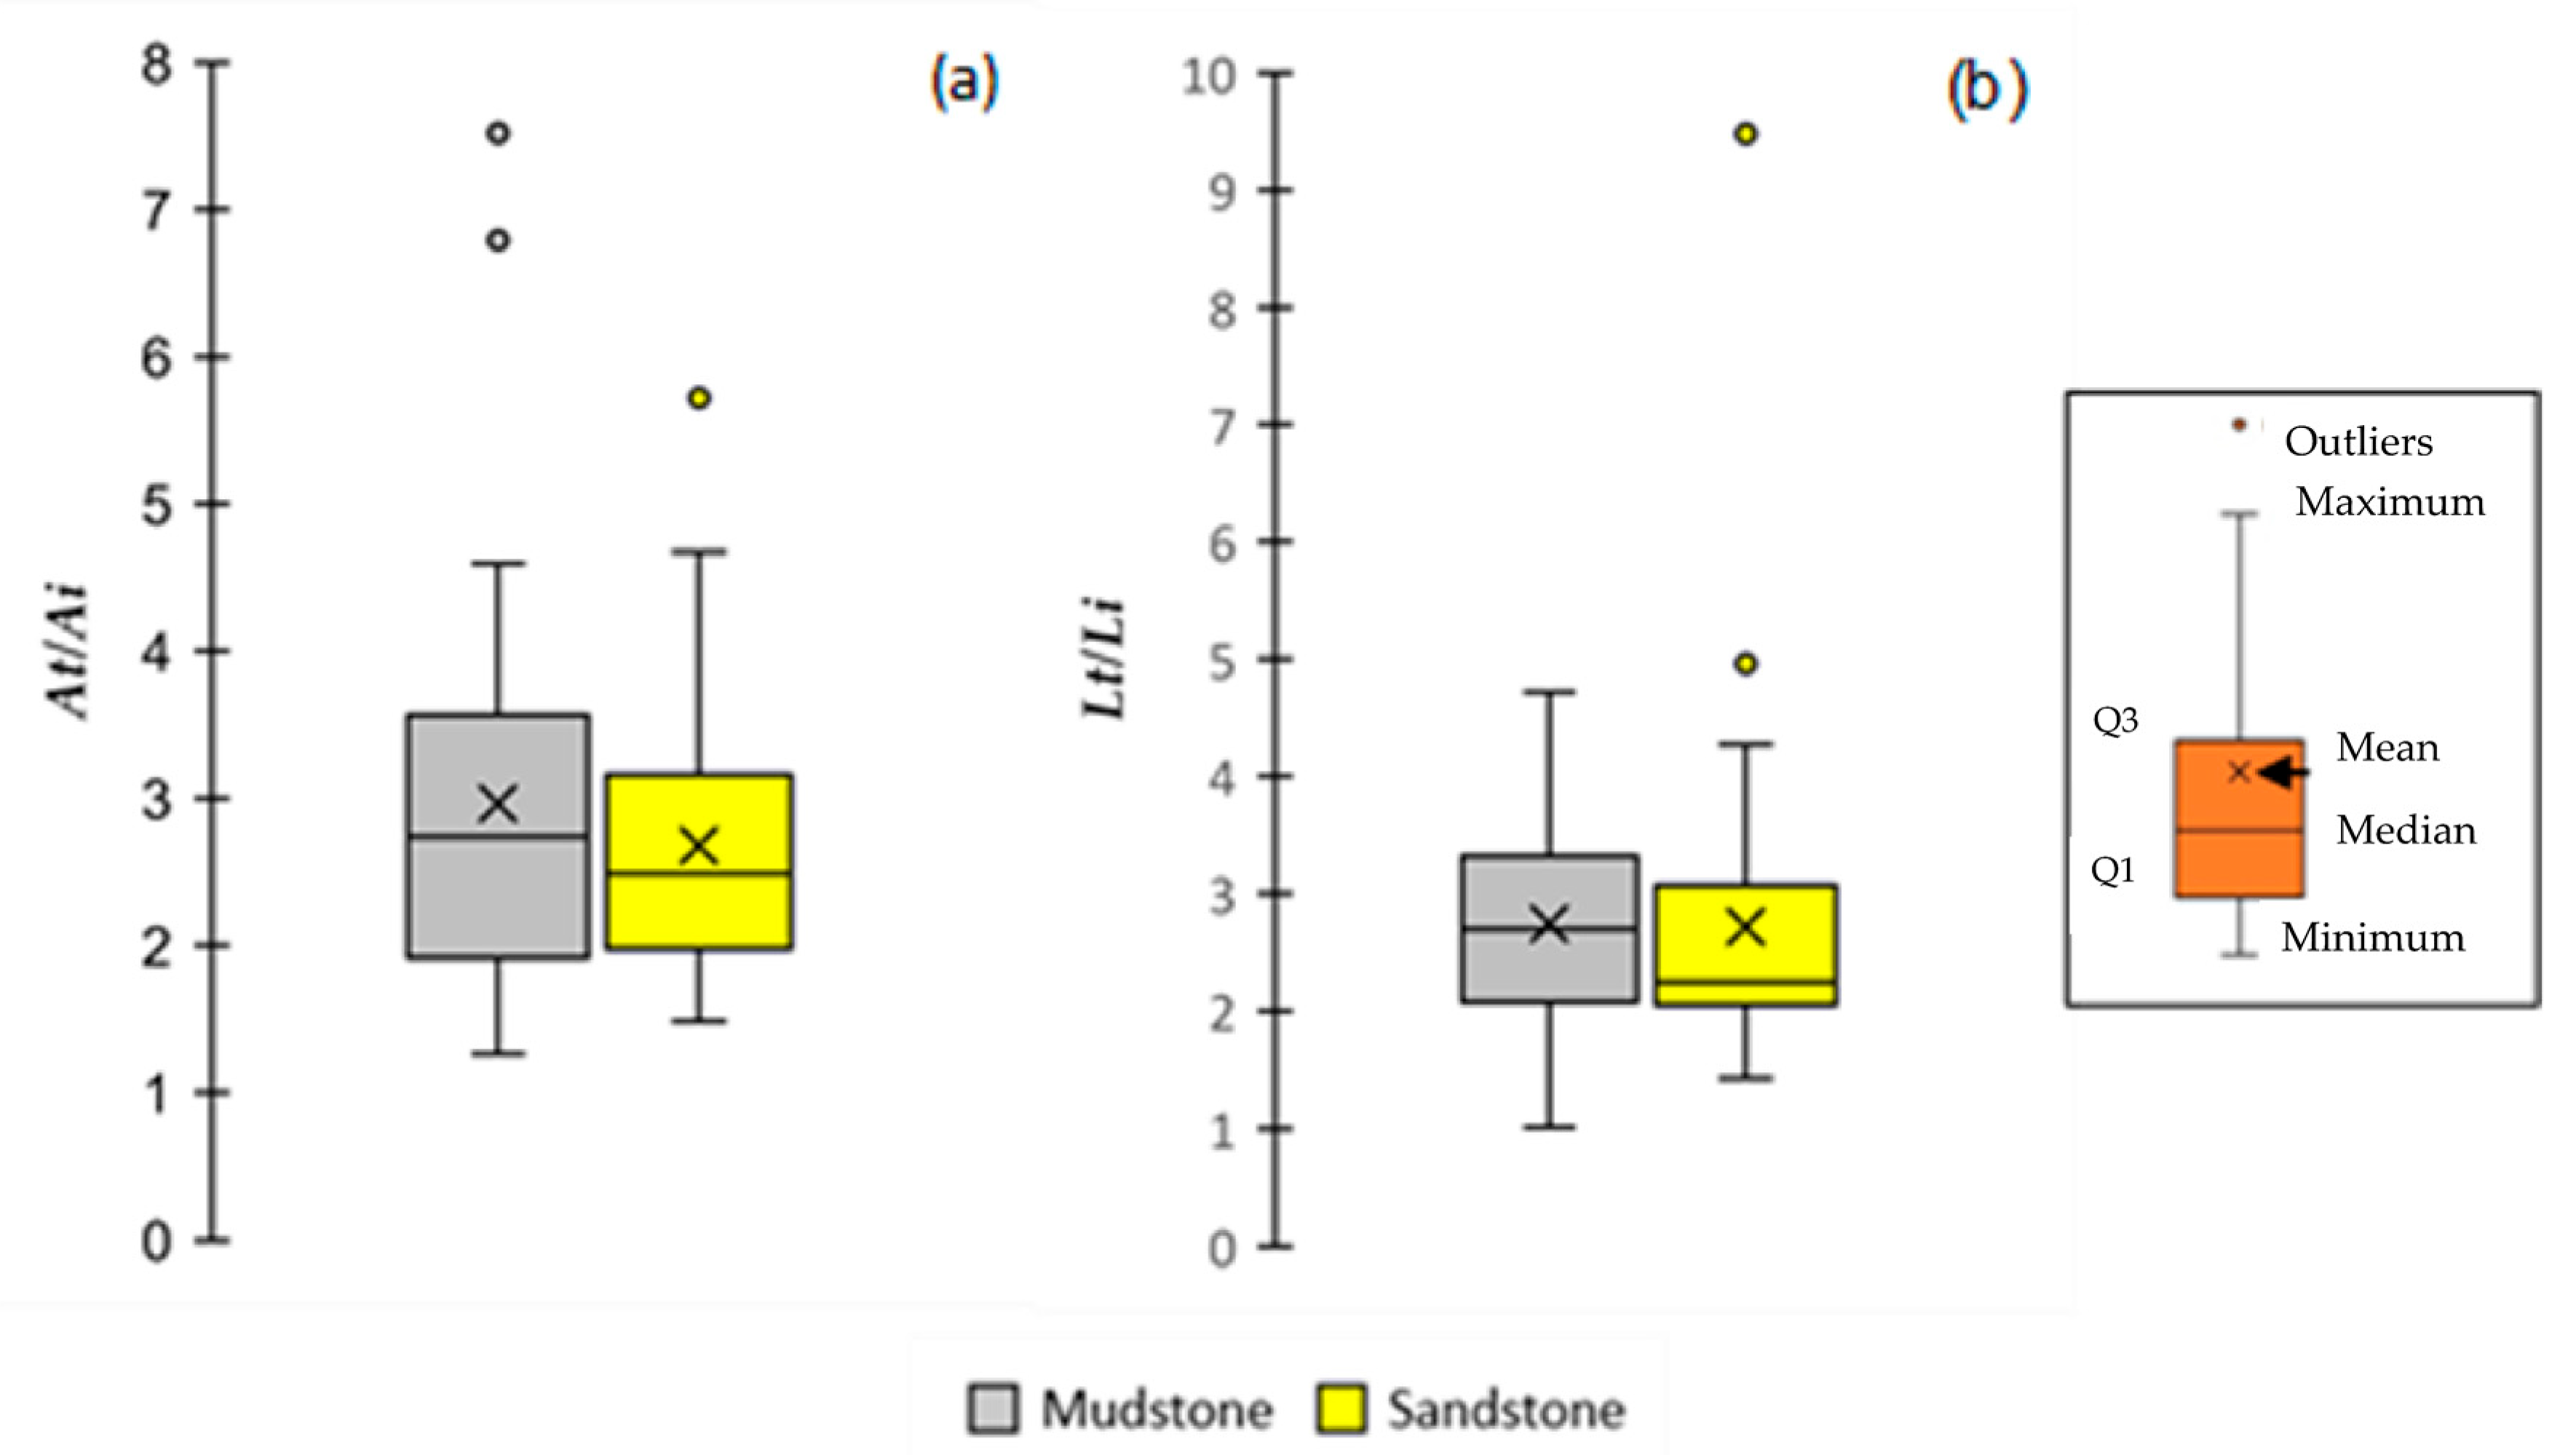
4.1.2. Landslide Geometry
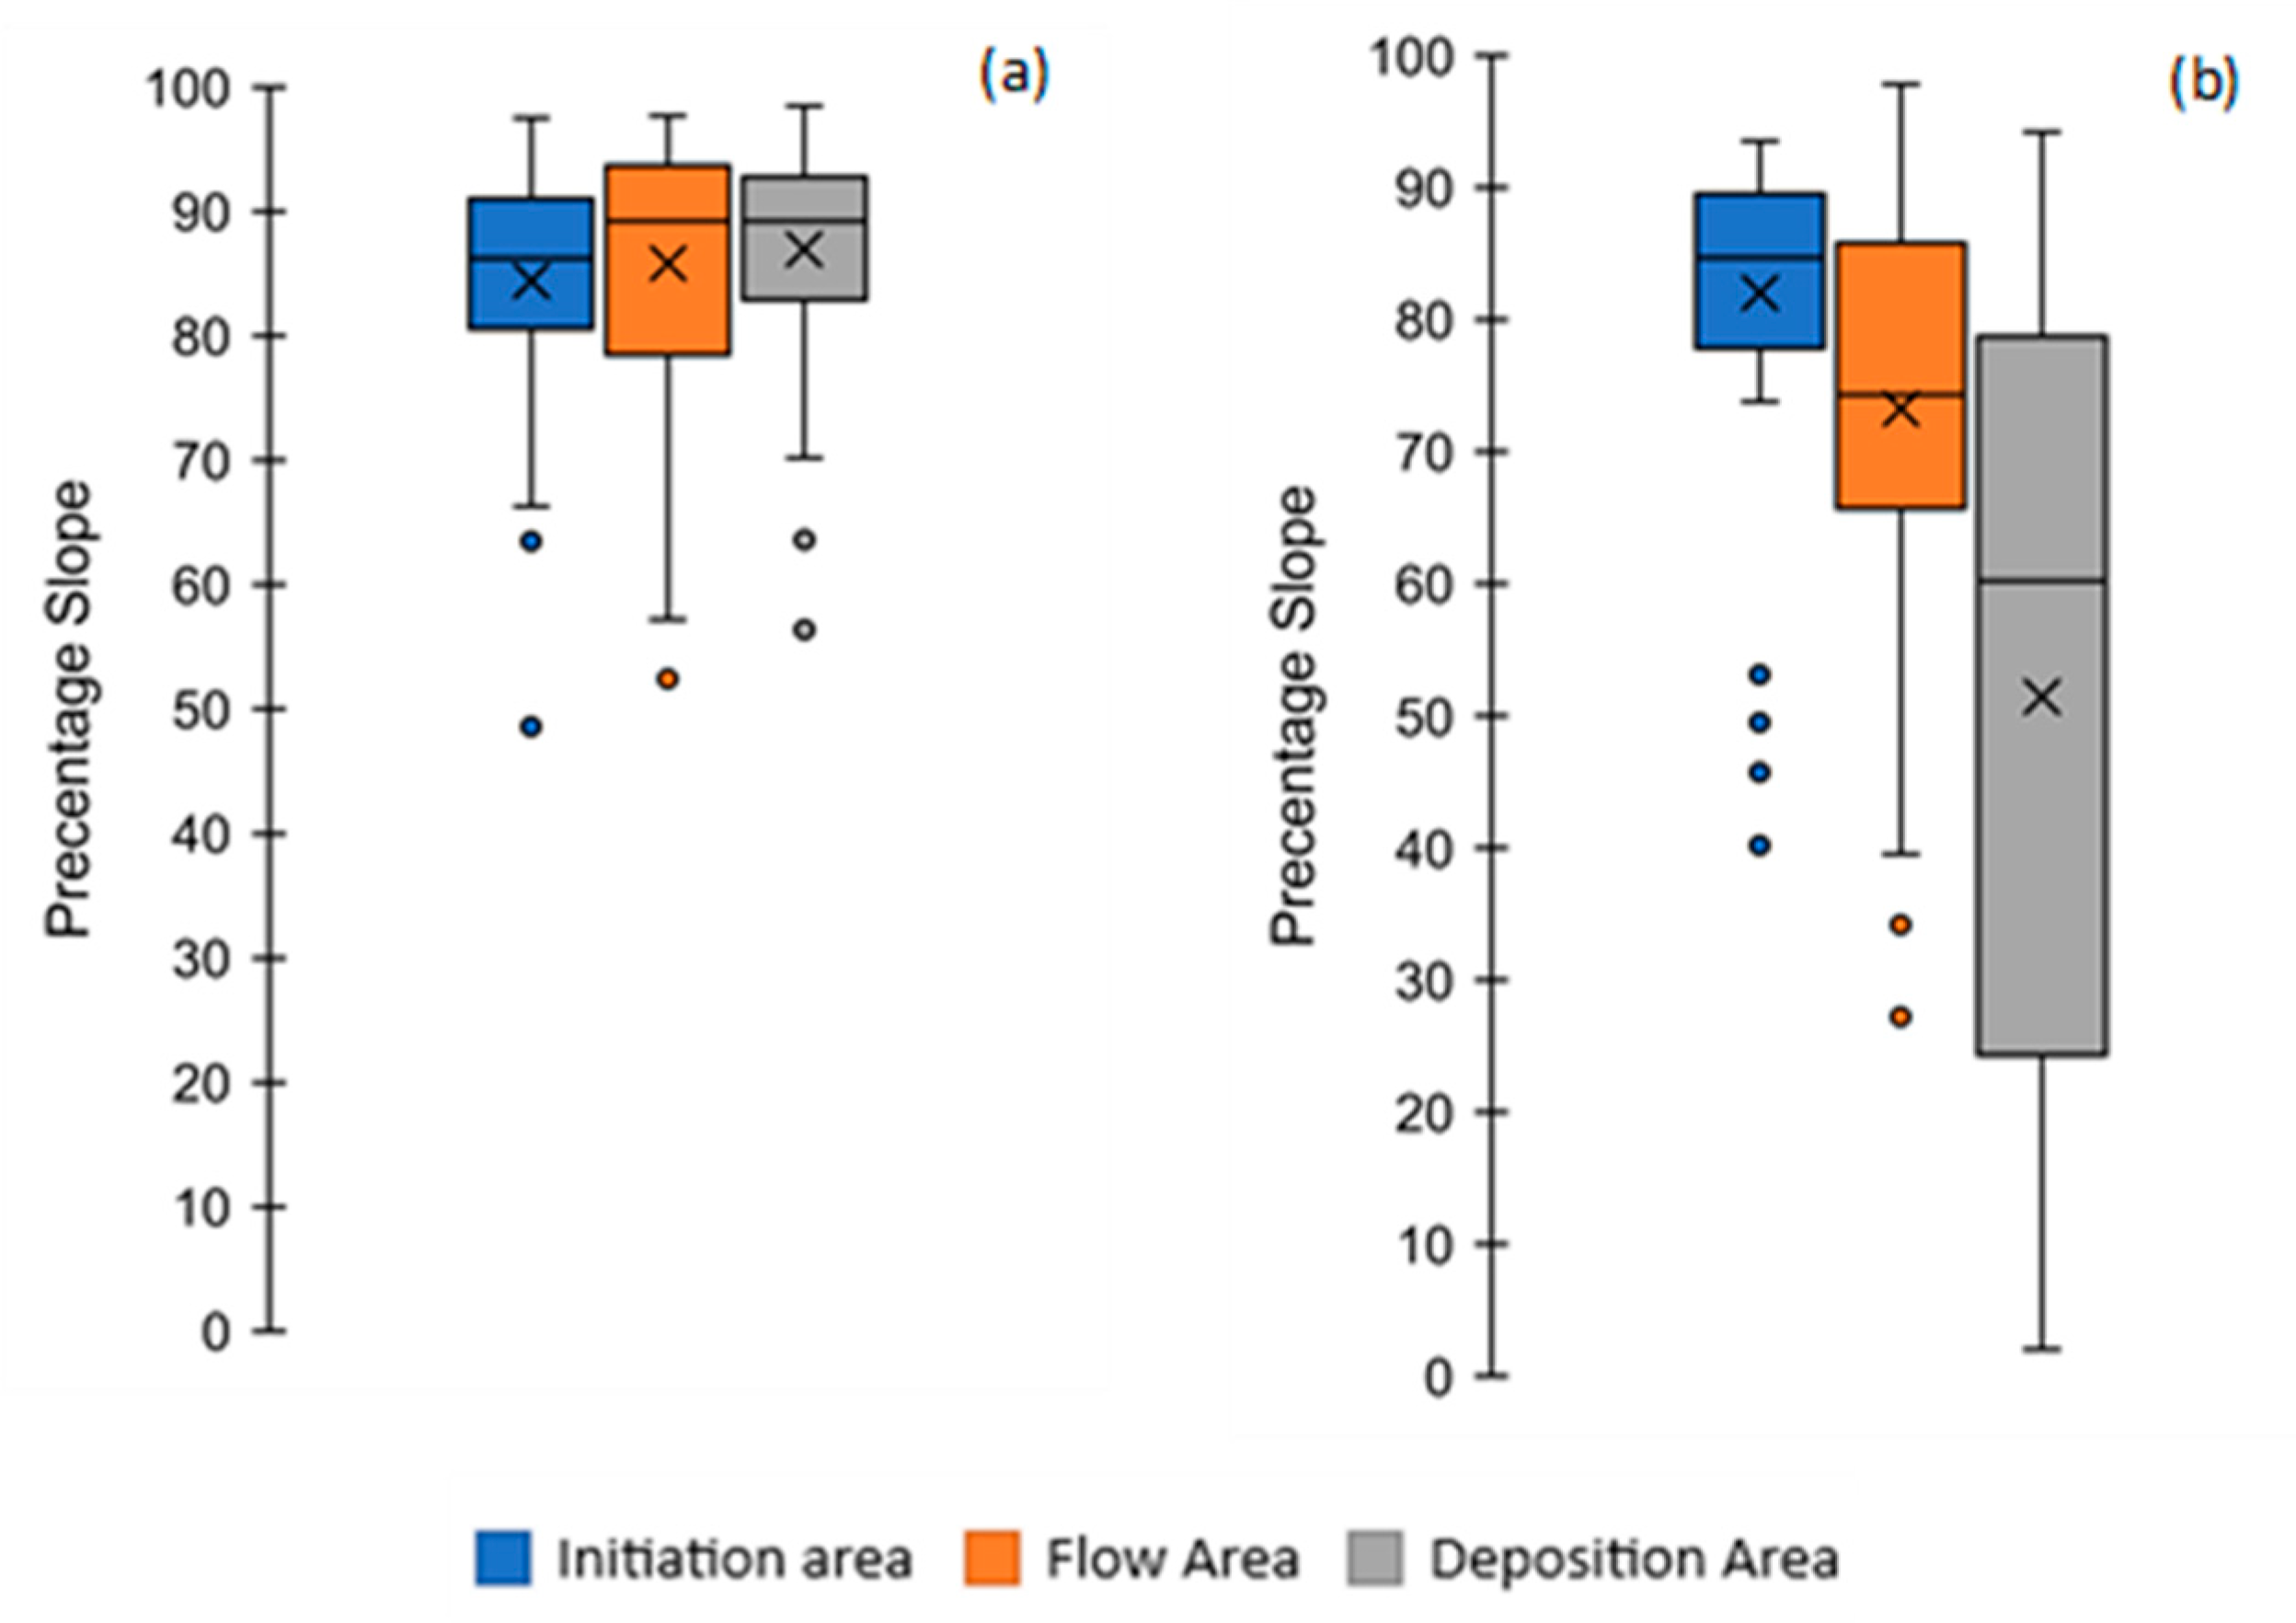
4.1.3. Landslide Mobility
4.2. Comparative Analysis of Landslide Characteristics Based on Rock Types in Ikawa
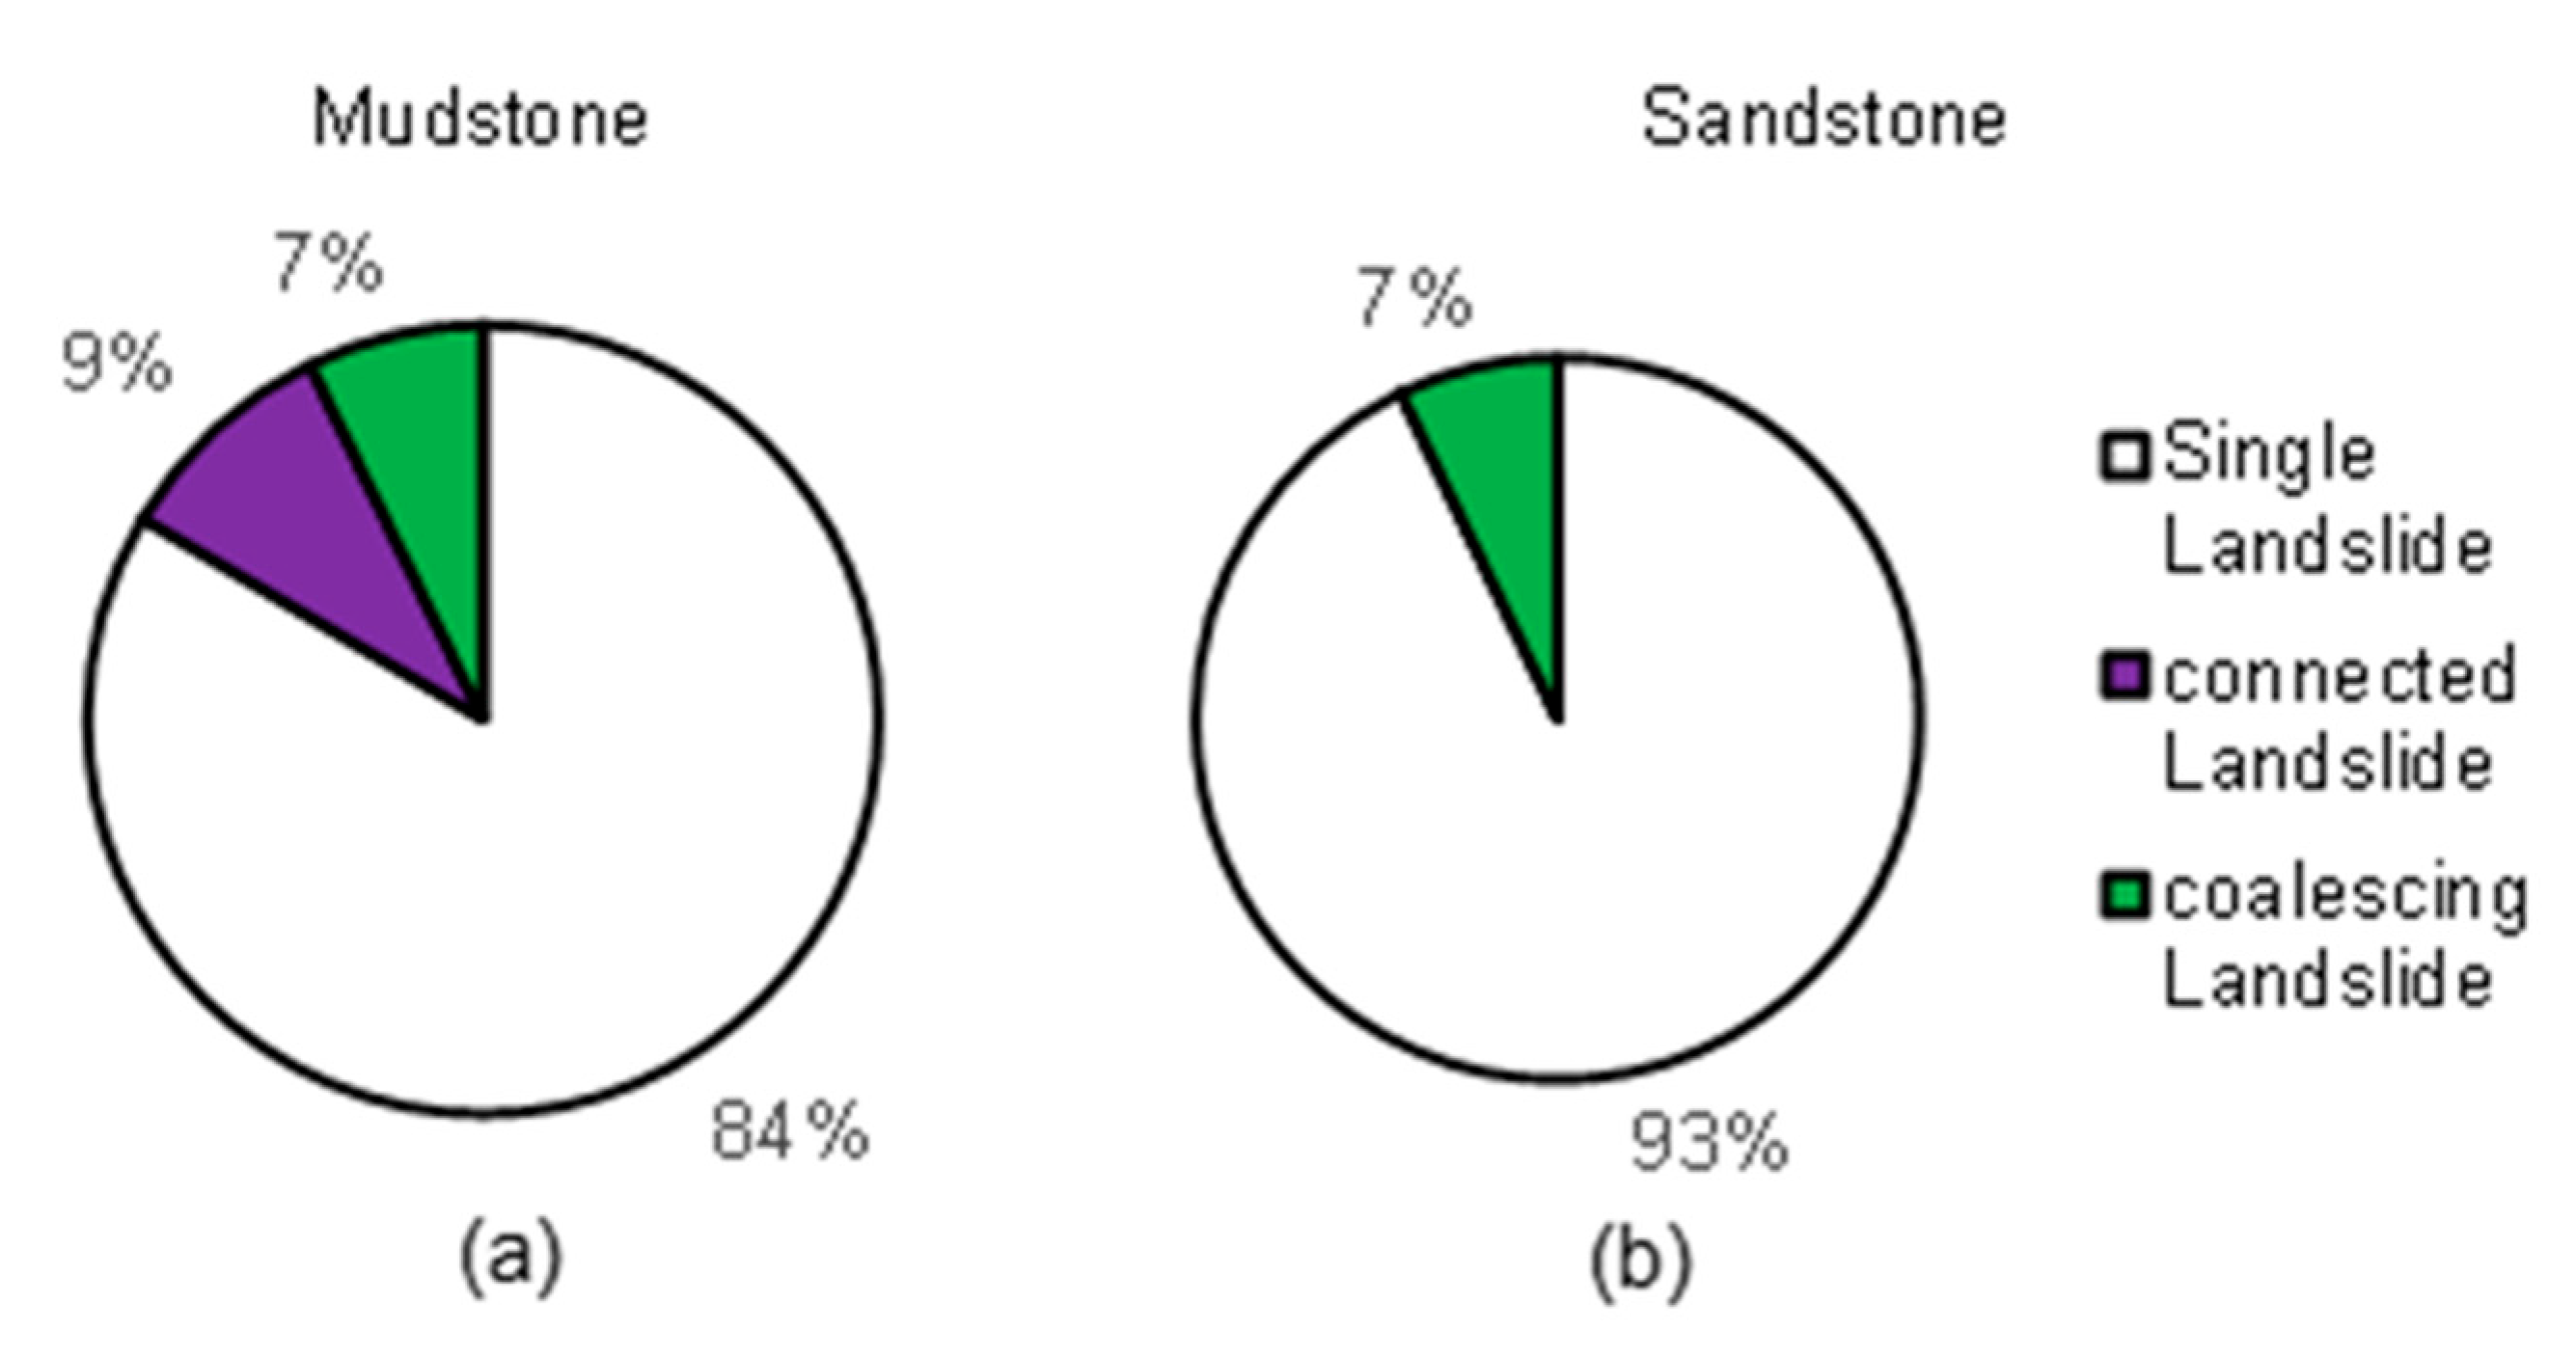
4.2.1. Landslide Type
4.2.2. Landslide Density
4.2.3. Landslide Geometry
4.2.4. Landslide Mobility
5. Discussion
5.1. Roles of Resolution of Images
5.2. Similarity and Difference in Landslide Activity Revealed Using Satellite Image Interpretation
5.3. Characteristics of Landslide in the Area with Very Old Geological Formation
5.4. Strengths, Limitations, and Future Prospects
6. Conclusions
Author Contributions
Funding
Data Availability Statement
Acknowledgments
Conflicts of Interest
References
- Hervás, J. Lessons Learnt from Landslide Disasters in Europe; European Communities: Luxembourg, 2003; p. 91. [Google Scholar]
- Dai, F.C.; Chin, F.L.; Ngai, Y.Y. Landslide risk assessment and management: An overview. Eng. Geol. 2002, 64, 65–87. [Google Scholar] [CrossRef]
- Matthias, J.; Steven, L. Climate change effects on landslides along the southwest coast of British Columbia. Geomorphology 2009, 107, 275–284. [Google Scholar] [CrossRef]
- Cruden, D.M.; Varnes, D.J. Landslide Types and Processes, Transportation Research Board, U.S. National Academy of Sciences. Spec. Rep. 1996, 247, 36–75. [Google Scholar]
- Bessette-Kirton, E.K.; Coe, J.A.; Schulz, W.H.; Cerovski-Darriau, C.; Einbund, M.M. Mobility characteristics of debris slides and flows triggered by Hurricane Maria in Puerto Rico. Landslides 2020, 17, 2795–2809. [Google Scholar] [CrossRef]
- Onda, Y. Underlying Rock Type Controls of Hydrological Processes and Shallow Landslide Occurrence; IAHS Publication: Wallingford, UK, 1993; p. 47. [Google Scholar]
- Chen, X.; Wang, M.; Chuan, Y.; Wei, Y.; Zhang, P.; Chen, M.T. Topographic controls on the distribution of coseismic landslides: A case study using the coefficient of variation of the 2014 Ludian, Yunnan, China, Ms6.5 Earthquake. Lithosphere 2022, 2021, 6678652. [Google Scholar] [CrossRef]
- Borgomeo, E.; Hebditch, K.V.; Whittaker, A.C.; Lonergan, L. Characterising the spatial distribution, frequency and geomorphic controls on landslide occurrence, Molise, Italy. Geomorphology 2014, 226, 148–161. [Google Scholar] [CrossRef]
- Avanzi, G.D.A.; Giannecchini, R.; Puccinelli, A. The influence of the geological and geomorphological settings on shallow landslides. An example in a temperate climate environment: The June 19, 1996 event in northwestern Tuscany (Italy). Eng. Geol. 2004, 73, 215–228. [Google Scholar] [CrossRef]
- Alkhasawneh, M.; Ngah, U.K.; Tay, L.T.; Mat Isa, N.A.; Al-batah, M.S. Determination of important topographic factors for landslide mapping analysis using MLP network. Sci. World J. 2013, 2013, 415023. [Google Scholar] [CrossRef] [PubMed] [PubMed Central]
- Nakileza, B.R.; Nedala, S. Topographic influence on landslides characteristics and implication for risk management in upper Manafwa catchment, Mt Elgon Uganda. Geoenviron. Disasters 2020, 7, 27. [Google Scholar] [CrossRef]
- Gao, J.; Maro, J. Topographic controls on evolution of shallow landslides in pastoral Wairarapa, New Zealand, 1979–2003. Geomorphology 2010, 114, 373–381. [Google Scholar] [CrossRef]
- Zhang, F.; Chen, W.; Liu, G.; Liang, S.; Kang, C.; He, F. Relationships between landslide types and topographic attributes in a loess catchment, China. J. Mt. Sci. 2012, 9, 742–751. [Google Scholar] [CrossRef]
- Rana, K.; Ugur, O.; Nishant, M. Landslide geometry reveals its trigger. Geophys. Res. Lett. 2021, 48, e2020GL090848. [Google Scholar] [CrossRef]
- Frattini, P.; Crosta, G.B. The role of material properties and landscape morphology on landslide size distributions. Earth Planet. Sci. Lett. 2013, 361, 310–319. [Google Scholar] [CrossRef]
- Schneider, D.; Huggel, C.; Haeberli, W.; Kaitna, R. Unraveling driving factors for large rock–ice avalanche mobility. Earth Surf. Process. Landf. 2011, 36, 1948–1966. [Google Scholar] [CrossRef]
- Kasai, M.; Yamada, T. Topographic effects on frequency-size distribution of landslides triggered by the Hokkaido Eastern Iburi Earthquake in 2018. Earth Planets Space 2019, 71, 89. [Google Scholar] [CrossRef]
- Taylor, F.E.; Malamud, B.D.; Witt, A.; Guzzetti, F. Landslide shape, ellipticity and length-to-width ratios. Earth Surf. Process. Landf. 2018, 43, 3164–3189. [Google Scholar] [CrossRef]
- Xu, C.; Xiwei, X.; Bruce, J.; Shyu, H. Database and spatial distribution of landslides triggered by the Lushan, China Mw 6.6 earthquake of 20 April 2013. Geomorphology 2015, 248, 77–92. [Google Scholar] [CrossRef]
- Bernat Gazibara, S.; Krkač, M.; Mihalić Arbanas, S. Landslide inventory mapping using LiDAR data in the City of Zagreb (Croatia). J. Maps 2019, 15, 773–779. [Google Scholar] [CrossRef]
- Wu, C. Using the spatiotemporal hot spot analysis and multi-annual landslide inventories to analyze the evolution and characteristic of rainfall-induced landslide at the subwatershed scale in Taiwan. Water 2023, 15, 1355. [Google Scholar] [CrossRef]
- Korup, O. Distribution of landslides in southwest New Zealand. Landslides 2005, 2, 43–51. [Google Scholar] [CrossRef]
- Nichol, J.; Wong, M.S. Satellite remote sensing for detailed landslide inventories using change detection and image fusion. Int. J. Remote Sens. 2005, 26, 1913–1926. [Google Scholar] [CrossRef]
- Đurić, D.; Mladenović, A.; Pešić-Georgiadis, M.; Marjanović, M.; Abolmasov, B. Using multiresolution and multitemporal satellite data for post-disaster landslide inventory in the Republic of Serbia. Landslides 2017, 14, 1467–1482. [Google Scholar] [CrossRef]
- Lissak, C.; Bartsch, A.; De Michele, M.; Gomez, C.; Maquaire, O.; Raucoules, D.; Roulland, T. Remote sensing for assessing landslides and associated hazards. Surv. Geophys. 2020, 41, 1391–1435. [Google Scholar] [CrossRef]
- Casagli, N.; Intrieri, E.; Tofani, V.; Gigli, G.; Raspini, F. Landslide detection, monitoring and prediction with remote-sensing techniques. Nat. Rev. Earth Environ. 2023, 4, 51–64. [Google Scholar] [CrossRef]
- Mohan, A.; Singh, A.K.; Kumar, B.; Dwivedi, R. Review on remote sensing methods for landslide detection using machine and deep learning. Trans. Emerg. Telecommun. Technol. 2021, 32, 3998. [Google Scholar] [CrossRef]
- Sato, H.P.; Harp, E.L. Interpretation of earthquake-induced landslides triggered by the 12 May 2008, M7. 9 Wenchuan earthquake in the Beichuan area, Sichuan Province, China using satellite imagery and Google Earth. Landslides 2009, 6, 153–159. [Google Scholar] [CrossRef]
- Sato, H.P.; Hasegawa, H.; Fujiwara, S.; Tobita, M.; Koarai, M.; Une, H.; Iwahashi, J. Interpretation of landslide distribution triggered by the 2005 Northern Pakistan earthquake using SPOT 5 imagery. Landslides 2007, 4, 113–122. [Google Scholar] [CrossRef]
- Mohammed, N.Z.; Ghazi, A.; Mustafa, H.E. Positional accuracy testing of Google Earth. Int. J. Multidiscip. Sci. Eng. 2013, 4, 6–9. [Google Scholar]
- Farah, A.; Algarni, D. Positional accuracy assessment of GoogleEarth in Riyadh. Artif. Satell. 2014, 49, 101–106. [Google Scholar] [CrossRef]
- Goudarzi, M.A.; Landry, R.J. Assessing horizontal positional accuracy of Google Earth imagery in the city of Montreal, Canada. Geod. Cartogr. 2017, 43, 56–65. [Google Scholar] [CrossRef]
- Wirth, J.; Bonugli, E.; Freund, M. Assessment of the Accuracy of Google Earth Imagery for Use as a Tool in Accident Reconstruction; SAE Technical Paper, (No. 2015-01-1435); Biodynamic Research Corp.: San Antonio, TX, USA, 2015. [Google Scholar]
- Handwerger, A.L.; Huang, M.H.; Jones, S.Y.; Amatya, P.; Kerner, H.R.; Kirschbaum, D.B. Generating landslide density heatmaps for rapid detection using open-access satellite radar data in Google Earth Engine. Nat. Hazards Earth Syst. Sci. 2022, 22, 753–773. [Google Scholar] [CrossRef]
- Cooray, P.G. The Precambrian of Sri Lanka: A historical review. Precambrian Res. 1994, 66, 3–18. [Google Scholar] [CrossRef]
- Kehelpannala, K.V.W. Deformation of a High-Grade Gondwana Fragment, Sri Lanka. Int. Assoc. Gondwana Res. Jpn. 1997, 1, 47–68. [Google Scholar] [CrossRef]
- Konagai, K.; Karunawardena, A.; Bandara, K.N.; Sassa, K.; Onishi, R.; Uzuoka, R.; Asano, S.; Sasahara, K.; Jayakody, S.; Ariyarathna, I. Early warning system against rainfall-induced landslide in Sri Lanka. In Progress in Landslide Research and Technology; Springer International Publishing: Cham, Switzerland, 2023; Volume 1, pp. 217–235. [Google Scholar] [CrossRef]
- Hemasinghe, H.; Rangali, R.S.; Deshapriya, N.L.; Samarakoon, L. Landslide susceptibility mapping using logistic regression model (a case study in Badulla District, Sri Lanka). Procedia Eng. 2018, 212, 1046–1053. [Google Scholar] [CrossRef]
- Perera, E.N.C.; Gunaratne, A.M.C.T.; Samarasinghe, S.B.D. Participatory Landslide Inventory (PLI): An Online Tool for the Development of a Landslide Inventory. Complexity 2022, 2022, 2659203. [Google Scholar] [CrossRef]
- Marambe, B.; Punyawardena, R.; Silva, P.; Premalal, S.; Rathnabharathie, V.; Kekulandala, B.; Nidumolu, U.; Howden, M. Climate, climate risk, and food security in Sri Lanka: The need for strengthening adaptation strategies. In Handbook of Climate Change Adaptation; Springer: Berlin/Heidelberg, Germany, 2015; pp. 1759–1789. [Google Scholar] [CrossRef]
- Ratnayake, U.; Herath, S. Changing rainfall and its impact on landslides in Sri Lanka. J. Mt. Sci. 2005, 2, 218–224. [Google Scholar] [CrossRef]
- Nisansala, W.D.S.; Abeysingha, N.S.; Islam, A.; Bandara, A.M.K.R. Recent rainfall trend over Sri Lanka (1987–2017). Int. J. Climatol. 2020, 40, 3417–3435. [Google Scholar] [CrossRef]
- Murillo-García, F.G.; Alcántara-Ayala, I.; Ardizzone, F.; Cardinali, M.; Fiourucci, F.; Guzzetti, F. Satellite stereoscopic pair images of very high resolution: A step forward for the development of landslide inventories. Landslides 2015, 12, 277–291. [Google Scholar] [CrossRef]
- Zhang, J.; Gurung, D.R.; Liu, R.; Murthy, M.S.R.; Su, F. Abe Barek landslide and landslide susceptibility assessment in Badakhshan Province, Afghanistan. Landslides 2015, 12, 597–609. [Google Scholar] [CrossRef]
- Psomiadis, E.; Papazachariou, A.; Soulis, K.X.; Alexiou, D.S.; Charalampopoulos, I. Landslide mapping and susceptibility assessment using geospatial analysis and earth observation data. Land 2020, 9, 133. [Google Scholar] [CrossRef]
- Henriques, C.; Zêzere, J.L.; Marques, F. The role of the lithological setting on the landslide pattern and distribution. Eng. Geol. 2015, 189, 17–31. [Google Scholar] [CrossRef]
- Katupotha, J. Geomorphic Surfaces of the River Basins in the Western and Southern Parts of Sri Lanka; Natural Resources, Energy and Science Authority of Sri Lanka: Colombo, Sri Lanka, 2015. [Google Scholar] [CrossRef]
- Osanai, Y.; Sajeev, K.; Owada, M.; Kehelpannala, K.W.; Prame, W.B.; Nakano, N.; Jayatileke, S. Metamorphic evolution of high-pressure and ultrahigh-temperature granulites from the Highland Complex, Sri Lanka. J. Asian Earth Sci. 2006, 28, 20–37. [Google Scholar] [CrossRef]
- Saito, H.; Nakayama, D.; Matsuyama, H. Comparison of landslide susceptibility based on a decision-tree model and actual landslide occurrence: The Akaishi Mountains, Japan. Geomorphology 2009, 109, 108–121. [Google Scholar] [CrossRef]
- Tatard, L.; Grasso, J.R.; Helmstetter, A.; Garambois, S. Characterization and comparison of landslide triggering in different tectonic and climatic settings. J. Geophys. Res. Earth Surf. 2010, 115, F04040. [Google Scholar] [CrossRef]
- Legros, F. The mobility of long-runout landslides. Eng. Geol. 2002, 63, 301–331. [Google Scholar] [CrossRef]
- Iverson, R.M.; George, D.L.; Allstadt, K.; Reid, M.E.; Collins, B.D.; Vallance, J.W.; Schilling, S.P.; Godt, J.W.; Cannon, C.M.; Magirl, C.S.; et al. Landslide mobility and hazards: Implications of the 2014 Oso disaster. Earth Planet. Sci. Lett. 2015, 412, 197–208. [Google Scholar] [CrossRef]
- Düzgün, H.S.B.; Özdemir, A. Landslide risk assessment and management by decision analytical procedure for Dereköy, Konya, Turkey. Nat. Hazards 2006, 39, 245–263. [Google Scholar] [CrossRef]
- Amarasinghe, M.P.; Kulathilaka, S.A.S.; Robert, D.J.; Zhou, A.; Jayathissa, H.A.G. Risk assessment and management of rainfall-induced landslides in tropical regions: A review. Nat. Hazards 2023, 120, 2179–2231. [Google Scholar] [CrossRef]
- Jiang, Y.; Hu, X.; Liang, H.; Ning, P.; Fan, X. A Physically Based Model for the Sequential Evolution Analysis of Rainfall-Induced Shallow Landslides in a Catchment. Water Resour. Res. 2023, 59, e2022WR032716. [Google Scholar] [CrossRef]
- Bera, A.; Mukhopadhyay, B.P.; Das, D. Landslide hazard zonation mapping using multi-criteria analysis with the help of GIS techniques: A case study from Eastern Himalayas, Namchi, South Sikkim. Nat. Hazards 2019, 96, 935–959. [Google Scholar] [CrossRef]
- Uchida, T.; Sakurai, W.; Okamoto, A. Historical Patterns of Heavy Rainfall Event and Deep-Seated Rapid Landslide Occurrence in Japan: Insight for Effects of Cli-mate Change on Landslide Occurrence. In Advancing Culture of Living with Landslides: Diversity of Landslide Forms; Springer International Publishing: Berlin/Heidelberg, Germany, 2017; Volume 4, pp. 251–257. [Google Scholar] [CrossRef]
- Gariano, S.L.; Guzzetti, F. Landslides in a changing climate. Earth-Sci. Rev. 2016, 162, 227–252. [Google Scholar] [CrossRef]


| Study Area | Landslide Type | Number of Landslide Polygons | Number of Mapped Initiation Area Polygons | Number of Headscarp Points | Remark |
|---|---|---|---|---|---|
| Ikawa, Japan, | Single | 146 | 91 | 146 | 91 landslides were selected for analysis |
| Connected | 9 | 0 | 21 | ||
| Coalescing | 12 | 0 | 51 | ||
| Total | 167 | 91 | 218 | ||
| Sabragamuwa, Sri Lanka, | Single | 59 | 59 | 59 | 59 landslides were selected for analysis |
| Connected | 3 | 0 | 6 | ||
| Coalescing | 0 | 0 | 0 | ||
| Total | 62 | 59 | 65 |
Disclaimer/Publisher’s Note: The statements, opinions and data contained in all publications are solely those of the individual author(s) and contributor(s) and not of MDPI and/or the editor(s). MDPI and/or the editor(s) disclaim responsibility for any injury to people or property resulting from any ideas, methods, instructions or products referred to in the content. |
© 2024 by the authors. Licensee MDPI, Basel, Switzerland. This article is an open access article distributed under the terms and conditions of the Creative Commons Attribution (CC BY) license (https://creativecommons.org/licenses/by/4.0/).
Share and Cite
Neranjan, S.; Uchida, T.; Yamakawa, Y.; Hiraoka, M.; Kawakami, A. Geometrical Variation Analysis of Landslides in Different Geological Settings Using Satellite Images: Case Studies in Japan and Sri Lanka. Remote Sens. 2024, 16, 1757. https://doi.org/10.3390/rs16101757
Neranjan S, Uchida T, Yamakawa Y, Hiraoka M, Kawakami A. Geometrical Variation Analysis of Landslides in Different Geological Settings Using Satellite Images: Case Studies in Japan and Sri Lanka. Remote Sensing. 2024; 16(10):1757. https://doi.org/10.3390/rs16101757
Chicago/Turabian StyleNeranjan, Suneth, Taro Uchida, Yosuke Yamakawa, Marino Hiraoka, and Ai Kawakami. 2024. "Geometrical Variation Analysis of Landslides in Different Geological Settings Using Satellite Images: Case Studies in Japan and Sri Lanka" Remote Sensing 16, no. 10: 1757. https://doi.org/10.3390/rs16101757