
Unveiling Peru’s Agricultural Diversity: Navigating Historical and Future Trends in a Post-COVID-19 Context

 ,
,  , ,
, ,  ,
,  , and
, and
Abstract
1. Introduction
2. Materials and Methods
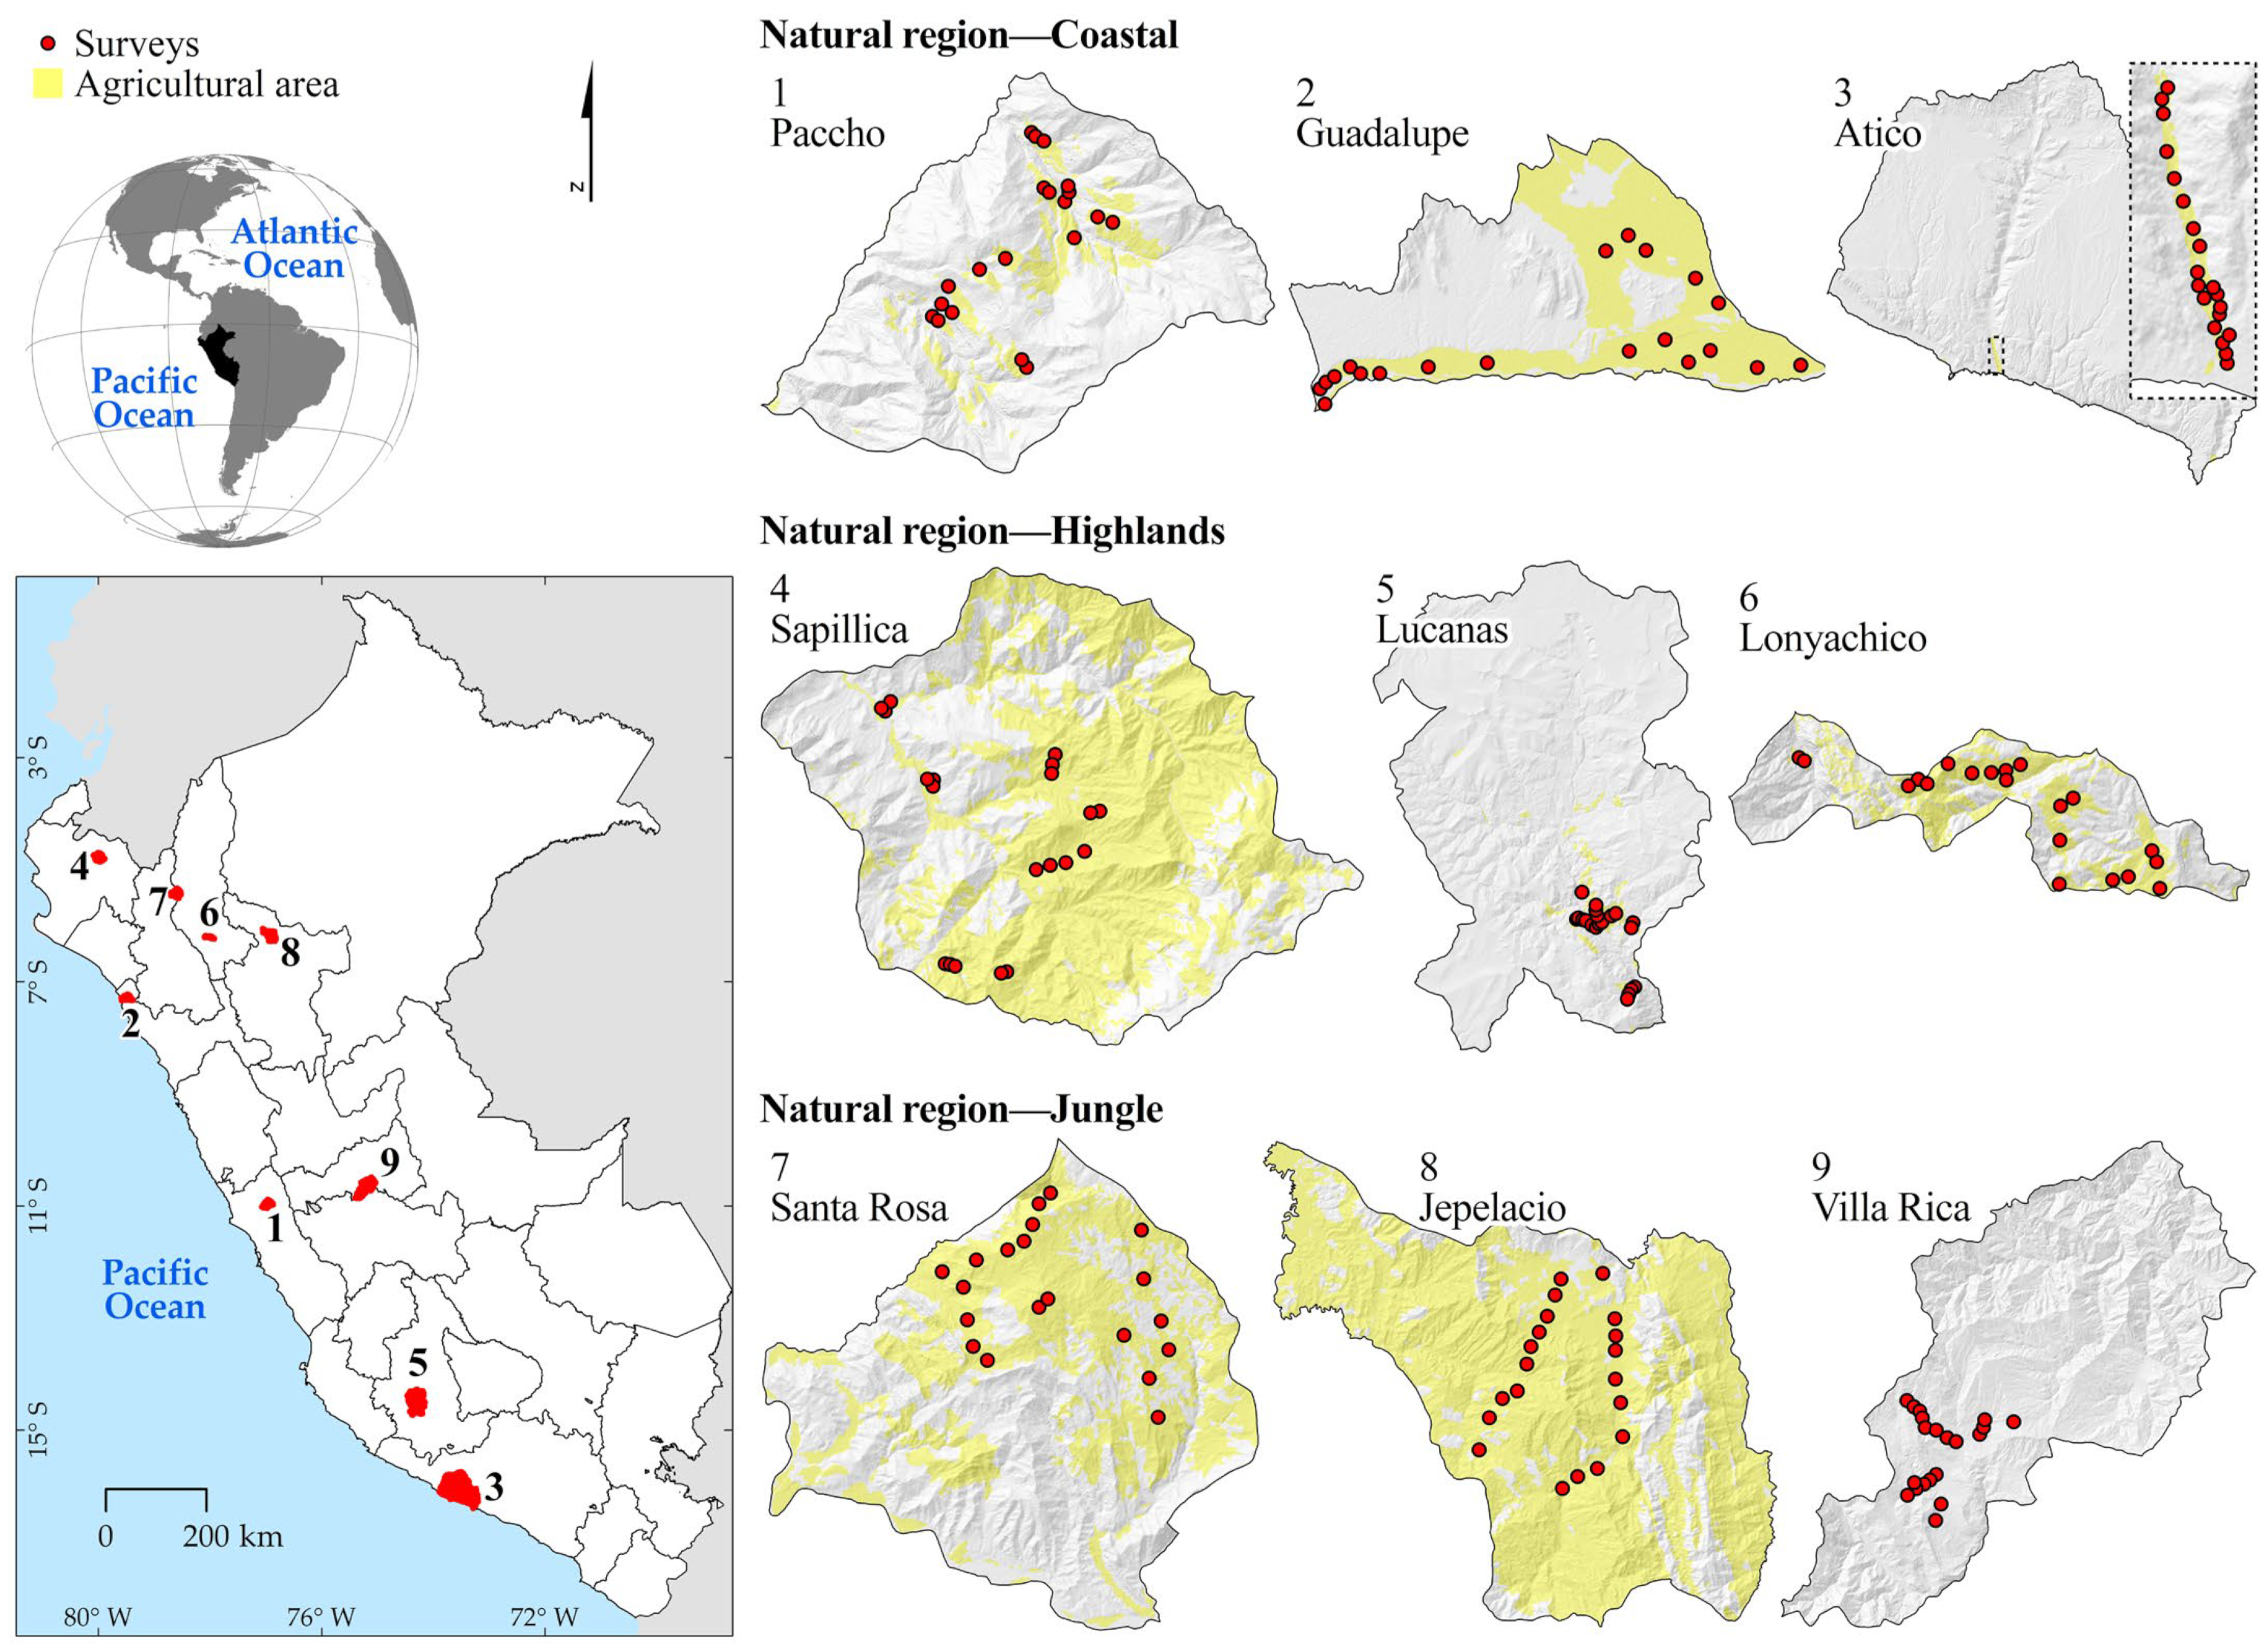
2.1. Location of the Study
2.2. Historical Variability of Agricultural Crops
2.3. Index of Agricultural Diversity and Trends for 9 Districts of the Three Natural Regions of Peru
- H/ = Shannon–Weiner index
- pi = Proportion of individuals belonging to species i
- ln = natural logarithm
- SR = Margalef Species Richness Index
- S = Number of species
- N = Total number of individuals
2.4. Current Models for Future Trends in Agricultural Species, According to Crop Type and Crop Families
3. Results
3.1. Indices of Agricultural Diversity and Trends for 9 Districts of the Three Natural Regions of Peru
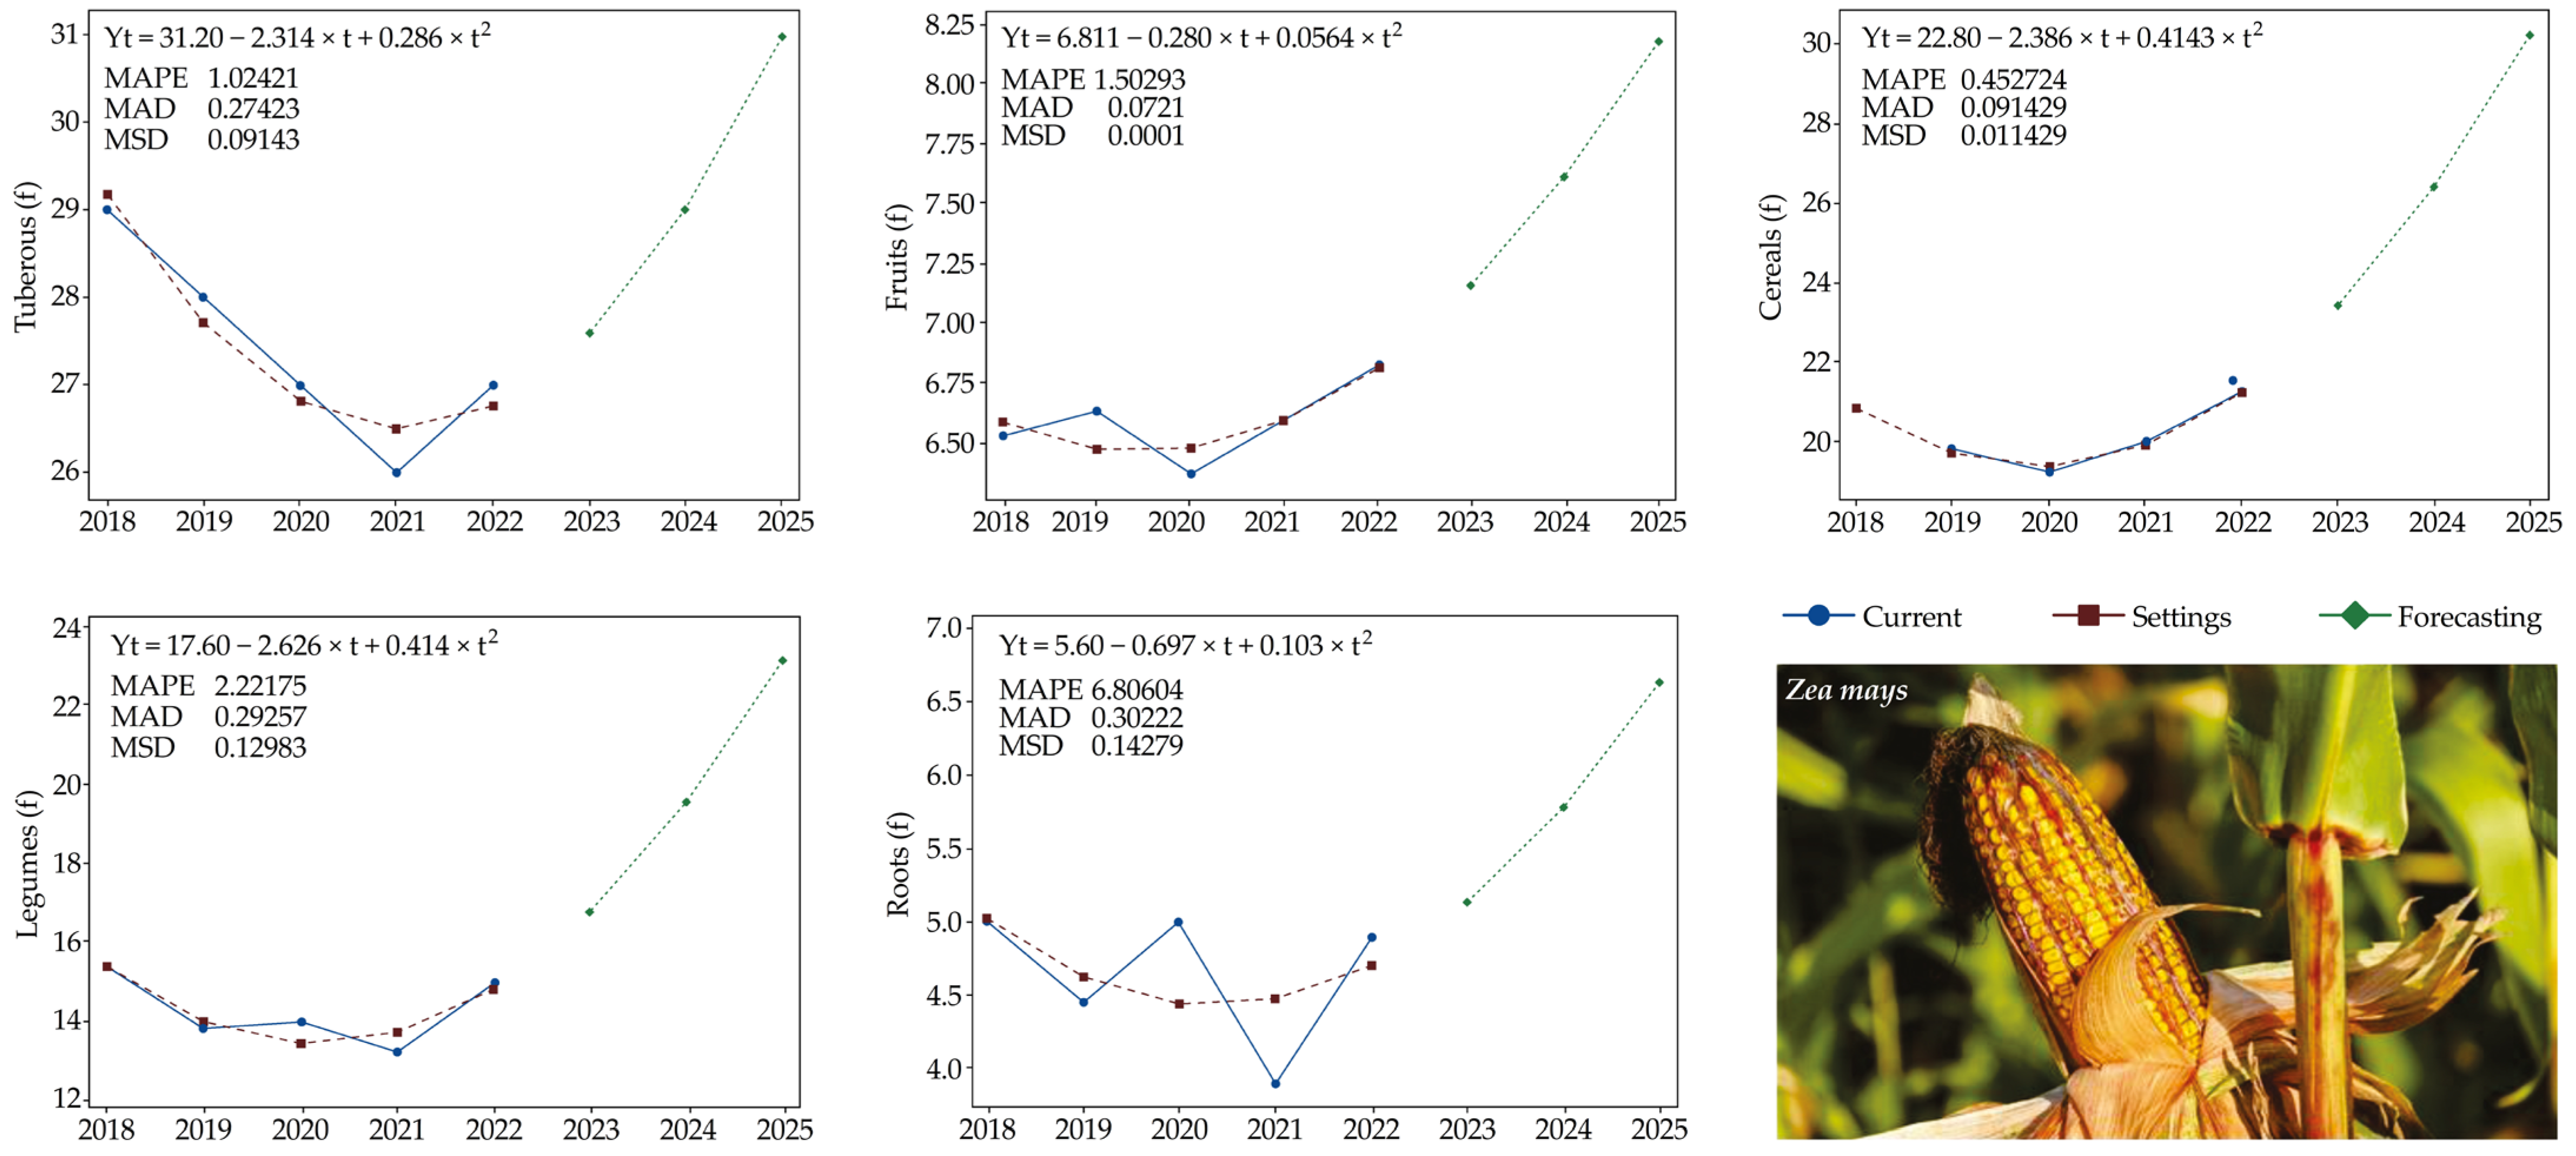
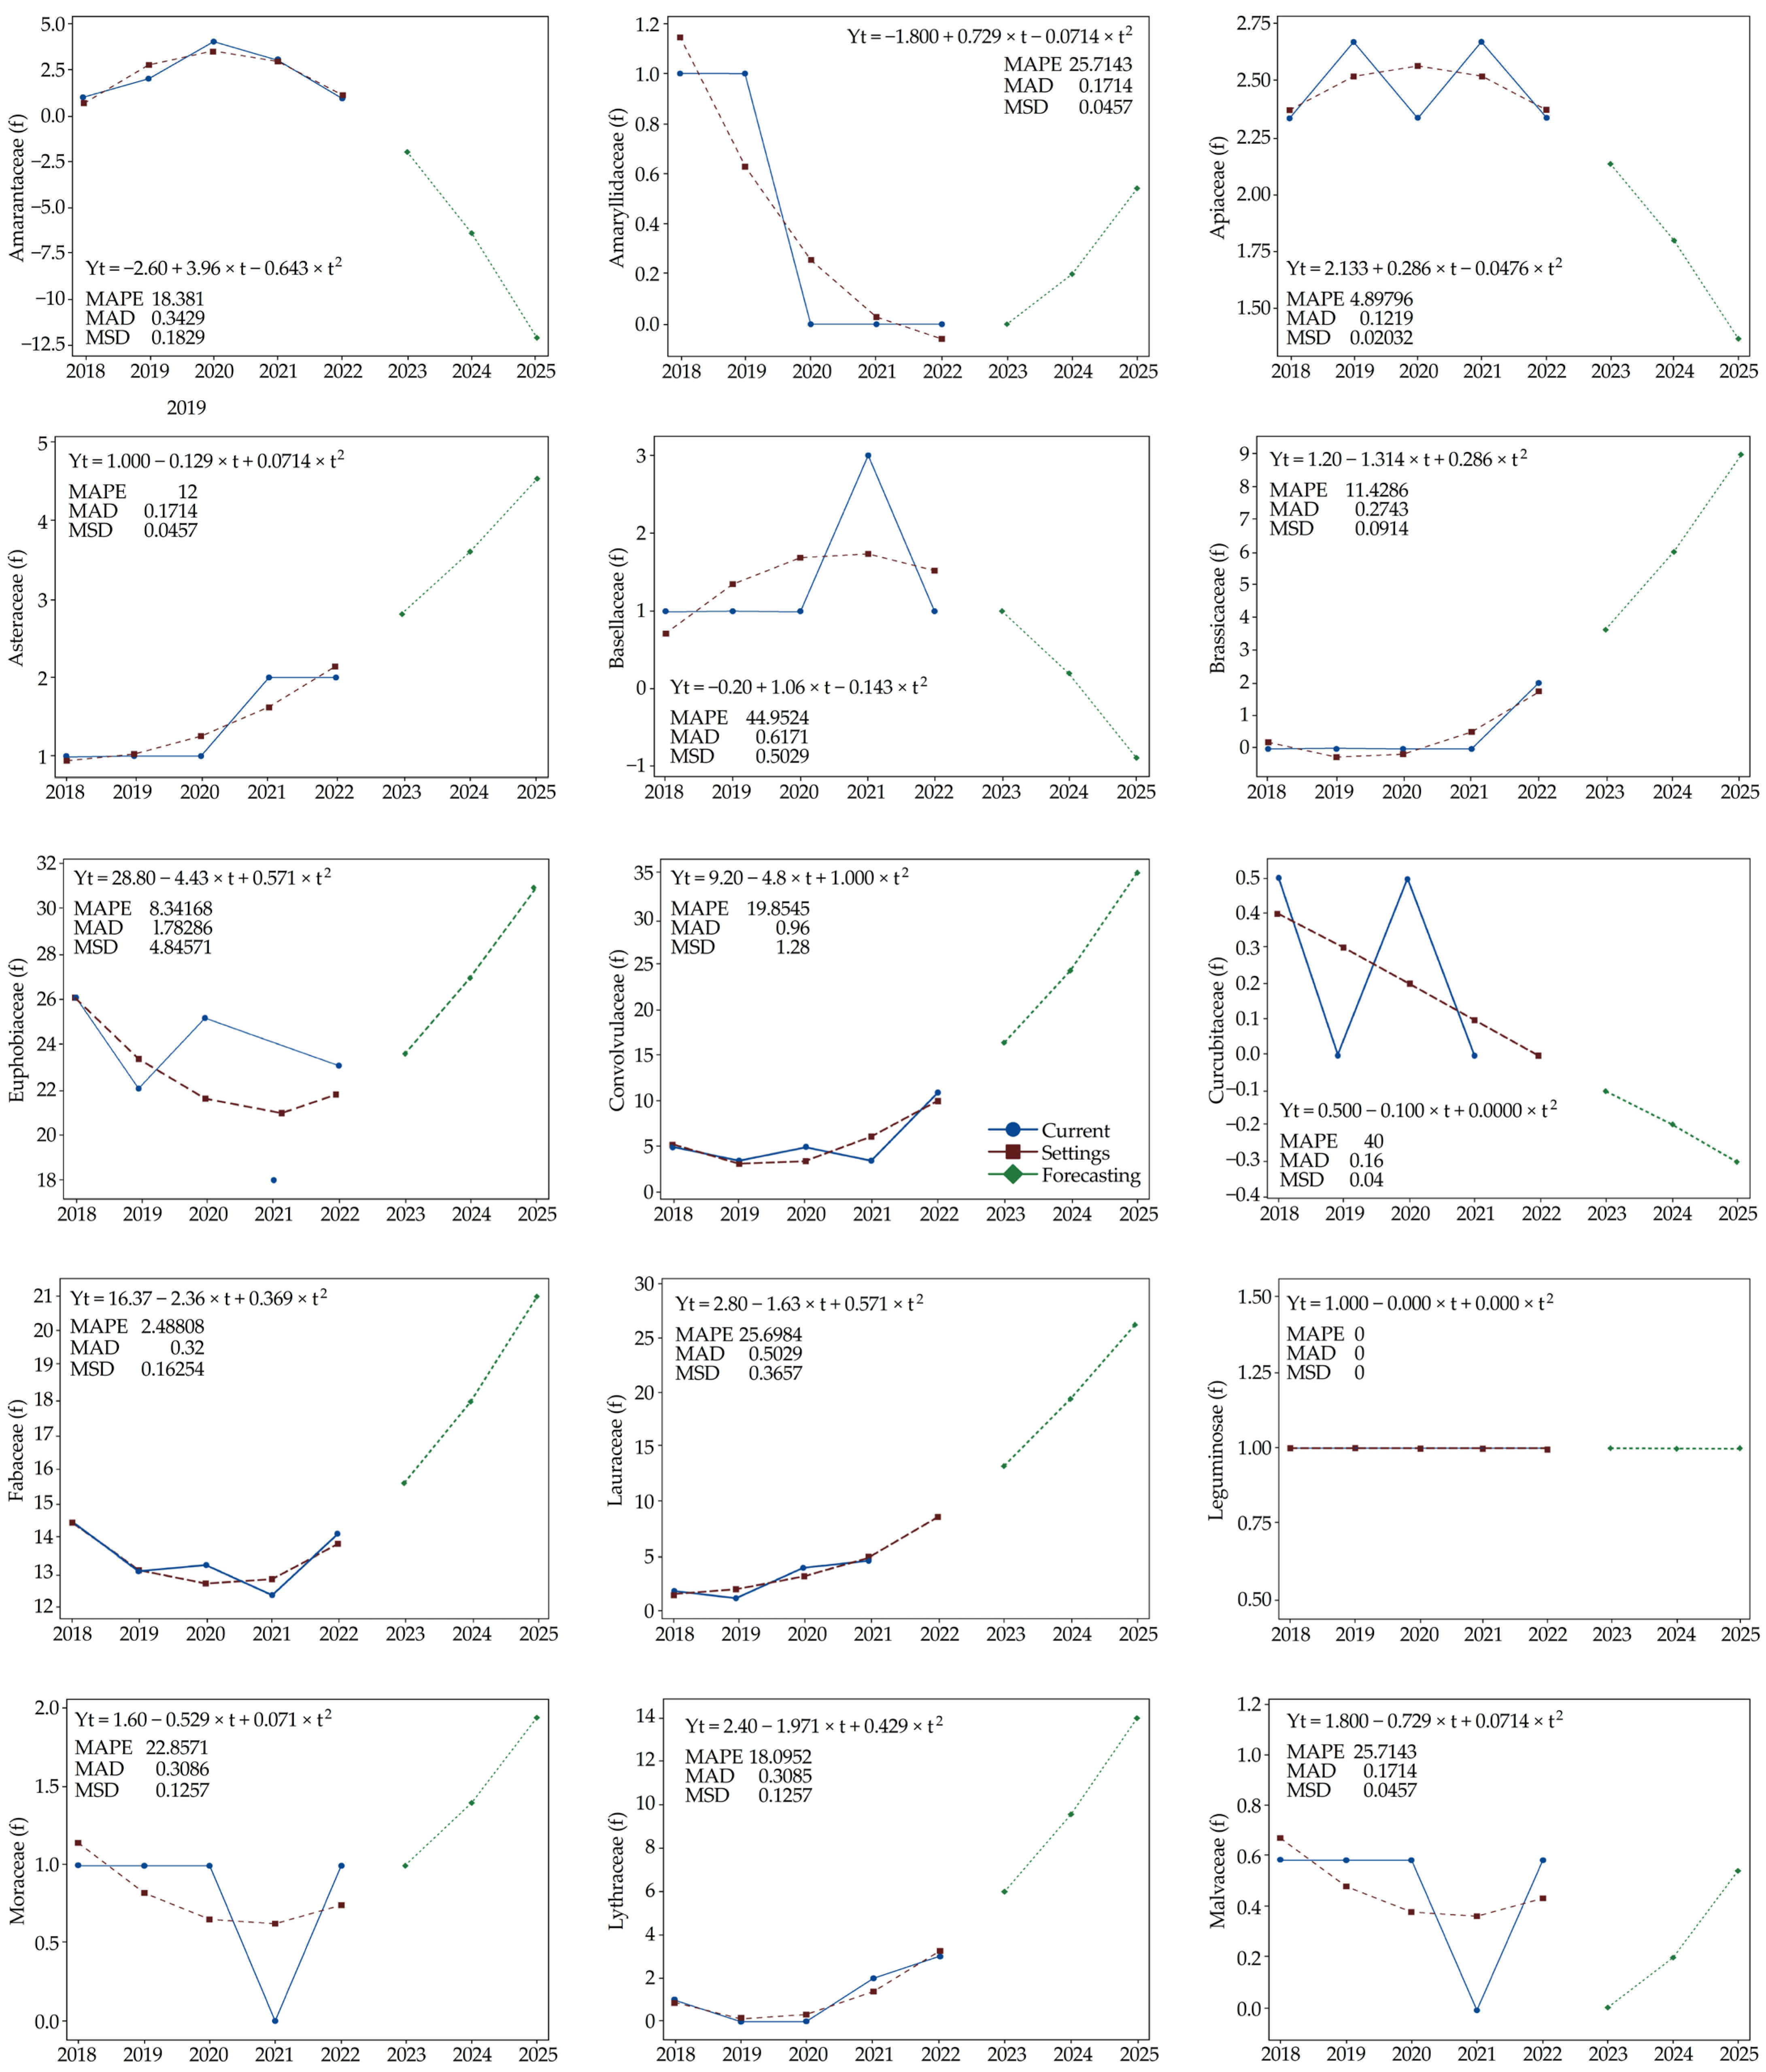
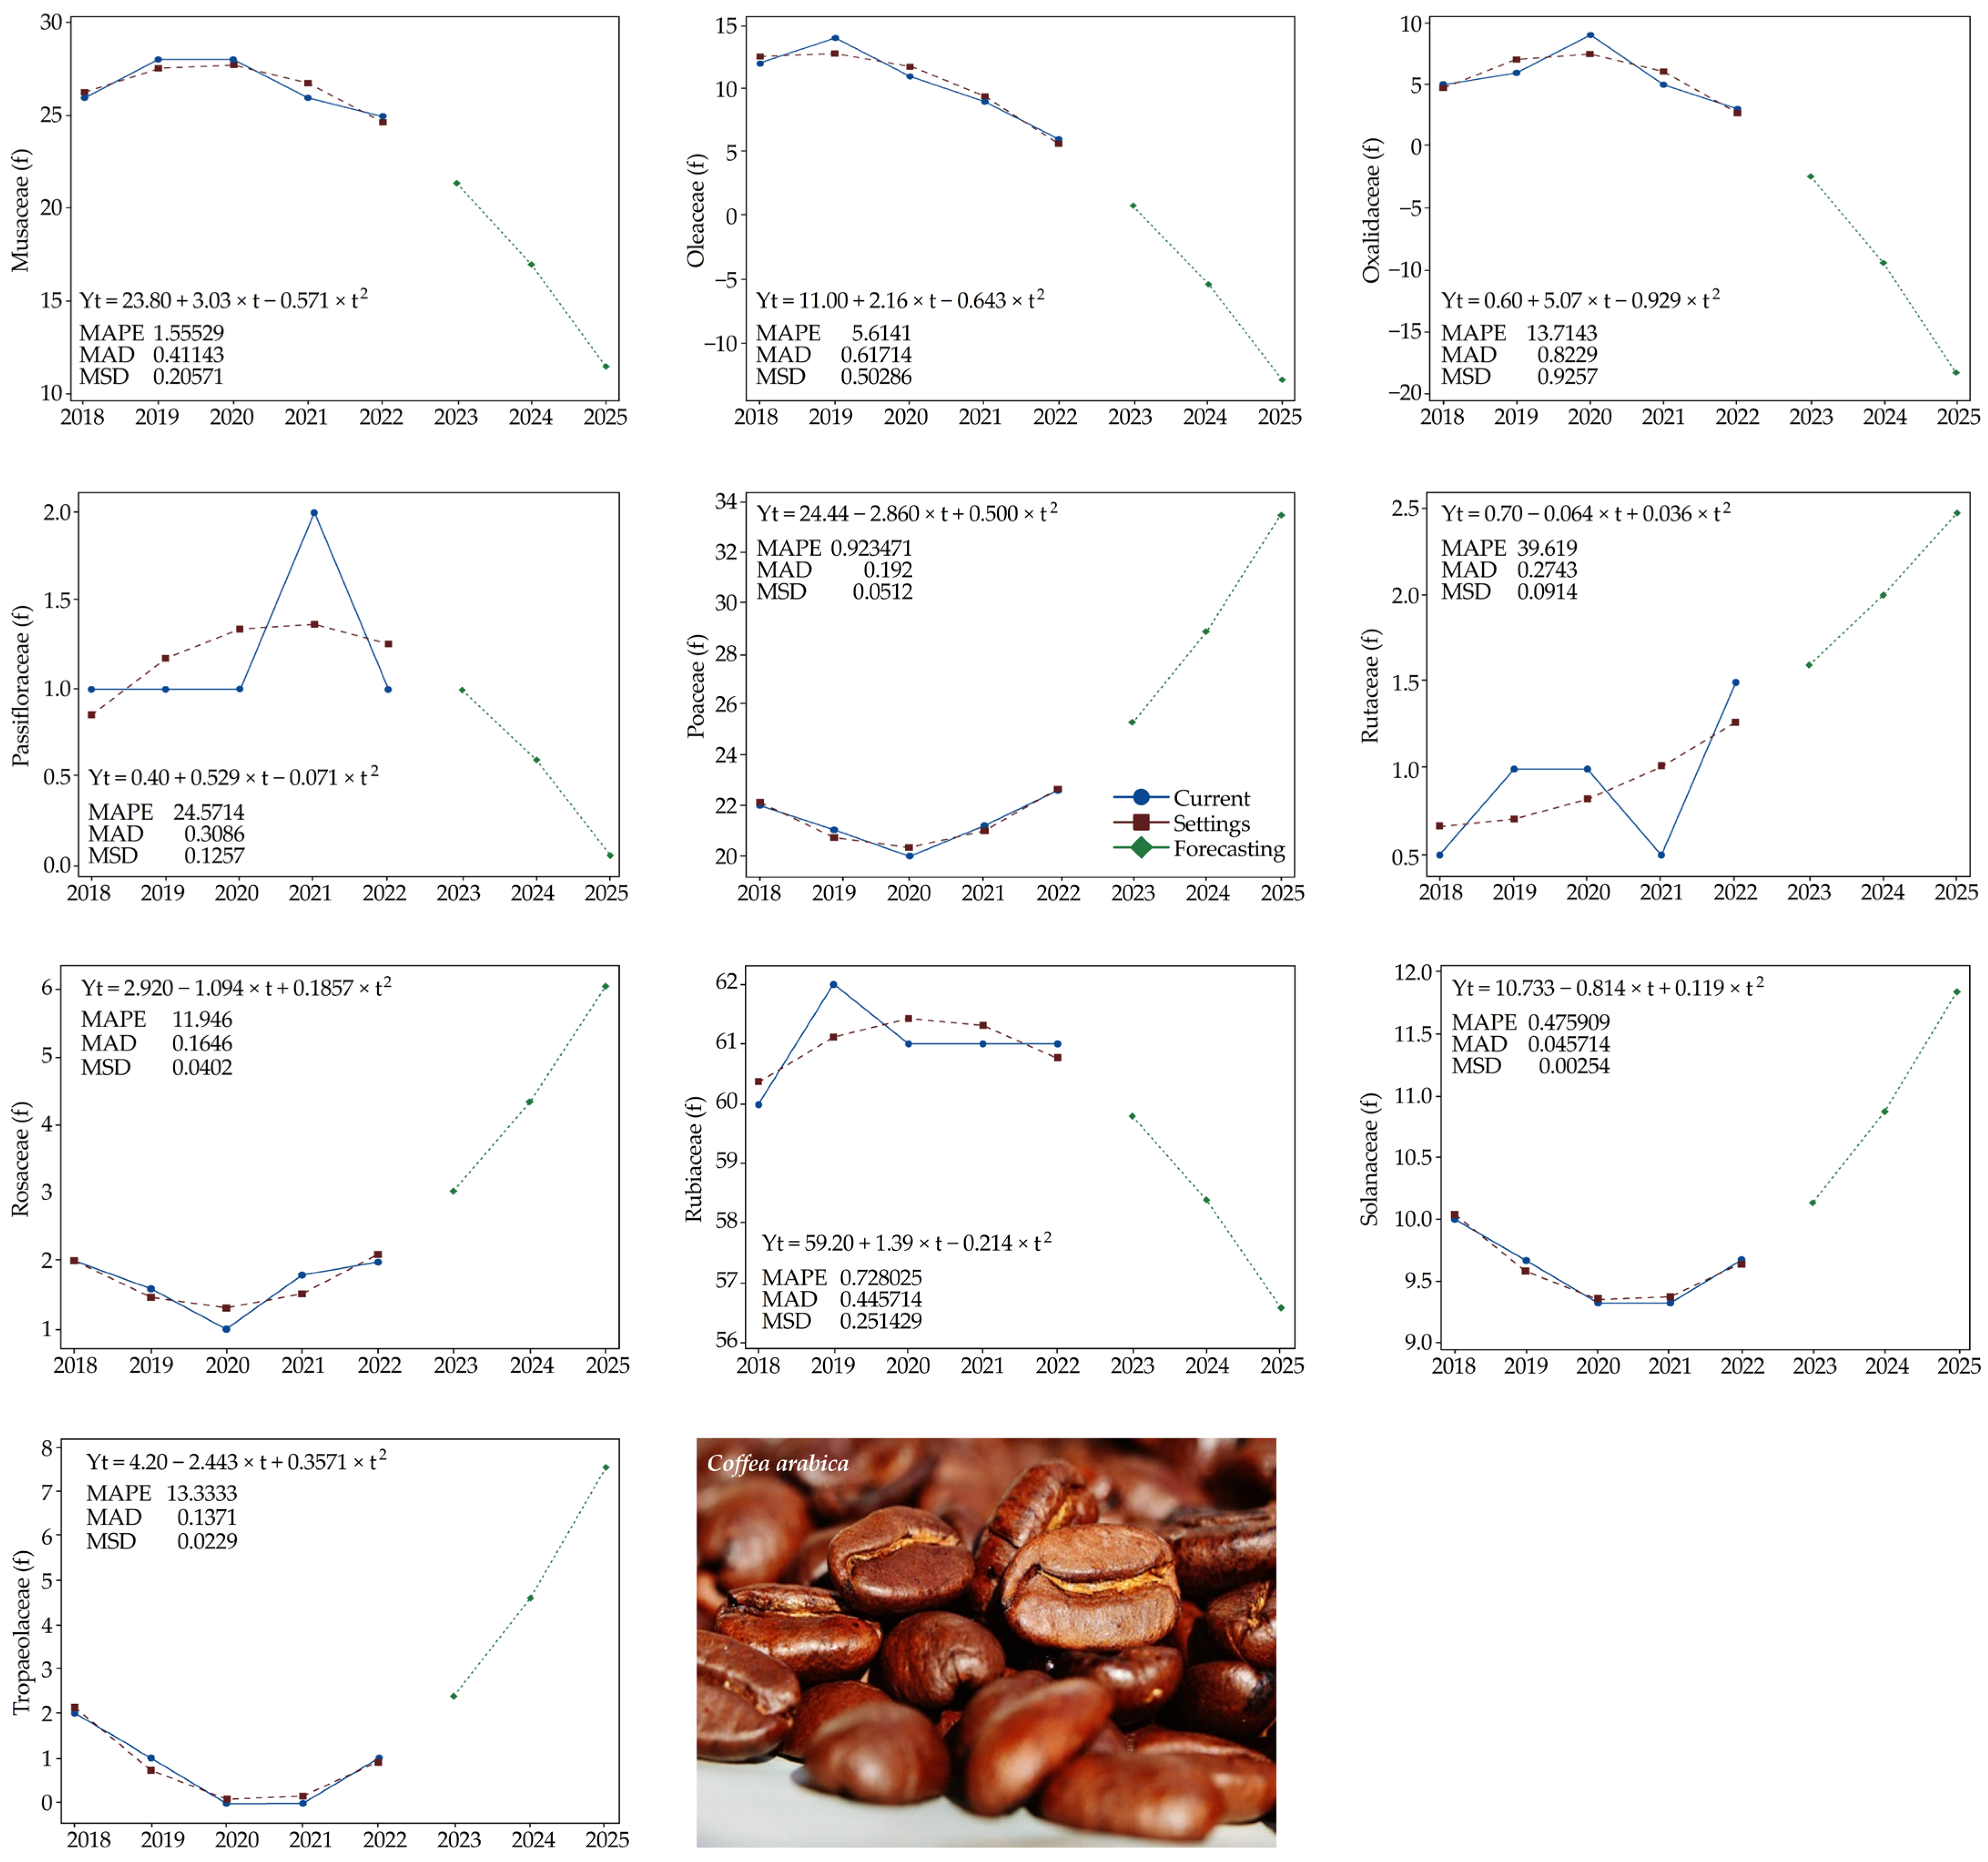
3.2. Models of Historical and Future Trends for Productive Agricultural Diversity at the Level of Crop Type and Family
4. Discussion
5. Conclusions
Author Contributions
Funding
Institutional Review Board Statement
Informed Consent Statement
Data Availability Statement
Conflicts of Interest
References
- Koning, N.B.J.; Van Ittersum, M.K.; Becx, G.A.; Van Boekel, M.A.J.S.; Brandenburg, W.A.; Van den Broek, J.A.; Goudriaan, J.; Van Hofwegen, G.; Jongeneel, R.A.; Schiere, J.B.; et al. Long-Term Global Availability of Food: Continued Abundance or New Scarcity. NJAS Wagening. J. Life Sci. 2008, 55, 229–292. [Google Scholar] [CrossRef]
- Charles, H.; Godfray, J.; Beddington, J.R.; Crute, I.R.; Haddad, L.; Lawrence, D.; Muir, J.F.; Pretty, J.; Robinson, S.; Thomas, S.M.; et al. Food Security: The Challenge of Feeding 9 Billion People. Science 2010, 327, 812–818. [Google Scholar]
- Wheeler, T.; Von Braun, J. Climate Change Impacts on Global Food Security. Science 2013, 341, 508–513. [Google Scholar] [CrossRef]
- FAO; IFAD; UNICEF; WFP; WHO. The State and Food Security and Nutrition in the World 2019. Safeguarding against Economic Slowdowns and Downturns; FAO: Rome, Italy, 2019; ISBN 9789251315705. [Google Scholar]
- Siche, R. What Is the Impact of COVID-19 Disease on Agriculture? Sci. Agropecu. 2020, 11, 3–9. [Google Scholar] [CrossRef]
- García, L.; Veneros, J.; Tineo, D. Severe Acute Respiratory Syndrome (SARS-CoV-2): A National Public Health Emergency and Its Impact on Food Security in Peru. Sci. Agropecu. 2020, 11, 241–245. [Google Scholar] [CrossRef]
- Zimmerer, K.S.; de Haan, S.; Jones, A.D.; Creed-Kanashiro, H.; Tello, M.; Amaya, F.P.; Carrasco, M.; Meza, K.; Tubbeh, R.M.; Nguyen, K.T.; et al. Indigenous Smallholder Struggles in Peru: Nutrition Security, Agrobiodiversity, and Food Sovereignty amid Transforming Global Systems and Climate Change. J. Lat. Am. Geogr. 2020, 19, 74–111. [Google Scholar] [CrossRef]
- Larson, D.F.; Varangis, P.; Yabuki, N.; Larson, Y. Commodity Risk Management and Development; SSRN 597214; Elsevier: Amsterdam, The Netherlands, 1998. [Google Scholar]
- Ramirez-Hernandez, A.; Galagarza, O.A.; Álvarez Rodriguez, M.V.; Pachari Vera, E.; Valdez Ortiz, M.d.C.; Deering, A.J.; Oliver, H.F. Food Safety in Peru: A Review of Fresh Produce Production and Challenges in the Public Health System. Compr. Rev. Food Sci. Food Saf. 2020, 19, 3323–3342. [Google Scholar] [CrossRef] [PubMed]
- Kumar, P.; Dobriyal, M.; Kale, A.; Pandey, A.K.; Tomar, R.S.; Thounaojam, E. Calculating Forest Species Diversity with Information-Theory Based Indices Using Sentinel-2A Sensor’s of Mahavir Swami Wildlife Sanctuary. PLoS ONE 2022, 17, e0268018. [Google Scholar] [CrossRef] [PubMed]
- Pimentel, D.; Stachow, U.; Takacs, D.A.; Brubaker, H.W.; Amy, R.; Meaney, J.J.; Neil, J.A.S.O.; Onsi, D.E.; Corzilius, D.B.; Dumas, A.R.; et al. Conserving Biological Diversity in Most Biological Diversity Exists in Agricultural/Forestry Systems. Bioscience 1992, 42, 354–362. [Google Scholar] [CrossRef]
- Tomar, V.; Kumar, P.; Gupta, G. A Satellite-Based Biodiversity Dynamics Capability in Tropical Forest. Electron. J. Geotech. Eng. 2013, 18, 1171–1180. [Google Scholar]
- Hooper, D.U.; Chapin, F.S.; Ewel, J.J.; Hector, A.; Inchausti, P.; Lavorel, S.; Lawton, J.H.; Lodge, D.M.; Loreau, M.; Naeem, S.; et al. ESA Report Effects of Biodiversity on Ecosystem Functioning: A Consensus of Current Knowledge. Ecol. Monogr. 2005, 75, 3–35. [Google Scholar] [CrossRef]
- Wester, P.; Mishra, A.; Mukherji, A.; Shrestha, A.B. The Hindu Kush Himalaya Assessment; Springer Nature: Berlin/Heidelberg, Germany, 2019. [Google Scholar]
- Ulian, T.; Diazgranados, M.; Pironon, S.; Padulosi, S.; Liu, U.; Davies, L.; Howes, M.J.R.; Borrell, J.S.; Ondo, I.; Pérez-Escobar, O.A.; et al. Unlocking Plant Resources to Support Food Security and Promote Sustainable Agriculture. Plants People Planet 2020, 2, 421–445. [Google Scholar] [CrossRef]
- Ghosh, S.; Kumari, A.; Chuleui, P.; Satpal, J.; Bisht, S. Emerging Solutions in Sustainable Food and Nutrition Security; Springer: Cham, Switzerland, 2023. [Google Scholar]
- Keylock, C.J. Simpson Diversity and the Shannon-Wiener Index as Special Cases of a Generalized Entropy. Oikos 2005, 109, 203–207. [Google Scholar] [CrossRef]
- Roswell, M.; Dushoff, J.; Winfree, R. A Conceptual Guide to Measuring Species Diversity. Oikos 2021, 130, 321–338. [Google Scholar] [CrossRef]
- Margalef, R. Dynamic Aspects of Diversity. J. Veg. Sci. 1994, 5, 451–456. [Google Scholar] [CrossRef]
- Koricho, H.H.; Seboka, A.D.; Song, S. Assessment of the Structure, Diversity, and Composition of Woody Species of Urban Forests of Adama City, Central Ethiopia. Arboric. J. 2020, 1–12. [Google Scholar] [CrossRef]
- Wang, C.T.; Long, R.J.; Wang, Q.J.; Ding, L.M.; Wang, M.P. Effects of Altitude on Plant-Species Diversity and Productivity in an Alpine Meadow, Qinghai-Tibetan Plateau. Aust. J. Bot. 2007, 55, 110–117. [Google Scholar] [CrossRef]
- Sistema Integrado de Estadística Agraria Actividades Estadísticas. Available online: https://opsaa.iica.int/resource-149-siea:-sistema-integrado-de-estadisticas-agrarias-en-peru (accessed on 15 January 2024).
- Boryan, C.G.; Yang, Z.; Willis, P. US Geospatial Crop Frequency Data Layers. In Proceedings of the Third International Conference on Agro-Geoinformatics, Beijing, China, 11–14 August 2014; IEEE: New York, NY, USA, 2014. [Google Scholar]
- Anríquez, G.; Toledo, G. De-Climatizing Food Security: Lessons from Climate Change Micro-Simulations in Peru. PLoS ONE 2019, 14, e0222483. [Google Scholar] [CrossRef] [PubMed]
- García, L.; Veneros, J.; Chavez, S.G.; Oliva, M.; Rojas-Briceño, N.B. World Historical Mapping and Potential Distribution of Cinchona Spp. in Peru as a Contribution for Its Restoration and Conservation. J. Nat. Conserv. 2022, 70, 126290. [Google Scholar] [CrossRef]
- Omoro, L.M.A.; Pellikka, P.K.E.; Rogers, P.C. Tree Species Diversity, Richness, and Similarity between Exotic and Indigenous Forests in the Cloud Forests of Eastern Arc Mountains, Taita Hills, Kenya. J. For. Res. 2010, 21, 255–264. [Google Scholar] [CrossRef]
- Ulanowicz, R.E. Information Theory in Ecology. Comput. Chem. 2001, 25, 393–399. [Google Scholar] [CrossRef] [PubMed]
- Fauziyah; Haryanti, Y. Prediksi Profitabilitas Bank Umum Konvensional Pada Masa Pandemi Covid-19. J. Stat. 2022, 15, 245–250. [Google Scholar]
- Jones, S.K.; Estrada-Carmona, N.; Juventia, S.D.; Dulloo, M.E.; Laporte, M.A.; Villani, C.; Remans, R. Agrobiodiversity Index Scores Show Agrobiodiversity Is Underutilized in National Food Systems. Nat. Food 2021, 2, 712–723. [Google Scholar] [CrossRef]
- Lankau, R.A.; Strauss, S.Y. Mutual Feedbacks Maintain Both Genetic and Species Diversity in a Plant Community. Science 2007, 317, 1561–1563. [Google Scholar] [CrossRef] [PubMed]
- Scherer-Lorenzen, M.; Gessner, M.O.; Beisner, B.E.; Messier, C.; Paquette, A.; Petermann, J.S.; Soininen, J.; Nock, C.A. Pathways for Cross-Boundary Effects of Biodiversity on Ecosystem Functioning. Trends Ecol. Evol. 2022, 37, 454–467. [Google Scholar] [CrossRef]
- Heino, J.; Alahuhta, J.; Bini, L.M.; Cai, Y.; Heiskanen, A.S.; Hellsten, S.; Kortelainen, P.; Kotamäki, N.; Tolonen, K.T.; Vihervaara, P.; et al. Lakes in the Era of Global Change: Moving beyond Single-Lake Thinking in Maintaining Biodiversity and Ecosystem Services. Biol. Rev. 2021, 96, 89–106. [Google Scholar] [CrossRef] [PubMed]
- Ifo, S.A.; Moutsambote, J.M.; Koubouana, F.; Yoka, J.; Ndzai, S.F.; Bouetou-Kadilamio, L.N.O.; Mampouya, H.; Jourdain, C.; Bocko, Y.; Mantota, A.B.; et al. Tree Species Diversity, Richness, and Similarity in Intact and Degraded Forest in the Tropical Rainforest of the Congo Basin: Case of the Forest of Likouala in the Republic of Congo. Int. J. For. Res. 2016, 2016, 7593681. [Google Scholar] [CrossRef]
- The World Bank. World Development Indicators—DataBank; World Bank Group: Washington, DC, USA, 2019. [Google Scholar]
- Hernández, C.; Perales, H.; Jaffee, D. “Without Food There Is No Resistance”: The Impact of the Zapatista Conflict on Agrobiodiversity and Seed Sovereignty in Chiapas, Mexico. Geoforum 2022, 128, 236–250. [Google Scholar] [CrossRef]
- Ghalambor, C.K.; McKay, J.K.; Carroll, S.P.; Reznick, D.N. Adaptive versus Non-Adaptive Phenotypic Plasticity and the Potential for Contemporary Adaptation in New Environments. Funct. Ecol. 2007, 21, 394–407. [Google Scholar] [CrossRef]
- Smit, B.; Wandel, J. Adaptation, Adaptive Capacity and Vulnerability. Glob. Environ. Chang. 2006, 16, 282–292. [Google Scholar] [CrossRef]
- Cleland, E.E. Trait Divergence and the Ecosystem Impacts of Invading Species. New Phytol. 2011, 189, 649–652. [Google Scholar] [CrossRef] [PubMed]
- Mardones, F.O.; Rich, K.M.; Boden, L.A.; Moreno-Switt, A.I.; Caipo, M.L.; Zimin-Veselkoff, N.; Alateeqi, A.M.; Baltenweck, I. The COVID-19 Pandemic and Global Food Security. Front. Vet. Sci. 2020, 7, 578508. [Google Scholar] [CrossRef] [PubMed]
- Picchioni, F.; Goulao, L.F.; Roberfroid, D. The Impact of COVID-19 on Diet Quality, Food Security and Nutrition in Low and Middle Income Countries: A Systematic Review of the Evidence. Clin. Nutr. 2022, 41, 2955–2964. [Google Scholar] [CrossRef] [PubMed]
- Amjath-Babu, T.S.; Krupnik, T.J.; Thilsted, S.H.; McDonald, A.J. Key Indicators for Monitoring Food System Disruptions Caused by the COVID-19 Pandemic: Insights from Bangladesh towards Effective Response. Food Secur. 2020, 12, 761–768. [Google Scholar] [CrossRef] [PubMed]
- Ruben, R.; Van Houte, M.; Davids, T. What Determines the Embeddedness of Forced-Return Migrants? Rethinking the Role of Pre- and Post-Return Assistance. Int. Migr. Rev. 2009, 43, 908–937. [Google Scholar] [CrossRef]
- Mencutek, Z.S. Voluntary and Forced Return Migration Under a Pandemic Crisis. In Migration and Pandemics: Spaces of Solidarity and Spaces of Exception; Research Series Migration and Pandemics; Springer: Berlin/Heidelberg, Germany, 2022. [Google Scholar]
- Fort, R.; Espinoza, M.; Espinoza, Á. COVID-19 y Las Migraciones de La Ciudad Al Campo En El Perú: Identificación de Amenazas y Oportunidades Para El Uso Sostenible Del Capital Natural; Nota Técnica N° IDB-TN-02234; BID-GRADE: Lima, Peru, 2021; p. 56. [Google Scholar]
- Sorensen, D.M. Western Agricultural Economics Association Reverse Migration and the Rural Community Development Problem. West. J. Agric. Econ. 1977, 1, 49–55. [Google Scholar]
- Recognising Silent Epidemics States and Revenue Protection Manufacturing Mobile Phones Gandhi and Self-Interrogation. Economic & Political Weekly, 9 May 2020.
- Pradhan, P.C. Redefining the Policies on Agriculture for Accommodating the Reverse Migrants During COVID-19 & Building Road Map for Development. In Social Sector in India: COVID-19 Issues and Challenges; Bharti Publications: New Delhi, India, 2021. [Google Scholar]
- Nath, A.; Jindal, T.O.P. Economic Implications of Reverse Migration in India. J. Migr. Aff. 2020, 3, 16–31. [Google Scholar] [CrossRef]
- Kaur, B.; Shubham, S. COVID-19 Crisis Through a Reverse Migration Lens. Rural Pulse 2021, 36, 1–4. [Google Scholar]
- Lawler, O.K.; Allan, H.L.; Baxter, P.W.J.; Castagnino, R.; Tor, M.C.; Dann, L.E.; Hungerford, J.; Karmacharya, D.; Lloyd, T.J.; López-Jara, M.J.; et al. The COVID-19 Pandemic Is Intricately Linked to Biodiversity Loss and Ecosystem Health. Lancet Planet. Health 2021, 5, e840–e850. [Google Scholar] [CrossRef]
- Pillaca-Medina, S.; Chavez-Dulanto, P.N. How Effective and Efficient Are Social Programs on Food and Nutritional Security? The Case of Peru: A Review. Food Energy Secur. 2017, 6, e00120. [Google Scholar] [CrossRef]
- Trigoso, D.I.; Salas López, R.; Rojas Briceño, N.B.; Silva López, J.O.; Gómez Fernández, D.; Oliva, M.; Quiñones Huatangari, L.; Terrones Murga, R.E.; Castillo, E.B.; Ángel, M.; et al. Land Suitability Analysis for Potato Crop in the Jucusbamba and Tincas Microwatersheds (Amazonas, NW Peru): AHP and RS-GIS Approach. Agronomy 2020, 10, 1898. [Google Scholar] [CrossRef]
- Salas López, R.; Gómez Fernández, D.; Silva López, J.O.; Rojas Briceño, N.B.; Oliva, M.; Terrones Murga, R.E.; Trigoso, D.I.; Castillo, B.; Ángel, M.; Gurbillón, B. Geo-Information Land Suitability for Coffee (Coffea Arabica) Growing in Amazonas, Peru: Integrated Use of AHP, GIS and RS. ISPRS Int. J. Geo-Inf. 2020, 9, 673. [Google Scholar] [CrossRef]
- Rojas-Briceño, N.B.; García, L.; Cotrina-Sánchez, A.; Goñas, M.; Salas López, R.; Silva López, J.O.; Oliva-Cruz, M. Land Suitability for Cocoa Cultivation in Peru: AHP and MaxEnt Modeling in a GIS Environment. Agronomy 2022, 12, 2930. [Google Scholar] [CrossRef]
- Cotrina-Sanchez, A.; García, L.; Calle, C.; Sari, F.; Bandopadhyay, S.; Rojas-Briceño, N.B.; Meza-Mori, G.; Torres Guzmán, C.; Auquiñivín-Silva, E.; Arellanos, E.; et al. Multicriteria Analysis in Apiculture: A Sustainable Tool for Rural Development in Communities and Conservation Areas of Northwest Peru. Land 2023, 12, 1900. [Google Scholar] [CrossRef]

| N° | Type | Common Name | Scientific Name | Family | F. 2018 | F. 2019 | F. 2020 | F. 2021 | F. 2022 |
|---|---|---|---|---|---|---|---|---|---|
| 1 | C. | Maíz | Zea mays L. | Poaceae | 61 | 62 | 55 | 63 | 65 |
| 2 | L. | Fréjol | Phaseolus vulgaris L. | Fabaceae | 33 | 33 | 29 | 29 | 29 |
| 3 | F. | Café | Coffea arabica L. | Rubiaceae | 60 | 62 | 61 | 61 | 61 |
| 4 | F. | Caña de azúcar | Saccharum officinarum L. | Poaceae | 7 | 8 | 8 | 9 | 8 |
| 5 | F. | Plátano | Musa paradisiaca L. | Musaceae | 26 | 28 | 28 | 26 | 25 |
| 6 | R. | Yuca | Manihot esculenta C. | Euphorbiaceae | 26 | 22 | 25 | 18 | 23 |
| 7 | Le. | Arverja | Pisum sativum L. | Fabaceae | 25 | 20 | 23 | 20 | 21 |
| 8 | Le. | Habas | Vicia faba L. | Fabaceae | 16 | 14 | 17 | 13 | 21 |
| 9 | C. | Trigo | Triticum aestivum L. | Poaceae | 28 | 27 | 30 | 23 | 24 |
| 10 | L. | Maní | Arachis hypogaea L. | Fabaceae | 2 | 1 | 0 | 3 | 3 |
| 11 | F. | Cacao | Theobroma cacao L. | Malvaceae | 1 | 1 | 0 | 0 | 0 |
| 12 | V. | Pepinillo | Cucumis sativus L. | Cucurbitaceae | 0 | 0 | 1 | 0 | 0 |
| 13 | V. | Caigua | Cyclanthera pedata L. | Cucurbitaceae | 0 | 0 | 1 | 0 | 0 |
| 14 | V. | Lechuga | Lactuca sativa L. | Asteraceae | 1 | 1 | 1 | 2 | 2 |
| 15 | R. | Rabanito | Raphanus sativus L. | Brassicaceae | 0 | 0 | 0 | 0 | 1 |
| 16 | T. | Papa | Solanum tuberosum L. | Solanaceae | 29 | 28 | 27 | 26 | 27 |
| 17 | R. | Camote | Ipomoea batatas L. | Convolvulaceae | 5 | 4 | 5 | 4 | 11 |
| 18 | F. | Olivo | Olea europaea L. | Oleaceae | 12 | 14 | 11 | 9 | 6 |
| 19 | F. | Palta | Persea americana M. | Lauraceae | 2 | 1 | 4 | 5 | 9 |
| 20 | F. | Ciruela | Prunus domestica L. | Rosaceae | 1 | 0 | 0 | 1 | 0 |
| 21 | F. | Manzana | Malus domestica B. | Rosaceae | 2 | 1 | 0 | 1 | 1 |
| 22 | F. | membrillo | Cydonia oblonga M. | Rosaceae | 1 | 0 | 0 | 0 | 0 |
| 23 | R. | Cebolla | Allium cepa L. | Amaryllidaceae | 1 | 1 | 0 | 0 | 0 |
| 24 | F. | Higo | Ficus carica L. | Moraceae | 1 | 1 | 1 | 0 | 1 |
| 25 | F. | Pacae | Inga feuilleei DC | Fabaceae | 1 | 0 | 0 | 0 | 2 |
| 26 | F. | Naranja | Citrus sinensis L. | Rutaceae | 1 | 1 | 1 | 0 | 2 |
| 27 | F. | Granada | Punica granatum L. | Lythraceae | 1 | 0 | 0 | 2 | 3 |
| 28 | F. | Durazno | Prunus persica L. | Rosaceae | 6 | 7 | 5 | 6 | 9 |
| 29 | V. | Alfalfa | Medicago sativa L. | Fabaceae | 9 | 10 | 10 | 8 | 8 |
| 30 | F. | Limón | Citrus limon L. | Rutaceae | 0 | 1 | 1 | 1 | 1 |
| 31 | F. | Níspero | Eriobotrya japonica T. | Rosaceae | 0 | 0 | 0 | 1 | 0 |
| 32 | C. | Cebada | Hordeum vulgare L. | Poaceae | 13 | 8 | 7 | 11 | 15 |
| 33 | R. | Ollucos | Ullucus tuberosus C. | Basellaceae | 1 | 1 | 1 | 3 | 1 |
| 34 | R. | Mashua | Trapeolum tuberosum Ruiz & Pav. | Tropaeolaceae | 2 | 1 | 0 | 0 | 1 |
| 35 | R. | Oca | Oxalis tuberosa M. | Oxalidaceae | 5 | 6 | 9 | 5 | 3 |
| 36 | C. | Quinoa | Chenopodium quinoa W. | Amarantaceae | 1 | 2 | 4 | 3 | 1 |
| 37 | C. | Avena | Avena sativa | Poaceae | 1 | 0 | 0 | 0 | 1 |
| 38 | F. | Granadilla | Passiflora ligularis J. | Passifloraceae | 1 | 1 | 1 | 2 | 1 |
| 39 | F. | Rocoto | Capsicum pubescens Ruiz & Pav | Solanaceae | 0 | 0 | 0 | 1 | 1 |
| 40 | V. | Ají | Capsicum annuum L. | Solanaceae | 1 | 1 | 1 | 1 | 1 |
| 41 | F. | Sandía | Citrullus lanatus T. | Cucurbitaceae | 1 | 0 | 0 | 0 | 0 |
| 42 | R. | Bituca | Colocasia esculenta L. | Araceae | 1 | 1 | 1 | 1 | 1 |
| 43 | R. | Racacha | Arracacia xanthorrhiza B. | Apiaceae | 4 | 4 | 4 | 4 | 3 |
| 44 | V. | Zapallo | Cucurbita Maxima D. | Cucurbitaceae | 1 | 0 | 0 | 0 | 0 |
| 45 | V. | Repollo | Brassica oleracea L. | Brassicaceae | 0 | 0 | 0 | 0 | 2 |
| 46 | V. | Zanahoria | Daucus carota L. | Apiaceae | 2 | 3 | 2 | 3 | 3 |
| 47 | L. | Chocho | Lupinus mutabilis S. | Leguminosae | 1 | 1 | 1 | 1 | 1 |
| Region | District | Average Number of Agricultural Species Cultivated per Farmer | ∆ 2018–2022 | Tendency | ||||
|---|---|---|---|---|---|---|---|---|
| 2018 | 2019 | 2020 | 2021 | 2022 | ||||
| Coast | Atico | 2.65 ± 1.50 | 2.1 ± 1.02 | 2.15 ± 0.88 | 2.25 ± 1.25 | 3.3 ± 1.42 | 24.53% |  |
| Guadalupe | 1.55 ± 0.51 | 1.6 ± 0.60 | 1.65 ± 0.59 | 1.65 ± 0.59 | 1.65 ± 0.59 | 6.45% |  | |
| Paccho | 3.9 ± 1.17 | 3.8 ± 1.20 | 3.4 ± 0.94 | 3.3 ± 0.80 | 3.4 ± 0.82 | −12.82% |  | |
| Highlands | Lucanas | 3.45 ± 1.28 | 2.9 ± 0.97 | 2.75 ± 1.12 | 3.25 ± 0.85 | 3.7 ± 1.34 | 7.25% |  |
| Lonya Chico | 4.75 ± 1.37 | 4.4 ± 1.60 | 4.4 ± 1.60 | 4.4 ± 1.54 | 4.5 ± 1.50 | −5.26% |  | |
| Sapillica | 2.35 ± 1.09 | 2.2 ± 1.11 | 1.8 ± 0.77 | 1.8 ± 0.700 | 1.7 ± 0.60 | −27.66% |  | |
| Jungle | Santa Rosa | 1.65 ± 1.09 | 1.65 ± 0.99 | 1.65 ± 0.99 | 1.65 ± 0.99 | 1.65 ± 0.99 | 0.00% |  |
| Jepelacio | 3.00 ± 1.08 | 2.8 ± 1.01 | 2.9 ± 0.79 | 2.7 ± 0.98 | 2.65 ± 0.99 | −11.67% |  | |
| Villa Rica | 1.05 ± 0.22 | 1 ± 0.01 | 1 ± 0.01 | 1.05 ± 0.22 | 1.1 ± 0.45 | 4.76% |  | |
| Summary | 2.71 ± 1.57 | 2.49 ± 1.44 | 2.41 ± 1.36 | 2.45 ± 1.36 | 2.63 ± 1.49 | −2.87% |  | |
| Natural Region | District | Index | 2018 | 2019 | 2020 | 2021 | 2022 | Trend |
|---|---|---|---|---|---|---|---|---|
| Coast Region | Atico | Shannon_H | 2.84 | 2.88 | 2.91 | 2.86 | 2.9 | |
| Margalef | 4.79 | 5.08 | 5.05 | 4.99 | 4.53 | |||
| Paccho | Shannon_H | 2.96 | 2.95 | 2.96 | 2.97 | 2.97 | 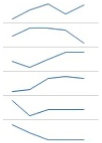 | |
| Margalef | 4.36 | 4.39 | 4.5 | 4.53 | 4.5 | |||
| Guadalupe | Shannon_H | 2.94 | 2.93 | 2.94 | 2.94 | 2.94 | ||
| Margalef | 5.33 | 5.48 | 5.43 | 5.43 | 5.43 | |||
| Highlands Region | Lucanas | Shannon_H | 2.92 | 2.94 | 2.91 | 2.96 | 2.93 | |
| Margalef | 4.49 | 4.68 | 4.74 | 4.55 | 4.41 | |||
| Lonyachico | Shannon_H | 2.95 | 2.91 | 2.91 | 2.91 | 2.2 | ||
| Margalef | 4.17 | 4.02 | 4.02 | 4.02 | 4 | 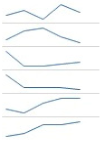 | ||
| Sapillica | Shannon_H | 2.89 | 2.88 | 2.91 | 2.92 | 2.93 | ||
| Margalef | 4.94 | 5.02 | 5.30 | 5.30 | 5.39 | |||
| Jungle Region | Villa Rica | Shannon_H | 2.98 | 2.3 | 3.00 | 2.98 | 2.94 |  |
| Margalef | 6.24 | 6.34 | 6.34 | 6.24 | 6.14 | |||
| Jepelacio | Shannon_H | 2.93 | 2.93 | 2.96 | 2.94 | 2.94 | ||
| Margalef | 4.64 | 4.72 | 4.68 | 4.76 | 4.79 | |||
| Santa Rosa | Shannon_H | 2.8 | 2.86 | 2.86 | 2.86 | 2.86 | ||
| Margalef | 5.15 | 5.43 | 5.43 | 5.43 | 5.43 |
Disclaimer/Publisher’s Note: The statements, opinions and data contained in all publications are solely those of the individual author(s) and contributor(s) and not of MDPI and/or the editor(s). MDPI and/or the editor(s) disclaim responsibility for any injury to people or property resulting from any ideas, methods, instructions or products referred to in the content. |
© 2024 by the authors. Licensee MDPI, Basel, Switzerland. This article is an open access article distributed under the terms and conditions of the Creative Commons Attribution (CC BY) license (https://creativecommons.org/licenses/by/4.0/).
Share and Cite
Chavez, S.G.; Arellanos, E.; Veneros, J.; Rojas-Briceño, N.B.; Oliva-Cruz, M.; Bolaños-Carriel, C.; García, L. Unveiling Peru’s Agricultural Diversity: Navigating Historical and Future Trends in a Post-COVID-19 Context. Sustainability 2024, 16, 4191. https://doi.org/10.3390/su16104191
Chavez SG, Arellanos E, Veneros J, Rojas-Briceño NB, Oliva-Cruz M, Bolaños-Carriel C, García L. Unveiling Peru’s Agricultural Diversity: Navigating Historical and Future Trends in a Post-COVID-19 Context. Sustainability. 2024; 16(10):4191. https://doi.org/10.3390/su16104191
Chicago/Turabian StyleChavez, Segundo G., Erick Arellanos, Jaris Veneros, Nilton B. Rojas-Briceño, Manuel Oliva-Cruz, Carlos Bolaños-Carriel, and Ligia García. 2024. "Unveiling Peru’s Agricultural Diversity: Navigating Historical and Future Trends in a Post-COVID-19 Context" Sustainability 16, no. 10: 4191. https://doi.org/10.3390/su16104191
APA StyleChavez, S. G., Arellanos, E., Veneros, J., Rojas-Briceño, N. B., Oliva-Cruz, M., Bolaños-Carriel, C., & García, L. (2024). Unveiling Peru’s Agricultural Diversity: Navigating Historical and Future Trends in a Post-COVID-19 Context. Sustainability, 16(10), 4191. https://doi.org/10.3390/su16104191