Article

Issues of Water Resources in Saudi Arabia: Past, Present, and Future

by
Mohammad Suhail
1,*,
Turki Kh. Faraj
2,
Waseem Ahmad
3,
Alikul Xudayberdiyevich Ravshanov
4 and
Mohd Nazish Khan
5
1
Centre of Applied Remote Sensing and GIS Applications, Samarkand State University named after Sharof Rashidov, Samarkand 140100, Uzbekistan
2
Department of Soil Sciences, College of Food and Agriculture Sciences, King Saud University, P.O. Box 145111, Riyadh 11362, Saudi Arabia
3
Symbiosis Law School, Noida Symbiosis International (Deemed University), Pune 201301, India
4
Faculty of Geography and Ecology, Samarkand State University named after Sharof Rashidov, Samarkand 140100, Uzbekistan
5
Department of Geography, Samarkand State University named after Sharof Rashidov, Samarkand 140100, Uzbekistan
*
Author to whom correspondence should be addressed.
Sustainability 2024, 16(10), 4189; https://doi.org/10.3390/su16104189
Submission received: 14 February 2024 / Revised: 12 April 2024 / Accepted: 13 April 2024 / Published: 16 May 2024

Abstract

:
The present paper addresses a comprehensive historical assessment of water consumption, demand, and supply in Saudi Arabia, along with future projections regarding water balance, in terms of demand and supply by source in various sectors. Being an arid region, Saudi Arabia experiences scorching heat, low precipitation, a high rate of potential evaporation, and the absence of permanent water bodies over the territory. Groundwater contributes almost 61% of total available water, while the recharge rate is negligible. However, few widyan (ephemeral streams) systems exists to satisfy water demand, which could contribute to approximately one year of domestic water consumption if managed efficiently. The study also predicts water consumption scenarios for the next three consecutive development plans, i.e., the 10th plan (2015–2019), 11th plan (2020–2024), and 12th plan (2025–2029). The analysis shows that water consumption may decline significantly in the future, if the present rate of decline continues. Scenario I, if the current rate is assumed, provides a decrease in consumption of 14.36, 12.66, and 11.15 BCM for 10th, 11th, and 12th plans, respectively. Moreover, the domestic and industrial sectors will consume more water in the future. In the same way, scenarios II and III represent a decline in total water consumption, along with that of agriculture, while domestic and industrial water usage would increase, thus improving environmental sustainability.

1. Introduction

The Arabian Peninsula is one of the most water-scarce regions of the world [1,2] and, being part of this region, Saudi Arabia has not been an exception. Natural water supply in Saudi Arabia, regarding precipitation, remains low, and sometimes not a single drop of water is received in a whole year [3,4,5]. Mainly, the country has relied upon underground water, or fossil aquifers, to meet its household, industrial, agricultural, and environmental needs [6]. Further, quality and quantity restrict the development of water resources due to contaminated toxic chemicals and variability in distribution [7]. Most of the Arabian Peninsular region is associated with tropical high-pressure dry wind systems descending on the poleward sides of Hadley cells, and corresponding Westerlies coming from Ferrell cells, descending towards the equator [4,8,9]. This air is generally arid, and intersects between the Hadley and Ferrell cells, due to lack of moisture at approximately 30°latitude in both hemispheres, which has impacted the whole of the Arabian Peninsula and the Sahara region [8,10]. Therefore, the rate of evaporation always remains higher than precipitation, which makes this region extremely arid. Additionally, the shift in the thermal equator (meteorological equator), due to the thermostatic effect of oceans, has been another reason for aridity in the Saudi Arabia region [11,12]. The Kingdom does not have rivers and lakes from which the supply of water can be assured. It has the world’s most extensive continuous sand desert, which includes the Great Rub-Al-Khali, Ad-Dhana, and An-Nafud deserts. Since evapotranspiration in Saudi Arabia remains very high, at about 2500–4500 mm per year [13,14], due to the harsh and hot climate that restricts the survival of flora and fauna, it has been estimated that two-thirds of the area of the country has only bushes and scrublands [15]. Nevertheless, Widyan (ephemeral stream) systems are often evident throughout the territory; these seem to be the only source of surface water supply for agricultural development in Saudi Arabia. Fertile land is situated in limited areas and found only in the alluvium deposits of widyan, oases, and basins, or near coastal lands [16,17].
After 1973, the Kingdom of Saudi Arabia experienced rapid development in its economic and social sectors, the result of the oil embargo during the Arab–Israel (Yom Kippur) war, which resulted in a 13-fold increase in crude oil revenues. The total oil revenue rose to Saudi Arabian Rials (SAR) 94.19 billion in 1974, as compared to SAR 7.12 billion in the previous year [18,19]. This produced a hefty increase in government revenues, which led to development activities in all economic sectors. Aspirations towards self-sufficiency and reliance, achieving better livelihoods, and prosperity goals for rural society, countered by political instability in West Asia, were major challenges that motivated the Saudi government to initiate major infrastructural development in the country. Consequently, the country’s development plan and various schemes were launched by the Saudi government to boost self-sufficiency and reliance on multiple resources, including for water and agriculture. Substantial improvement has also been noticed in the standard of living, especially in urban areas [20,21]. Moreover, the demand for water has increased manifold in all sectors, domestic, agricultural, and industrial. Information on available water resources, usage, the gap between demand and supply, management strategies, policies and methods of estimation, etc., are lacking in the scientific literature. Few or negligible studies have been conducted on Saudi Arabian water resources. Alotaibi et al. (2023) have examined Saudi Arabia’s water scarcity and its impact on agriculture, industry, and society. It was estimated that over 80% of water was used for agriculture, primarily from unsustainable groundwater extraction. This research suggests mitigating strategies for the water crisis, which include rainwater harvesting, treated wastewater reuse, and more judicious water use [22]. El-Rawy et al. (2023) used five climate models for two socio-economic pathways and forecast increased irrigation water requirements (IWR) by 2100, with projected rises in temperature and evapotranspiration. Crop areas are expected to decrease, indicating heightened water demand from agriculture. Under the SSP2-4.5 and SSP5-8.5 scenarios, the growth in irrigation water requirements (GIWRs) could rise by 3.1% and 6.7% by 2100, respectively [23]. Haq and Khan (2022) estimated crop water requirements (CWRs) under changing climate scenarios, using high-resolution satellite data and environmental variables. Results showed a varying rate of evapotranspiration, and thus CWR usage, in Saudi Arabia [24]. This supports the idea of a decline in crop water consumption. However, the rate of decline was not calculated by the authors, but a detailed review of the research topic is available online in a doctoral thesis and can be accessed at http://shodhganga.inflibnet.ac.in/handle/10603/110554 (accessed on 7 October 2023). Some important previous works include [18,25,26,27,28,29,30,31,32,33,34,35,36,37,38,39,40]. In the present study, a plausible explanation has been attempted to explore the situation or status of available water resources in Saudi Arabia, sources of water supply, and estimates, analysis, and future projections for water demand and supply in the three main water-consuming sectors, domestic, agricultural, and industrial. Thus, these complete scenarios can be understood and taken as a lesson for optimum water resource management in Saudi Arabia.

2. Materials and Methods

Nevertheless, the survey on water resources suffers from great uncertainties because of the imprecise and conventional methodology of the estimates [41]. The previous survey on water resources in Saudi Arabia was conducted more than 50 years ago due to the lack of appropriate institutional and technological provisions [42]. Though a new and comprehensive survey has been projected to be executed under the objectives of the Eighth Development Plan (2005–2009), published reports are still not available in the public domain. The Ninth Development Plan (2010–2014) also lacks precise estimates of water resources [41,43]. A comprehensive document for the 10th Development Plan (2014–2019) cannot be made available, as there are inconsistencies in published resources in the English language. Therefore, the statistics released by the Ministry of Environment, Water and Agriculture, Kingdom of Saudi Arabia (MEWA), and the General Agency for Statistics (GASTAT) were translated from Arabic to English to obtain reliable information on water resources [44,45,46,47,48]. The Saudi Statistical Yearbook (SSYB) has also published an annual database on water resources, along with economic and social development, trade and commerce, etc. [49,50,51,52,53,54,55]. However, the Ministry of Water and Electricity (MOWE) is the sole authority for the execution and implementation of water resource projects and manages the collection of statistics on water resources [56]. Thus, there is a serious lack of insight into the collection of statistical estimates on water resources due to the engagement of several agencies at various levels. Present discussions on water demand and supply may suffer from variations in estimates. However, a proper and conscious effort has been adopted to reduce these uncertainties in the present study, which could be the first comprehensive study that incorporates all important sources for the databases available so far. After collecting data, descriptive and inferential statistical methods were employed to analyze data into productive means, which include the extrapolation method using compound annual growth rate (CAGR), the graphical method, and empirical formulas (like percentage shares). The CAGR can be obtained by using Equation (1):
C A G R = V F i n a l V I n i t i a l 1 t 1
where V F i n a l and V I n i t i a l are the values for the current and beginning year, respectively, and t is the time in years. Further, ArcGIS 10.4.1 software and GIS techniques were adopted to represent spatial conjectures.

3. Results and Discussion

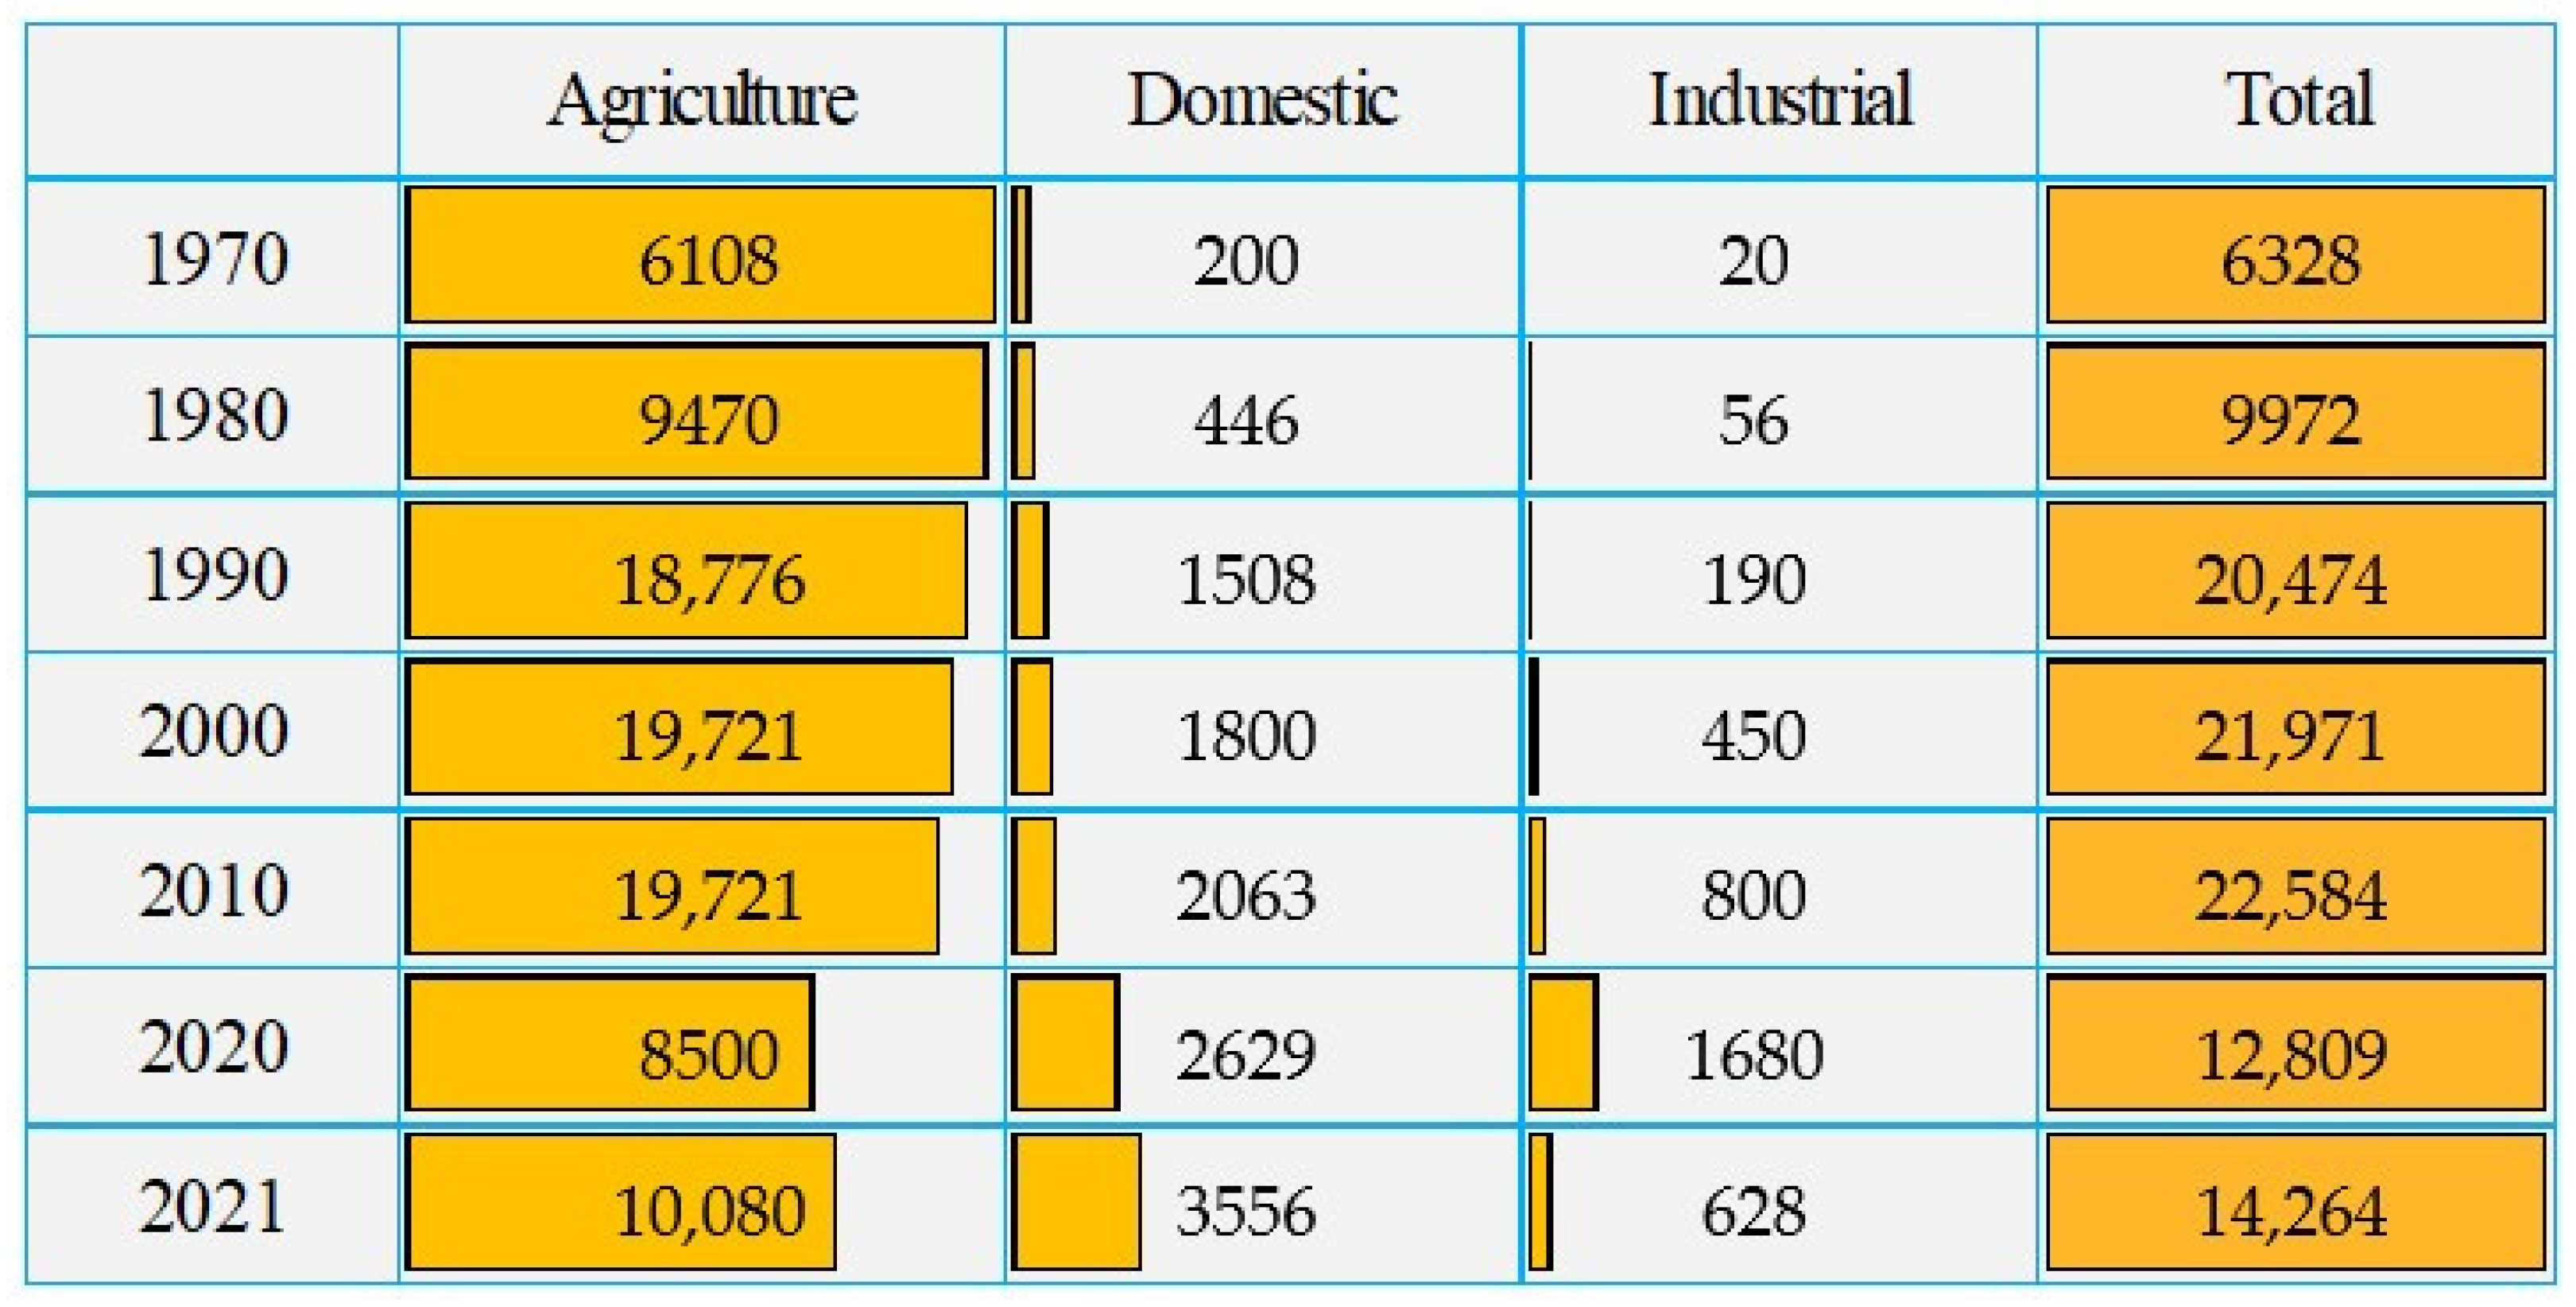
3.1. Water Demand in Saudi Arabia

In Saudi Arabia, the consumption of water resources involves sector-wise demand from the domestic, industrial, and agricultural sectors. This is coupled with the high standard of living and rapid development of all sectors in the past five decades [57,58]. The highest water demand came from the agriculture sector, followed by the domestic and industrial sectors, respectively. Due to the unfavorable climatic conditions for farming, the practices of cultivation depend entirely on irrigation in Saudi Arabia. The total area under cultivation in 1971 was 419,000 hectares, which increased to 609,000 hectares in 1980 and reached a maximum of 1,597,000 hectares in 1994 [59]. After that, the kingdom realized the value of water and took the first step towards water conservation in the agricultural sector, which was followed by a reduction in subsidy to wheat cultivation [60]. The total cultivated area reached 619,000 hectares in 2000, further declining to 287,000 hectares in 2010. In 2020, it was estimated to be 263 thousand hectares [20,48,58]. The cultivated area under wheat witnessed ups and downs, from 924,000 hectares in 1992 to 419,000 hectares in 2000 and 196,000 hectares in 2009 [59]. Moreover, the total cultivated area also decreased from 1,597,000 hectares in 1994 to 1,120,000 and 835,000 hectares in 2000 and 2009, respectively [61]. Moreover, the area under wheat cultivation was 220,000 hectares in 2010, which declined to 87,000 hectares by 2020 [58]. The share of the area under wheat cultivation in relation to the total cultivated area increased from 10% in 1971 to 82% in 1992 but decreased subsequently to 60% in 2009 [20] and further declined to 33% in 2020 [58]. Further, the Saudi resolution on the banning of fodder cultivation is expected to contribute to decreasing groundwater consumption in Saudi Arabia, especially from groundwater wells belonging to agricultural companies that ceased fodder cultivation [62]. The demand for water in agriculture rose from 6108 million cubic meters (MCMs) in 1970 to 10,080 MCMs in 2021 (Figure 1), peaking during 2000–2010 with 19,271 MCMs [6,47,63,64].
This rapidly increased, tripling during 1970–1990. After the change in government policy on subsidies, the demand became almost constant from 1990 to 2010. The share of water demand for agriculture was 95% of the total in 1980, which decreased approximately by a decadal rate of 3% and reached 87% in 2010. Further, it is continuously declining, reaching 71% of total water demand (Figure 1). This decline in water demand from agriculture was coupled with the combined effect of policy change along with the increase in the share of water demand from other sectors, i.e., domestic and industry [47,63,65]. The domestic sector is the second highest water-consuming sector in Saudi Arabia. The population of Saudi Arabia was 5.8 million in 1970 [66], which rose at an annual growth rate of 3.8% and reached 15.2 million in 1990 [49]. After that, the annual growth of the population decreased to 2.5% from 1990 to 2010 [49]. In 2010, the population of Saudi Arabia was estimated to be 27 million, of which 58.6% were Nationals while 41.1% were expatriates [49]. The population has witnessed a steady increase since then and rose to 31 million in 2020, with 57% Saudi Nationals [67]. The demand for water in the domestic sector was 200 MCMs in 1970 and reached 3556 MCMs in 2021 (Figure 1). The water demand increased sharply after 1980 from 446 MCMs to 1508 MCM in 1990. Therefore, a triple-fold increase in a period of 10 years (1980–1990) was marked by the demand for water in the domestic sector. In 2000, the demand reached 1800 MCMs with an additional increase of 300 MCMs from the preceding period, further, an increase of 263 MCMs, with a total of 2063 MCMs also estimated for 2010. This shows a significant increase, due to an increase in population and construction activities across the Kingdom. The total water demand in the domestic sector was at its peak in 2021, as evident from the figures (Figure 1). However, MEWA indicates that the average monthly water consumption bill declined after 2019 due to new tariffs, the installation of new smart meters, and ongoing water rationalization awareness campaigns [58]. During 1970–1980, the decadal change of population was 60.60%, while the demand for water in the same period increased by 123%, coupled with the high standard of living. During 1980–1990, the trend in water demand reached at highest level, along with population growth in the next decade. In the same period, the decadal change of population growth was 63%, whereas the increase in water demand was 238%. This was the highest ever change in domestic water demand due to the maximum rate of immigration in Saudi Arabia [68]. The decadal change, during 1990–2000, in population witnessed a decrease and registered a growth of only 35%. Therefore, demand for domestic water was also envisaged to decline by 19%, as compared to 238% in the previous decade. During 2000–2010, the changes in domestic water demand and in population were recorded at 14.6% and 32.5%, respectively. Moreover, the share of household water for total water demand was 3, 4, 7, 8, 9, and 21% in the years 1970, 1980, 1990, 2000, 2010, and 2020, respectively.

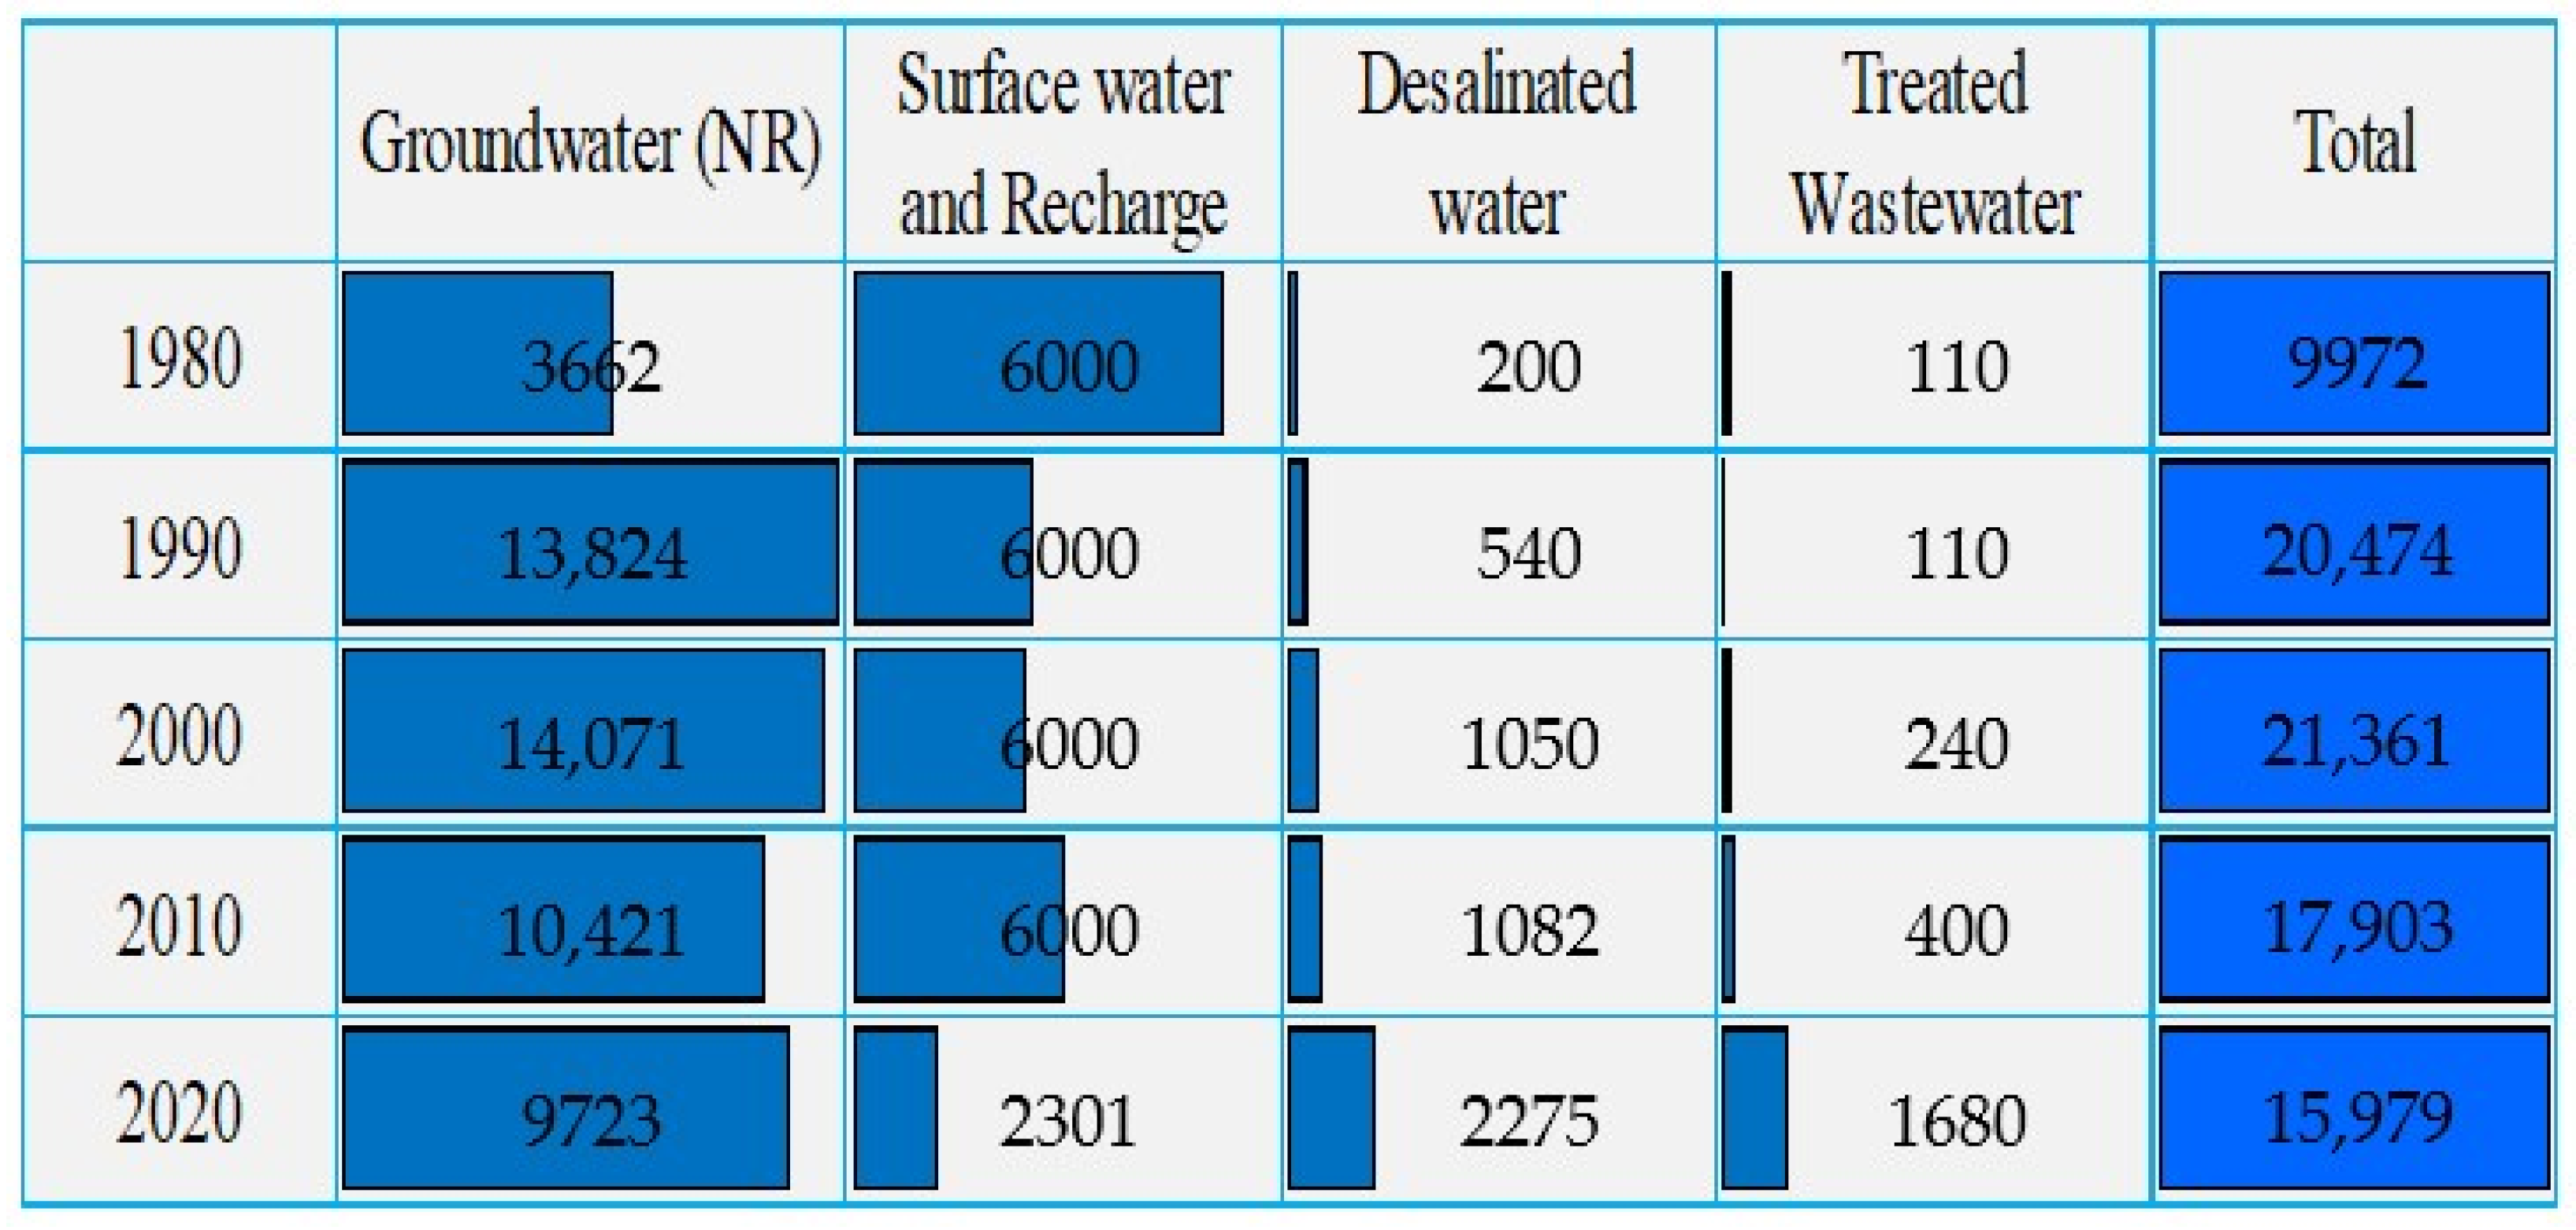
3.2. Water Supply in Saudi Arabia

There are four primary sources of water supply in Saudi Arabia, i.e., groundwater from deep aquifers, surface water with renewable water, desalinated water, and treated wastewater. The contribution of groundwater is highest in the total water supply. Groundwater comes from deep aquifers spread over the whole of the territory of the Kingdom of Saudi Arabia. Eight principal aquifers contain almost 86% of non-renewable water, and the remaining water is stored in secondary aquifers. Most are spread in the northeast and central parts of Arabia. According to [33,63], the supply of water from non-renewable groundwater (GW-NR) was 3662 MCMs in 1980, which increased triple-fold to 10,421 MCMs in 2010. The supply of water increased rapidly after 1980 and quadrupled in 1990 (13,824 MCM), and after that the supply was almost constant until 1990 (Figure 2). Due to the reduction of water use in the agriculture sector, the supply started to decline after 2000 and dropped from 14,071 MCMs in 2000 to 10,421 MCMs in 2010. It was further rationalized to 9723 MCM in 2020. The average share of total water supply from GW-NR was 37, 67, 66, 58, and 61% in 1980, 1990, 2000, 2010, and 2020, respectively [6,46,47,63]. Subsequently, there is an absolute absence of river and natural lake systems in Saudi Arabia. Precipitation is the primary source of surface water. Some part of precipitation is directly collected into dams and reservoirs while the remaining flows as runoff. The practice of water storage through dams and reservoirs is concentrated along both sides of the Asir and Hijaz mountains in the western part of Saudi Arabia.
Moreover, most of the recharge dams are built in the central and eastern parts of the country. According to [56,59,69,70], there were 302 dams in 2009 for various purposes, including 210 storage dams, 65 for flood control, 25 dams for drinking, and two dams for irrigation purposes. Further, this number was increased to 550 with a storage capacity of 2.4 BCMs in 2021, which also includes several multi-purpose dams. Surface and renewable water collectively contribute almost 6000 MCMs of water to the supply. This includes recharge and runoff of widyan flows. The share of surface and renewable water from the total supply was 60, 29, 28, 34, and 14% in 1980, 1990, 2000, 2010, and 2020, respectively (Figure 2).
This declining trend is coupled with the increased contribution of desalination and wastewater reuse. It is important to note that the quantity of water supply remained constant from 1980 to 2010, while the average share decreased due to an increase in other water supply sources. Other important sources of water supply are desalinated water and treated wastewater. Desalinization plays a significant role in the domestic water supply in Saudi Arabia. There was a total of 33 desalinization plants functioning, of which 25 were situated along the Red Sea coast and 8 were towards the Persian Gulf. With a collective production capacity of 2275 MCMs, Saudi Arabia is the largest desalinated water producer in the world [58,71]. The supply of desalinated water was 200 MCMs in 1980, reached 1082 MCMs in 2010 (Figure 2), and further increased to 2275 MCMs in 2020. The average share of desalinated water was 2, 3, 5, 6, and 14% of the total supply in 1980, 1990, 2000, 2010, and 2020, respectively (Figure 2). However, the process of desalinization is economically costly but the contribution to the supply, as a prime source of domestic consumption, marks the great importance of this source. The Saline Water Conversion Corporation (SWCC) has registered a new Guinness World Record for the lowest energy consumption for a water desalination plant, with 2.27 kW/h per cubic meter of desalinated water. This achievement came by designing, building, and operating mobile plants that use eco-friendly reverse osmosis technology [72,73]. Additionally, preliminary data indicate that the total residential consumption of water stood at 3557 MCMs for the year 2021. The SWCC indicates that the total capacity of its water transport system exceeds 11 MCMs per day. The amount of water transported reached 2.44 BCMs in 2021, with private sector desalination plants contributing 710.8 MCMs. Further, the Makkah region was the largest consumer of desalinated water in 2021, with a share of 34.4% of total production, which was followed by Riyadh and the Eastern region with 26.4% and 19.4% respectively.
Moreover, the practice of water treatment started late compared to that of other countries. Ref. [74] reported that there were 35 major water treatment plants situated in various locations in Saudi Arabia. The capacity of water treatment from these plants was 1.55 MCMs per day and the actual treated amount was reported as 1.45 MCMs per day [57]. In 2020, wastewater use witnessed a significant increase with an amount of 1680 MCMs from 116 treatment plants across the country, now accounting for almost 11% of the total water supply in the Kingdom (Figure 2), which realized the importance of treated water very late due to religious constraints and customs (See: CLIS, 1978, Royal Decree No. 64 dated 28 September 1978) [75]. Therefore, the average share of treated water remained at about 1% of the total water supply from 1980 to 2000. This almost doubled by 2010, and further quadrupled in the ten years between 2010 and 2020 (Figure 2).

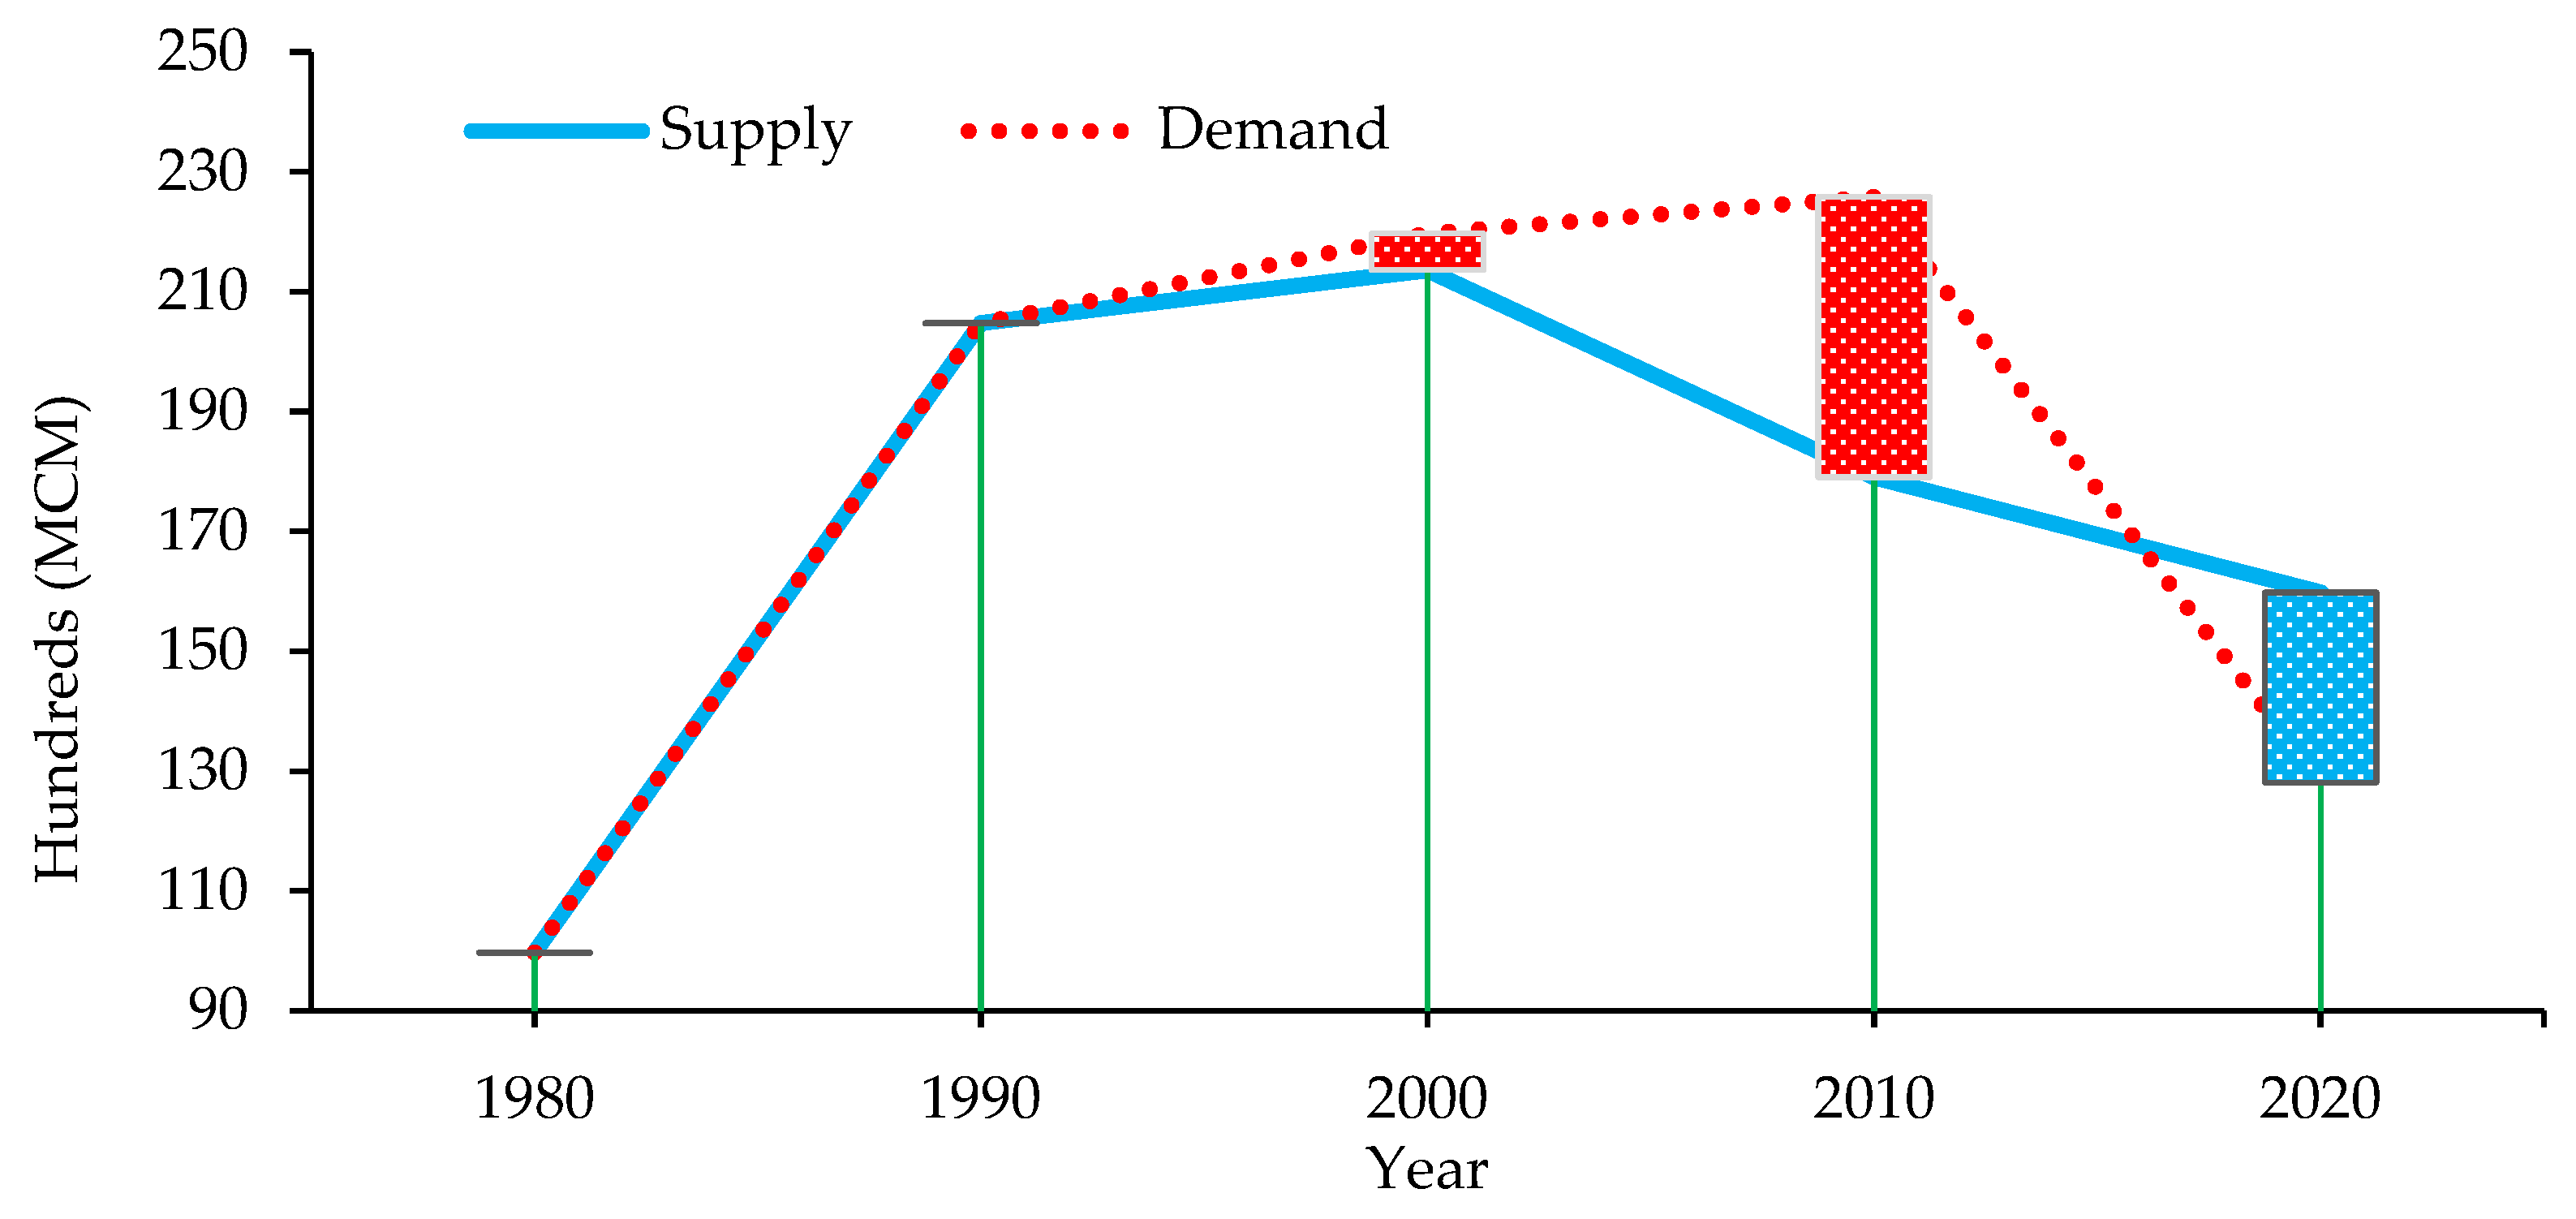
3.3. The Gap between Water Demand and Supply

The estimate shows that the water demand is increasing sharply and sources of are limited. Therefore, the gap between water demand and supply has widened significantly. It is evident from Figure 3 that demand was entirely fulfilled from 1980 to 1990. However, a gap between water demand and supply was created in 2000 with a deficit amount of 610 MCMs.
This shows that the available water resources were not sufficient to satisfy water demand in 2000 and onwards. Therefore, it is evident that the sources of water supply are limited in Saudi Arabia. Consequently, the government adopted a policy of ‘demand management’ rather than ‘supply management’ to achieve self-reliance and self-sustenance. Further, the gap between demand and supply reached its maximum in 2010, which marked a deficiency of almost 4231 MCMs. This amount is equal to the total domestic supply of 2000 and 2010. However, the water balance became positive after 2010 with a surplus of about 3170 MCCs in 2020 (Figure 1). This is due to a significant shift in policy regime and the development of non-conventional water resources [36]. The total demand for water under various uses was 6328, 9972, 20,474, 21,971, 22,134, and 12,809 MCMs in the years 1970, 1980, 1990, 2000, 2010, and 2020, respectively (Figure 1). Simultaneously, the supply, including all sources, was 9972, 20,474, 21,361, 17,903, and 15,979 MCMs in 1980, 1990, 2000, 2010, and 2020, respectively (Figure 2). Therefore, the gap between supply and demand was positive, and it could be said that the expected demand for freshwater resources could also be managed efficiently in the near future. The government is reducing subsidies in the agriculture sector to manage the gap between water demand and supply, as this is the major water-consuming sector. The total decline in the agriculture sector was 450 MCMs during 2000–2010, while an increase of 163 MCM was recorded in total water demand during the same period. In 2020, agricultural water demand further declined by more than half that of the previous decade, an amount of 11,221 MCMs.

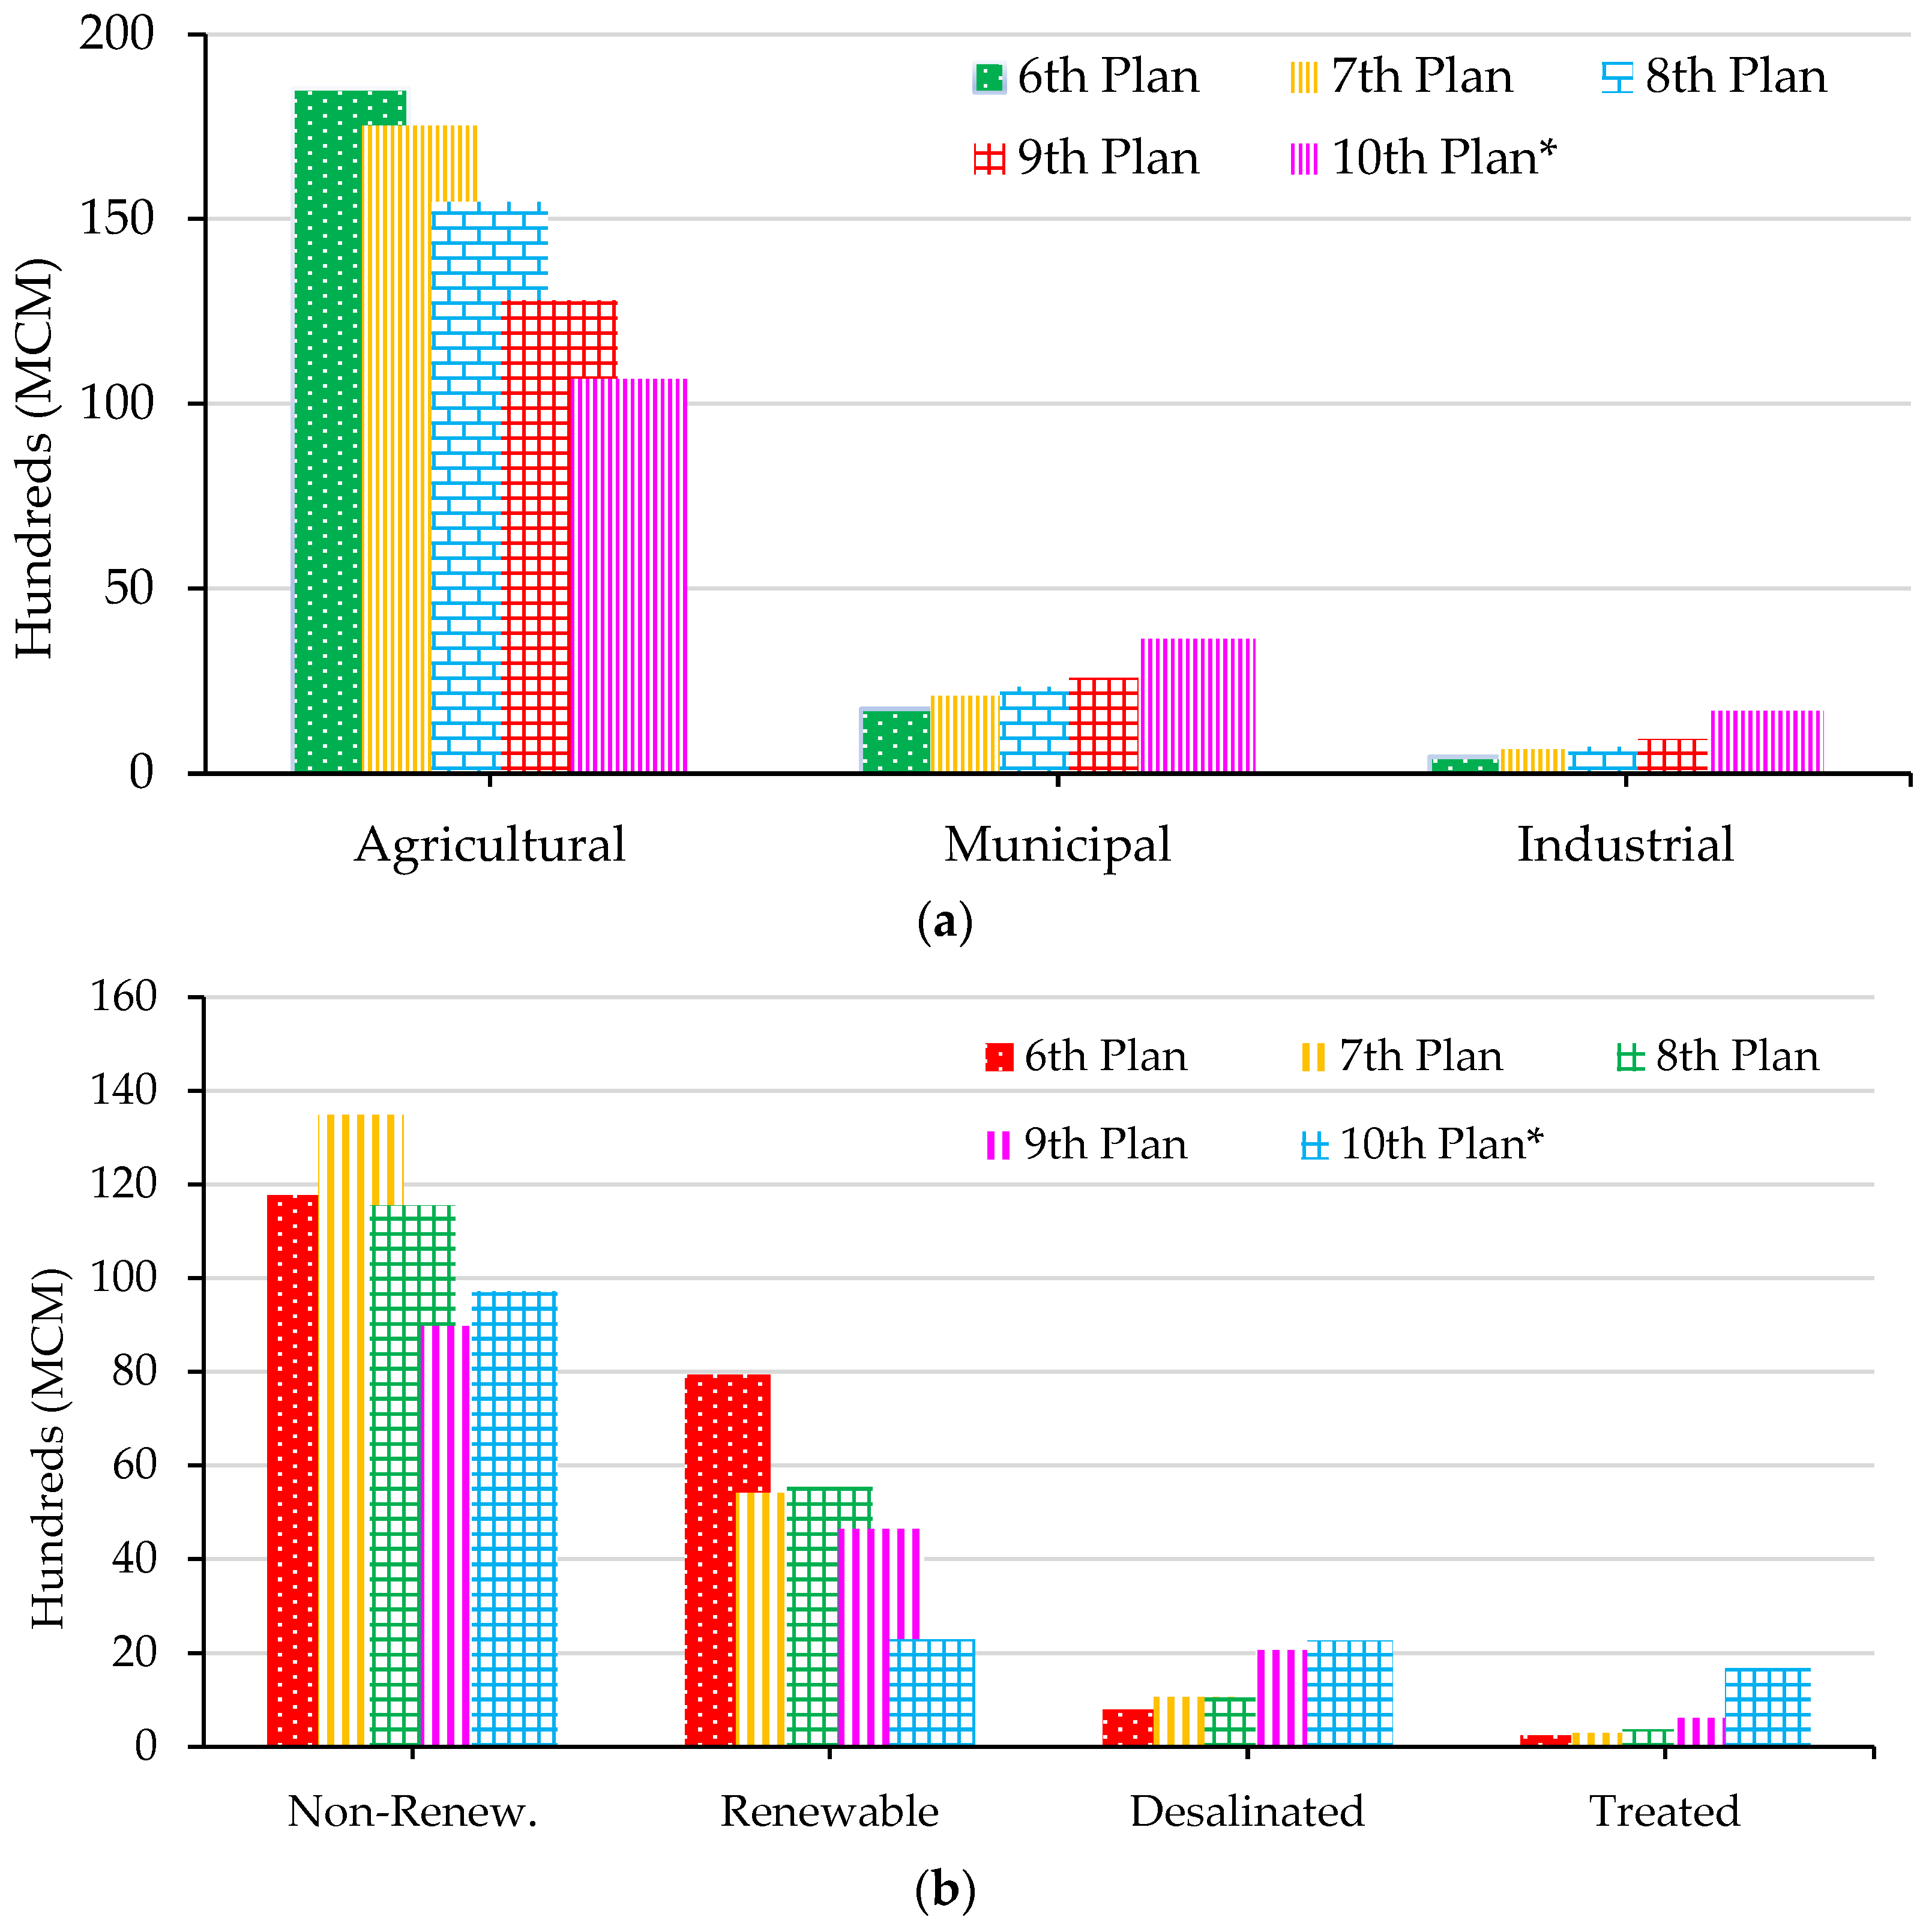
3.4. Water Consumption Assessment Based on Five-Years Development Plan

The introduction of a five-year development plan in Saudi Arabia was the first step toward the comprehensive development of all economic sectors. The first agency for planning was established on the recommendation of the International Monetary Fund (IMF) in 1958 [63]. The responsibility of planning was assigned to the Central Planning Organization (CSO) in 1965, later remaining as the Ministry of Planning in 1975 [76]. It drafted its first complete five-year plan (1970–1975) in the late 1960s that was effected on 2 September 1970 [77]. This plan also proposed measures relating to water supply and demand, including a consumption policy. Planning included all the required sectors, i.e., municipal, industrial, and agriculture. According to the sixth five-year plan (1994–1999), the estimated consumption for municipal, industrial, and agriculture sectors was 1750, 450, and 18,540 MCM respectively (Table 1). Supply came from non-renewable (56.75%), renewable (38.29%) desalinated water (3.81%), and treated water (1.16%) in the same plan.
In the 7th development plan (1999–2004), consumption in the domestic and industrial water sector increased, while it slightly declined in the agriculture sector. Total consumption was 20,270 MCMs, and of that 2100 MCMs was consumed by the municipal, 640 MCMs by the industrial, and the remaining 17,530 MCMs by the agricultural sector (Figure 4a and Table 1).
This supply was met at 66.75, 26.95, 5.28, and 1.48 MCMs by non-renewable, renewable, desalinated, and treated water, respectively (Figure 4b and Table 1).
The consumption pattern is almost similar to the previous plan in the subsequent eighth development plan (2004–2009). Moreover, domestic consumption increased by two percentage points of the prior plan outlay and reduced in agriculture by almost three percentage points in the same plan. The non-renewable source of water was the highest contributor (62.4%) to the total water supply followed by renewables (29.94%), desalinated (5.66%), and treated water (1.98%) in the Eighth five-year plan. Due to the accumulated effect of the efforts and measures taken in the last plan, water consumption in the Ninth development plan (2009–2014) declined significantly. Total water demand had fallen at an average annual rate of 2.5%, from 18.5 billion cubic meters (BCMs) in 2009 to 16.3 BCMs in 2014 (Table 1). This is due to the demand rationalization in agricultural purposes at an average annual rate of 3.7%, reduced from 15.5 BCMs to 12.8 BCMs. In contrast, water demand for industrial usage increased at an average annual rate of 5.5%, from 713 MCMs to 930 MCMs, due to a rise in the number of factories, and operations in the new industrial cities, in addition to other cities. However, municipal use rose at an average annual rate of 2.1%, from 2.3 BCMs to 2.6 BCMs. It is remarkable to note that the rate of consumption for municipal purposes closely matched expected population growth in the next decade. Moreover, the supply from non-renewable sources declined significantly. On the other hand, the share of water supply from desalinated and treated water sources increases almost two-fold compared to the previous plan. In the 10th five-year development plan (2015–2019), total water consumption decreased incessantly to 1.5 BCMs, with an average 2% decrease from the previous plan. Similarly, the demand in the agriculture sector also dropped by 17 percent from the previous plan. However, the industrial sector has witnessed a significant increase in percentage terms of about 80% as compared to the 9th five-year development plan. Demand in the domestic sector also rose to 3629 from 2583 MCMs as compared to the previous plan outlay. Further, the supply of water resources has also improved considerably to meet total demand during this five-year plan. It is noted that the reliance on non-renewable groundwater resources remains the primary source of water consumption at more than 60%, followed by surface and desalinated water with a 14% share for each. The share of treated wastewater, however, increased significantly by 10%, compared to 3.7% in the previous plan.

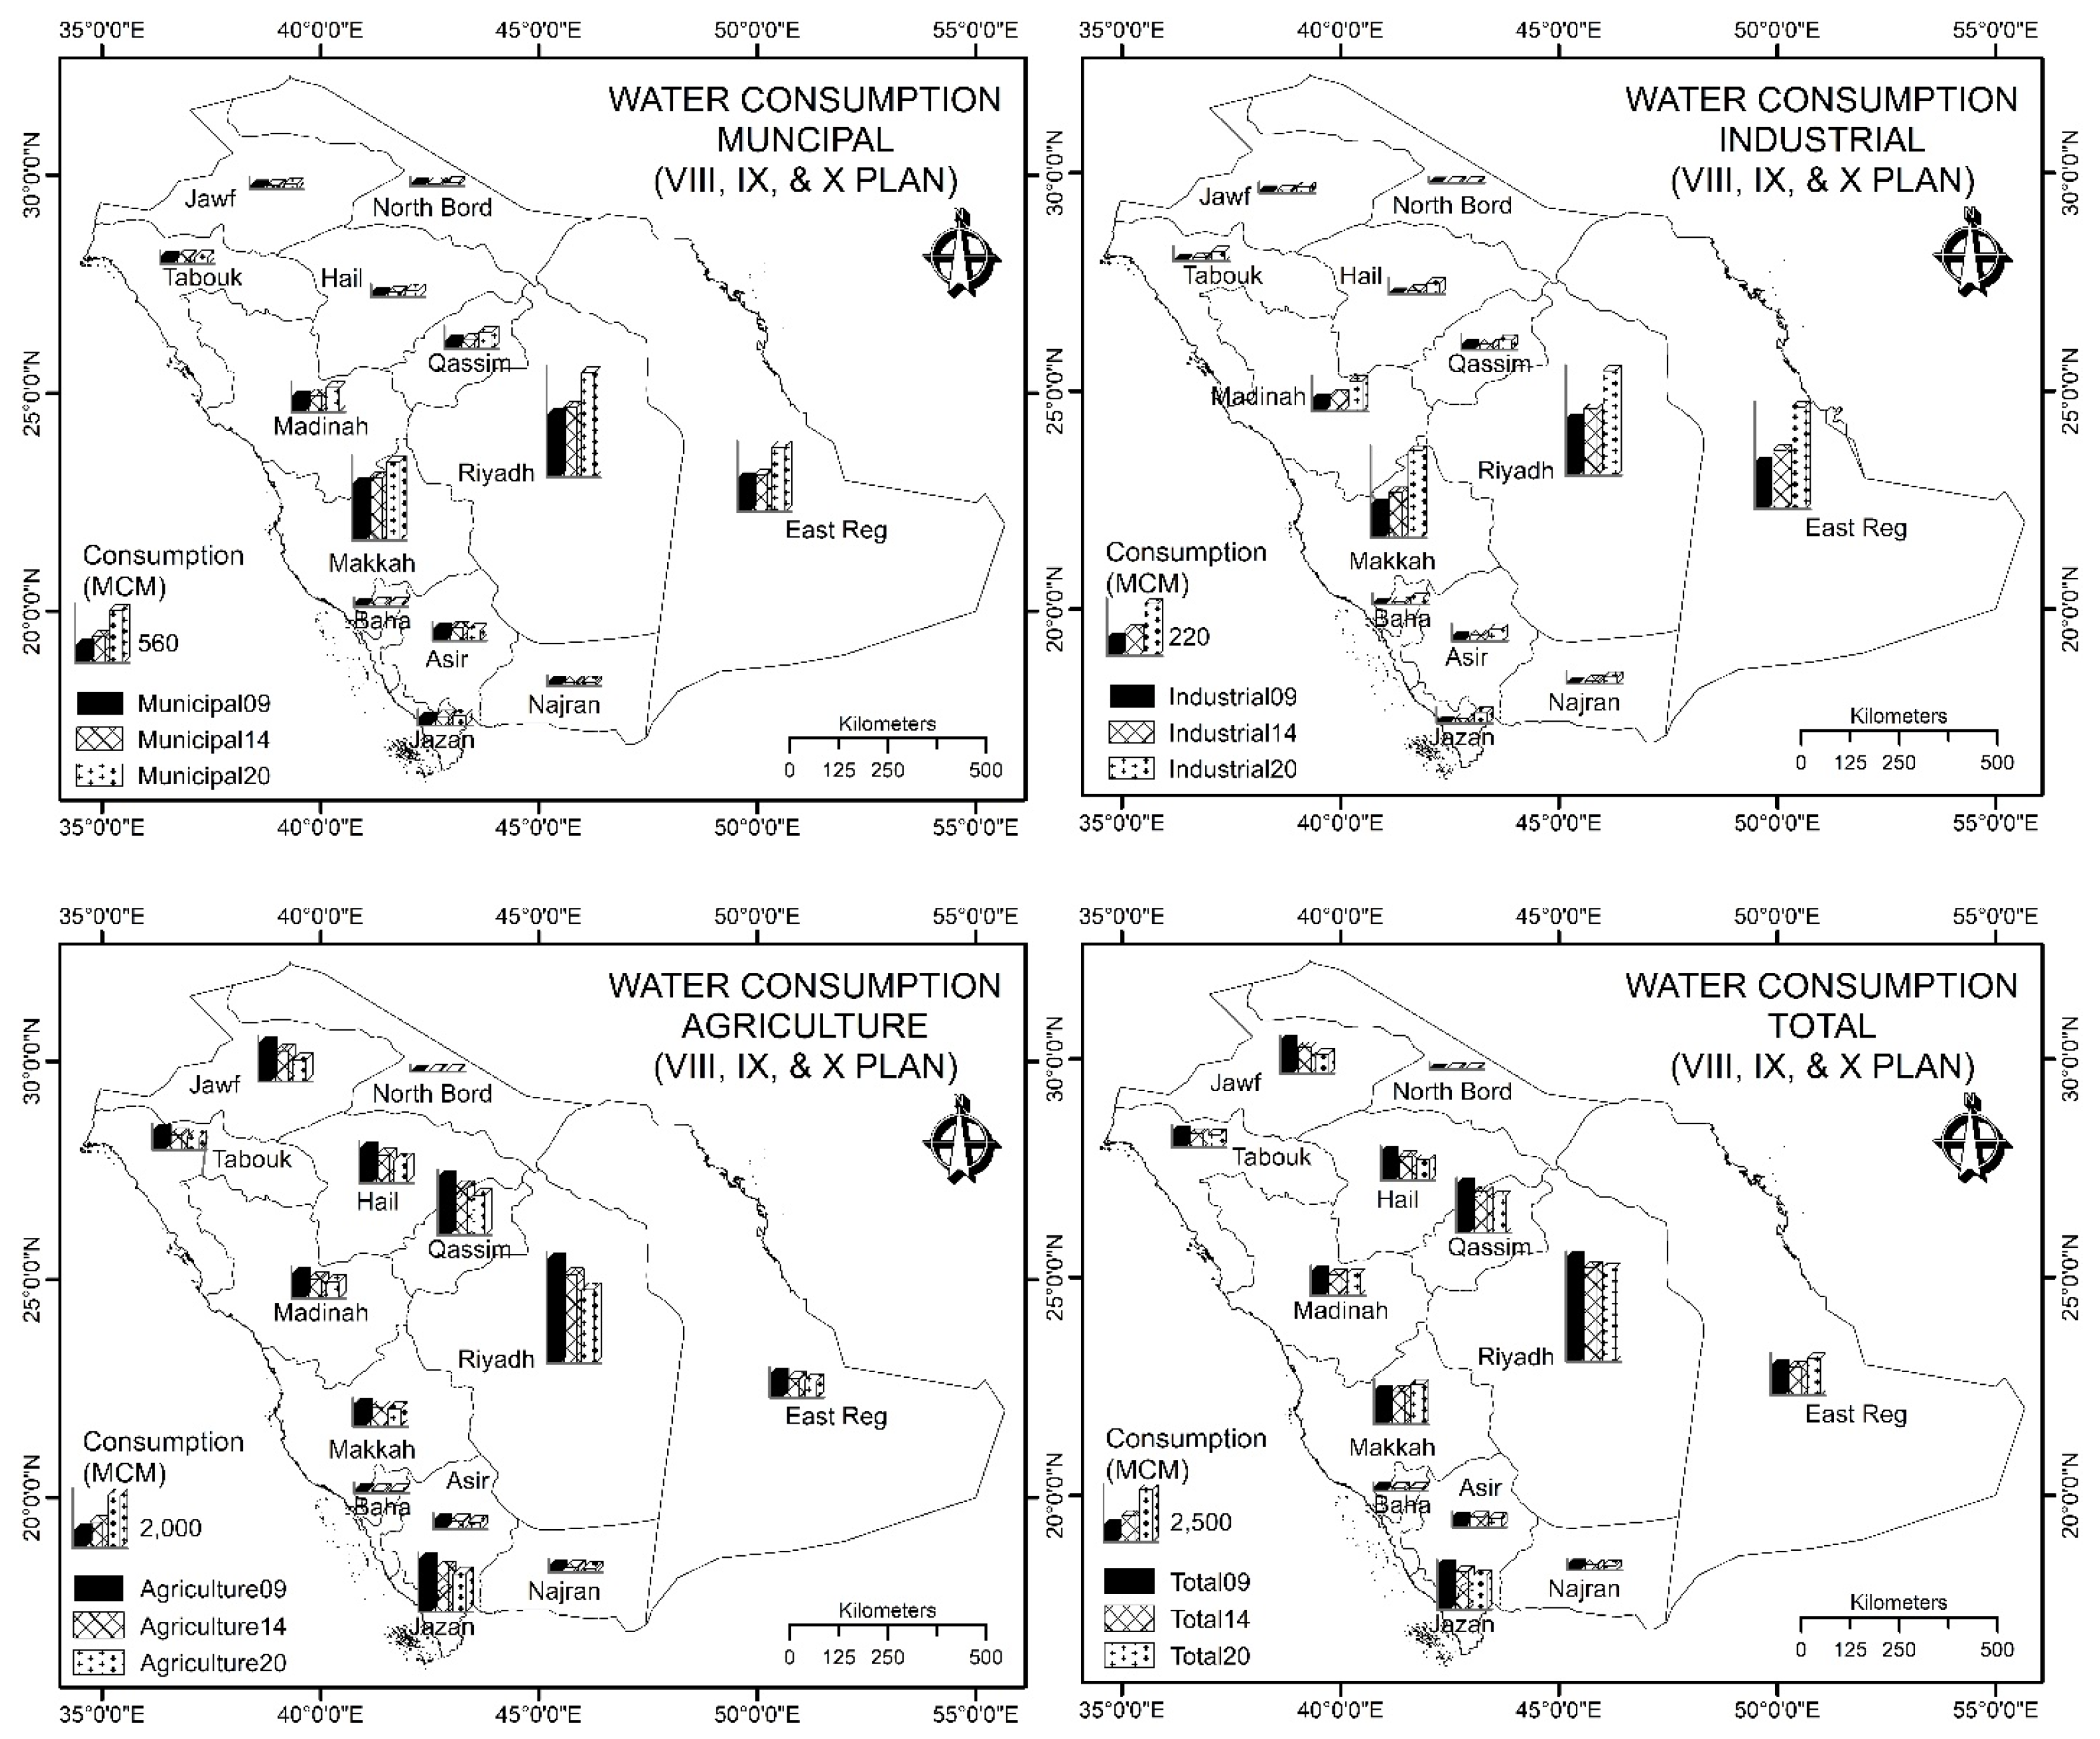
3.5. Regional Growth of Water Consumption

Data from the 10th five-year plan indicate that overall consumption declined by 1.5 percent per annum since the 8th plan, while the highest decline was reported in Al-Jawf Province by an amount of 5% annually, followed by the Hail (3.2%) and Najran region (2.9%). Out of 13 provinces, only three regions were estimated to demonstrate an increase in total water consumption. The highest increase was reported in the Northern Border with an amount of 4.9% per annum followed by the Eastern Region (2%), and Makkah (1.7%). The remaining regions have witnessed an average range of 1 to 2.5% decline per annum in their total water consumption (Table 2).
It is expected that the trend of decline may persist in the upcoming two decades. Moreover, it is striking to note that agriculture, the largest water-consuming sector with an amount of 67% of total water consumption, has declined at a faster rate by 3.6% annually. The highest decline in agriculture water consumption was reported in the Al-Jawf region at about 5.7% followed by the Najran, Al-Baha, and Medina regions, with more than 4% annually. Overall, every region except the Northern Border has observed an average range of more than 3 to 4% decline per annum in agricultural water consumption. The domestic sector, however, grew at a 4.5% rate annually along with population and the development of new residential units in the Kingdom of Saudi Arabia. The highest growth in domestic water consumption was reported in the Al-Qassim region at about 7.7% followed by the Eastern, Riyadh, Medina, Northern, and Hail regions at 6.9, 5.2, 5.1, 4.7, and 4.5% per year, respectively. The remaining regions have reported a range of 1 to 3% per annum increase except the Asir region. However, industrial water consumption has grown at an alarming rate of about 8.6% per year, which is the highest growth among the sectors. The highest industrial water consumption was reported in the Hail region at about 21.5% followed by Jazan, Najran, Al-Baha, and Tabouk at an average growth range of 18% to 19% per annum. Following these, the Asir (11.8%), Makkah (9.8%), Al Jawf (9.6%), and Madinah (9.4%) regions have reported the highest growth in industrial water consumption. The remaining regions were observed to have a range of 7% to 8% annual growth rate, except for the Northern Border region (Figure 5).
In the ninth five-year development plan (2009–2014), the overall growth of total water consumption declines at a rate of 2.5% per annum in Saudi Arabia (Table 2). This is due to a significant decline in agricultural water use. At the provincial level, the rate of consumption has also decreased except in Najran and Asir, where it has increased due to the recent expansion of agricultural activities in Najran and the setup of industrial units in Asir. The highest decline in water consumption was observed in Jauf and Tabouk provinces at an annual rate of 4.3% and 4.1%, respectively, caused by a considerable decline in agricultural water use (Table 2). Consumption in Qassim (−3.6%), Hail (−3.6%), Jazan (−3.0%), and Medina (−2.8%) have also decreased significantly as compared to the total rate of decline. Moreover, consumption in Najran, Riyadh, Eastern Region, and Baha has decreased, but only slightly when compared to the national rate of decline. However, consumption in Makkah and Asir provinces saw no change in total water consumption from the previous period, which was coupled with a decline in agricultural consumption and a commendable increase in municipal and industrial water use. Nonetheless, the scenario of decline has changed, while considering the sector-wise growth rate. It is increasing rapidly in the industrial sector, at an annual rate of 5.5%, and the municipal sector, at an annual rate of 2.1% (Table 2). In contrast, agricultural water consumption is declining at a rate of 3.7% per annum. Regarding industrial water consumption, the highest growth rate was observed in the Hail (20.8%) and Jazan (20.1%) provinces. A total of six provinces, Najran, Baha, Tabouk, Asir, Madinah, and Makkah, were above the average annual growth rate in the Kingdom regarding industrial water consumption. Only four provinces, Eastern Province, Jawf, Riyadh, and Qassim, were below the average annual growth rate for Saudi Arabia, while Northern Province saw no change. Moreover, only Najran experienced a high annual growth rate (2.6%) in municipal water consumption, followed by Northern Border, Jazan, and Riyadh (2.4% each). A total of seven provinces were above the national average growth rate for municipal water consumption, while the remaining six provinces were below this average. The lowest annual growth rate for municipal water consumption was observed in Baha province (1.3%). On the other hand, the annual growth rate for agricultural water consumption was negative in all regions except for the Northern Border. This had a positive growth rate at an annual increase of 8% for agricultural water consumption, due to a commendable increase in cultivated area. The highest decline in agricultural water consumption was found in Tabouk (−5.1%) province followed by Jawf (−4.6%) and Madinah (−4.3%) provinces. There are a total of seven provinces, including Tabouk, Jawf, and Madinah, above the national average for decline (3.7%), while only five regions were below this average.

3.6. Projections of Future Water Demand by Sector

In setting goals and future planning, predictions of various aspects could be one of the most strategic steps in water resource management, to ensure water security, stability, and national sustainability. The figures for projection provide a wide range of actions and necessary policy recommendations for the integrated management of resources. The balance between water supply and consumption was ascertained in order to cope with various future expectations and challenges. Therefore, a systematic statistical assumption with two predicted scenarios for the period 2015–2029 has been adopted in the present study. It was assumed that there are three scenarios, i.e., SC–I with the current rate of growth, SC–II under controlled management, and SC–III with little or no management strategy. Both the SC–II and SC–III scenarios were predicted from the current pattern of change (SC–I) as given in the 9th development plan (Five Years Plan 2009–2014) of the Saudi government (Table 3).
In this regard, weight has been assigned statistically to all three water-consuming sectors, along with total water consumption for SC–II and SC–III scenarios. The highest weight ± 1% annual growth (i.e., positive growth for SC–III and negative growth for SC–II scenario) was given to the industrial sector, which is growing at a faster rate (i.e., 5.5% during 2009–2014).
The agricultural and domestic sectors have been assigned an equal weight of ±0.5% because of the decline in cultivated area and stabilization of population growth rate, respectively (Table 3). After the estimation of these projections, results are presented in Figure 6a–d for each sector along with total water consumption.
Thus, from the figures, it can be drawn that:
  • The highest growth in water consumption has to be in the industrial sector in the next 15 years.
  • The industrial sector needs particular attention regarding water management to meet the expected high demand for water consumption in the upcoming decades.
  • The municipal sector will have slow growth as compared to the industrial demand for water consumption.
  • The agricultural sector is showing an entirely different trend that will decline sharply and help to maintain a balance between total water supply and demand, holding as it does the largest share among all sectors.
  • It is anticipated that the total water demand, including all sectors, will decline and open opportunities to ensure sustainability for the Kingdom during 2015–2029.
  • The demand–supply curve will remain positive in upcoming decades for the Kingdom’s water resources.

4. Conclusions

Limited research work has been done so far on water resource management in Saudi Arabia. Naturally, the Kingdom of Saudi Arabia is very arid and two-thirds of the total area falls under sand and limestone-related topography. Only alluvial plains and a few widyan flourish and are able to sustain life, but both collectively contribute less than 2% to the total area of territory. Climatically, the country lies in the tropical and sub-tropical region, which is characterized by a high-pressure system along with dry winds. This is why precipitation is absent and the temperature remains high for the whole of the year. Therefore, there is a great imbalance between water availability from precipitation and the evapotranspiration rate. Saudi Arabia has a good amount of groundwater, which is the most significant source of water supply as a whole, apart from surface, desalinization, and treated wastewater. Groundwater contributes almost 61% of the total available (2272 BCM) water, while the recharge rate is negligible and contributes only 0.17% (3958 MCM) of total available water in Saudi Arabia. However, the widyan flow (2060 MCMs) could contribute an amount almost equal to one year of domestic water consumption, if managed efficiently. Therefore, a proper strategy should be incorporated to control the flow of runoff and maximize the recharge.
The demand for water has increased manifold due to rapid industrial development, population increase, and cultivation of food grains to achieve reliance and self-sufficiency. However, total water consumption is decreasing due to a substantial decline in agriculture, i.e., the biggest water-consuming sector, water usage. Sector-wise, consumption was still highest in the agricultural sector, followed by domestic and industrial. The projections for water consumption have also been made for the next consecutive three plans, i.e., 10th plan (2015–2019), 11th plan (2020–2024), and 12th plan (2025–2029). The analysis shows that water consumption may also decline significantly in the future if the present rate of decline continues. There are three predicted scenarios for water consumption based on certain assumptions. The analysis of scenario I, if the current rate of decrease is assumed, provides a decrease in consumption of 14.36, 12.66, and 11.15 BCMs for the 10th, 11th, and 12th plans, respectively. Moreover, the domestic and industrial sectors will be bigger water-consuming sectors in the future. In the same way, scenarios II and III represent decline in total water consumption along with that of agricultural usage, while domestic and industrial water usage would be increasing. Regarding provincial water consumption, Riyadh (4.45 BCMs) is the biggest water consumer followed by Makkah (1.90 BCMs), Eastern region (1.77 BCMs), Qassim (1.76 BCMs), Jazan (1.64 BCMs), Jawf (1.25 BCMs), Madinah (1.03 BCMs), and Hail (1.01 BCMs) regions in the 10th five-year development plan (2014–2019). Less water-consuming regions include the Northern border (0.05 BCMs), Baha (0.14 BCMs), Najran (0.22 BCMs), and Asir (0.43 BCMs) in the same period. At the policy and management level, the Kingdom of Saudi Arabia has shown great achievements regarding the decline in total water consumption. The government has worked on both levels of management, i.e., both supply and demand side of water resource management. However, it has a phase-wise development pattern, as compared to the integrated water resources management approach, where both approaches have to work simultaneously. Therefore, the government adopted a variable/object-oriented approach to sustaining its water resources over a long period time. As per the trend analysis, it has been proven that the future of Saudi Arabia is sustainable, regarding water resource management. The measures, based on priority function, also include the phase-wise development of a water resources infrastructure, plan-based initiatives, education and awareness, water conservation, and institutional and organizational development in Saudi Arabia.

5. Recommendations

Although, Saudi Arabia has improved greatly in water resource management at the levels of technical, institutional, organizational, governance, and water conservation, the gap between water demand and supply is not able to be met appropriately; therefore, the search for new alternatives is made possible as follows:
  • Several studies [78,79,80,81] conducted on the feasibility of fog water collection in some arid areas have shown good potential in the development of non-conventional water resources. The coastal region of Saudi Arabia has good potential in this regard, as fog formation is a widespread phenomenon in many parts of the tropical, temperate, and arid regions of the world.
  • The shift of the agricultural sector to a water surplus region, or bilateral ties with foreign nations, could ensure water saving. However, this could increase the level of dependency on the host nation.
  • Water could be saved through the cultivation of less water-consuming crops, rather than investing in high water-consuming crops, like wheat and rice. The proper balance between the import and export of food commodities can minimize the gap in water resources.
  • Weather modification, leakage prevention during water distribution, efficiency improvement, and several other small measures could contribute to water saving in Saudi Arabia.

Author Contributions

Conceptualization, M.S.; methodology, M.S. and T.K.F.; software, M.S.; validation, T.K.F., W.A., M.S. and M.N.K.; formal analysis, M.S. and W.A.; investigation, T.K.F. and M.S.; resources, M.S., A.X.R. and M.N.K.; data curation, M.S.; writing—original draft preparation, M.S.; writing—review and editing, T.K.F., A.X.R. and M.N.K.; visualization, A.X.R. and M.S.; supervision, A.X.R. and M.S.; project administration, T.K.F. and M.S.; funding acquisition, T.K.F. All authors have read and agreed to the published version of the manuscript.

Funding

This research was funded by the Researchers Supporting Project at KING SAUD UNIVERSITY, grant number RSP2024R487 and The APC was funded by RSP2024R487.

Institutional Review Board Statement

Not applicable.

Informed Consent Statement

Not applicable.

Data Availability Statement

Data are contained within the article.

Acknowledgments

We extend our appreciation to the Researchers Supporting Project at King Suad University, Riyadh, The Kingdom of Saudi Arabia, for funding this research project, (Fund no. RSP2024R487).

Conflicts of Interest

The authors declare no conflicts of interest.

References

  1. Thornethwaite, C.W. An Approach towards a Rational Classification of Climate. Geogr. Rev. 1948, 38, 55–94. [Google Scholar] [CrossRef]
  2. WWAP. Water in a Changing World: World Water Development Report 3; UNESCO/Earthscan: Paris, France, 2009. [Google Scholar]
  3. Almazroui, M. Calibration of TRMM rainfall climatology over Saudi Arabia during 1998–2009; Atmospheric Research Online; Elsevier: Amsterdam, The Netherlands, 2010; pp. 1–15. [Google Scholar]
  4. Almazroui, M.; Abid, M.A.; Athar, H.; Islam, M.N.; Ehsan, M.A. Interannual variability of rainfall over the Arabian Peninsula using the IPCC AR4 Global Climate Models. Int. J. Climatol. 2012, 33, 2328–2340. [Google Scholar] [CrossRef]
  5. WWF. Water Scarcity: Threat. 24 August 2013. Retrieved from World Wild Life. Available online: http://worldwildlife.org/threat/water-scarcity.htm (accessed on 12 October 2013).
  6. Abderrahman, W.A. Groundwater Resources Management in Saudi Arabia, Special Presentation at Water Conservation Workshop; Khobar, Saudi Arabia, 2006; Available online: http://sawea.org/pdf/FutureOfSaudiArabianWaterAquifers.pdf (accessed on 7 October 2023).
  7. Falkenmark, M. Meeting Water Requirement of an Expanding World Population. Philos. Trans. R. Soc. Lond. 1997, 352, 929–936. [Google Scholar] [CrossRef]
  8. Cruz, R.V.; Harasawa, H.; Lal, M.; Wu, S.; Anokhin, Y.; Punsalmaa, B.; Honda, Y.; Jafari, M.; Li, C.; Ninh, N.H. Asia: Climate Change—2007: Impacts, Adaptation, and Vulnerability. Contribution of Working Group II to the Fourth Assessment Report of the Intergovernmental Penal on Climate Change; Parry, M.L., Canziani, O.F., van der Linden, J.P., Hanson, C.E., Eds.; Cambridge University Press: Cambridge, UK, 2007; pp. 469–506. [Google Scholar]
  9. Petterssen, S. Introduction to Meteorology; McGraw Hill Book Co. Inc.: New York, NY, USA, 1941. [Google Scholar]
  10. Meige, P. World Distribution of Arid and Semi-Arid Homoclimates. In UNESCO, Reviews of Research on Arid Zone Hydrology; UNESCO Press: Paris, France, 1953; pp. 203–210. [Google Scholar]
  11. Edgell, H.S. Arabian Deserts: Nature, Origin and Evolution; Springer: Amsterdam, The Netherlands, 2006. [Google Scholar]
  12. Ahrens, C.D. Meteorology Today: An Introduction to Weather, Climate, and the Environment, 9th ed.; Cengage Learning: Boston, MA, USA, 2008. [Google Scholar]
  13. Vincent, P. Saudi Arabia: An Environmental Overview; Taylor & Francis Group: London, UK, 2008. [Google Scholar]
  14. Almazroui, M.; Ramzah, D.; Islam, N.; Jones, P.D. Principal components-based regionalization of the Saudi Arabian climate. Int. J. Climatol. 2014, 35, 4139–4158. [Google Scholar] [CrossRef]
  15. Suhail, M. Introduction to the General Geography and Water Resources of Saudi Arabia; Lambert Academic Publishing: Saarland, Germany, 2016. [Google Scholar]
  16. MAW. General Soil Map of the Kingdom of Saudi Arabia (Maps Catalog); Ministry of Agriculture and Water, Land Management Department: Riyadh, Saudi Arabia, 1985; p. 66.
  17. FAO. Digital Soil Map of the World. Harmonized Soil Information. Version 3.6. Prod. Food and Agriculture Organization: Rome, 2007. Available online: http://www.fao.org/geonetwork/srv/en/metadata.show?id=14116 (accessed on 7 October 2023).
  18. Ouda, O.K. Water demand versus supply in Saudi Arabia: Current and future challenges. Int. J. Water Resour. Dev. 2014, 30, 335–344. [Google Scholar] [CrossRef]
  19. Elhadj, E. Camels Don’t Fly, Deserts Don’t Bloom: An Assessment of Saudi Arabia’s Experiment in Desert Agriculture. Occasional Paper No. 48, Water Issues Study Group, School of Oriental and African Studies (SOAS)/King’s College London. 2004, pp. 1–38. Available online: https://www.soas.ac.uk/water/publications/papers/file38391.pdf (accessed on 7 October 2023).
  20. SAMA. Saudi Arabian Monetary Agency (45th Annual Report); Department of Statistics: Riyadh, Saudi Arabia, 2010. [Google Scholar]
  21. MOP. Tenth Development Plan 2015–2019; Ministry of Planning: Riyadh, Saudi Arabia, 2015. [Google Scholar]
  22. Alotaibi, B.A.; Baig, M.B.; Najim, M.M.M.; Shah, A.A.; Alamri, Y.A. Water Scarcity Management to Ensure Food Scarcity through Sustainable Water Resources Management in Saudi Arabia. Sustainability 2023, 15, 10648. [Google Scholar] [CrossRef]
  23. El-Rawy, M.; Fathi, H.; Zijl, W.; Alshehri, F.; Almadani, S.; Zaidi, F.K.; Aldawsri, M.; Gabr, M.E. Potential Effects of Climate Change on Agricultural Water Resources in Riyadh Region, Saudi Arabia. Sustainability 2023, 15, 9513. [Google Scholar] [CrossRef]
  24. Haq, M.A.; Khan, M.Y.A. Crop Water Requirements with Changing Climate in an Arid Region of Saudi Arabia. Sustainability 2022, 14, 13554. [Google Scholar] [CrossRef]
  25. Mohorjy, A.M. Water Resources Management in Saudi Arabia and Water Reuse. Water Int. 1988, 13, 161–171. [Google Scholar] [CrossRef]
  26. deJong, R.L.; Al-Layla, R.I.; Selen, W.J. Alternative water management scenarios for Saudi Arabia. Int. J. Water Resour. Dev. 1989, 5, 56–62. [Google Scholar] [CrossRef]
  27. Abu-Rizaiza, O.S.; Allam, M.N. Water Requirements versus Water Availability in Saudi Arabia. J. Water Resour. Plan. Manag. 1989, 115, 64–74. [Google Scholar] [CrossRef]
  28. Al-Ibrahim, A.A. Water Use in Saudi Arabia: Problems and Policy Implications. J. Water Resour. Plan. Manag. 1990, 116, 375–388. [Google Scholar] [CrossRef]
  29. Al-Ibrahim, A.A. Excessive Use of Groundwater Resources in Saudi Arabia: Impacts and Policy Options. Ambio 1991, 20, 34–37. [Google Scholar]
  30. Dabbagh, A.E.; Abderrahman, W.A. Technology Transfer and Development for the Management of Water Resources in Saudi Arabia: A Case Study. Water Int. 1992, 17, 193–200. [Google Scholar] [CrossRef]
  31. Mohorjy, A.M.; Grigg, N.S. Water-Resources Management System for Saudi Arabia. J. Water Resour. Plan. Manag. 1995, 121, 205–215. [Google Scholar] [CrossRef]
  32. Abderrahman, W.A. Water demand management and Islamic water management principles: A case study. Int. J. Water Resour. Dev. 2000, 16, 465–473. [Google Scholar] [CrossRef]
  33. Abderrahman, W.A. Groundwater Management for Sustainable Development of Urban and Rural Areas in Extremely Arid Regions: A Case Study. Int. J. Water Resour. Dev. 2005, 21, 403–412. [Google Scholar] [CrossRef]
  34. Hussain, G.; Alquwaizany, A.; Al-Zarah, A. Guidelines for Irrigation Water Quality and Water Resource Management in the Kingdom of Saudi Arabia: An Overview. J. Appl. Sci. 2010, 10, 79–96. [Google Scholar] [CrossRef]
  35. Zaharani, K.H.; Baig, M.B. Water in the Kingdom of Saudi Arabia: Sustainable Management Options. J. Anim. Plant Sci. 2011, 21, 601–604. [Google Scholar]
  36. Suhail, M. Water Resource Management in Saudi Arabia. Ph.D. Thesis, Aligarh Muslim University, Aligarh, India, 2016, unpublished. [Google Scholar] [CrossRef]
  37. Ghanim, A.A. Water Resources Crisis in Saudi Arabia, Challenges and Possible Management Options: An Analytic Review. World Academy of Sciences, Engineering and Technology. Int. J. Environ. Ecol. Eng. 2019, 13, 51–56. [Google Scholar] [CrossRef]
  38. Baig, M.B.; Alotibi, Y.; Straquadine, G.S.; Alataway, A. Water Resources in the Kingdom of Saudi Arabia: Challenges and Strategies for Improvement. In Water Policies in MENA Countries; Global Issues in Water Policy; Zekri, S., Ed.; Springer: Cham, Switzerland, 2020; p. 23. [Google Scholar] [CrossRef]
  39. Mir, M.A.; Ashraf, M.W. The challenges and potential strategies of Saudi Arabia’s water Resources: A review in Analytical way. Environ. Nanotechnol. Monit. Manag. 2023, 20, 100855. [Google Scholar] [CrossRef]
  40. Odnoletkova, N.; Patzek, T.W. Water resources in Saudi Arabia: Trends in rainfall, water consumption, and analysis of agricultural water footprint. NPJ Sustain. Agric. 2023, 1, 7. [Google Scholar] [CrossRef]
  41. MOP. Eight Development Plan 2005–2009; Ministry of Planning: Riyadh, Saudi Arabia, 2005.
  42. MOP. Seventh Development Plan 2000–2004; Ministry of Planning: Riyadh, Saudi Arabia, 2000.
  43. MOP. Ninth Development Plan 2010–2014; Ministry of Planning: Riyadh, Saudi Arabia, 2010.
  44. MEWA. Statistical Year Book–2019. Ministry of Environment, Water and Agriculture, Kingdom of Saudi Arabia. 2019. Available online: https://www.mewa.gov.sa/ar/InformationCenter/Researchs/Reports/Pages/default.aspx (accessed on 8 February 2024). (In Arabic)
  45. MEWA. Statistical Year Book–2020. Ministry of Environment, Water and Agriculture, Kingdom of Saudi Arabia. 2020. Available online: https://www.mewa.gov.sa/ar/InformationCenter/Researchs/Reports/Pages/default.aspx (accessed on 8 February 2024). (In Arabic)
  46. MEWA. Statistical Year Book–2021. Ministry of Environment, Water and Agriculture, Kingdom of Saudi Arabia. 2021. Available online: https://www.mewa.gov.sa/ar/InformationCenter/Researchs/Reports/Pages/default.aspx (accessed on 8 February 2024). (In Arabic)
  47. MEWA. Statistical Year Book–2022. Ministry of Environment, Water and Agriculture, Kingdom of Saudi Arabia. 2022. Available online: https://www.mewa.gov.sa/ar/InformationCenter/Researchs/Reports/Pages/default.aspx (accessed on 8 February 2024). (In Arabic)
  48. GASTAT. The General Authority for Statistics (GASTAT). The Kingdom of Saudi Arabia. 2024. Available online: https://www.stats.gov.sa/en (accessed on 8 February 2024).
  49. SSYB. Saudi Statistical Year Book; Central Department of Statistics and Information: Riyadh, Saudi Arabia, 2014. [Google Scholar]
  50. SSYB. Saudi Statistical Year Book; Central Department of Statistics and Information: Riyadh, Saudi Arabia, 2015. [Google Scholar]
  51. SSYB. Saudi Statistical Year Book; Central Department of Statistics and Information: Riyadh, Saudi Arabia, 2016. [Google Scholar]
  52. SSYB. Saudi Statistical Year Book; Central Department of Statistics and Information: Riyadh, Saudi Arabia, 2017. [Google Scholar]
  53. SSYB. Saudi Statistical Year Book; Central Department of Statistics and Information: Riyadh, Saudi Arabia, 2018. [Google Scholar]
  54. SSYB. Saudi Statistical Year Book; Central Department of Statistics and Information: Riyadh, Saudi Arabia, 2019. [Google Scholar]
  55. SSYB. Saudi Statistical Year Book; Central Department of Statistics and Information: Riyadh, Saudi Arabia, 2020. [Google Scholar]
  56. MOWE. Annual Report 2009; Ministry of Water and Electricity: Riyadh, Saudi Arabia, 2009.
  57. SAMA. Saudi Arabian Monetary Agency (50th Annual Report); Department of Statistics: Riyadh, Saudi Arabia, 2015. [Google Scholar]
  58. SAMA. Saudi Arabian Monetary Agency (55th Annual Report); Department of Statistics: Riyadh, Saudi Arabia, 2020. [Google Scholar]
  59. SAMA. Saudi Arabian Monetary Agency (49th Annual Report); Department of Statistics: Riyadh, Saudi Arabia, 2014. [Google Scholar]
  60. MOP. Sixth Development Plan 1995–1999; Ministry of Planning: Riyadh, Saudi Arabia, 1995.
  61. SAMA. Saudi Arabian Monetary Agency (46th Annual Report); Department of Statistics: Riyadh, Saudi Arabia, 2011. [Google Scholar]
  62. SAMA. Saudi Arabian Monetary Agency (54th Annual Report); Department of Statistics: Riyadh, Saudi Arabia, 2019. [Google Scholar]
  63. MOWE. Supporting Documents for King Hassan II Great Water Prize. Kingdom of Saudi Arabia. 2012. Available online: http://www.worldwatercouncil.org/fileadmin/world_water_council/documents_old/Prizes/Hassan_II/Candidates_2011/16.Ministry_SA.pdf (accessed on 7 October 2023).
  64. USSaudi. Saudi Arabia’s Water Sector. US-Saudi Business Council–Economic Brief. February 2022. Available online: https://ussaudi.org/wp-content/uploads/2022/02/Water-2022-Economic-Brief.pdf (accessed on 8 February 2024).
  65. MOWE. Annual Report 2022; Ministry of Water and Electricity: Riyadh, Saudi Arabia, 2022.
  66. SSYB. Saudi Statistical Year Book; Central Department of Statistics and Information: Riyadh, Saudi Arabia, 1996. [Google Scholar]
  67. SAMA. Saudi Arabian Monetary Agency (56th Annual Report); Department of Statistics: Riyadh, Saudi Arabia, 2021. [Google Scholar]
  68. Saudi, G. Over 2.8 m Indians Are Now in Saudi Arabia. Saudi Gazette (Eng. Daily). 5 November 2013. Available online: http://www.saudigazette.com.sa/index.cfm?method=home.regcon&contentid=20131106185891 (accessed on 12 April 2014).
  69. MOWE. Annual Report 2011; Ministry of Water and Electricity: Riyadh, Saudi Arabia, 2011.
  70. Aquastat. Geo-Referenced Database of Dams in the Middle East; Food and Agriculture Organization (FAO): Rome, Italy, 2011. [Google Scholar]
  71. SWCC. Annual Report 2010: General Organization of Water Desalinization; Saline Water Conversion Corporation: Riyadh, Saudi Arabia, 2011. [Google Scholar]
  72. SAMA. Saudi Arabian Monetary Agency (57th Annual Report); Department of Statistics: Riyadh, Saudi Arabia, 2022. [Google Scholar]
  73. SWCC. Addressing Water Security in Arid and Water Stress Regions (Positional Paper); Saline Water Conversion Corporation: Riyadh, Saudi Arabia, 2024. [Google Scholar]
  74. Chowdhury, S.; Al-Zahrani, M. Characterizing water resources and trends of sector-wise water consumption in Saudi Arabia. J. King Saud Univ.-Eng. Sci. 2015, 27, 68–82. [Google Scholar] [CrossRef]
  75. CLIS (Council of Leading Islamic Scholars). Judgment Regarding Purifying Wastewater, Judgment No. 64 on 25 Shawwal, 1398 H., Thirteen Meeting of the Council of Leading Islamic Scholars (CLIS) during the Second Half of the Arabic Month of Shawwal, 1398 H (1978 CE). Taif J. Islam. Res. 1978, 17, 40–41. [Google Scholar]
  76. MOP. Fourth Development Plan 1985; Ministry of Planning: Riyadh, Saudi Arabia, 1985.
  77. MOP. First Development Plan 1970; Ministry of Planning: Riyadh, Saudi Arabia, 1970.
  78. Fessehaye, M.; Abdul-Wahab, S.A.; Savage, M.J.; Kohler, T.; Gherezghiher, T.; Hurni, H. Fog-water collection for community use. Renew. Sustain. Energy Rev. 2014, 29, 52–62. [Google Scholar] [CrossRef]
  79. Nield, D. Yemen Is Fighting Its Severe Water Shortage by Harvesting Its Fog. Science Alert. 19 February 2016. Available online: https://www.sciencealert.com/villagers-in-yemen-have-a-new-new-way-of-fighting-drought-fog-harvesting (accessed on 7 October 2023).
  80. Prisco, J. Desert ‘Fog Catchers’ Make Water Out of Thin Air. CNN. 18 November 2016. Available online: https://edition.cnn.com/2016/11/18/africa/fog-catchers-morocco/index.html (accessed on 7 October 2023).
  81. Qadir, M.; Jimenez, G.C.; Farnum, R.L.; Dodson, L.L.; Smakhtin, V. Fog water collection: Challenges beyond technology. Water 2018, 10, 372. [Google Scholar] [CrossRef]
Figure 1. Water Demand by Sector (in million cubic meters) and Percentage Share (Color Pallets) in Saudi Arabia.
Sustainability 16 04189 g001
Figure 2. Supply of Water by Source (in million cubic meters) and Percentage Share (Color Pallets) in Saudi Arabia; Groundwater (NR) stands for Groundwater Non-Renewable.
Sustainability 16 04189 g002
Figure 3. The gap between Water Demand and Supply in Saudi Arabia (Demand–Supply Curve), the red and blue boxes depict the amount of water deficit and surplus respectively.
Sustainability 16 04189 g003
Figure 4. (a) Water Consumption in Saudi Arabia as per Five-Year Development Plan. (b) Water Supply in Saudi Arabia as per Five-Year Development Plan. * Estimated values from SSYB.
Sustainability 16 04189 g004
Figure 5. Sector-wise water Consumption by Region during VIII, IX, and X Development Plan (in MCMs).
Sustainability 16 04189 g005
Figure 6. Prediction Scenarios for Total (a), Agricultural (b), Domestic (c), and Industrial (d) Water Consumption.
Sustainability 16 04189 g006
Table 1. Water Balance of Consumption and Supply in Saudi Arabia (in million cubic meters).
Sector/Five-Years Plan6th Plan
(1995–1999)
7th Plan
(2000–2004)
8th Plan
(2005–2009)
9th Plan
(2010–2014)
10th Plan (2020) *
1999% Share2004% Share2009% Share2014% Share2020% Share
Municipal17508.44210010.36233012.59258315.84362922.7%
Industrial4502.176403.167133.859305.70168010.5%
Agricultural18,54089.3917,53086.4815,46483.5612,79478.4610,67066.8%
Total20,740100.0020,270100.0018,507100.0016,307100.0015,979100.00
Non-Renew.11,76956.7513,49066.5511,55162.41897655.04972360.8%
Renewable794138.29541026.69554129.94464428.48230114.4%
Desalinated7903.8110705.2810485.66207012.69227514.2%
Treated2401.163001.483671.986173.78168010.5%
Total20,740100.0020,270100.0018,507100.0016,307100.0015,979100.00
Source: [41,42,43,60], * estimated from [46,47].
Table 2. Water Consumption by Region (in million cubic meters).
Province8th Plan (2005–2009)9th Plan (2009–2014)10th Plan (2014–2019) *Average Annual Growth Rate
MunicipalAgricultureIndustrialTotalMunicipalAgricultureIndustrialTotalMunicipalAgricultureIndustrialTotalMunicipalAgricultureIndustrialTotal
Riyadh67340892364998752346728044991121289644144585.2%−3.4%6.5%−1.1%
Makkah6088611441613667737193159784169136819003.3%−2.2%9.8%1.7%
Madinah15896852117817877569102226164612810355.1%−4.0%9.4%−1.3%
Qassim86227421238196186624198618015464117677.7%−3.8%6.9%−2.9%
East Reg3539111981462387734249137068665743117746.9%−3.2%8.1%2.0%
Asir124350164901373302449111727249438−0.6%−2.5%11.8%−1.1%
Tabouk677338808755651565574503426191.0%−3.7%18.0%−2.6%
Hail45135271404501099181167708964910154.5%−4.0%21.5%−3.2%
North Bord2443312763363884504.7%7.2%2.9%4.9%
Jazan8620408213497171220182911214864716452.7%−3.1%19.4%−2.6%
Najran372525294422071226140152282200.8%−4.9%18.8%−2.9%
Baha30120515532100111433376271361.0%−4.5%18.4%−1.3%
Jawf39151010155943119612125157841259233.9%−5.7%9.6%−5.1%
Total233015,46471318,507258312,79493016,307362910,670162815,9794.5%−3.6%8.6%−1.5%
Source: [41,42,43,60], * estimated from [46,47].
Table 3. Coefficient Value for Scenario Projections.
Sectors/ScenariosRate of Change as per Scenario Analysis
Actual
(SC-I) *
Predicted
(SC-II) **
Predicted
(SC-III) **
Predictor Value
Municipal2.11.62.6±0.5
Industrial5.54.56.5±1
Agricultural−3.7−4.2−3.2±0.5
Total−2.5−3−2±0.5
Source: [41,42,43,60], * estimated from [46,47], ** Authors’ estimates based on predictor values.
Disclaimer/Publisher’s Note: The statements, opinions and data contained in all publications are solely those of the individual author(s) and contributor(s) and not of MDPI and/or the editor(s). MDPI and/or the editor(s) disclaim responsibility for any injury to people or property resulting from any ideas, methods, instructions or products referred to in the content.

