
A Reliability and Risk Assessment of Solar Photovoltaic Panels Using a Failure Mode and Effects Analysis Approach: A Case Study

 , ,
, ,  , , and
Abstract
:1. Introduction
2. Literature Review
2.1. Data Collection Approach

| Data Used for Reliability Analyses | References | No. of Papers |
|---|---|---|
| Data from the literature | [19,20,21,22,23,24,25,26,27,28,29,30,31,32,33,34,35,36] | 20 (50%) |
| Field failure data | [37,38,39,40,41,42,43,44,45,46,47,48,49] | 13 (32.5%) |
| Reliability testing data | [8,50,51] | 3 (7.5%) |
| Expert evaluations | [52] | 1 (2.5%) |
| Data from the literature and expert evaluations | [53] | 1 (2.5%) |
| Field failure data and reliability testing data | [54] | 1 (2.5%) |
| Field failure data and data from the literature | [55,56] | 1 (2.5%) |
| Field failure data, data from the literature, reliability testing data, and expert evaluations | - | 0 |
2.2. Selection of RAM Analysis Approach
| Sr. No. | Methods Used for Reliability Analyses | References |
|---|---|---|
| 1 | Fault Tree Analysis (FTA) | [18,21,26,29,34,36,42,55,68,69] |
| 2 | Failure Mode and Effects Analysis (FMEA) | [19,27,42,44,48,54,70,71] |
| 3 | Probability Distributions | [20,31,32,39,40,72,73] |
| 4 | Reliability Block Diagram (RBD) | [8,31,33,51,54] |
| 5 | Markov Chain | [22,26,50,52] |
| 6 | Hybrid FTA | [9,23,30,53,74] |
| 7 | Monte Carlo Simulation | [28,37,41] |
| 8 | Petri Networks | [24,46] |
| 9 | FMECA and Markov Process | [69,75] |
| 10 | State Enumeration Method | [25] |
| 11 | Dynamic Bayesian Networks | [52] |
| 12 | Multi-State Model | [48] |
| 13 | Optimization Model | [76] |
| 14 | Control Chart | [43] |
| 15 | Performance Ratios | [38] |
2.3. History of FMEA
2.4. When to Conduct an FMEA
2.5. Types of FMEA
2.6. Existing Work on FMEAs of Solar PV Systems
3. FMEA Methodology
3.1. Formation of FMEA Team
3.2. Defining the Scope and Objectives of the Analysis
3.3. Data Collection, Sorting and Preprocessing
3.4. FMEA Worksheet
3.5. Calculating RPN
3.6. Corrective Action Plan and Improved FMEA
3.7. FMEA Report
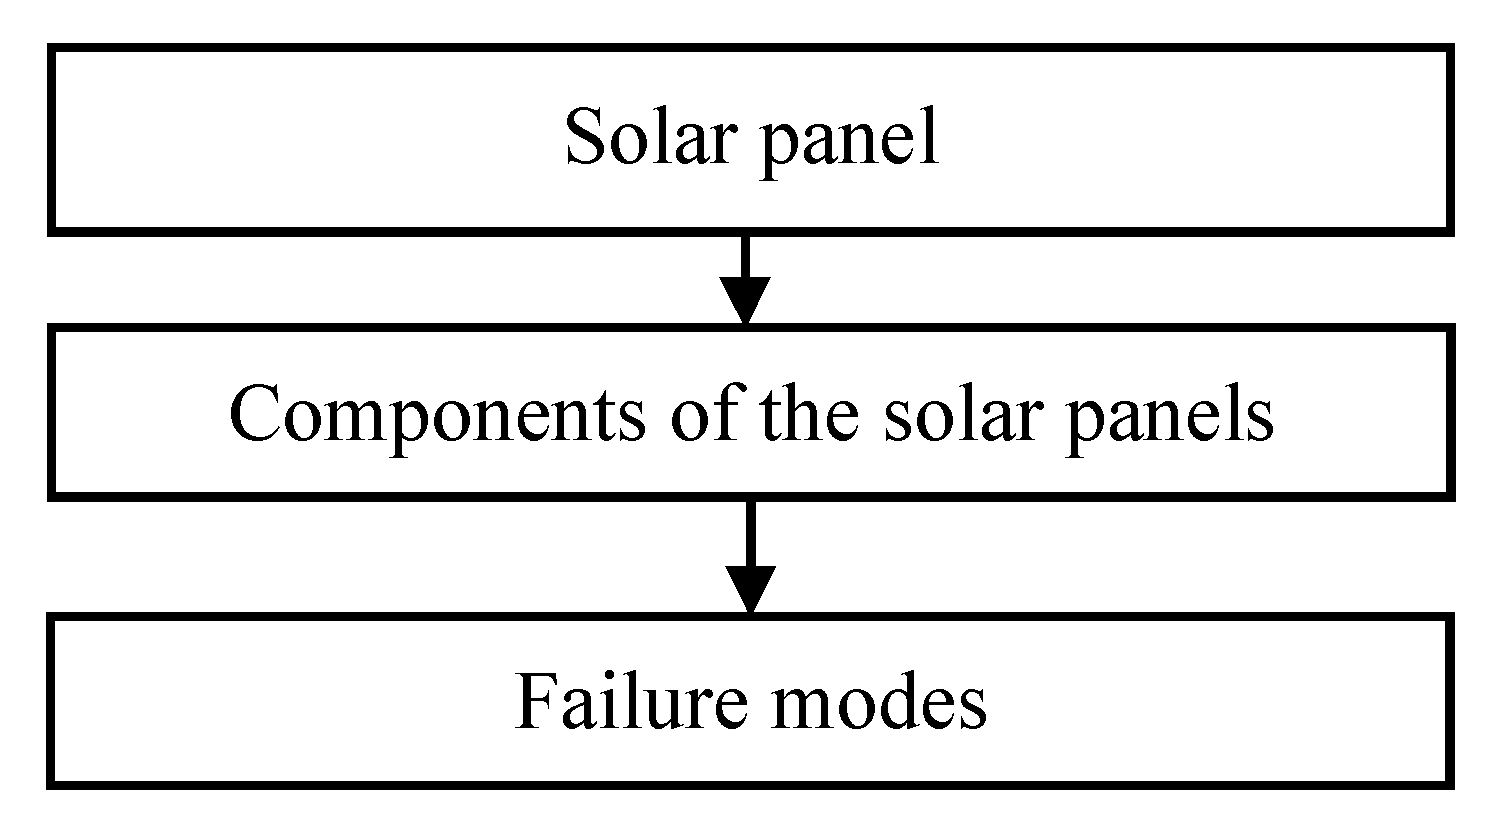
4. A Case Study of Polycrystalline Solar Panels
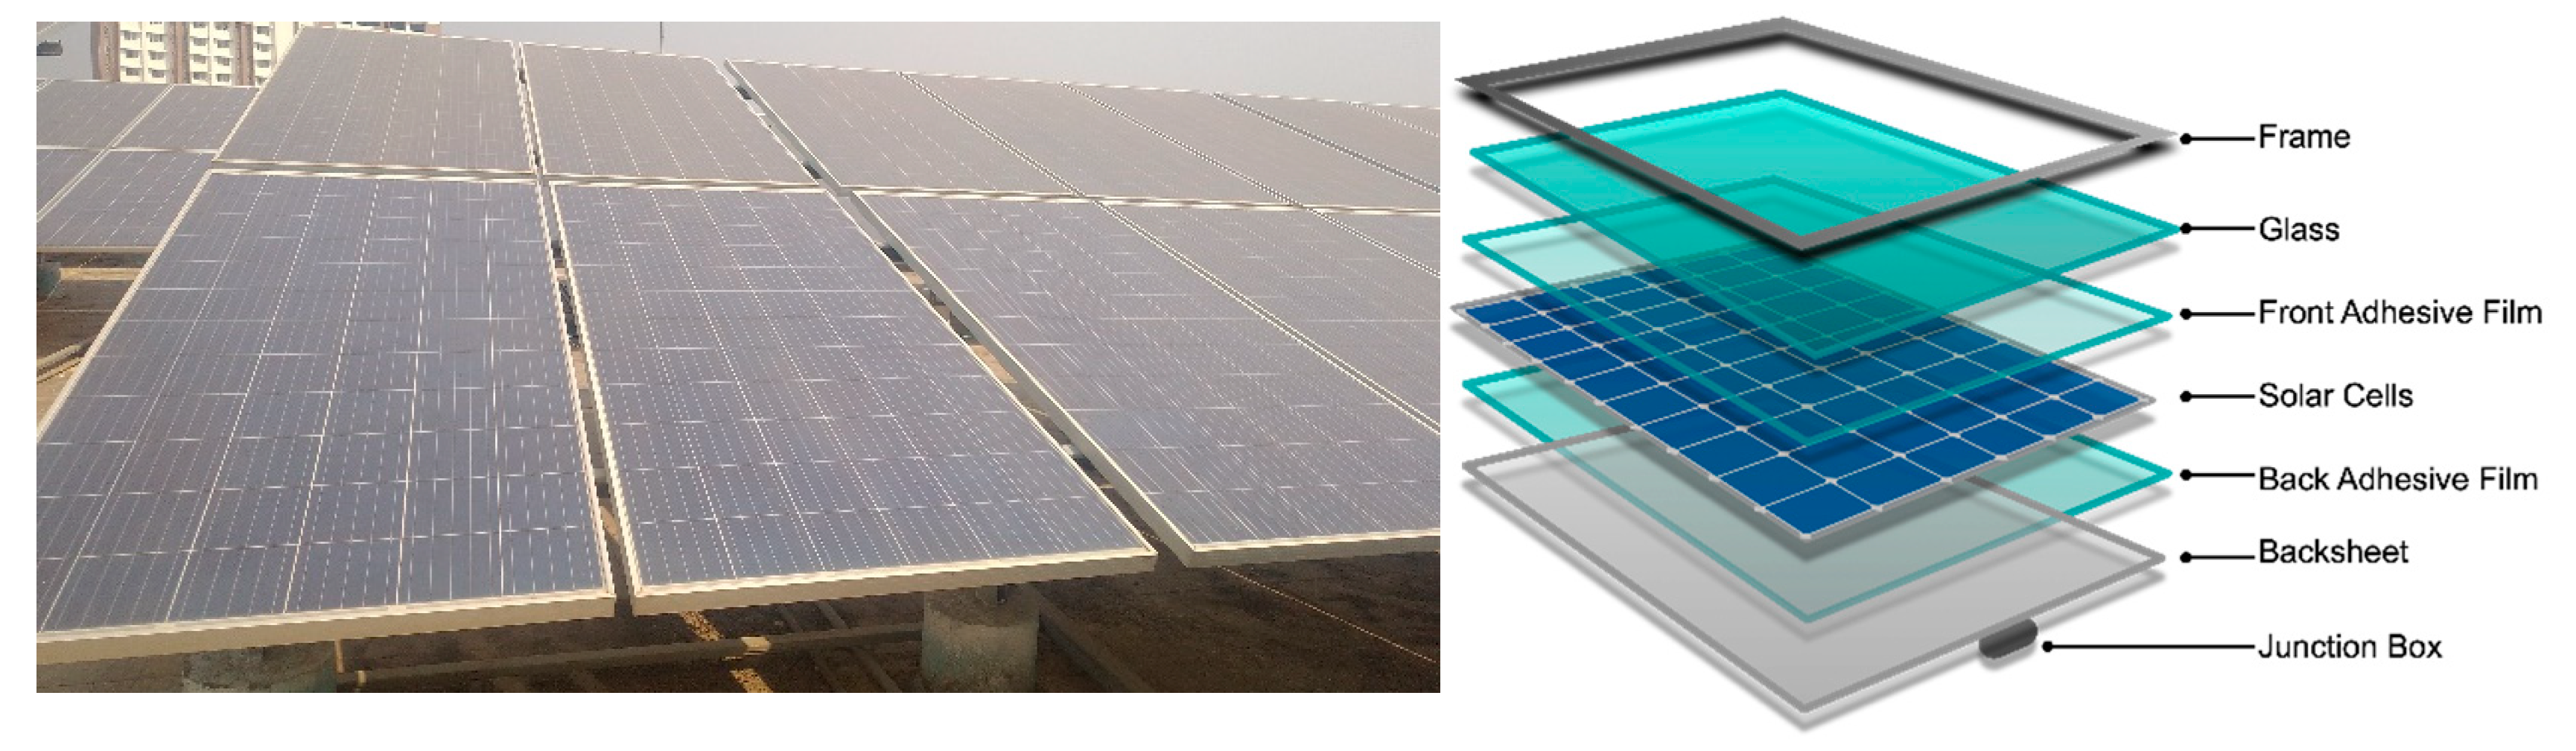
4.1. Construction of a Solar Panel
4.2. FMEA of Solar Panel
4.3. Prioritizing the Failure Modes
4.4. Criticality Analysis of Components and Their Dominating Failure Modes
5. Conclusions
Scope, Limitations, and Future Directions
Author Contributions
Funding
Institutional Review Board Statement
Informed Consent Statement
Data Availability Statement
Conflicts of Interest
References
- Maka, A.O.M.; Alabid, J.M. Solar Energy Technology and Its Roles in Sustainable Development. Clean Energy 2022, 6, 476–483. [Google Scholar] [CrossRef]
- Obaideen, K.; Olabi, A.G.; Al Swailmeen, Y.; Shehata, N.; Abdelkareem, M.A.; Alami, A.H.; Rodriguez, C.; Sayed, E.T. Solar Energy: Applications, Trends Analysis, Bibliometric Analysis and Research Contribution to Sustainable Development Goals (SDGs). Sustainability 2023, 15, 1418. [Google Scholar] [CrossRef]
- Formica, T.J.; Khan, H.A.; Pecht, M.G. The Effect of Inverter Failures on the Return on Investment of Solar Photovoltaic Systems. IEEE Access 2017, 5, 21336–21343. [Google Scholar] [CrossRef]
- Attia, A.M. Robust Capacity Planning of a Grid-Connected Photovoltaic System Under Climate Change and Economic Instabilities. Arab. J. Sci. Eng. 2024, 49, 7661–7675. [Google Scholar] [CrossRef]
- Formica, T.; Pecht, M. Return on Investment Analysis and Simulation of a 9.12 Kilowatt (KW) Solar Photovoltaic System. Solar Energy 2017, 144, 629–634. [Google Scholar] [CrossRef]
- Kabir, E.; Kumar, P.; Kumar, S.; Adelodun, A.A.; Kim, K.-H. Solar Energy: Potential and Future Prospects. Renew. Sustain. Energy Rev. 2018, 82, 894–900. [Google Scholar] [CrossRef]
- Obaideen, K.; Nooman AlMallahi, M.; Alami, A.H.; Ramadan, M.; Abdelkareem, M.A.; Shehata, N.; Olabi, A.G. On the Contribution of Solar Energy to Sustainable Developments Goals: Case Study on Mohammed Bin Rashid Al Maktoum Solar Park. Int. J. Thermofluids 2021, 12, 100123. [Google Scholar] [CrossRef]
- Fara, L.; Craciunescu, D. Reliability Analysis of Photovoltaic Systems for Specific Applications. In Reliability and Ecological Aspects of Photovoltaic Modules; IntechOpen: London, UK, 2020; pp. 1–14. [Google Scholar]
- Sonawane, P.R.; Bhandari, S.; Patil, R.B.; Al-Dahidi, S. Reliability and Criticality Analysis of a Large-Scale Solar Photovoltaic System Using Fault Tree Analysis Approach. Sustainability 2023, 15, 4609. [Google Scholar] [CrossRef]
- Haas, R.; Duic, N.; Auer, H.; Ajanovic, A.; Ramsebner, J.; Knapek, J.; Zwickl-Bernhard, S. The Photovoltaic Revolution Is on: How It Will Change the Electricity System in a Lasting Way. Energy 2023, 265, 126351. [Google Scholar] [CrossRef]
- Asiaban, S.; Kayedpour, N.; Samani, A.E.; Bozalakov, D.; De Kooning, J.D.M.; Crevecoeur, G.; Vandevelde, L. Wind and Solar Intermittency and the Associated Integration Challenges: A Comprehensive Review Including the Status in the Belgian Power System. Energies 2021, 14, 2630. [Google Scholar] [CrossRef]
- Stamatis, H.D. Failure Mode and Effect Analysis: FMEA from Theory to Execution, 2nd ed.; ASQ Quality Press: Milwaukee, WI, USA, 2003; ISBN 978-0873895989. [Google Scholar]
- Dyadem, P. Guidelines for Failure Mode and Effects Analysis (FMEA), for Automotive, Aerospace, and General Manufacturing Industries; CRC Press: Boca Raton, FL, USA, 2003; ISBN 9780429214523. [Google Scholar]
- Soltanali, H.; Ramezani, S. Smart Failure Mode and Effects Analysis (FMEA) for Safety–Critical Systems in the Context of Industry 4.0 BT—Advances in Reliability, Failure and Risk Analysis. In Advances in Reliability, Failure and Risk Analysis; Garg, H., Ed.; Springer Nature: Singapore, 2023; pp. 151–176. ISBN 978-981-19-9909-3. [Google Scholar]
- Lestyánszka Škůrková, K.; Fidlerová, H.; Niciejewska, M.; Idzikowski, A. Quality Improvement of the Forging Process Using Pareto Analysis and 8D Methodology in Automotive Manufacturing: A Case Study. Standards 2023, 3, 84–94. [Google Scholar] [CrossRef]
- Arabian-Hoseynabadi, H.; Oraee, H.; Tavner, P.J. Failure Modes and Effects Analysis (FMEA) for Wind Turbines. Int. J. Electr. Power Energy Syst. 2010, 32, 817–824. [Google Scholar] [CrossRef]
- Abu Dabous, S.; Ibrahim, F.; Feroz, S.; Alsyouf, I. Integration of Failure Mode, Effects, and Criticality Analysis with Multi-Criteria Decision-Making in Engineering Applications: Part I—Manufacturing Industry. Eng. Fail. Anal. 2021, 122, 105264. [Google Scholar] [CrossRef]
- Stember, L.H. Reliability Considerations in the Design of Solar Photovoltaic Power Systems. Sol. Cells 1981, 3, 269–285. [Google Scholar] [CrossRef]
- Rajput, P.; Malvoni, M.; Kumar, N.M.; Sastry, O.S.; Tiwari, G.N. Risk Priority Number for Understanding the Severity of Photovoltaic Failure Modes and Their Impacts on Performance Degradation. Case Stud. Therm. Eng. 2019, 16, 100563. [Google Scholar] [CrossRef]
- Mishra, P.; Joshi, J. Reliability Estimation for Components of Photovoltaic Sysyems. Energy Convers. Manag. 1996, 37, 1371–1382. [Google Scholar] [CrossRef]
- Zini, G.; Mangeant, C.; Merten, J. Reliability of Large-Scale Grid-Connected Photovoltaic Systems. Renew. Energy 2011, 36, 2334–2340. [Google Scholar] [CrossRef]
- Theristis, M.; Papazoglou, I.A. Markovian Reliability Analysis of Standalone Photovoltaic Systems Incorporating Repairs. IEEE J. Photovolt. 2014, 4, 414–422. [Google Scholar] [CrossRef]
- Hu, R.; Mi, J.; Hu, T.; Fu, M.; Yang, P. Reliability Research for PV System Using BDD-Based Fault Tree Analysis. In Proceedings of the QR2MSE 2013—2013 International Conference on Quality, Reliability, Risk, Maintenance, and Safety Engineering, Chengdu, China, 15–18 July 2013; pp. 359–363. [Google Scholar]
- Charki, A.; Bigaud, D. Availability Estimation of a Photovoltaic System. In Proceedings of the 2013 Proceedings Annual Reliability and Maintainability Symposium (RAMS), Orlando, FL, USA, 28–31 January 2013; pp. 1–5. [Google Scholar]
- Ghaedi, A.; Abbaspour, A.; Fotuhi-Firuzabad, M.; Moeini-Aghtaie, M.; Othman, M. Reliability Evaluation of a Composite Power System Containing Wind and Solar Generation. In Proceedings of the 2013 IEEE 7th International Power Engineering and Optimization Conference (PEOCO), Langkawi, Malaysia, 3–4 June 2013; pp. 483–488. [Google Scholar]
- Ahadi, A.; Ghadimi, N.; Mirabbasi, D. Reliability Assessment for Components of Large Scale Photovoltaic Systems. J. Power Sources 2014, 264, 211–219. [Google Scholar] [CrossRef]
- Colli, A. Failure Mode and Effect Analysis for Photovoltaic Systems. Renew. Sustain. Energy Rev. 2015, 50, 804–809. [Google Scholar] [CrossRef]
- Nemes, C.; Munteanu, F.; Rotariu, M.; Astanei, D. Availability Assessment for Grid-Connected Photovoltaic Systems with Energy Storage. In Proceedings of the 2016 International Conference and Exposition on Electrical and Power Engineering, EPE 2016, Iasi, Romania, 20–22 October 2016; pp. 908–911. [Google Scholar]
- Gupta, N.; Garg, R.; Kumar, P. Sensitivity and Reliability Models of a PV System Connected to Grid. Renew. Sustain. Energy Rev. 2017, 69, 188–196. [Google Scholar] [CrossRef]
- Chiacchio, F.; Famoso, F.; D’Urso, D.; Brusca, S.; Aizpurua, J.I.; Cedola, L. Dynamic Performance Evaluation of Photovoltaic Power Plant by Stochastic Hybrid Fault Tree Automaton Model. Energies 2018, 11, 306. [Google Scholar] [CrossRef]
- Sayed, A.; El-Shimy, M.; El-Metwally, M.; Elshahed, M. Reliability, Availability and Maintainability Analysis for Grid-Connected Solar Photovoltaic Systems. Energies 2019, 12, 1213. [Google Scholar] [CrossRef]
- Sayed, A.; EL-Shimy, M.; El-Metwally, M.; Elshahed, M. Impact of Subsystems on the Overall System Availability for the Large Scale Grid-Connected Photovoltaic Systems. Reliab. Eng. Syst. Saf. 2020, 196, 106742. [Google Scholar] [CrossRef]
- Qadeer, A.; Huawei, L.; Ikram, M.T. Research on Reliability of Grid Connected Photovoltaic Renewable Generation System. IOP Conf. Ser. Earth Environ. Sci. 2021, 804, 32058. [Google Scholar] [CrossRef]
- Mohd Nizam Ong, N.A.F.; Sadiq, M.A.; Md Said, M.S.; Jomaas, G.; Mohd Tohir, M.Z.; Kristensen, J.S. Fault Tree Analysis of Fires on Rooftops with Photovoltaic Systems. J. Build. Eng. 2022, 46, 103752. [Google Scholar] [CrossRef]
- Spertino, F.; Amato, A.; Casali, G.; Ciocia, A.; Malgaroli, G. Reliability Analysis and Repair Activity for the Components of 350 KW Inverters in a Large Scale Grid-Connected Photovoltaic System. Electronics 2021, 10, 564. [Google Scholar] [CrossRef]
- Li, T.; Tao, S.; Zhang, R.; Liu, Z.; Ma, L.; Sun, J.; Sun, Y. Reliability Evaluation of Photovoltaic System Considering Inverter Thermal Characteristics. Electronics 2021, 10, 1763. [Google Scholar] [CrossRef]
- Maish, A.B.; Atcitty, C.; Hester, S.; Greenberg, D.; Osborn, D.; Collier, D.; Brine, M. Photovoltaic System Reliability. In Proceedings of the Conference Record of the IEEE Photovoltaic Specialists Conference, Anaheim, CA, USA, 29 September–3 October 1997; Volume 3, pp. 1049–1054. [Google Scholar]
- Jahn, U.; Nasse, W. Operational Performance of Grid-Connected PV Systems on Buildings in Germany. Prog. Photovolt. Res. Appl. 2004, 12, 441–448. [Google Scholar] [CrossRef]
- Oozeki, T.; Yamada, T.; Kato, K.; Yamamoto, T. An Analysis of Reliability for Photovoltaic Systems on the Field Test Project for Photovoltaic in Japan. In Proceedings of the ISES Solar World Congress 2007, ISES 2007, Beijing, China, 18–21 September 2007; Volume 3, pp. 1628–1632. [Google Scholar]
- Golnas, A. PV System Reliability: An Operator’s Perspective. IEEE J. Photovolt. 2013, 3, 416–421. [Google Scholar] [CrossRef]
- Sulaeman, S.; Benidris, M.; Mitra, J. Modeling and Assessment of PV Solar Plants for Composite System Reliability Considering Radiation Variability and Component Availability. In Proceedings of the 19th Power Systems Computation Conference, PSCC 2016, Genova, Italy, 20–24 June 2016. [Google Scholar]
- Baschel, S.; Koubli, E.; Roy, J.; Gottschalg, R. Impact of Component Reliability on Large Scale Photovoltaic Systems’ Performance. Energies 2018, 11, 1579. [Google Scholar] [CrossRef]
- Causia Aguisti, F.; Musyafa’, A.; Khamim Asy’ari, M. Analysis of RAM (Reliability, Availability, Maintainability) Production of Electric Voltage from 48 v PV (Photovoltaic) at Pantai Baru Pandansimo, Indonesia. In Proceedings of the 1st International Conference on Renewable Energy Research and Challenge (ICoRER 2019); E3S Web of Conferences; EDP Sciences: Les Ulis, France, 2020; Volume 190. [Google Scholar]
- Rajput, P.; Malvoni, M.; Sastry, O.S.; Tiwari, G.N. Failure Mode and Effect Analysis of Monocrystalline Silicon Photovoltaic Modules after 24 Years Outdoor Exposure in Semi-Arid Climate. AIP Conf. Proc. 2020, 2276, 20004. [Google Scholar] [CrossRef]
- Liu, Y. Reliability Analysis of Photovoltaic Module Based on Measured Data. IOP Conf. Ser. Earth Environ. Sci. 2021, 793, 12019. [Google Scholar] [CrossRef]
- Simon, D.F.; Teixeira, M.; da Costa, J.P. Availability Estimation in Photovoltaic Generation Systems Using Timed Petri Net Simulation Models. Int. J. Electr. Power Energy Syst. 2022, 137, 106897. [Google Scholar] [CrossRef]
- Luo, W.; Khoo, Y.S.; Hacke, P.; Jordan, D.; Zhao, L.; Ramakrishna, S.; Aberle, A.G.; Reindl, T. Analysis of the Long-Term Performance Degradation of Crystalline Silicon Photovoltaic Modules in Tropical Climates. IEEE J. Photovolt. 2019, 9, 266–271. [Google Scholar] [CrossRef]
- Ostovar, S.; Esmaeili-Nezhad, A.; Moeini-Aghtaie, M.; Fotuhi-Firuzabad, M. Reliability Assessment of Distribution System with the Integration of Photovoltaic and Energy Storage Systems. Sustain. Energy Grids Netw. 2021, 28, 100554. [Google Scholar] [CrossRef]
- Collins, E.; Dvorack, M.; Mahn, J.; Mundt, M.; Quintana, M. Reliability and Availability Analysis of a Fielded Photovoltaic System. In Proceedings of the 2009 34th IEEE Photovoltaic Specialists Conference (PVSC), Philadelphia, PA, USA, 7–12 June 2009; pp. 002316–002321. [Google Scholar] [CrossRef]
- Stember, L.H.; Huss, W.R.; Bridgman, M.S. A Methodology for Photovoltaic System Reliability & Economic Analysis. IEEE Trans. Reliab. 1982, R-31, 296–303. [Google Scholar] [CrossRef]
- Huffman, D.L.; Antelme, F. Availability Analysis of a Solar Power System with Graceful Degradation. In Proceedings of the Proceedings—Annual Reliability and Maintainability Symposium, Fort Worth, TX, USA, 26–29 January 2009; pp. 348–352. [Google Scholar]
- Cai, B.; Liu, Y.; Ma, Y.; Huang, L.; Liu, Z. A Framework for the Reliability Evaluation of Grid-Connected Photovoltaic Systems in the Presence of Intermittent Faults. Energy 2015, 93, 1308–1320. [Google Scholar] [CrossRef]
- Perveen, S.; Ashfaq, H.; Asjad, M. Reliability Assessment of Solar Photovoltaic Systems Based on Fuzzy Fault Tree Analysis. Life Cycle Reliab. Saf. Eng. 2019, 8, 129–139. [Google Scholar] [CrossRef]
- Collins, E.; Miller, S.; Stein, J.; Sorensen, R.; Granata, J.; Auintana, M. A Reliability and Availability Sensitivity Study of a Large Photovoltaic System. In Proceedings of the 25th European Photovoltaic Solar Energy Conference and Exhibition/5th World Conference on Photovoltaic Energy Conversion, Valencia, Spain, 6–10 September 2010; pp. 4463–4469. [Google Scholar]
- Ahadi, A.; Hayati, H.; Miryousefi Aval, S.M. Reliability Evaluation of Future Photovoltaic Systems with Smart Operation Strategy. Front. Energy 2016, 10, 125–135. [Google Scholar] [CrossRef]
- Dellosa, J.T.; Palconit, E.V.; Nelson, H.; Enano, N.H. Risk Assessment and Policy Recommendations for a Floating Solar Photovoltaic (FSPV) System. IEEE Access 2024, 12, 30452–30471. [Google Scholar] [CrossRef]
- Ganesan, S.; Eveloy, V.; Das, D.; Pecht, M. Identification and Utilization of Failure Mechanisms to Enhance FMEA and FMECA. In Proceedings of the IEEE Workshop on Accelerated Stress Testing & Reliability (ASTR), Austin, TX, USA, 3–5 October 2005; IEEE: Piscataway, NJ, USA, 2005; pp. 2–5. [Google Scholar]
- Hendricks, C.; Williard, N.; Mathew, S.; Pecht, M. A Failure Modes, Mechanisms, and Effects Analysis (FMMEA) of Lithium-Ion Batteries. J. Power Sources 2015, 297, 113–120. [Google Scholar] [CrossRef]
- Kaliaperumal, M.; Dharanendrakumar, M.S.; Prasanna, S.; Abhishek, K.V.; Chidambaram, R.K.; Adams, S.; Zaghib, K.; Reddy, M. V Cause and Mitigation of Lithium-Ion Battery Failure—A Review. Materials 2021, 14, 5676. [Google Scholar] [CrossRef] [PubMed]
- Kapur, K.C.; Pecht, M. Chapter 10—Failure Modes, Mechanisms, and Effects Analysis. In Reliability Engineering; John Wiley & Sons, Inc.: Hoboken, NJ, USA, 2014; pp. 1–512. [Google Scholar]
- Catelani, M.; Ciani, L.; Venzi, M. Failure Modes, Mechanisms and Effect Analysis on Temperature Redundant Sensor Stage. Reliab. Eng. Syst. Saf. 2018, 180, 425–433. [Google Scholar] [CrossRef]
- Cheng, S.; Das, D.; Pecht, M. Using Failure Modes, Mechanisms, and Effects Analysis in Medical Device Adverse Event Investigations. In Proceedings of the 2nd International Conference on Biomedical Ontology (ICBO), Buffalo, NY, USA, 26–30 July 2011; pp. 340–345. [Google Scholar]
- Fan, J.; Yung, K.C.; Pecht, M. Failure Modes, Mechanisms, and Effects Analysis for LED Backlight Systems Used in LCD TVs. In Proceedings of the 2011 Prognostics and System Health Management Conference, Shenzhen, China, 24–25 May 2011; pp. 1–5. [Google Scholar]
- Liu, Y.; Swingler, J.; Flynn, D. Failure Mode Mechanism and Effect Analysis of High Voltage DC Arcs in Electric Vehicle Cable. In Proceedings of the 2021 6th Asia Conference on Power and Electrical Engineering (ACPEE), Chongqing, China, 8–11 April 2021; pp. 6–13. [Google Scholar]
- Limei, X.; Ying, C.; Rui, K. Failure Mode, Mechanism and Effect Analysis for Single Board Computers. In Proceedings of the 2011 Prognostics and System Health Management Conference, Shenzhen, China, 24–25 May 2011; IEEE: Piscataway, NJ, USA, 2011; pp. 1–5. [Google Scholar]
- Mathew, S.; Alam, M.; Pecht, M. Identification of Failure Mechanisms to Enhance Prognostic Outcomes. J. Fail. Anal. Prev. 2012, 12, 66–73. [Google Scholar] [CrossRef]
- Mathew, S.; Das, D.; Rossenberger, R.; Pecht, M. Failure Mechanisms Based Prognostics. In Proceedings of the 2008 International Conference on Prognostics and Health Management, Denver, CO, USA, 6–9 October 2008; IEEE: Piscataway, NJ, USA, 2008; pp. 1–6. [Google Scholar]
- Hamdy, M.A.; Beshir, M.E.; Elmasry, S.E. Reliability Analysis of Photovoltaic Systems. Appl. Energy 1989, 33, 253–263. [Google Scholar] [CrossRef]
- Hefaidh, H.; Mébarek, D.; Belkhir, N.; Driss, Z. Reliability Degradation Prediction of Photovoltaic Modules Based on Dependability Methods. Int. J. Qual. Reliab. Manag. 2023, 40, 478–495. [Google Scholar] [CrossRef]
- Gyamfi, S.; Aboagye, B.; Obeng, M.; Peprah, F. Criticality and Severity of Adverse Effects of the Sun on Performance of Solar PV Systems. Sol. Energy Adv. 2024, 4, 100058. [Google Scholar] [CrossRef]
- Pimpalkar, R.; Sahu, A.; Yadao, A.; Patil, R.B. Failure Modes and Effects Analysis of Polycrystalline Photovoltaic Modules Exposed to the Composite Climate of India. J. Inst. Eng. India Ser. C 2024, 105, 339–355. [Google Scholar] [CrossRef]
- Yan, W.; Liu, W.; Kong, W. Reliability Evaluation of PV Modules Based on Exponential Dispersion Process. Energy Rep. 2021, 7, 3023–3032. [Google Scholar] [CrossRef]
- Liu, W.; Xu, B.; Liu, Y.; Li, S.; Yan, W. A Field-function Methodology Predicting the Service Lifetime of Photovoltaic Modules. Renew. Sustain. Energy Rev. 2024, 192, 114266. [Google Scholar] [CrossRef]
- Ghaedi, A.; Mahmoudian, M.; Sedaghati, R. The Impact of Different Solar Tracker Systems on Reliability of Photovoltaic Farms. J. Energy Manag. Technol. 2024. [Google Scholar]
- Cristaldi, L.; Khalil, M.; Soulatiantork, P. Reliability Assessment of Photovoltaic Balance of System. In Proceedings of the 14th IMEKO TC10 Workshop Technical Diagnostics—New Perspectives in Measurements, Tools and Techniques for System’s Reliability, Maintainability and Safety, Milan, Italy, 27–28 June 2016; pp. 242–247. [Google Scholar]
- Li, X.; Yang, Q.; Lou, Z.; Yan, W. Deep Learning Based Module Defect Analysis for Large-Scale Photovoltaic Farms. IEEE Trans. Energy Convers. 2019, 34, 520–529. [Google Scholar] [CrossRef]
- Saglimbene, M.S. Reliability Analysis Techniques: How They Relate to Aircraft Certification. In Proceedings of the 2009 Annual Reliability and Maintainability Symposium, Fort Worth, TX, USA, 26–29 January 2009; pp. 218–222. [Google Scholar]
- Han, T.D.; Razif, M.R.M.; Sulaiman, S.A. Study on Premature Failure of PV Systems in Malaysia Using FMEA and Integrated ISM Approaches. In Proceedings of the UTP-UMP-VIT Symposium on Energy Systems 2018 (SES 2018); MATEC Web of Conferences; EDP Sciences: Les Ulis, France, 2018; Volume 225, pp. 1–6. [Google Scholar]
- Cickaric, L.S.; Katic, V.A.; Milic, S. Failure Modes and Effects Analysis of Urban Rooftop PV Systems—Case Study. In 2018 International Symposium on Industrial Electronics, INDEL 2018; Proceedings 2019; IEEE: Piscataway, NJ, USA, 2019. [Google Scholar] [CrossRef]
- Jordan, D.C.; Silverman, T.J.; Wohlgemuth, J.H.; Kurtz, S.R.; Van Sant, K.T. Photovoltaic Failure and Degradation Modes. Prog. Photovolt. Res. Appl. 2017, 25, 318–326. [Google Scholar] [CrossRef]
- Ji, Y.; Zhong, Q.; Yu, M.; Yan, H.; Li, L.; Li, Q.; Xu, H.; Li, S.; Chen, P.; Zhao, L.; et al. Amphoteric Chelating Ultrasmall Colloids for FAPbI3 Nanodomains Enable Efficient Near-Infrared Light-Emitting Diodes. ACS Nano 2024, 18, 8157–8167. [Google Scholar] [CrossRef]
- Delgado-Sanchez, J.-M.; Sanchez-Cortezon, E.; Lopez-Lopez, C.; Aninat, R.; Alba, M.D. Failure Mode and Effect Analysis of a Large Scale Thin-Film CIGS Photovoltaic Module. Eng. Fail. Anal. 2017, 76, 55–60. [Google Scholar] [CrossRef]
- Rao, K.U.; Parvatikar, A.G.; Gokul, S.; Nitish, N.; Rao, P. A Novel Fault Diagnostic Strategy for PV Micro Grid to Achieve Reliability Centered Maintenance. In Proceedings of the 1st IEEE International Conference on Power Electronics, Intelligent Control and Energy Systems, ICPEICES 2016, Delhi, India, 4–6 July 2016; pp. 4–7. [Google Scholar] [CrossRef]
- Albers, M.J.; Ball, G. Comparative Evaluation of DC Fault-Mitigation Techniques in Large PV Systems. IEEE J. Photovolt. 2015, 5, 1169–1174. [Google Scholar] [CrossRef]
- Kuitche, J.M.; Pan, R.; Tamizhmani, G. Investigation of Dominant Failure Mode(s) for Field-Aged Crystalline Silicon PV Modules under Desert Climatic Conditions. IEEE J. Photovolt. 2014, 4, 814–826. [Google Scholar] [CrossRef]
- Francis, R.; Colli, A. Information-Based Reliability Weighting for Failure Mode Prioritization in Photovoltaic (PV) Module Design. In Proceedings of the Probabilistic Safety Assessment and Management PSAM 12, Honolulu, HI, USA, 22–27 June 2014; pp. 109–120. [Google Scholar]
- Catelani, M.; Ciani, L.; Cristaldi, L.; Faifer, M.; Lazzaroni, M. Electrical Performances Optimization of Photovoltaic Modules with FMECA Approach. Measurement 2013, 46, 3898–3909. [Google Scholar] [CrossRef]
- Rukijkanpanich, J.; Mingmongkol, M. Enhancing Performance of Maintenance in Solar Power Plant. J. Qual. Maint. Eng. 2020, 26, 575–591. [Google Scholar] [CrossRef]
- Ravi Sankar, N.; Prabhu, B.S. Modified Approach for Prioritization of Failures in a System Failure Mode and Effects Analysis. Int. J. Qual. Reliab. Manag. 2001, 18, 324–336. [Google Scholar] [CrossRef]
- Villacourt, M. Failure Mode and Effects Analysis (FMEA): A Guide for Continuous Improvement for the Semiconductor Equipment Industry; International SEMATECH: Austin, TX, USA, 1992. [Google Scholar]
- Bansal, N.; Jaiswal, S.P.; Singh, G. Comparative Investigation of Performance Evaluation, Degradation Causes, Impact and Corrective Measures for Ground Mount and Rooftop Solar PV Plants—A Review. Sustain. Energy Technol. Assess. 2021, 47, 101526. [Google Scholar] [CrossRef]
- Puente, J.; Pino, R.; Priore, P.; de la Fuente, D. A Decision Support System for Applying Failure Mode and Effects Analysis. Int. J. Qual. Reliab. Manag. 2002, 19, 137–150. [Google Scholar] [CrossRef]
- Villarini, M.; Cesarotti, V.; Alfonsi, L.; Introna, V. Optimization of Photovoltaic Maintenance Plan by Means of a FMEA Approach Based on Real Data. Energy Convers. Manag. 2017, 152, 1–12. [Google Scholar] [CrossRef]


| Standard | Developed by | Applications |
|---|---|---|
| MIL-STD-1629A | Department of Defense, USA | Military systems and equipment |
| AIAG FMEA Manual | Automotive Industry Action Group (AIAG) | Automotive industry |
| ISO 9001 | International Organization for Standardization (ISO) | Quality management systems |
| VDA Volume 4 | Verband der Automobilindustrie (VDA) | Manual for the automotive industry that provides guidance on FMEA methodology, documentation, and reporting. |
| SAE J1739 | Society of Automotive Engineers (SAE) | Automotive industry |
| IEC 60812 | International Electrotechnical Commission (IEC) | Hazard analysis of systems, equipment, and facilities |
| Reference | SR | OR | DR | Key Findings |
|---|---|---|---|---|
| [19,44,78,79,80,81] |
| |||
| [82] |
| |||
| [83] |
| |||
| [84] |
| |||
| [27] |
| |||
| [85] |
| |||
| [86] |
| |||
| [87] |
| |||
| [88] |
| |||
| [89] |
| |||
| [15] |
| |||
| [90] |
| |||
| [91] |
|
| System | Sub System/Component |
|---|---|
| PV array | Mounting structure, PV modules, PV cells/solar cells, junction box/bypass diode, interconnector, encapsulation, front glass, back sheet, solder bond, grounding, and lightning protection system |
| Balanced system | Connector, bypass diode, AC switch, AC CB, differential CB, grid protection, and DC combiner |
| String | Fuse and disconnect |
| Cables | Arial cables and underground cables |
| Storage system | Battery, charge controller, and control unit |
| Switching device | Fuse and circuit breakers |
| Power conditioning | Fuses and breakers, transformer, and protective relays Inverter—IGBT module, DC link, microcontroller, AC converter, DC converter, Colling fans, and PCB |
| Product/Process | Failure Mode | Failure Effects | S (1–10) | Causes | O (1–10) | Control | D (1–10) | RPN |
| Actions/Plans | Responsibility and Target Completion Date | Improved/Post Severity | Improved/Post Occurrence | Improved/Post Detection | Improved/Post RPN | |||
| Rating | Severity | Effect |
|---|---|---|
| 9 | Hazardous |
|
| 7 | High |
|
| 5 | Moderate |
|
| 3 | Low |
|
| 1 | Negligible |
|
| Rank | Occurrence | Description |
|---|---|---|
| 10 | High probability/frequent | The occurrence probability is once a week. |
| 9 | The occurrence probability is once a month. | |
| 8 | Moderate probability | The occurrence probability is once in three months. |
| 7 | The occurrence probability is once in six months. | |
| 6 | Occasional probability | The occurrence probability is once a year. |
| 5 | The occurrence probability is once in five years. | |
| 4 | Remote probability | The occurrence probability is once in 10 years. |
| 3 | The occurrence probability is once in 15 years. | |
| 2 | Unlikely/improbable | The occurrence probability is once in 20 years. |
| 1 | The occurrence probability is once in 25 years. |
| Rank | Detection Level | Description |
|---|---|---|
| 10 | Very low |
|
| 8 | Low |
|
| 6 | Moderate |
|
| 4 | Very high |
|
| 2 | Almost certain |
|
| Failure Mode | Effect | SR | Cause | OR | Detection | DR | RPN |
|---|---|---|---|---|---|---|---|
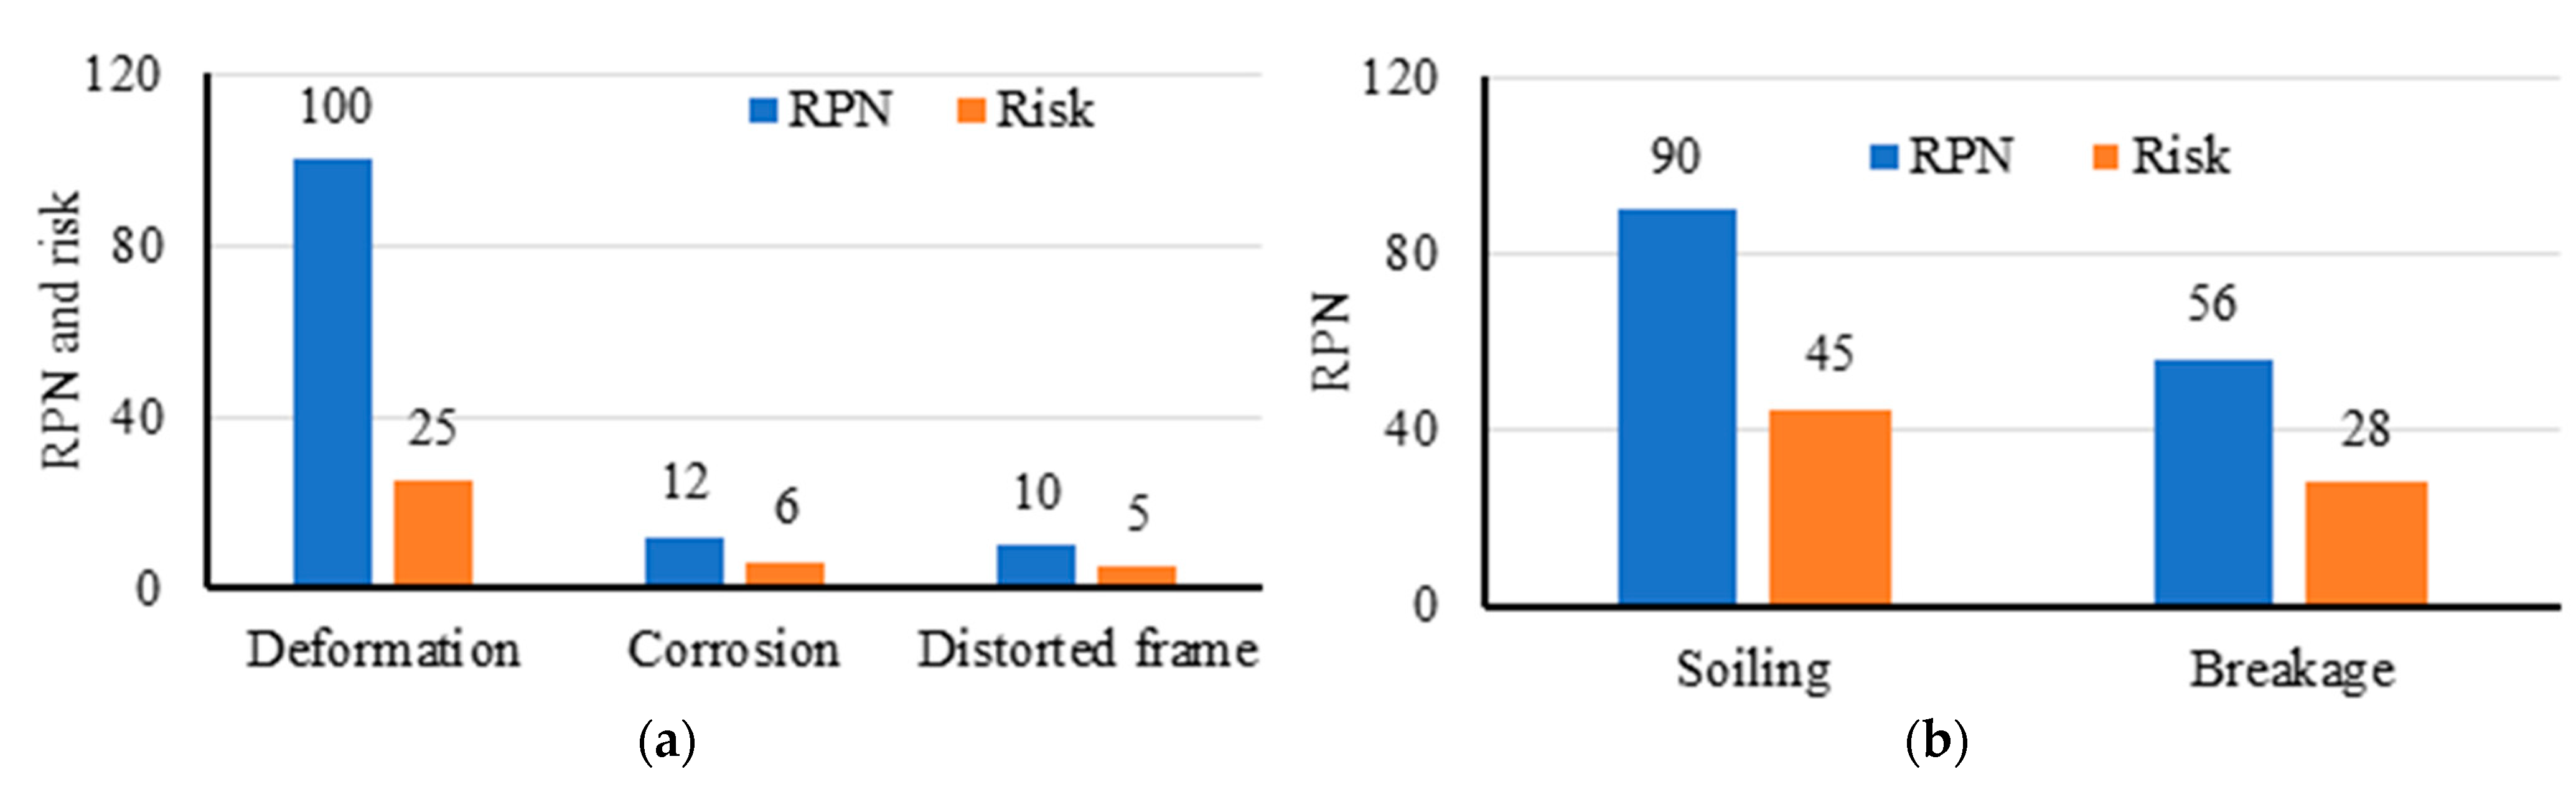
| Frame | 122 | ||||||
| Deformation | Crack in module | 5 | Manufacturing quality; installation | 5 | Visual inspection | 4 | 100 |
| Corrosion | Reduced module efficiency | 3 | Corrosive environment | 2 | Visual inspection | 2 | 12 |
| Distorted frame | Reduced module efficiency | 5 | Manufacturing quality; installation | 1 | Visual inspection | 2 | 10 |
| Glass | 146 | ||||||
| Soiling | Reduced power output; activate various faults | 5 | Dust accumulation, bird droppings, vandalism | 9 | Visual inspection | 2 | 90 |
| Breakage | Reduced power output | 7 | Vandalism; environmental effect; external | 4 | Visual inspection | 2 | 56 |
| Encapsulant | 940 | ||||||
| Delamination | Increased degradation; reduced energy output/no energy output | 7 | Thermal and high-voltage (HV) stress; ultraviolet (UV) light; aging; extreme weather conditions; vandalism; animals; lightning; earthquakes | 4 | Visual inspection; I-R thermography | 8 | 224 |
| Metallization or busbar discoloration | Reduced power that impacts the lifespan of the panel | 5 | Overheating | 4 | Electrical maintenance | 6 | 120 |
| Loss of air tightness | Formation of water vapor inside the panel; water contamination; increased degradation; reduced energy output | 7 | Bad lamination; high voltage stress; hot spots; high cell temperature; corroded/damaged frame; cleaning actions; extreme wind snow load; animals | 2 | Operating/maintenance manual | 8 | 112 |
| Oxidation of front grid metal fingers | Power loss | 7 | Extreme weather conditions, aging, mechanical stresses | 4 | IR thermography | 4 | 112 |
| Hot spots | High power loss; increased degradation | 7 | Shading; localized dirt; broken cells; bad soldering; bypass diode failure; bird droppings and nest; operating current is greater than the short circuit current | 4 | IR imaging, EL imaging, and visual inspection | 4 | 112 |
| Corrosion in solder bonds | Reduced module efficiency | 5 | Moisture penetration | 3 | Visual inspection; infrared (IR) thermography; EL imaging; electrical performance test | 6 | 90 |
| Insulation resistance | Power loss; overheating; fire | 9 | Electrical stress; mechanical damage; vibrations; excessive heat or cold; dirt; oil; corrosive vapors; moisture from processes; humidity on a muggy day | 1 | Insulation tester | 8 | 72 |
| Discoloration | Reduced energy output; overcurrent; decrease in shunt resistance; degradation rate approx. up to 1% per year | 3 | Material defects; oxidation; aging; thermal/mechanical/electrical stress; material contamination; heat; and UV | 2 | Visual inspection; thermal imaging; electroluminescence (EL) imaging; UV light test | 6 | 36 |
| Corrosion in busbar | Electrical performance degradation; power output; series resistance | 5 | Moisture; atmospheric gas penetration; water; acetic acid from EVA degradation | 3 | Maintenance; visual inspection | 2 | 30 |
| Solder bond failure | Increased series resistance | 5 | Stresses induced by thermal cycling or vibration | 1 | Visual inspection | 4 | 20 |
| Defect in finger/gridline | Power loss; hotspot; reduced durability | 3 | Manufacturing error; mechanical stress; handling and installation | 1 | IR imaging; EL imaging; visual inspection; contact resistance test | 4 | 12 |
| Solar cells | 76 | ||||||
| Broken cells | Reduced power output | 7 | Mechanical stress | 4 | Visual inspection; EL imaging | 2 | 56 |
| Discoloration | Reduced power output | 5 | Uncontrolled chemical reaction | 1 | Visual inspection | 4 | 20 |
| Backsheet | 178 | ||||||
| Insulation compromise | Power loss; overheating; fire | 9 | Electrical and mechanical stress; vibration; excessive heat or cold, dirt; corrosive vapors; humidity on a muggy day | 3 | Insulation tester | 2 | 54 |
| Burnt back sheet | Damage to the back sheet | 5 | Hot spot in solar cell | 4 | Visual inspection | 2 | 40 |
| Delamination | No energy output; thermal damages; fire | 7 | Damages; improper installation; disconnections; animals; vandalism | 2 | Visual inspection; tap test; thermal imaging; EL imaging | 2 | 28 |
| Bubble formation | Reduced energy output; no energy output; thermal damage; reliability issue | 3 | Corrosion; improper installation; lightning damage | 4 | Visual inspection | 2 | 24 |
| Warping/detaching | Performance degradation; increased maintenance cost | 3 | Defective material; back sheet adhesion loss | 3 | Visual inspection | 2 | 18 |
| Chalking | Reduced power output; overcurrent | 1 | Defective material; aging; thermal stress | 4 | Visual inspection | 2 | 8 |
| Burn marks | No energy output | 3 | Damage; disconnection; animals; vandalism; strong wind; pulled cables | 1 | Visual inspection | 2 | 6 |
| Junction box | 430 | ||||||
| Open contact | No energy output | 9 | Defective material; corrosion; mechanical damage | 2 | Regular maintenance; U-I measurement | 6 | 108 |
| Short circuit | No energy output; safety; thermal damages; fire; damage to the system | 9 | Water contact; electricity overloading; loose connections; degradation of insulation; aging; animals; lightning | 2 | Regular maintenance; visual control; U-I measurement; no control; detected from the signs of burning; burning smell; flickering light | 6 | 108 |
| Poor contact | Reduced/no power output; thermal damage | 7 | Defective material; oxidation; aging | 2 | Regular maintenance; visual control; U-I measurement | 6 | 84 |
| Bypass diode parameter change | Reduced/no power output; thermal damage; over current; safety problems | 7 | Defective material; aging; thermal stress | 2 | Regular maintenance; visual control; U-I measurement | 6 | 84 |
| Diode failure | Leakage current drop | 3 | excessive forward current and a high reverse voltage | 4 | OC (open circuit) diode inspection with a portable device | 2 | 24 |
| Internal circuitry discoloration; series resistance increase | Reduced energy output; no energy output; thermal damage; over current; safety problems | 1 | Solder bond failure | 4 | I-V curve | 4 | 16 |
| Junction box corroded | Performance loss; leakage current | 3 | Moisture | 1 | Visual inspection | 2 | 6 |
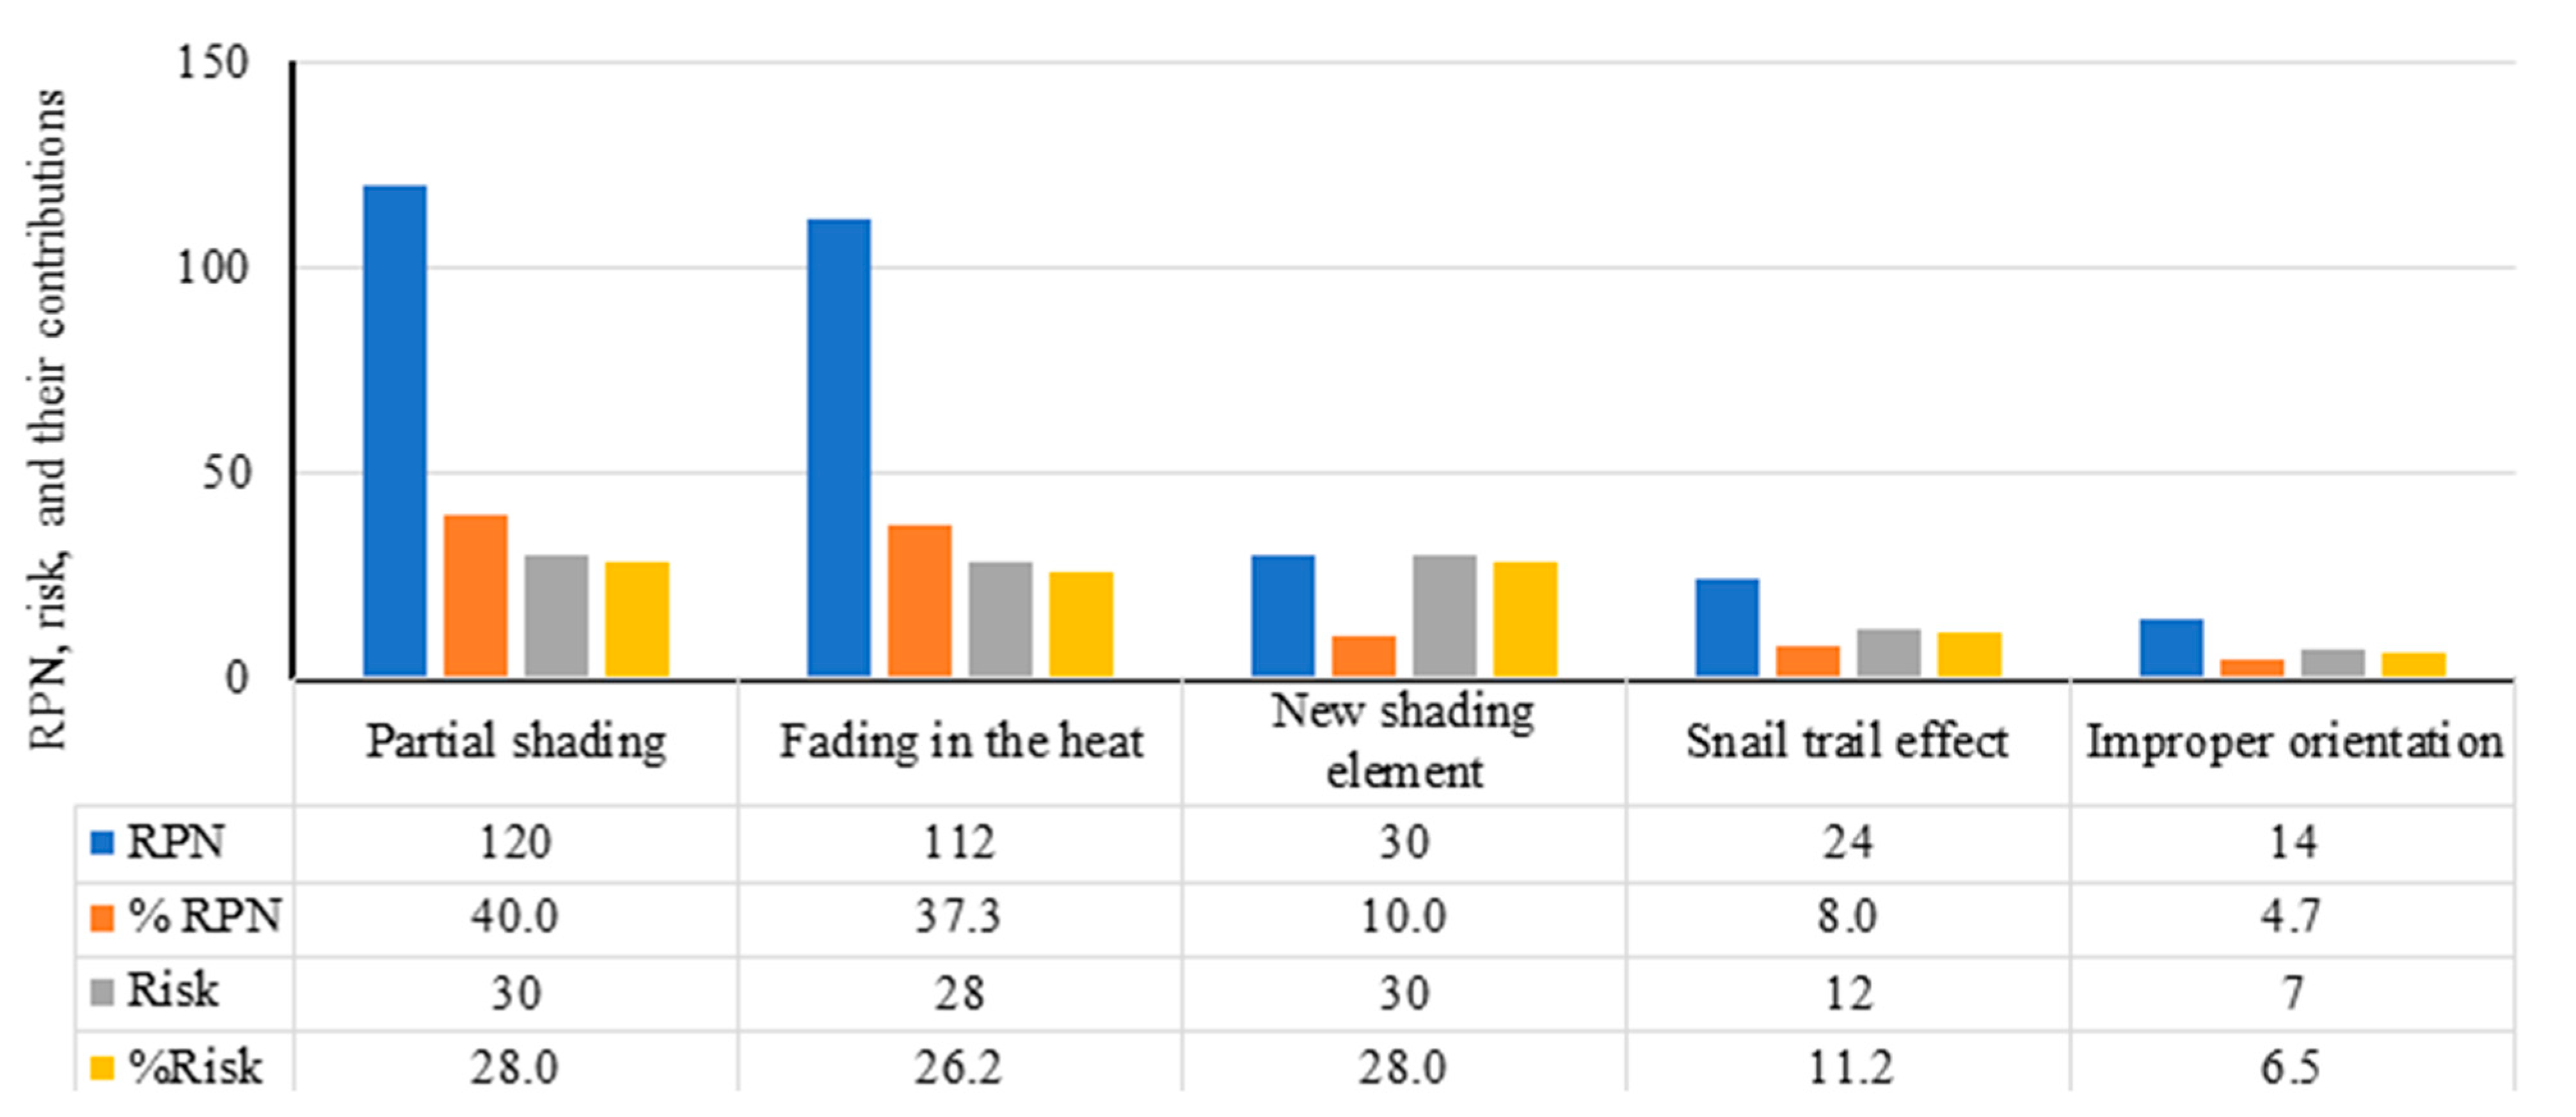
| Other failures | 300 | ||||||
| Partial shading | Reduction in energy output | 5 | Improper installation; site selection | 6 | Visual inspection; output power data | 4 | 120 |
| Fading in the heat | Reduced open circuit voltage | 7 | Weak PV modules; charge controller failure | 4 | Selective shading test; charge controller field test | 4 | 112 |
| Increase in new shading element | Power output reduction | 5 | Proposed obstruction | 6 | Visual inspection | 1 | 30 |
| Snail trail effect | Reduction in energy output | 3 | Accumulation of dust, pollen, and debris on the panels | 4 | Visual inspection; I–V measurement; EL measurement | 2 | 24 |
| Improper tilt angle/improper orientation | Reduction in energy output | 7 | Geographical location data not available | 1 | Weather data use | 2 | 14 |
Disclaimer/Publisher’s Note: The statements, opinions and data contained in all publications are solely those of the individual author(s) and contributor(s) and not of MDPI and/or the editor(s). MDPI and/or the editor(s) disclaim responsibility for any injury to people or property resulting from any ideas, methods, instructions or products referred to in the content. |
© 2024 by the authors. Licensee MDPI, Basel, Switzerland. This article is an open access article distributed under the terms and conditions of the Creative Commons Attribution (CC BY) license (https://creativecommons.org/licenses/by/4.0/).
Share and Cite
Patil, R.B.; Khalkar, A.; Al-Dahidi, S.; Pimpalkar, R.S.; Bhandari, S.; Pecht, M. A Reliability and Risk Assessment of Solar Photovoltaic Panels Using a Failure Mode and Effects Analysis Approach: A Case Study. Sustainability 2024, 16, 4183. https://doi.org/10.3390/su16104183
Patil RB, Khalkar A, Al-Dahidi S, Pimpalkar RS, Bhandari S, Pecht M. A Reliability and Risk Assessment of Solar Photovoltaic Panels Using a Failure Mode and Effects Analysis Approach: A Case Study. Sustainability. 2024; 16(10):4183. https://doi.org/10.3390/su16104183
Chicago/Turabian StylePatil, Rajkumar Bhimgonda, Arun Khalkar, Sameer Al-Dahidi, Rita S. Pimpalkar, Sheetal Bhandari, and Michael Pecht. 2024. "A Reliability and Risk Assessment of Solar Photovoltaic Panels Using a Failure Mode and Effects Analysis Approach: A Case Study" Sustainability 16, no. 10: 4183. https://doi.org/10.3390/su16104183