Article

Analyzing Exchange Rate Effects on Trade: Empirical Evidence

by
Yosri Nasr Ahmed
1,
Mohamad Alnafissa
2,*,
Mosatafa M. Negm
3,
Yasmine Mohieeldin Gharieb
4,
Abdullah Algarini
5 and
Taghreed Abdel-Aziz Hassouba
4
1
Faculty of Agriculture, Cairo University, Cairo 12613, Egypt
2
Department of Agricultural Economics, King Saud University, Riyadh 11451, Saudi Arabia
3
Department of Agricultural Economics, Al-Azhar University, Cairo 11754, Egypt
4
Faculty of Economics and Political Sciences, Cairo University, Cairo 12613, Egypt
5
Economics Department, College of Business, Imam Mohammad Ibn Saud Islamic University, Riyadh 11564, Saudi Arabia
*
Author to whom correspondence should be addressed.
Sustainability 2024, 16(10), 4177; https://doi.org/10.3390/su16104177
Submission received: 28 March 2024 / Revised: 26 April 2024 / Accepted: 14 May 2024 / Published: 16 May 2024

Abstract

:
In this study, we aimed to find a fair exchange rate for Egypt, exploring how exchange rate policies affect the country’s economic growth and food security. We also sought to answer an important question for Egyptian policymakers: “Do current exchange rate policies help reduce Egypt’s trade deficit?”. We used two methods in our research: First, we applied the purchasing power parity (PPP) method to determine the equilibrium real exchange rate (ERER). Then, we combined the computable general equilibrium model (CGE) with the ERER value from the PPP method to observe how different sectors interact with the overall economy and understand how household incomes and poverty levels are related. Our findings showed that the fair exchange rate is EGP 38.5 per US dollar, according to the PPP method. This new exchange rate may significantly impact the Egyptian economy. Some impacts are positive, such as better real GDP, more exports, and fewer imports; however, these are minor and not significant. On the downside, it may lead to higher inflation, increased prices for goods, and reduced consumption. Moreover, this study highlights the importance of having balanced exchange rate policies that consider Egypt’s unique economic situations, and challenges and align with other economic policies. Experience and reality have shown that exchange rates alone are not the only solution.

1. Introduction

Classic economic dilemmas teach us that a country cannot have an open capital market, a fixed exchange rate, and an independent monetary policy simultaneously. Therefore, countries that want to manage their interest rates while allowing the free movement of international capital must let their currency exchange rates float [1]. Accordingly, several emerging economies have initiated structural adjustment reform programs emphasizing short-term stabilization reform [2]. In this context, countries facing financial difficulties often implement a new economic reform program dictated by the International Monetary Fund (IMF) to secure financial aid. In addition, the numerous macroeconomic reforms that the fund requires in exchange for such financing, referred to as ‘conditionality’, significantly affect the political and economic future of these nations and their households. IMF loan programs often come with austerity-focused conditions that aim to stabilize government debt but can worsen existing inequalities. The adoption of flexible exchange rate policies is one of these requirements. Meanwhile, exchange policy rates play a significant role in determining the proper path for the exchange rate and ensuring its stability. The primary objective of monetary policy is to maintain a stable exchange rate and promote economic growth, which affects foreign investment, foreign trade [3], unemployment, and gross domestic product (GDP) [4].
These conditions significantly impact agricultural commodities and food prices, which consequently reflect their spillover onto intra-country agricultural trade [5] flows in the food market [6].
Several studies have argued that exchange rate stability is essential to competitiveness in the agriculture industry and national economic stability, especially for developing countries, e.g., Egypt. In this regard, agriculture plays a vital role in Egypt’s economy, not only as a key contributor to employment and the country’s GDP but also as a cornerstone of livelihood for a large segment of the population. Considering that about 62–64% of Egyptians live in rural areas and engage directly or indirectly in agriculture, this sector is fundamental to sustaining the livelihoods of many residents. Its importance extends beyond mere economic contributions as agriculture is crucial to poverty reduction and ensures food security in Egypt.

A Historical Review of Exchange Rate Liberalization and Its Impact on the Egyptian Economy

Exchange rate liberalization has had a significant impact on the Egyptian economy over the years. This policy shift, which involves allowing the market to determine the value of the national currency against foreign currencies, has been implemented at various points in Egypt’s history. This section of the paper provides a historical overview of the liberalization of exchange rates and its impact on the Egyptian economy.
Egypt has experienced significant changes in nominal and real exchange rates as part of its liberalization process since the early 1990s. In July 1990, as part of an agreement with the International Monetary Fund (IMF), the official exchange rate of the Egyptian pound was adjusted from EGP 1.1 per USD to EGP 2 per USD to facilitate the restructuring agreement. In 1991, the Egyptian government initiated a comprehensive program for structural adjustment and economic reform known as the Program of Economic Reform and Structural Adjustment. This program was aimed at liberalizing the economy and enhancing economic stability. Following the successful implementation of the economic reform program, exchange rates remained stable over the subsequent decade. However, in 2003, the Egyptian pound depreciated against the USD by 23.3%, marking a significant shift. Despite this depreciation, exchange rate stability was maintained throughout 2003/2004, with a decrease in the USD exchange rate of 2.7% during that period. The Egyptian pound appreciated in value against the US dollar, reaching an exchange rate of EGP 5.80 per USD 1.00. While the liberalized exchange rate led to higher inflation rates of 15.9% and 16.1%, as measured by the Wholesale Price Index (WPI) and Consumer Price Index (CPI) respectively, it also resulted in a rise in international reserves. Foreign reserves increased from USD 14.8 billion in June 2004 to USD 22.4 billion in February 2006, indicating a strengthening of the country’s foreign exchange position [7,8].
Over time and in the wake of the 25 January 2011 revolution, the Egyptian pound was floated against foreign currencies, including the US dollar, in a managed float. This led the Central Bank of Egypt to adjust the official EGP rate downwards. During the fiscal year 2015/2016, the budget deficit increased to approximately 12.2% from 11.5% the previous year. Additionally, external public debt service (medium and long term) rose to EGP 5.2 billion in the same period, and domestic public debt reached around EGP 2116.4 billion in June 2015. Egypt’s external debt reached around EGP 46 billion, or roughly 87% of GDP in 2015.
To curb the budget deficit, reduce public debt, reform the subsidy system, and improve government spending, Egypt took a significant step in November 2016 by liberalizing its exchange rate. This move was part of a broader economic reform effort and was tied to a USD 12 billion loan from the IMF. The goals of the reforms were multifaceted: curb import demand, prevent random import practices, boost exports, stimulate investment, and strengthen the Central Bank’s capacity to support essential imports.
Despite these measures, the value of the US dollar continued to rise against the Egyptian pound, leading to further devaluations. For example, the US dollar reached a rate of EGP 19.51 in December 2016, compared to EGP 8.88 at the start of the floating period. Inflation soared from 14% in July 2016 to nearly 33% in July 2017. Meanwhile, external debt rose to EGP 79 billion in June 2017, a 41% increase from EGP 56 billion the previous year [9].
The economy experienced a period of stability over the next four years, with the exchange rate stabilizing around EGP 15.8 per USD 1.00. However, global events such as the Russian–Ukrainian crisis in 2022 impacted Egypt and prompted further devaluation of the Egyptian pound. By the end of the second quarter of 2022, the exchange rate declined to around EGP 24 per USD 1.00 and further to approximately EGP 30 per USD 1.00 by the end of the year [10].
Thus, a persistent trade imbalance has led to the continuous devaluation of the Egyptian pound against foreign currencies. This situation, primarily fueled by the country’s trade deficit, has caused the exchange rate to rise over time. The currency’s depreciation directly impacts food security given, Egypt’s heavy reliance on food imports to satisfy domestic demand [11,12,13,14]. As the exchange rate falls, the cost of importing food increases, leading to higher food prices. Therefore, vulnerable groups experience greater difficulty accessing affordable food, exacerbating food insecurity and malnutrition issues [15]. Additionally, a weaker currency affects the global competitiveness of Egyptian agricultural exports, potentially reducing the country’s export capabilities and limiting its efforts to rectify the trade deficit.
In this regard, for agricultural countries such as Egypt, a means of overcoming the large trade deficit between agricultural exports and imports is important. As agricultural trade tools, exchange rate strategies play a major role in economic development [9,16], especially after Egypt launched an ambitious economic reform program to become one of the largest global economies by 2050. In this regard, there are fewer literature reviews on international agri-food trade than studies focusing on other determinants of agri-food exports or examining the relationship between exchange rate volatility and the performance of the country’s agricultural exports [16,17,18,19,20,21,22]. Considering the exchange rate’s volatile effect on total and agricultural trade flows, these studies have not reached a consensus, according to their results. One group supports the hypothesis that the exchange rate and its volatility hurt agricultural trade volumes. The other group found that the exchange rate either positively or negatively impacted agricultural exports. Thus, existing research on exchange rate policies for Egyptian agricultural output will add to previous reviews given the following elements:
In general, previous studies lack several points, such as: (1) No study has claimed to answer the important question of: “What is a fair exchange rate in Egypt?”; (2) previous studies have not examined the quantitative effect of exchange rate policies on macro- and micro-economic indicators. Although the necessity of exchange rate stability is well-acknowledged, the quantitative effect of these policies on the economy is still underexplored, which is essential for policymaking; (3) most of the literature has not analyzed the effects of exchange rate policies on inflation, consumption, and trade, particularly agricultural trade. Furthermore, they do not compare exchange rate policies’ effects on inflation and consumption or agricultural trade; (4) understanding the effects of exchange rate devaluation on Egyptian food security is essential for designing effective policies and interventions. Exploring strategies that promote balanced agricultural trade, enhance agricultural productivity, and mitigate the negative consequences of exchange rate devaluation on Egyptian households’ food availability, affordability, and accessibility is imperative.
Building upon the aforementioned points, this study was designed to accomplish several key objectives. Firstly, we determined the most suitable exchange rate for Egypt. Secondly, we aimed to assess the potential economic repercussions of exchange rate policies on the country’s economic growth and food security. Thirdly, we addressed a pivotal question for Egyptian policymakers: “Are the existing exchange rate policies sufficiently effective in mitigating Egypt’s trade deficit?”.
To achieve the desired objectives, the quantitative analysis in this study was based on two stages: determining the fair exchange rate using PPP and employing the CGE model. This model effectively captures the potential impacts of exchange rate policies on various economic indicators. This combined approach enabled a thorough examination of the interactions within the economy and shed light on exchange rate policies’ potential effects on different segments of households.
The rest of the article is structured as follows: Section 2 offers a concise outline of the methodology and data. In Section 3, we present future simulations. Section 4 is dedicated to exploring policy implications. Section 5 encompasses the conclusion and recommendations.

2. Modeling Approach and Description of the Database

2.1. Description of the Model

Fluctuations in the exchange rate profoundly influence the entire economic landscape, spanning production, consumption, and trade. Consequently, it profoundly impacts the welfare of both rural and urban communities, influencing income distributions and household demographics [23]. Hence, scholars, economists, and policymakers alike are captivated by the concept of the equilibrium real exchange rate (ERER), especially with the latest devaluation of the Egyptian pound against the USD.
Edwards (1989) explained that the rationale behind ERER misalignment was that maintaining a “wrong” level of ERER for an extended period is detrimental to a country’s competitiveness and economic performance. Given the significance of real exchange rate misalignment, a vast amount of theoretical and empirical literature has been written on the methodologies used to estimate this misalignment in various countries, such as [24,25,26]. Meanwhile, other studies have attempted to quantify misalignment effects on trade flows or economic growth, particularly for less-developed nations [27,28,29]. However, in the context of this study, we opted to assess the influence of the recent dramatic shift in the Egyptian pound value. Our interest is not only heightened by estimating the equilibrium real exchange rate but also in quantifying the impact of this recent devaluation on some economic fundamentals.
Accordingly, we used two consecutive sub-methodologies in this study. The first was the PPP method, which has been widely used in literature related to international economic theory, to estimate the ERER in both developing and developed nations. The second was the dynamic CGE model was designed [30] to capture the connections between sectoral and national economic growth and the relationship between household income and poverty [31].
Moreover, several reasons were responsible for addressing this approach in our study: firstly, it is the most compatible approach with available data from Egypt; secondly, it can result in specific figures for REER, which is typically required to complete the CGE journey; thirdly, despite some criticism, it is considered a more reliable approach in a vast range of literature. It has been intensively used to calculate estimates in the empirical literature.

2.1.1. Equilibrium Real Exchange Rate

This study estimated the ERER in Egypt for 2022 Q1–Q4. The primary reason for selecting this sample period was that the devaluation of the Egyptian pound strongly affected the population, especially economic sectors in this period. In this context, some mathematical calculations were conducted to estimate monthly ERER [32,33,34]:
eppp = NER × PUS/PEg
where, NER is the nominal exchange rate, and PUS and PEg are relative prices between the USA and Egypt.
Following the PPP approach:
e*ppp = e*0 × {(PEg/P0Eg)/(PUS/P0US)
Based on the same purchasing power parity methodology, we consider the real equilibrium exchange rate as the real exchange rate at a certain point in time. It can represent the difference between the inflation rates of two countries of interest or the average difference between inflation rates in a group of countries of interest.
Hence, the observation of e*0 is not accurately clear in the Egyptian context; the last equation is modified to be
e*ppp = e* + {(INFEg) − (INFUS)}
These specific calculations are not tied to the USA only but also to all of Egypt’s main trade partners. They include factors affecting the value of the exchange rate and the weights of Egypt’s main trading partners aligned with CBE data, which adjusts for inflation rates.
e*ppp = e* + (INFEg) − (INFWAMain Partners)
For more scrutiny [35], according to the purchasing power parity theory and based on the idea of the long-term imbalance, it is possible to measure the equilibrium real exchange rate using the average of the three highest values, calculated using the weighted inflation rates with the main trade partners:
e ppp = { ( j 3 MAX e ppp / 3 )
Relying on the CBE and World Bank data, we proceeded with the previously illustrated steps to obtain an ERER estimate for 2023 at around EGP 38.5 per USD 1.00.

2.1.2. The CGE Model

CGE models were used in the second part of our methodology. CGE models offer distinct benefits when analyzing complex economic policy reforms. Globally, CGE models are widely employed for empirical analysis in the field of economics. These models can be categorized as either static or dynamic. Comparative static models are employed to examine a particular economic timeframe [36]. Dynamic models enable a more precise evaluation of both short- and long-term policy shocks. Several non-linear equations define the behavior of various agents and constraints in the model. CGE models comprise several blocks: production, commodity markets, factor markets, institutions, and macroeconomic balances (As shown in Figure 1). Furthermore, the model includes features pertaining to the structure of production goods and the actions of various agents.
In this model, the production sectors operate under the assumption of profit maximization, employing multi-nested constant elasticity of substitution (CES) functions within a two-tiered production process. At the primary level, the output follows a Leontief input–output structure, encompassing both value-added and intermediate consumption. At the secondary level, a constant elasticity of substitution (CES) function delineates the substitution dynamics between composite labor and capital.
Households are categorized by occupation, with the model accounting for three income sources: labor income (comprising salaries and wages), capital income, and transfers from various institutional sectors (including households, firms, the government, and the rest of the world). Household income is allocated to taxes, transfers to other institutions, consumption, and savings.
On the demand side, household consumption is modeled through a linear expenditure system type function derived from utility maximization under household budget constraints. Private business income is determined by the share of capital income allocated to firms by sector and transfers from other institutions. Following income tax deductions and dividends paid to other entities, the remaining income for the firm constitutes savings. Government income is sourced from direct taxes levied on households and businesses, import tariffs, indirect taxes on domestic sales, transfers from other institutions, and a portion of capital income. Government savings are calculated as government income minus consumption and transfers paid to other institutions [30].
The CGE model’s assumptions provide detailed information about the model and lend credibility to the results. Additional information about the model’s assumptions can be found in Appendix A.

2.2. Description of the Database

Initially, the purchasing power parity technique was based on the World Bank and trade economics data sources to extract data from Egypt’s main trade partner, where the Egyptian ER and inflation rates were obtained from CBE statistical data. Afterward, various scenarios were estimated, implemented, and simulated using General Algebraic Modeling System (GAMS 40) software. The model was finely calibrated using a sophisticated 2018/2019 social accounting matrix (SAM) constructed by the esteemed institutions of CAPMAS and IFPRI. This SAM integrated national income, input–output, the flow of funds, the balance of payments on current accounts, and household income and expenditure data, culminating in a comprehensive dataset.
The model is expressed as a set of simultaneous equations, encompassing both linear and non-linear elements, without an objective function. The equations capture the behavior of various agents, such as production (activities deftly fashioned into outputs using certain factors and intermediate inputs), consumption (by households and the government), investment (private and public), trade, and other government revenue and expenditure activities. The aforementioned factors are assumed to represent the initial equilibrium position of the Egyptian economy and provide numerical values for several parameters of the analytical model [37]. Moreover, the model can translate observed economic and demographic trends into nuanced shifts in income distributions and household poverty, accurately capturing the essence of the economy’s structure and functionality. Although the model spans from 2019 to 2025, we only focused on 2022–2025 as the implementation period.
The model divided the Egyptian economy into 62 distinct sectors partially related to agriculture and agro-processing systems [23]: 20 agriculture, 11 agro-processing, 2 trading and transport, and 29 industrial and service sectors. These sectors include fertilizer, water, machinery, and vehicles used as intermediate inputs in agriculture or agro-processing.

3. Policy Simulations

Apart from the Egyptian economy, determining an appropriate exchange rate policy that can cope with internal and external changes while maintaining a global impact is challenging. All governments experience this policy dilemma due to its critical impact on different fronts of economic development measures (sectoral, micro, and macro levels). Therefore, the impact of a devalued national currency in Egypt—clearly resulting from PPP estimates—should be discussed since the estimate coincides with what occurs nationally. Therefore, the expected output from CGE will provide vital signs for policymakers on a sectoral or general level.
The exchange rate estimate of the PPP technique was 38.5 L. E per USD for 2023, followed by two other shocks for 2024 and 2025 if the exchange rate continues at the same levels. Then, we used the new exchange rate values mentioned above to simulate the impact of devaluation with the CGE model. A wide range of outcomes was produced for different economic variables in the Egyptian economy. However, our study was limited to its research question. Afterward, we analyzed their impact on the economy from the perspective of GDP, inflation rate, commodity pricing, and food security in rural and urban households, as well as agri-trade (imports and exports).

4. Results

4.1. Baseline Scenario

At the outset, information on the future equilibrium benchmark under normal conditions was required to develop scenarios. The “business as usual” scenario epitomizes the reference trajectory for Egyptian economic growth, embodying steady-state equilibrium in the absence of any influential exogenous shocks. In other words, an imaginary baseline devoid of any changes in current policy. This scenario offers a comparative analysis of the baseline and the devaluation scenario for a devaluation scenario. The latter scenario posits the continuation of trends observed in 2019, extending its projections to 2025. Notably, the baseline does not assert itself as a definitive prediction but rather as an extension of past trends. Hence, it provides a prudent approximation of future trends and projections based on information available between 2019 and 2022, when the new liberalization era occurred.
Accordingly, this scenario considers all past trends as its main inputs for the period 2019–2025, as it relies on previous exchange rate data from 2022 (around EGP 24.3 on average in 2022). Hence, it assumes that exchange rate trends from 2022 will persist until 2025 at the same level as the exchange rate. To replicate the baseline, population and labor supply increase by 1.45% per year, cropland must expand by 1.0% per year, and capital stocks must accumulate at a rate of 3.0% per year. In the counterfactual baseline scenario (Figure 2: without exchange rate policies, the economy grows steadily at a long-term growth rate of 5.72%), the baseline simulation results obtained by the model were relatively consistent with official data published by the Ministry of Planning. The Ministry of Planning and Economic Development reported that GDP for 2020 was approximately EGP 5879 billion. Interestingly, the model’s estimation for the same year closely aligned with this figure, indicating a GDP of EGP 5723 billion. This finding suggests that the general equilibrium model effectively simulated approximately 97% of the Egyptian economy’s trajectory in 2020, indicating the model’s high quality and precision in simulating the Egyptian economy.

4.2. Simulation Scenario (the Impacts of Exchange Rate Devaluation Shocks)

Based on the baseline for 2019–2025, an exchange rate devaluation scenario was implemented, and its outcomes were juxtaposed with established outcomes. Within this context, existing literature highlights the importance of optimal simulations to describe the impact of continuous devaluation on key economic variables such as agricultural trade, consumption, and inflation.
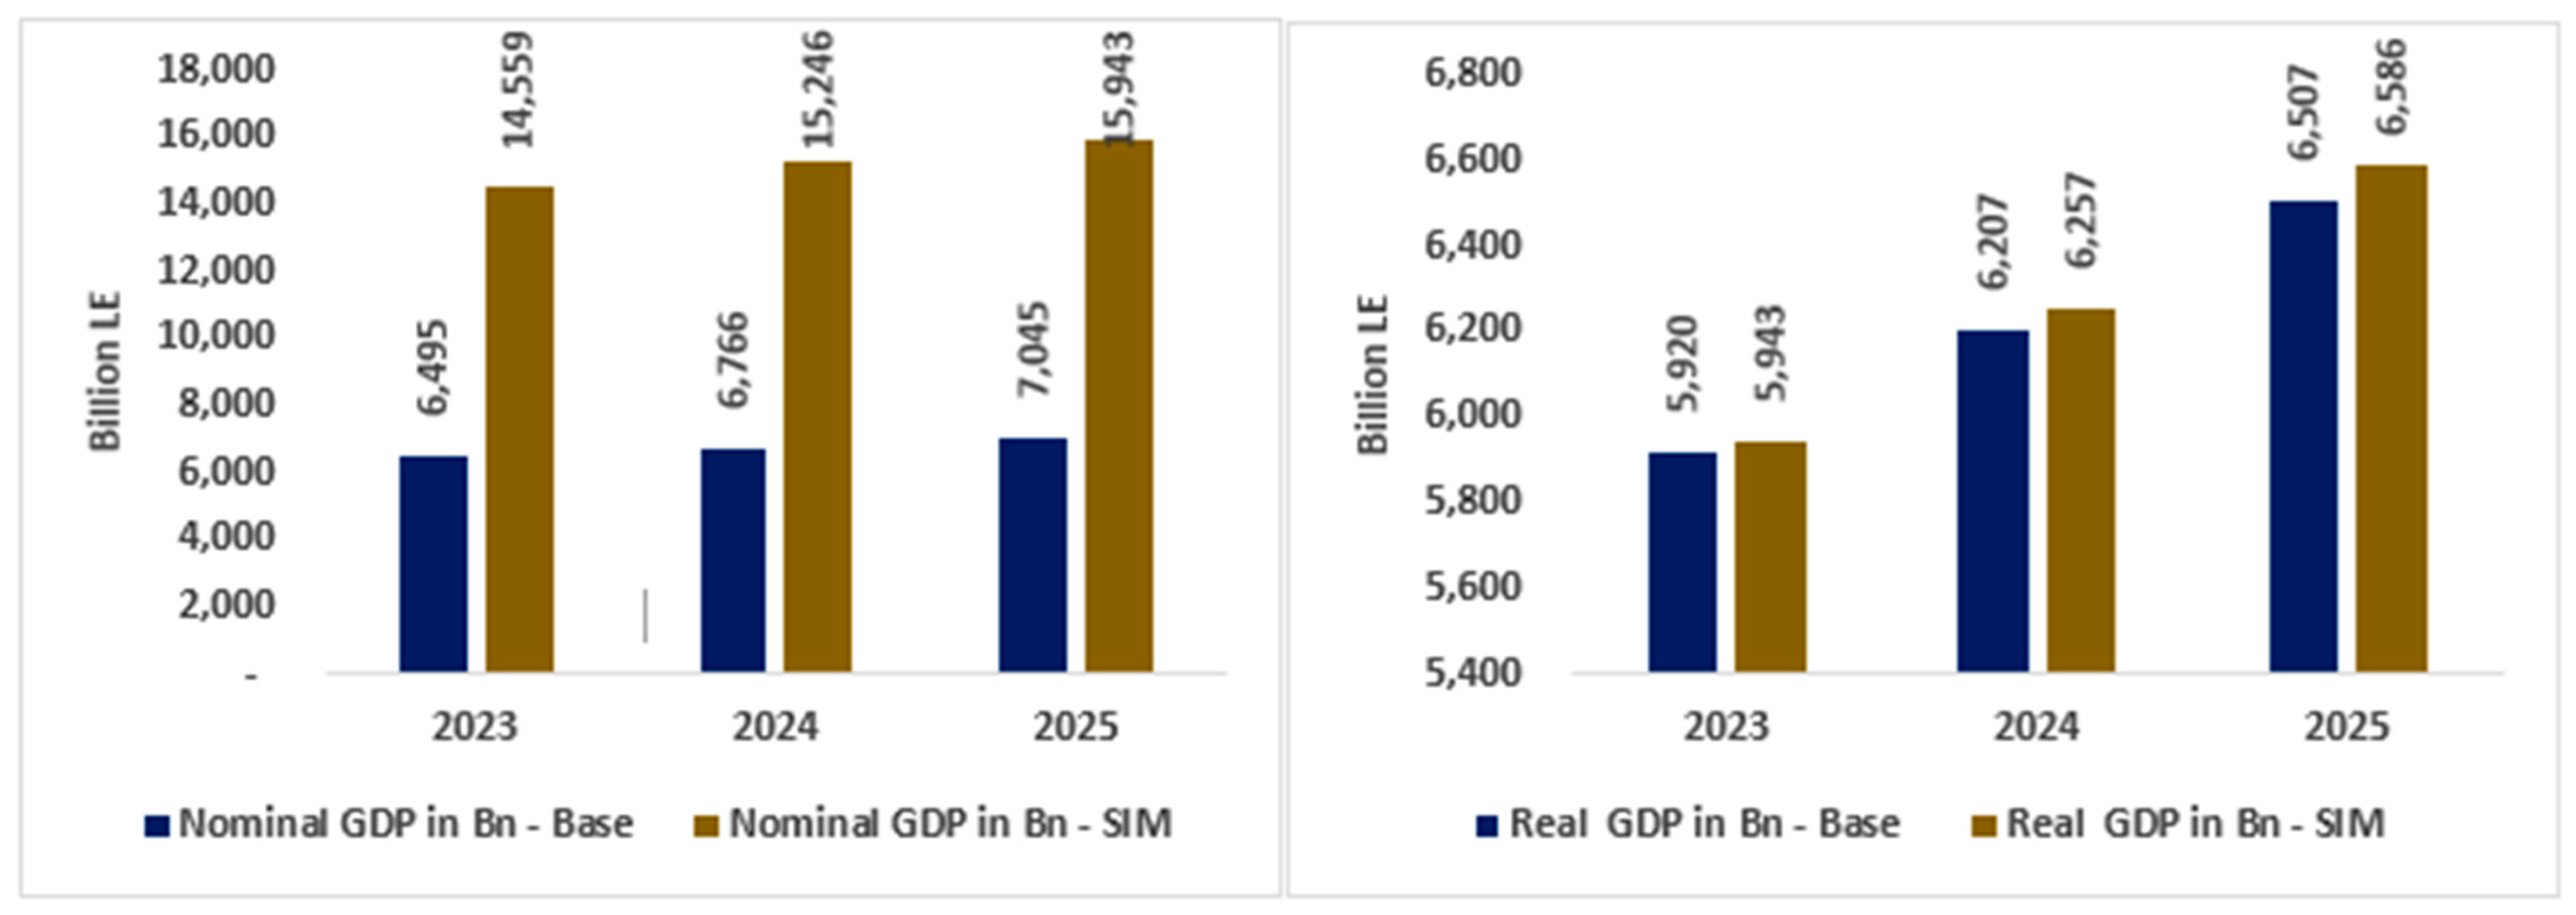
Specifically, the devaluation of the Egyptian currency (EGP) by 54% in 2023 compared to 2022 leads to a 124.1% increase in nominal GDP relative to the baseline, with further improvements in the Egyptian economy expected until 2025 (Figure 3, left side). However, as this increase is attributed to higher prices rather than actual production growth, a detailed analysis of real gross domestic product (GDP) is necessary to understand the true economic impact of currency devaluation on the Egyptian economy. This includes examining factors such as inflationary pressures, changes in consumption patterns, and shifts in domestic industry competition in the global market.
The results in Figure 3 (right side) show a slight improvement in real GDP (0.4% in 2023). Real GDP is projected to gain further benefits by 2025, with an increase of around 1.2% compared to the baseline. This modest growth is a result of the Egyptian economy’s limited ability to produce more goods and services. Thus, the modest growth rates in real GDP highlight the Egyptian economy’s limited ability to capitalize on a floating exchange rate, as the growth rates in real GDP remain relatively low.
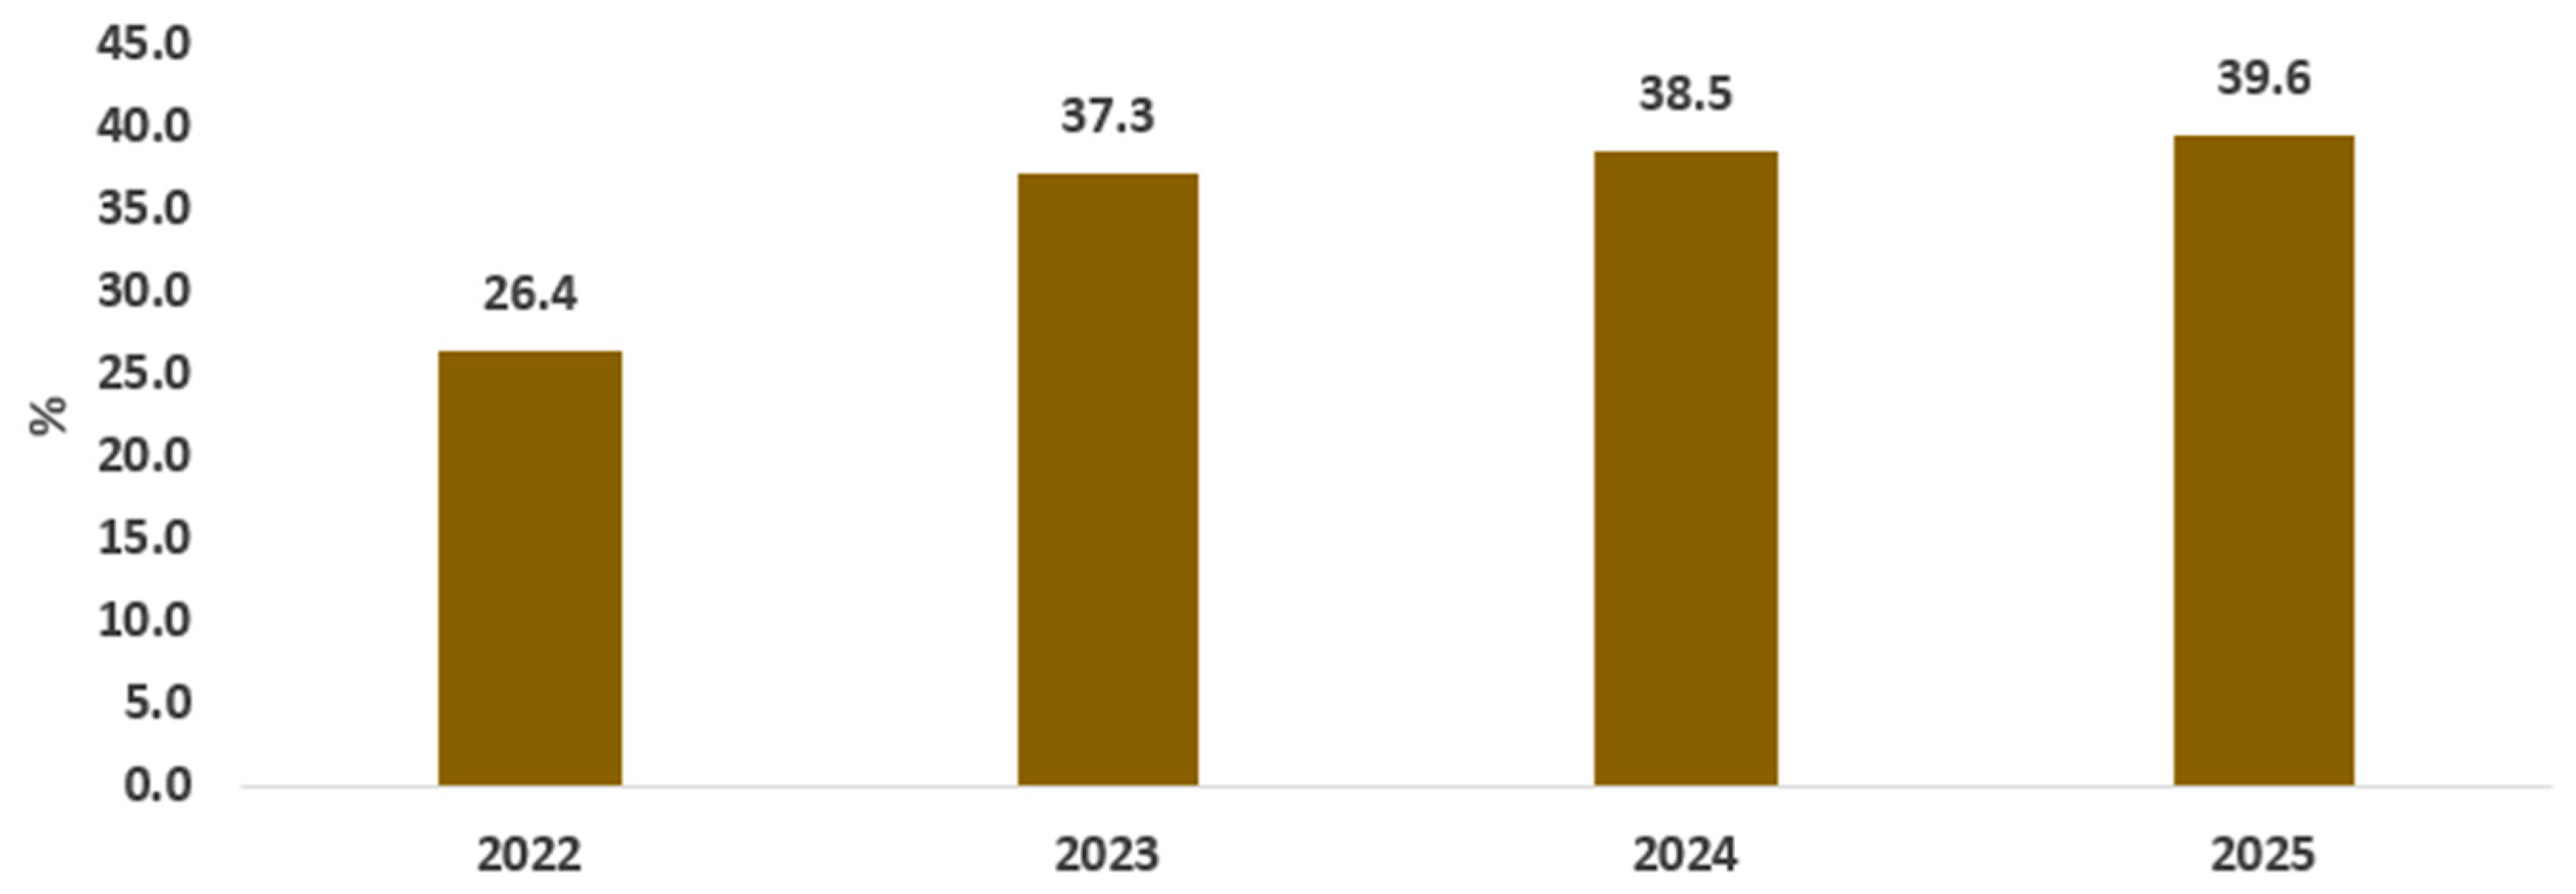
The modest improvements in real gross domestic product highlighted earlier are not expected to mitigate the adverse consequences of a fluctuating exchange rate, particularly rising price levels, as reflected by the inflation rate. Figure 4 depicts a pronounced increase in the inflation rate, reaching 37.3% in 2023 compared to approximately 7% in 2020. This surge can be attributed to Egypt’s status as a net importer. Devaluation of exchange rates leads to higher prices for imported goods and drives up inflation rates, which limits the population’s ability to access different commodities. These changes will ultimately cause reduced food security in Egypt. Our study will examine the effects of a fluctuating exchange rate on food commodity prices in greater detail afterward.
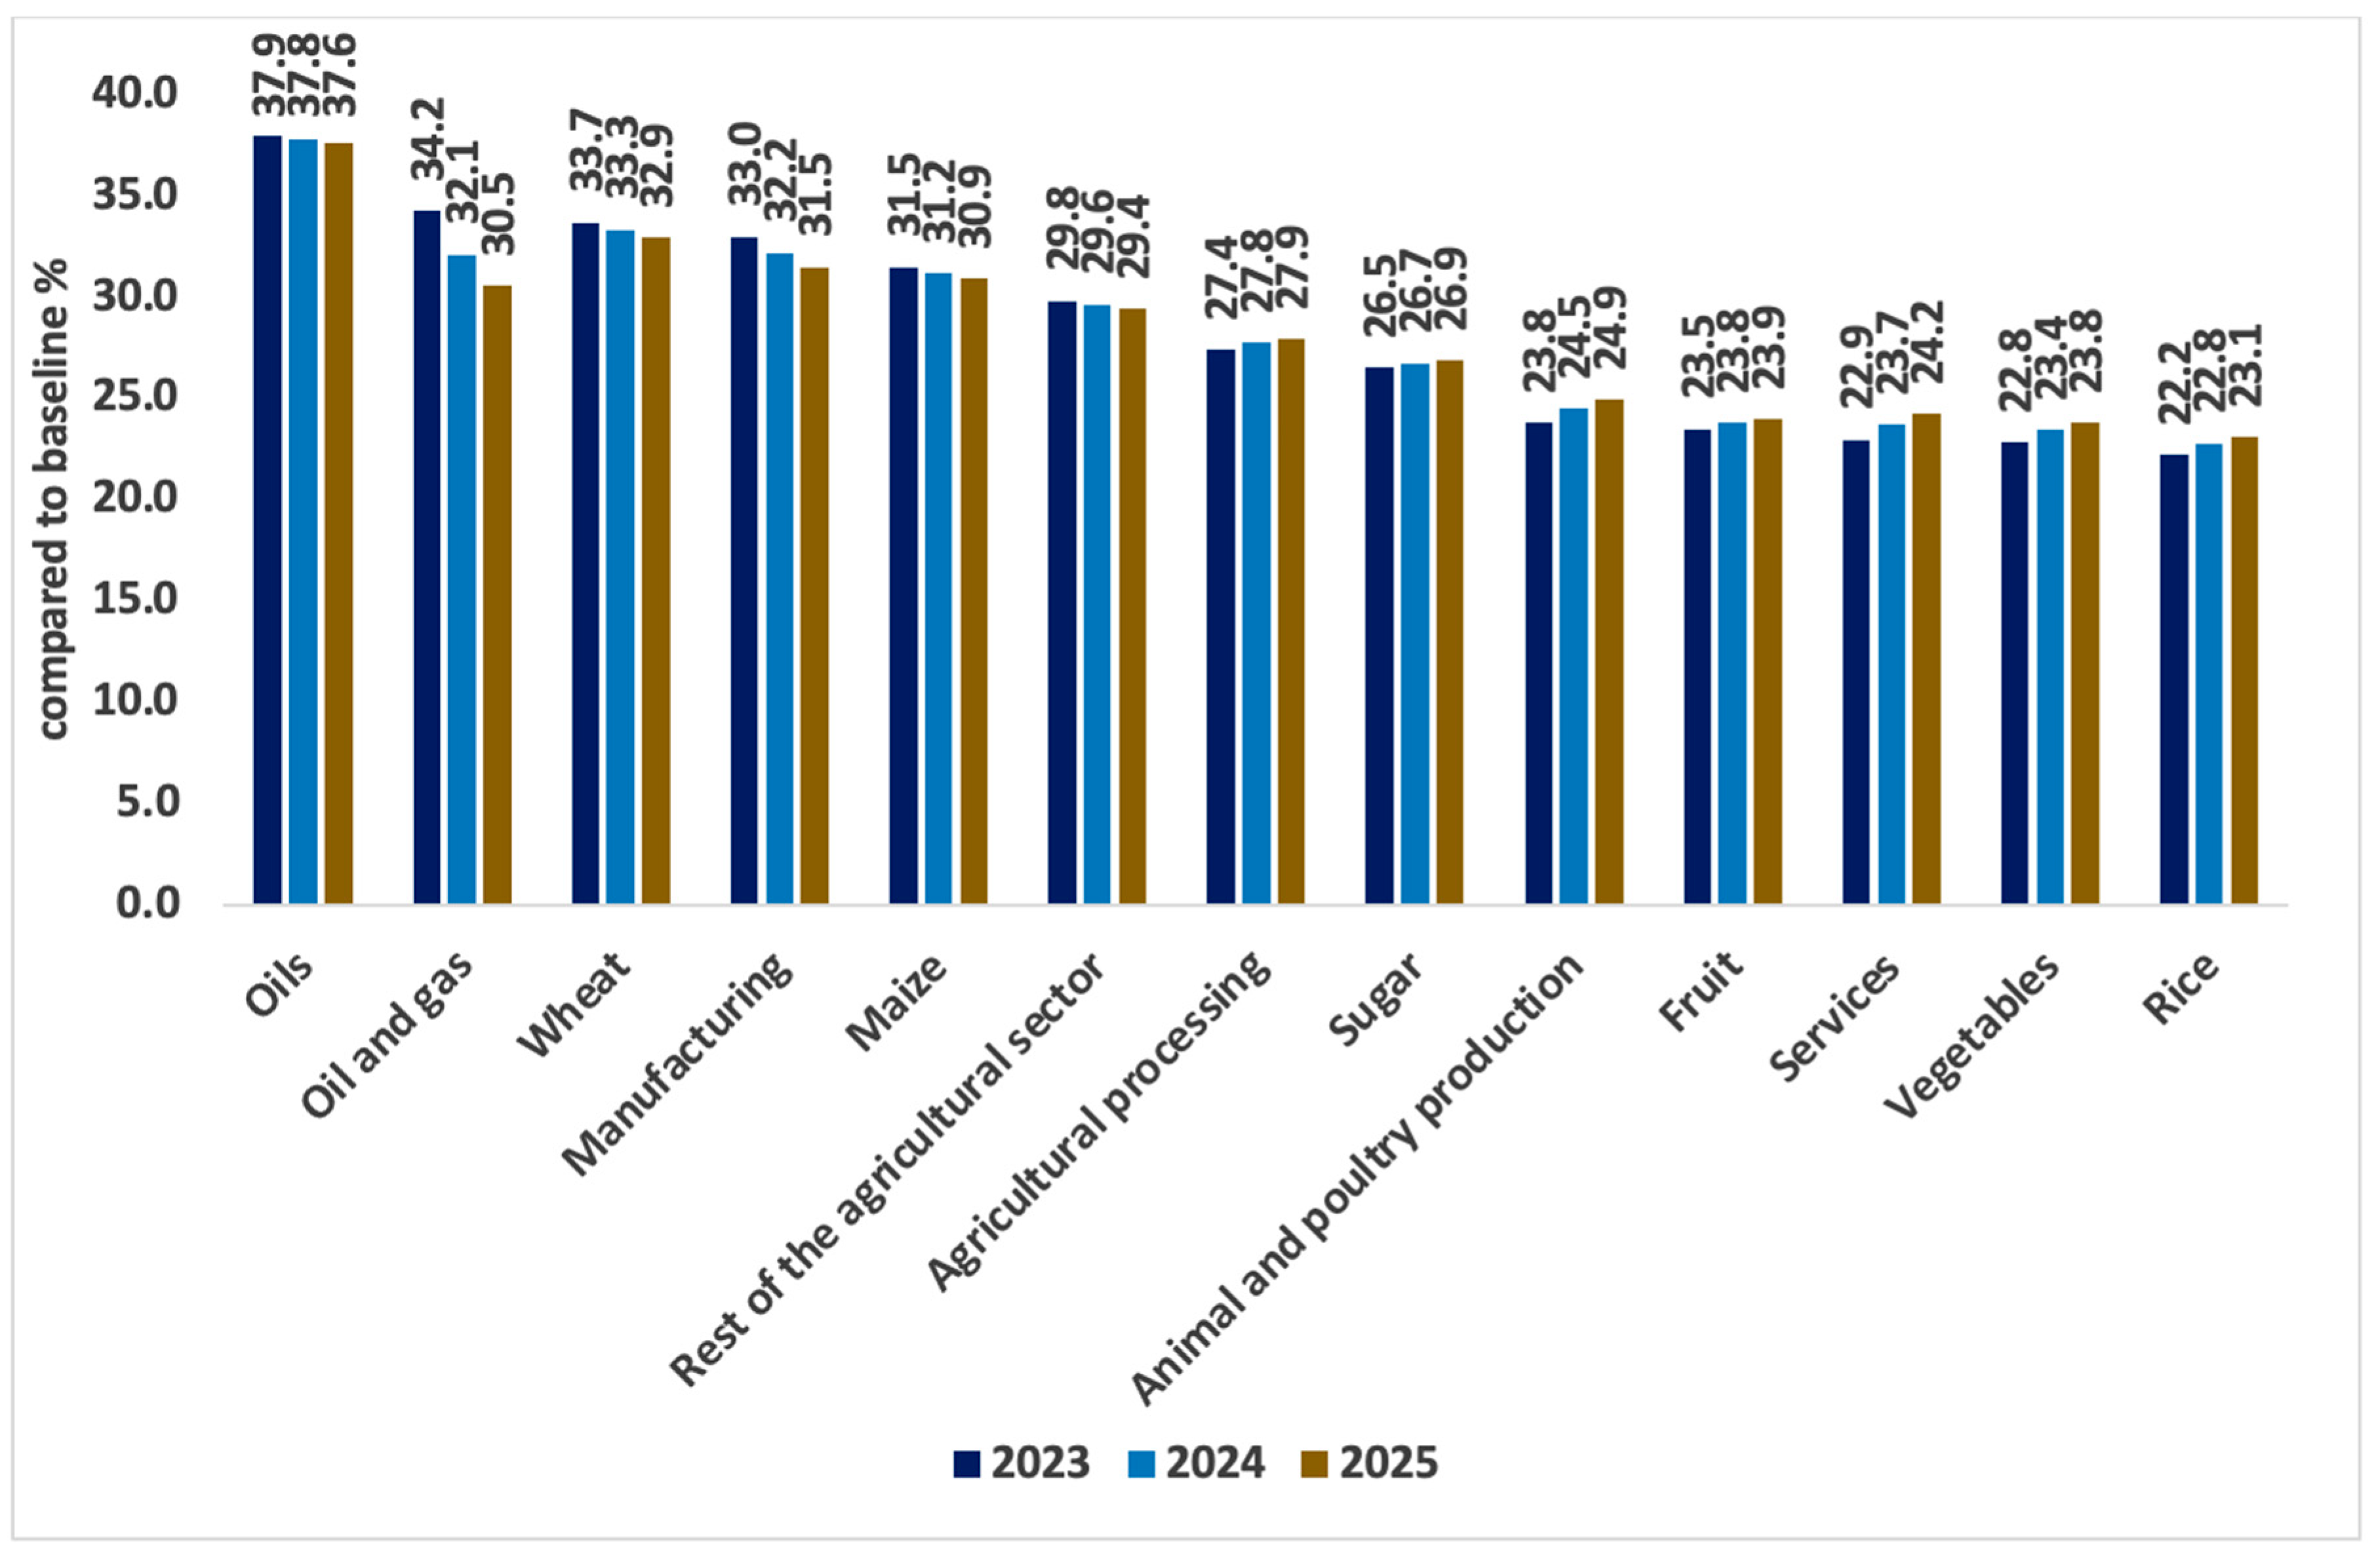
Figure 5 illustrates the impact of exchange rate devaluation on domestic commodity prices. Specifically, the oil price is projected to rise by approximately 37.9% in 2023 and increase further to 37.6% by 2025 compared to the baseline. This escalation is primarily attributed to Egypt’s reliance on imported oil. Similarly, the domestic prices of all agricultural commodities are expected to increase by varying degrees. Consequently, this trend will detrimentally affect food accessibility, which is a critical aspect of food security indicators.
Rising commodity prices are poised to impact consumption patterns, particularly due to the aforementioned price hikes coupled with fixed incomes. Table 1 provides insight into commodity-based consumption patterns by rural and urban households. Notably, certain commodities, such as rice, remain unaffected by these price fluctuations, as Egypt maintains self-sufficiency in rice production. This stability is particularly significant for rural households, major rice producers who typically retain a portion of their local production as stock. As a result, rice consumption by rural households remains insulated from exchange rate shocks and local price increases, as depicted in Figure 5.
Conversely, urban household consumption is expected to decline across most commodities. Urban households typically lack agricultural land, production capabilities, or stockpiles of agricultural commodities. Hence, they are more vulnerable to rising prices, leading to reduced consumption levels.
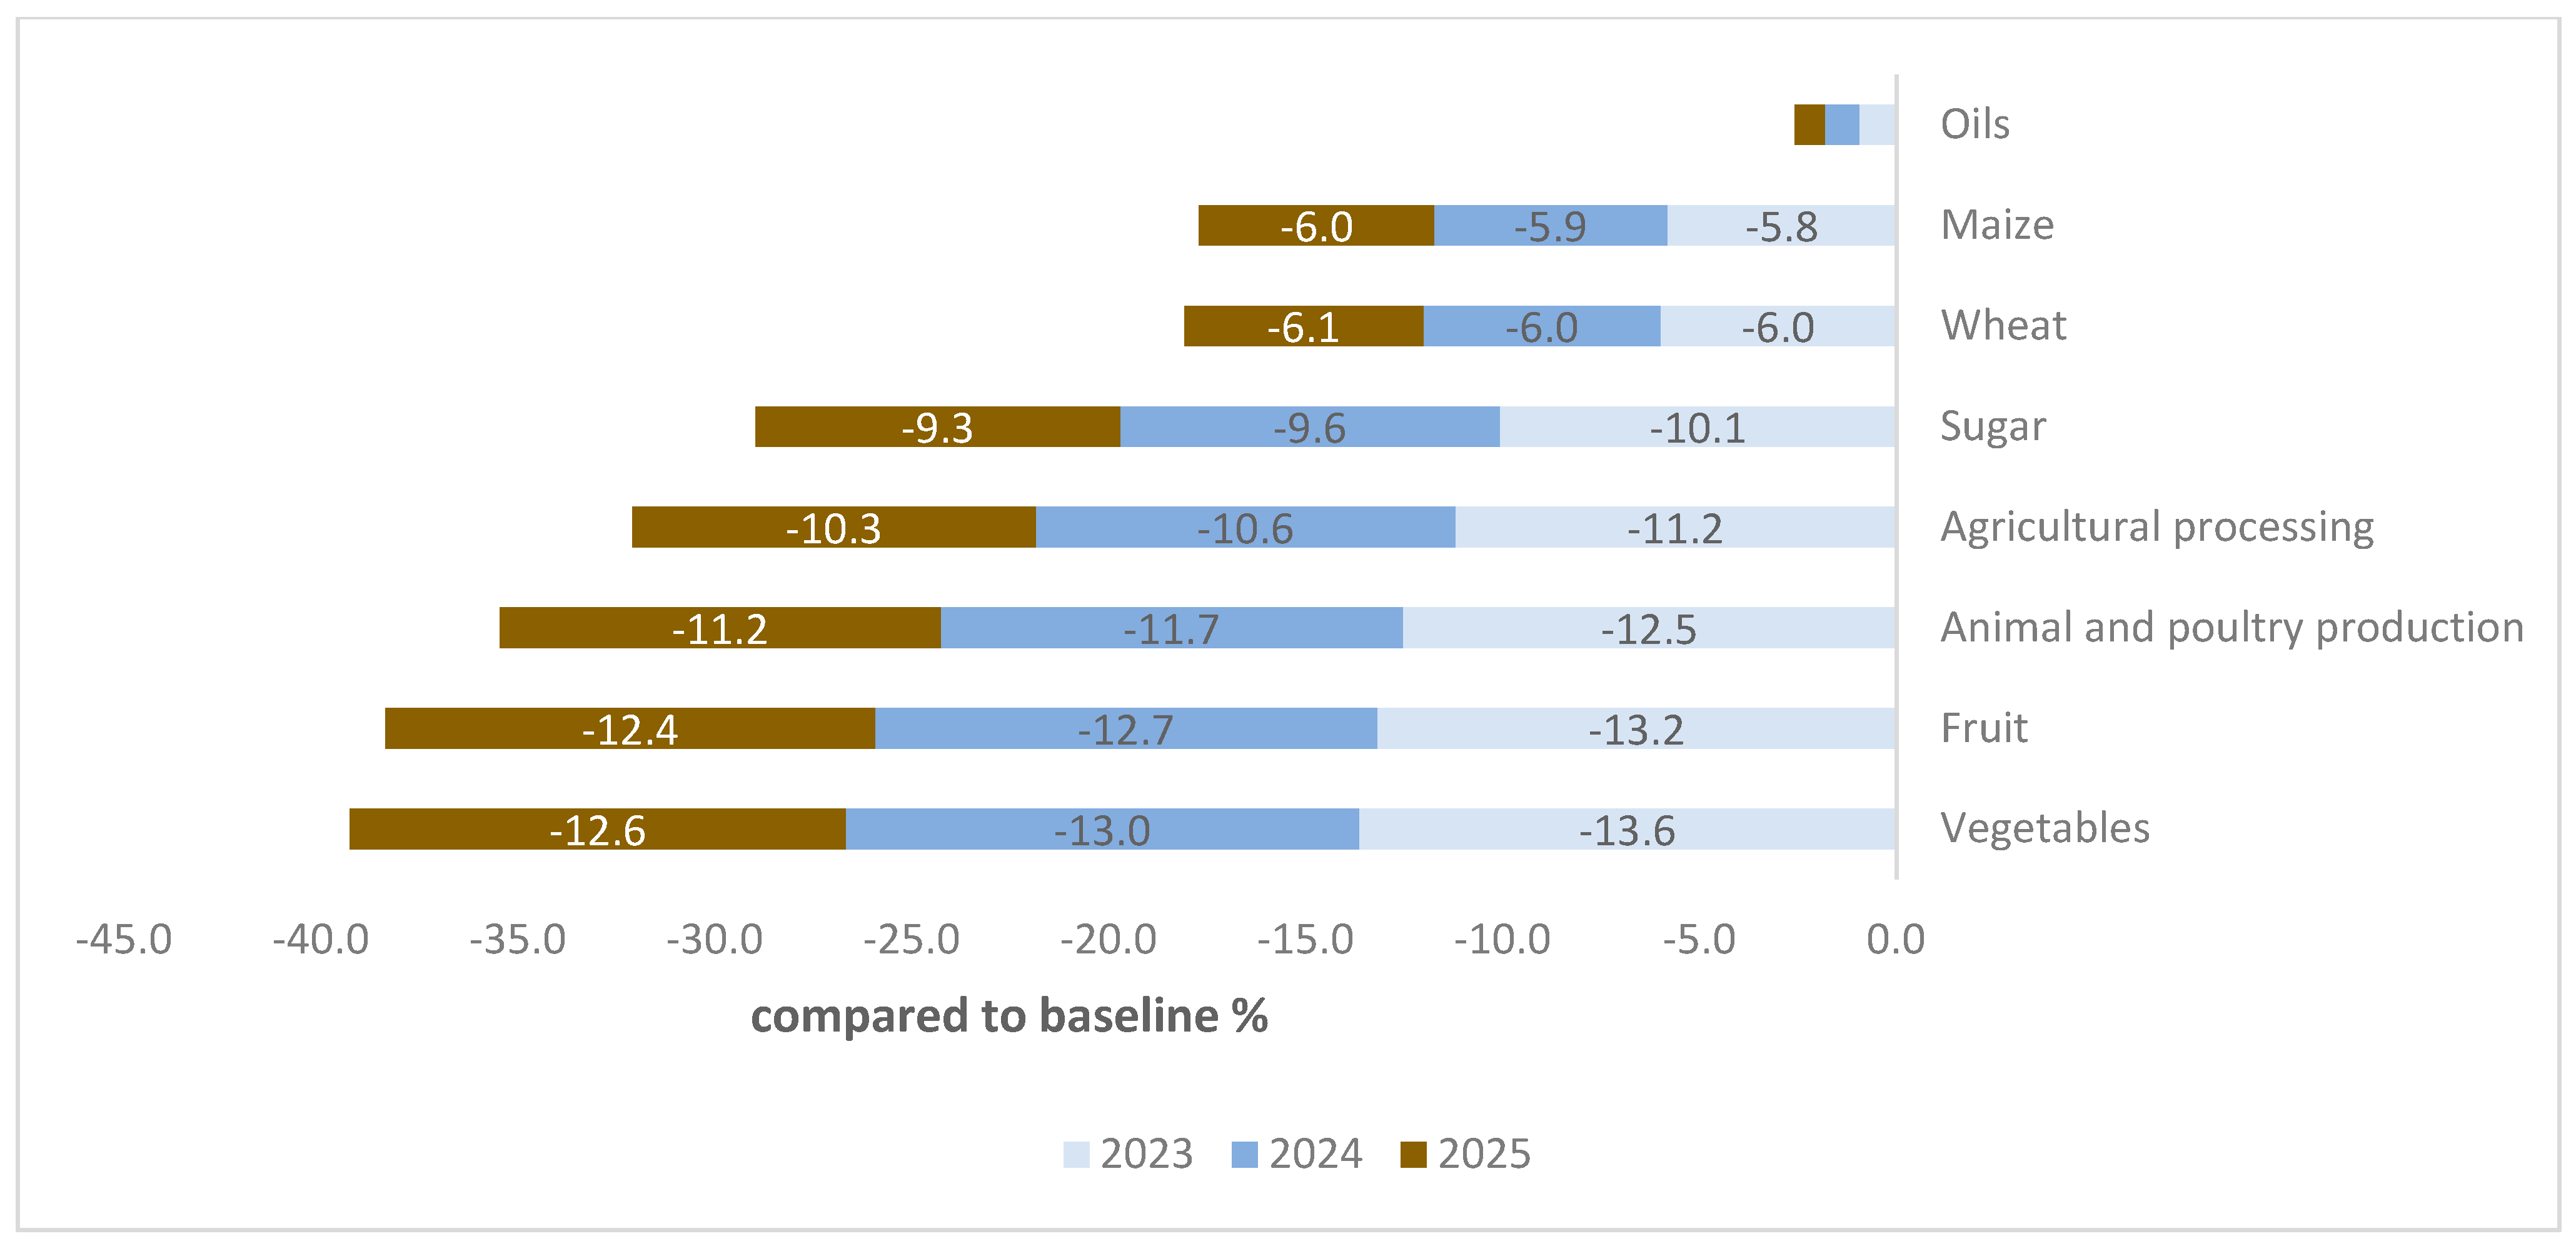
Due to devaluation policies, imports will become more costly when valued at a new exchange rate. Total imports are also anticipated to decrease, estimated at around 9.1% in 2023 and 8.7% in 2025. Notably, imports are projected to decrease across all the commodities analyzed, albeit to varying degrees, as depicted in Figure 6.
On the export front, lower prices for domestic commodities may enhance the competitiveness of Egyptian exports on international markets. As a result, Egypt is expected to experience a significant increase in total exports, projected at 7.1% in 2023 and 7.7% in 2025. Additionally, exports of nearly all crops are anticipated to rise compared to the baseline, as illustrated in Figure 7.
Despite reduced imports and a concurrent rise in exports, Egypt still has a persistent trade balance deficit. Despite adjustments to the exchange rate, the country’s trade balance remains imbalanced due to its limited capacity to produce a diverse range of goods or use this production to either decrease imports or boost exports. This dilemma underscores the ongoing challenges faced by the Egyptian economy in achieving trade balance equilibrium.
The findings suggest that devaluing the exchange rate offers some modest positive effects, including small increases in real GDP, total exports, and agricultural exports. However, these benefits are limited in their overall impact. These conclusions are consistent with earlier studies, such as Bradshaw and Orden’s (1990) [11] research on the positive relationship between exchange rates and agricultural exports, and Baek and Koo’s (2008) [12] work on macroeconomic linkages with the U.S. agricultural trade balance. Šimáková (2017) [14] also contributes to this understanding by examining the sensitivity of bilateral agricultural trade to exchange rate fluctuations.
On the other hand, the policy has caused substantial negative effects, most notably a sharp rise in inflation exceeding 37% and increased food prices. These increases have adversely impacted food security, particularly in terms of access to food. Overall, the negative consequences of exchange rate devaluation, particularly with respect to inflation and food security, outweigh the modest positive aspects. The findings on inflation partially align with Najafi Bousari et al.‘s (2024) [4] study.
Based on these results, the Egyptian government must implement social protection measures and programs to safeguard families from the negative impacts of exchange rate devaluation. Such initiatives are essential to mitigate the effects of inflation on food security, ensuring that vulnerable populations are protected from the consequences of exchange rate changes.

5. Conclusions

Recently, emerging economies have initiated structural adjustment reform programs focusing more on short-run stabilization. In this context, countries in financial distress normally adopt a new economic reform program sanctioned by the International Monetary Fund (IMF) to secure financial assistance. Moreover, the manifold macroeconomic reforms imposed by the fund in exchange for financial backing, referred to as ‘conditionality’, have significant ramifications on the political and economic trajectory of these countries and their households. One of these conditions includes adopting flexible exchange rate policies. Exchange rate policies play a significant role in determining the proper path for exchange rates and ensuring their stability. Therefore, maintaining a stable exchange rate is one of the main objectives of monetary policy. Several studies argue that exchange rate stability is essential to countries’ economic stability, especially developing ones, e.g., Egypt.
Consequently, the purpose of this study was to determine the appropriate exchange rate in Egypt and assess the potential economic effects of exchange rate policies on economic growth and food security in Egypt. In addition, we sought to answer an essential question for Egyptian decision-makers: “Are the current exchange rate policies sufficient enough to reduce the Egyptian trade deficit?”. Accordingly, we used two consecutive sub-methodologies. Firstly, we applied the purchasing power parity (PPP) method to determine the equilibrium real exchange rate (ERER). Then, we combined the computable general equilibrium model (CGE) with the ERER value from the PPP method to observe how different sectors interact with the overall economy and to understand how household incomes and poverty levels are related.
Based on the two methodologies mentioned above, our study results showed that a fair exchange rate is EGP 38.5 per USD 1.00, according to the PPP methodology. The new exchange rate will have positive economic repercussions for the Egyptian economy. There were some positive effects of devaluing the exchange rate, as this policy increased real GDP, total exports, and agricultural exports. However, this effect was simple and not significant according to the CGE model. As for negative effects, the inflation rate increased to more than 37%, leading to high prices for food commodities and a decrease in food security, especially food accessibility.
In conclusion, this study contributes to the existing literature by providing a comprehensive analysis of exchange rate changes in trade and food security in Egypt. Furthermore, these findings emphasize the need for a balanced approach to exchange rate policies that consider the specific economic conditions and challenges of the country. It is also important to ensure consistency with other economic policies in the Egyptian economy since experience and reality indicate that exchange rates are not the only solution. Future research can explore the potential impacts of alternative exchange rate policies and identify specific measures to enhance agricultural trade flows and improve food security and economic growth in Egypt.
On the other hand, countries with similar economies considering the implementation of exchange rate liberalization policies, as was done in Egypt, must establish comprehensive social protection and support programs before initiating these policies. Such measures are essential to safeguard low-income households from the potential negative consequences of these policies.

Author Contributions

Conceptualization, Y.N.A. and M.M.N.; methodology, Y.N.A. and M.A.; software, Y.N.A.; validation, Y.M.G., A.A. and T.A.-A.H.; formal analysis, Y.N.A.; investigation, M.A. and A.A.; resources, M.M.N.; data curation, T.A.-A.H.; writing—original draft preparation, Y.N.A.; writing—review and editing, Y.N.A., M.A., M.M.N., Y.M.G. and T.A.-A.H.; visualization, M.M.N.; supervision, T.A.-A.H.; project administration, M.M.N.; funding acquisition, M.A. All authors have read and agreed to the published version of the manuscript.

Funding

This research was funded by Researchers Supporting Project number (RSPD2024R932), King Saud University, Riyadh, Saudi Arabia.

Data Availability Statement

The datasets generated during and/or analysed during the current study are not publicly available but are available from the corresponding author on reasonable request.

Acknowledgments

The authors would like to extend their sincere appreciation to the Researchers Supporting Project Number (RSPD2024R932), King Saud University, Riyadh, Saudi Arabia.

Conflicts of Interest

The authors declare no conflict of interest.

Appendix A

PEP-1-t is a computable general equilibrium (CGE) model designed to study economies, including their policies and structural changes as well as their interactions with the rest of the world. The model focuses on the dynamics of economies over time and is a useful tool for analyzing economic policies in various countries. Here are the key assumptions underlying the PEP-1-t CGE model:
Representative Agents: The model assumes the presence of representative agents for each sector, such as households, firms, and government, each with their own specific behaviors and objectives (e.g., utility or profit maximization).
Perfect Competition: All markets in the model are assumed to be perfectly competitive, with many buyers and sellers, and no single agent can influence market prices.
Intertemporal Dynamics: PEP-1-t incorporates a time dimension, allowing for the analysis of the economy’s evolution over time and the dynamic effects of policies.
Rational Expectations: Economic agents in the model are assumed to have rational expectations, meaning they use available information to form expectations about future economic conditions and make decisions accordingly.
Price Flexibility: Prices of goods and services, including wages and interest rates, are assumed to be flexible and adjust to equate supply and demand in each market.
External Sector Interaction: The model includes trade with the rest of the world and incorporates international trade flows and balances, making it suitable for open economy analysis.
Technology and Productivity: The model includes assumptions about technological progress and productivity changes, influencing the overall output and efficiency of sectors, particularly in terms of total factor productivity (TFP).
Government Policy: The model incorporates the impact of government policies such as taxes, subsidies, tariffs, and government spending, and their influence on different sectors and the economy as a whole.
Household Behavior: Households are assumed to maximize utility, subject to their budget constraints. They allocate income across consumption and savings, influencing consumption patterns and investment.
Firm Behavior: Firms are assumed to maximize profits given their production functions and constraints. This includes decisions about inputs, outputs, and investments.
Constant Elasticity of Substitution (CES) Functions: The model uses CES functions to describe production and consumption relationships, providing flexibility in representing substitutability between inputs and outputs.
Capital Accumulation: The model includes capital accumulation dynamics, allowing for changes in the capital stock over time through investment and depreciation.
Market Clearance: All markets in the model are assumed to be clear, meaning supply equals demand in every market.
These assumptions provide a structured framework for analyzing economic policies and dynamics using the PEP-1-t CGE model. While the model can be a powerful tool for studying economic systems, the assumptions may simplify complex real-world scenarios, and the model’s results should be interpreted with this in mind.

References

  1. Oskolkov, A. Exchange rate policy and heterogeneity in small open economies. J. Int. Econ. 2023, 142, 103750. [Google Scholar] [CrossRef]
  2. Eldeep, C.; Zaki, C. On the unfinished business of stabilization programs: A CGE model of Egypt. Middle East Dev. J. 2023, 15, 66–100. [Google Scholar] [CrossRef]
  3. Pargaru, I.; Andra, M.; Vasilescu, R.A.; Platagea, G.S.; Dinu, M. Consequences of choosing the exchange rate regime on international trade. In Proceedings of the 30 Years of Economic Reforms in the Republic of Moldova: Economic Progress via Innovation and Competitiveness, Chișinău, Moldova, 24–25 September 2021; pp. 57–64. [Google Scholar]
  4. Najafi Bousari, B.; Akbari Moghadam, B.; Hadizadeh Mirkelaei, A.; Bayat, N. Impact of exchange rates and inflation on GDP: A data panel approach consistent with data from Iran, Iraq and Turkey. Int. J. Nonlinear Anal. Appl. 2024, 15, 311–325. [Google Scholar]
  5. Abimbola Oyinlola, M.; Adeniyi, O.; Theophilus Kumeka, T. Dependence between foreign trade performance and exchange rate volatility: Panel ARDL approach. Croat. Rev. Econ. Bus. Soc. Stat. 2023, 9, 1–15. [Google Scholar] [CrossRef]
  6. Mousavi, S.; Leelavathi, D. Agricultural export and exchange rates in India: The granger causality approach. Int. J. Sci. Res. Publ. 2013, 3, 1–8. [Google Scholar]
  7. The World Bank Annual Report 2003. In World Bank Annual Report; The World Bank: Washington, DC, USA, 2003. [CrossRef]
  8. The World Bank Annual Report 2006. In World Bank Annual Report; The World Bank: Washington, DC, USA, 2006. [CrossRef]
  9. Research Department-Central Bank-General-Annual Report and Balance Sheet-Governor’s Report-Drafts and Correspondence-Reserve Bank Annual Report-White Copy for Presentation to Parliament; Reserve Bank of Australia: Sydney, Australia, 30 September 2021.
  10. Mohamed, M. The Effect of Fiscal and Monetary Policy on Public Debt in Egypt. Master’s Thesis, The American University in Cairo, New Cairo, Egypt, 2024. [Google Scholar]
  11. Bradshaw, G.W.; Orden, D. Granger causality from the exchange rate to agricultural prices and export sales. West. J. Agric. Econ. 1990, 15, 100–110. [Google Scholar]
  12. Baek, J.; Koo, W.W. Identifying Macroeconomic Linkages to U.S. Agricultural Trade Balance. Can. J. Agric. Econ./Rev. Can. D’agroecon. 2008, 56, 63–77. [Google Scholar] [CrossRef]
  13. Chebbi, H.E.; Olarreaga, M.; Zitouna, H. Trade openness and CO2 emissions in Tunisia. Middle East Dev. J. 2011, 3, 29–53. [Google Scholar] [CrossRef]
  14. Šimáková, J. Assessing exchange rate sensitivity of bilateral agricultural trade for the Visegrad countries. Outlook Agric. 2017, 46, 195–202. [Google Scholar] [CrossRef]
  15. The World Bank Annual Report 2022. In World Bank Annual Report; The World Bank: Washington, DC, USA, 2022.
  16. Abu Hatab, A.R. Impact of Exchange Rate Volatility on The Performance of Egyptian Agricultural Exports Using A Vector Error Correction Model. J. Agric. Econ. Soc. Sci. 2016, 7, 793–801. [Google Scholar] [CrossRef]
  17. Shabsigh, G.; Domaç, I. Real Exchange Rate Behavior and Economic Growth: Evidence From Egypt, Jordan, Morocco, and Tunisia. IMF Work. Pap. 1999, 99, 1. [Google Scholar] [CrossRef]
  18. Achy, L.; Sekkat, K. The European Single Currency and MENA’s Exports to Europe. Rev. Dev. Econ. 2003, 7, 563–582. [Google Scholar] [CrossRef]
  19. Hatab, A.A.; Romstad, E.; Huo, X. Determinants of Egyptian Agricultural Exports: A Gravity Model Approach. Mod. Econ. 2010, 1, 134–143. [Google Scholar] [CrossRef]
  20. Bahloul, A.Q.M.M. The Egyptian Trade Policy Strategy of Development and The Global Trading System in The WTO Era. Egypt. Assoc. Agric. Econ. 2012, 22, 302–311. [Google Scholar]
  21. Massoud, A.A.; Willett, T.D. Egypt’s Exchange Rate Regime Policy after the Float. Int. J. Soc. Sci. Stud. 2014, 2, 1–16. [Google Scholar] [CrossRef]
  22. Zaki, C.; Abdallah, A.; Sami, M. How Do Trade Margins Respond to Exchange Rate? The Case of Egypt1. J. Afr. Trade 2019, 6, 60–80. [Google Scholar] [CrossRef]
  23. Benfica, R.; Cunguara, B.; Thurlow, J. Linking agricultural investments to growth and poverty: An economywide approach applied to Mozambique. Agric. Syst. 2019, 172, 91–100. [Google Scholar] [CrossRef]
  24. Doroodian, K.; Jung, C.; Yucel, A. Estimating the equilibrium real exchange rate: The case of Turkey. Appl. Econ. 2002, 34, 1807–1812. [Google Scholar] [CrossRef]
  25. Etta-Nkwelle, M. The Effects of Overvalued Exchange Rates on the Export Competitiveness of Less Developed Countries: Evidence from the Communaute Financiere Africane (CFA); ProQuest: Ann Arbor, MI, USA, 2007. [Google Scholar]
  26. Bénassy-Quéré, A.; Béreau, S.; Mignon, V. Robust estimations of equilibrium exchange rates within the G20: A panel BEER approach. Scott. J. Political Econ. 2009, 56, 608–633. [Google Scholar] [CrossRef]
  27. Razin, O.; Collins, S. Real Exchange Rate Misalignments and Growth; National Bureau of Economic Research: Cambridge, MA, USA, 1997. [Google Scholar]
  28. Bouoiyour, J.; Rey, S. Exchange Rate Regime, Real Exchange Rate, Trade Flows and Foreign Direct Investments: The Case of Morocco. Afr. Dev. Rev. 2005, 17, 302–334. [Google Scholar] [CrossRef]
  29. Toulaboe, D. Real exchange rate misalignment and economic growth in developing countries. Southwest. Econ. Rev. 2011, 33, 57–74. [Google Scholar]
  30. Decaluwé, B.; Lemelin, A.; Robichaud, V.; Maisonnave, H. PEP-1-t. In Standard PEP Model: Single-Country, Recursive Dynamic Version, Politique Économique et Pauvreté/Poverty and Economic Policy Network; Université Laval: Québec, QC, Canada, 2013. [Google Scholar]
  31. Diao, X.; Thurlow, J.; Benin, S.; Fan, S. Strategies and Priorities for African Agriculture: Economywide Perspectives from Country Studies; Intl Food Policy Res Inst: Washington, DC, USA, 2012. [Google Scholar]
  32. Abdelgany, M. Determinants of Real Exchange Rate Evidence: From Egypt. J. Politics Econ. 2020, 7, 1–22. [Google Scholar] [CrossRef]
  33. Feyzioglu, T. Estimating the Equilibrium Real Exchange Rate: An Application to Finland. IMF Work. Pap. 1997, 97, 1. [Google Scholar] [CrossRef]
  34. Hosni, R.; Rofael, D. Real exchange rate assessment in Egypt: Equilibrium and misalignments. J. Econ. Int. Financ. 2015, 7, 80. [Google Scholar]
  35. Krugman, P.R.; Obstfeld, M. International Economics: Theory and Policy; Pearson Education: London, UK, 2009. [Google Scholar]
  36. Dixon, P.; Rimmer, M. Forecasting with a CGE Model: Does It Work? Centre of Policy Studies; IMPACT Centre Working Papers G-197; Victoria University: Melbourne, Australia, 2009. [Google Scholar]
  37. Raouf, M.; Randriamamonjy, J.; Engelke, W.; Kebsi, T.A.; Tandon, S.A.; Wiebelt, M.; Breisinger, C. Regionalized Social Accounting Matrix for Yemen: A 2014 Nexus Project SAM; Intl Food Policy Res Inst: Washington, DC, USA, 2019; Volume 21. [Google Scholar]
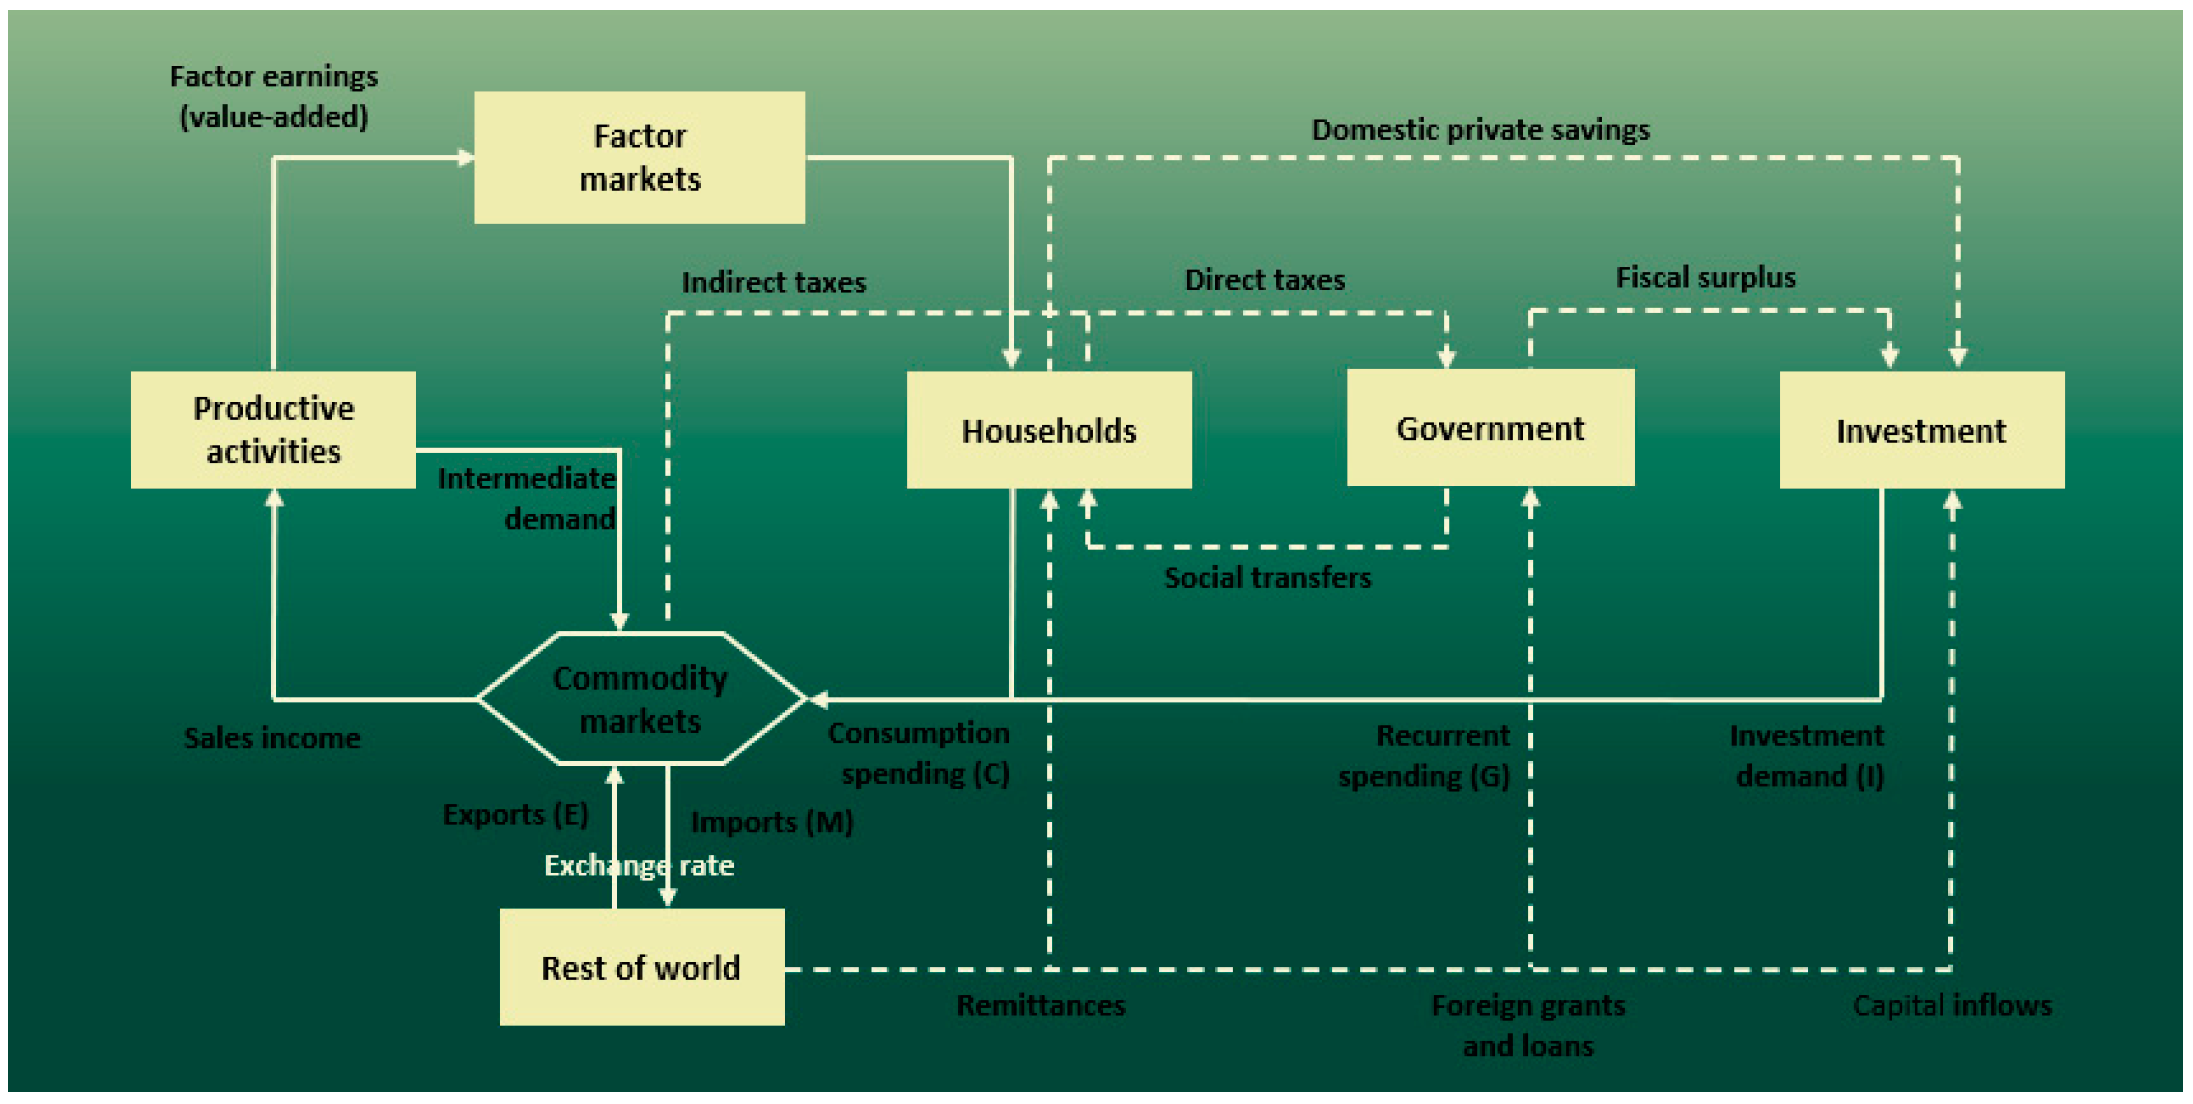
Figure 1. Circular flow model of economic activity.
Sustainability 16 04177 g001
Figure 2. GDP (billion EGP). Source: results of the CGE model.
Sustainability 16 04177 g002
Figure 3. Nominal and real GDP (billion EGP). Source: results of the CGE model.
Sustainability 16 04177 g003
Figure 4. Inflation rate (%). Source: results of the CGE model.
Sustainability 16 04177 g004
Figure 5. Changes in price by commodity type (deviations from baseline growth path by percentage). Source: results of the CGE model.
Sustainability 16 04177 g005
Figure 6. Changes in agri-imports by commodity type (deviations from baseline growth path by percentage). Source: results of the CGE model.
Sustainability 16 04177 g006
Figure 7. Changes in agri-exports by commodities (deviations from baseline growth path by percentage). Source: results of the CGE model.
Sustainability 16 04177 g007
Table 1. Changes in household consumption of commodities (deviations from baseline growth path by percentage).
Rural HouseholdsUrban Households
202320242025202320242025
Maize−1.64−1.34−1.07−1.97−1.65−1.37
Rice0.320.480.67−0.050.130.33
Wheat−2.11−1.79−1.51−2.42−2.09−1.80
Oils−1.35−1.05−0.78−1.70−1.39−1.10
Vegetables0.190.340.51−0.20−0.030.16
Fruit0.050.280.50−0.35−0.110.13
Animal and poultry production0.000.200.45−0.57−0.35−0.08
Oil and gas−3.39−2.33−1.51−3.91−2.84−2.00
Manufacturing−3.09−2.44−1.87−3.63−2.96−2.38
Services0.250.420.62−0.35−0.140.09
Source: results of the CGE model.
Disclaimer/Publisher’s Note: The statements, opinions and data contained in all publications are solely those of the individual author(s) and contributor(s) and not of MDPI and/or the editor(s). MDPI and/or the editor(s) disclaim responsibility for any injury to people or property resulting from any ideas, methods, instructions or products referred to in the content.