Article

Tracer Gas Method Evaluation for Assessing the Energy Potential of Biogas from Chicken Farms in the Canary Islands

by
María Asensio-Ramos
1,*,
Gladys V. Melián
1,2,
Eleazar Padrón
1,2,
Pedro A. Hernández
1,2,
Nemesio M. Pérez
1,2 and
José Luis Peraza Cano
3
1
Instituto Volcanológico de Canarias (INVOLCAN), 38400 Puerto de la Cruz, Spain
2
Instituto Tecnológico y de Energías Renovables (ITER), 38611 Granadilla de Abona, Spain
3
Independent Researcher, 38900 Valverde, Spain
*
Author to whom correspondence should be addressed.
Sustainability 2024, 16(10), 4168; https://doi.org/10.3390/su16104168
Submission received: 20 April 2024 / Revised: 8 May 2024 / Accepted: 14 May 2024 / Published: 16 May 2024
(This article belongs to the Section Sustainable Agriculture)

Abstract

:
Biodigestion in farming and agriculture offers environmental and economic benefits, but investing in biodigesters carries real-world risks for enterprises. This study analyzes methane (CH4) emissions from a poultry farm biodigester in Tenerife Island, Canary Islands, Spain, conceptualized as a right-angled prism measuring 45 m wide, 25 m long, and 12 m tall, with an internal volume of approximately 13,500 m3. Using a Neon tracer gas technique, CH4 emission rates were quantified in situ during two surveys in February 2021 and October 2022, capturing seasonal variability in ambient conditions. Biogas analysis was performed using a portable micro-gas chromatograph in less than 5 min, revealing stable CH4 production rates of approximately 200 kg·d−1 (~310 m3·d−1) and 330 kg·d−1 (~500 m3·d−1) for the two experiments, respectively. The composition of biogas indicated CH4 concentrations of around 38–43%, with the remaining composition consisting of carbon dioxide (19–26%), nitrogen (36–27%), oxygen (7–4%), and trace amounts of other gases. A comparison with a theoretical model showed a good correlation. This approach enhances biodigester investment attractiveness by enabling enterprises to optimize efficiency promptly. The obtained data were used to estimate the energy potential of biogas from chicken farms in the Canary Islands.

Graphical Abstract

1. Introduction

The world’s largest poultry meat producer is the United States of America, with 18.0% of global output, followed by China, Brazil, and the Russian Federation [1]. Regarding the European Union, Spain is the second-largest producer of chicken meat behind the United Kingdom, with 11.8% of the total production. In Spain, the productive evolution tends to stabilize around one million tonnes per year, with a slight supply deficit that is mainly covered with imports from the countries of the community environment [2].
Due to the huge consumption demand, manure production has also increased [3]. In fact, one of the main problems of intensive poultry farms is the elimination of waste, such as animal waste, feed scraps, dead skin, feathers, etc., without causing environmental pollution. There are different ways to manage this problem, such as the use of these wastes as fertilizer to recycle nutrients (nitrogen, potassium, and phosphorus), as livestock feeding or bioenergy production [4]. Despite this last possibility, their biodegradable nature and their large volumes have increased interest in studying their potential to obtain energy by combustion, gasification, pyrolysis, etc. [5] and help offset both cost and environmental footprint. Anaerobic digestion of chicken manure has traditionally attracted attention [4,6,7], but is very difficult to implement due to the high content of solids and heterogeneous nature of the digestate, as well as the inhibition of the methanogenic process due to high nitrogen (N2) and ammonia (NH3) concentrations [8].
In general, a digester of chemical wastes, or biodigester, consists of a closed container in which the organic material is deposited with a certain amount of water to be anaerobically digested, giving biogas. The composition of biogas is principally 55–70% methane (CH4) and 30–45% carbon dioxide (CO2), but also other gases such as 500–4000 ppmv hydrogen sulphide (H2S), 100–800 ppmv NH3, <1% hydrogen (H2), <1% N2, <1% oxygen (O2) and <1% water vapour) [9] and N-, P-, K-rich organic compounds. This so-produced biogas can be used as fuel, while the nutrient-rich digestate can be used as fertilizer [7,10]. The capacity of a biodigester to produce energy is normally evaluated in terms of the rate of CH4 production, since methanogenesis is considered a limiting step in the process [11]. Microorganisms, in particular methanogenic bacteria, or methanogens, are susceptible to changes in environmental conditions, and thus, anaerobic digestion requires careful monitoring of temperature (mesophilic: between 20 and 45 °C, or thermophilic: at higher temperatures–), type of raw material, the time that it remains in the digester, i.e., the hydraulic retention time (HRT) [12], nutrients and trace mineral concentration, pH, toxicity, and redox conditions. The determination of the composition and out-coming emissions of the biogas produced is of basic importance for optimizing the operational systems.
Tracer gas techniques are direct methods used to study the behaviour of a certain target gas. The basic method consists of introducing a certain amount of a gas designated as the tracer in the ambient, which replaces the target gas, allowing its study based on mathematical methods (NTP, 1994). These techniques have been applied principally to study ventilation performance in buildings [13,14,15], but also for other purposes. For instance, they have been employed to measure the CH4 emission from a feedlot by measuring directly in the animal rumen [16,17], CH4 in chambers where cows [18,19,20] or sheep [21] were fitted, N2O and CH4 in wastewater treatment plants [22], N2O, CH4 [23] and NH3 in a waste treatment facility [24] or volcanic CO2 from hydrothermal fumaroles [25].
Ideally, the tracer gas should not be present in the air, but if it is, its abundance should be orders of magnitude lower than the ones introduced to minimize uncertainties. In addition, it must be chemically stable and inert (especially with respect to any gases in the sample), and its use must not present any harm to human or animal health and security (low toxicity, non-explosive) [26]. Preferably, the tracer should be free of offensive odour. Although gases such as acetylene [22,23,24], ethene [23], N2O [19,23], propane [23], water vapour [27], CO2 or H2 [25] have been used as tracer gases on some occasions; the most common is sulphur hexafluoride (SF6) [13,14,16,17,18,21,25,28]. However, the use of alternative tracer gases is desirable since SF6 is a greenhouse gas. Noble gases have many properties of an ideal tracer gas [29]. In this respect, radioactive isotope Krypton-85 has been used in several articles in the literature [30,31,32] and Neon (Ne) [25].
In this work, an in situ CH4 emission measurement technique based on the tracer gas methodology using the noble gas Ne was developed to measure the CH4 production of a biodigester associated with an agro-agricultural operation by means of a micro-gas chromatographic (micro-GC) system. To the best of current knowledge, this methodology has not been previously applied for this purpose. Additionally, the data obtained was also used to estimate the energy potential of biogas from chicken farms in the Canary Islands.

2. Materials and Methods

In situ determination of the gas composition and CH4 emission rate from a biodigester associated with an agro-agricultural operation that combines a chicken farm with fruit and vegetable production was carried out. The operation was in the town of Tejina, Tenerife, Canary Islands, Spain, and two different surveys were completed: one during February 2021 (with ~25,000 hens in the poultry farm) and one during October 2022 (with ~40,000 hens). Figure 1 illustrates the location of Tenerife in the Canary Islands (A), the location of the farm in Tenerife Island (B) and the farm layout where the biodigester was located (C), as can be seen amongst an agricultural surrounding.
The biodigester, with dimensions of 45 m in width, 25 m in length, and 12 m in height, can be visualized as a right-angled prism, resulting in an internal volume of approximately 13,500 m3. Poultry manure (biomass) was introduced in the biodigester, mixed with water in a solid–liquid ratio of approximately 10%. Agitation was employed to homogenize the biomass, and the resultant organic liquid fertilizer was utilized to irrigate the fruit trees on the farm. Importantly, no waste was generated in this process. In order to facilitate the evacuation of gases from the biodigester, a ventilation tube was installed in the upper part in a Z-shaped configuration, terminating in a chimney, as depicted in Figure 2A. The downward tube in the illustration originates from the biodigester. To determine CH4 emissions from the ventilation tube, the tracer gas method was employed, specifically its variant known as the constant emission method.
Neon gas with a purity exceeding 99.995% was chosen as the tracer gas due to its inert nature and extremely low concentration in biogas (<0.001%). Following the guidelines outlined in the Spanish “Prevention Technical Note”, NTP 345 (NPT, 1994), regarding the tracer gas technique, the distance between the point of tracer gas introduction and the sampling point should be approximately 25 times the diameter of the conduit. Additionally, in conduits featuring one or more elbows, this distance should be approximately 10 times the diameter of the conduit. In the experiments, Ne was introduced at 60 cm from the measurement point, considering the internal diameter of the tube to be 6 cm and the presence of one or two elbows (depending on the sampling point, as elaborated later in the text). This introduction was conducted at a known mass flow (QNe). Assuming a homogeneous mixing process with no air contamination, the in situ-analyzed samples represent a mixture of biogas and Ne. Consequently, the flow of CH4 in mol·s−1 ( Q C H 4 ) can be defined as:
Q C H 4 = Q N e C C H 4 C N e
where C C H 4 and C N e represent the concentrations of CH4 and Ne in mol·mol−1, respectively. These concentrations were determined by analyzing the outgoing gas using micro-GC [25].
The experiment was conducted in two different configurations to assess whether the direct measurement of CH4 emissions from the final tube chimney or from the horizontal ventilation tube yielded similar results (refer to Figure 2):
(a)
Measurements made directly on the chimney (Figure 2B). Ne was introduced into the final section of the biogas ventilation tube through a 1/4 inch (0.635 cm) stainless steel pipe (Swagelok, OH, USA) at a flow rate of 69 mL·min−1. Another 1/4 inch pipe was utilized to sample the mixture of biogas and tracer gas. The flux of Ne was regulated by a mass flow controller (Stec Inc., Tokyo, Japan) to maintain a constant flow rate, monitored by a digital flow metre (Varian, Analytical Instruments, Darmstadt, Germany). The Ne injection point was positioned 1 m deep, while the sampling point was at a depth of 40 cm. This ensured a separation of 60 cm between the two pipes. The mixture of biogas and tracer gas was extracted every 4 min into a two-channel portable Agilent 490 micro-GC compact gas analyser (Agilent Technologies, Santa Clara, CA, USA), and its composition was immediately analyzed.
(b)
Measurements made in the horizontal part of the ventilation tube (Figure 2C). To access the biogas, the extraction tube was drilled at different points and sealed with rubber septums. Ne was injected through a 1/4 inch (0.635 cm) stainless steel pipe at a point 60 cm from the sampling location at a rate of 85 mL·min−1. Another 1/4 inch stainless steel tube was connected to the left of the sampling point, and the mixture of biogas and tracer gas was similarly drawn into the two-channel portable Agilent 490 micro-GC system every 4 min. Figure 3 illustrates the entire experimental setup during the horizontal section of the ventilation tube.
The micro-GC system was provided with a portable PC running the v. 1.10 Galaxie Chromatographic Software (Agilent Technologies). Analysis of He, Ne, H2, O2, and N2 was conducted using a porous layer open tubular (PLOT) Mol Sieve 5Å capillary column with an internal diameter (i.d.) of 0.25 mm and a length of 10 m, maintained at 80 °C. Injection occurred over 40 ms at 60 °C, with a sampling time of 70 s and an 8 s backflush. For analysis of CH4, CO2, H2S, and H2O, a PoraPLOT Q column with identical dimensions (0.25 mm i.d. × 10 m) was employed at 40 °C, with injection lasting 20 ms at 60 °C. Argon, with a purity of >99.999% served as the carrier gas in both channels, and detection was accomplished by thermal conductivity (TCD). The total runtime for each measurement was 180 s.
To determine the concentration of each gas compound in the outgoing biogas, an external calibration of the portable micro-GC was conducted in the laboratory using various certified standard gas mixtures containing different concentrations of the target species, covering the expected range present in the gas samples. Each standard was injected three times, and calibration curves were generated based on the integrated peak area. The results of the calibration study for the experiments conducted in February 2021 are presented in Table 1. The curves were fitted to a second-degree polynomial regression model with zero intercept, yielding determination coefficients (R2) exceeding 0.999 in all cases. Detection (DL) and quantification (QL) limits were calculated as the concentrations corresponding to signal-to-noise (S/N) ratios of 3 and 10, respectively. These limits ranged from 0.79 to 76.73 ppmv for DL and from 1.76 to 255.77 ppmv for QL.
To determine the composition of the biogas generated in the biodigester, samples were collected in sextuplicate from the sampling point of the horizontal section of the ventilation tube before the introduction of the tracer gas. These samples were stored in glass vials. Using a 60 cm3 syringe equipped with a needle, the initial 20 cm3 of gas were discarded, and then 60 cm3 were extracted. Subsequently, the gas was passed through the sealed 12 cm3 vial using two needles inserted through the vial septum [33]. The samples were then injected into the micro-GC system under the previously described conditions.

3. Results and Discussion

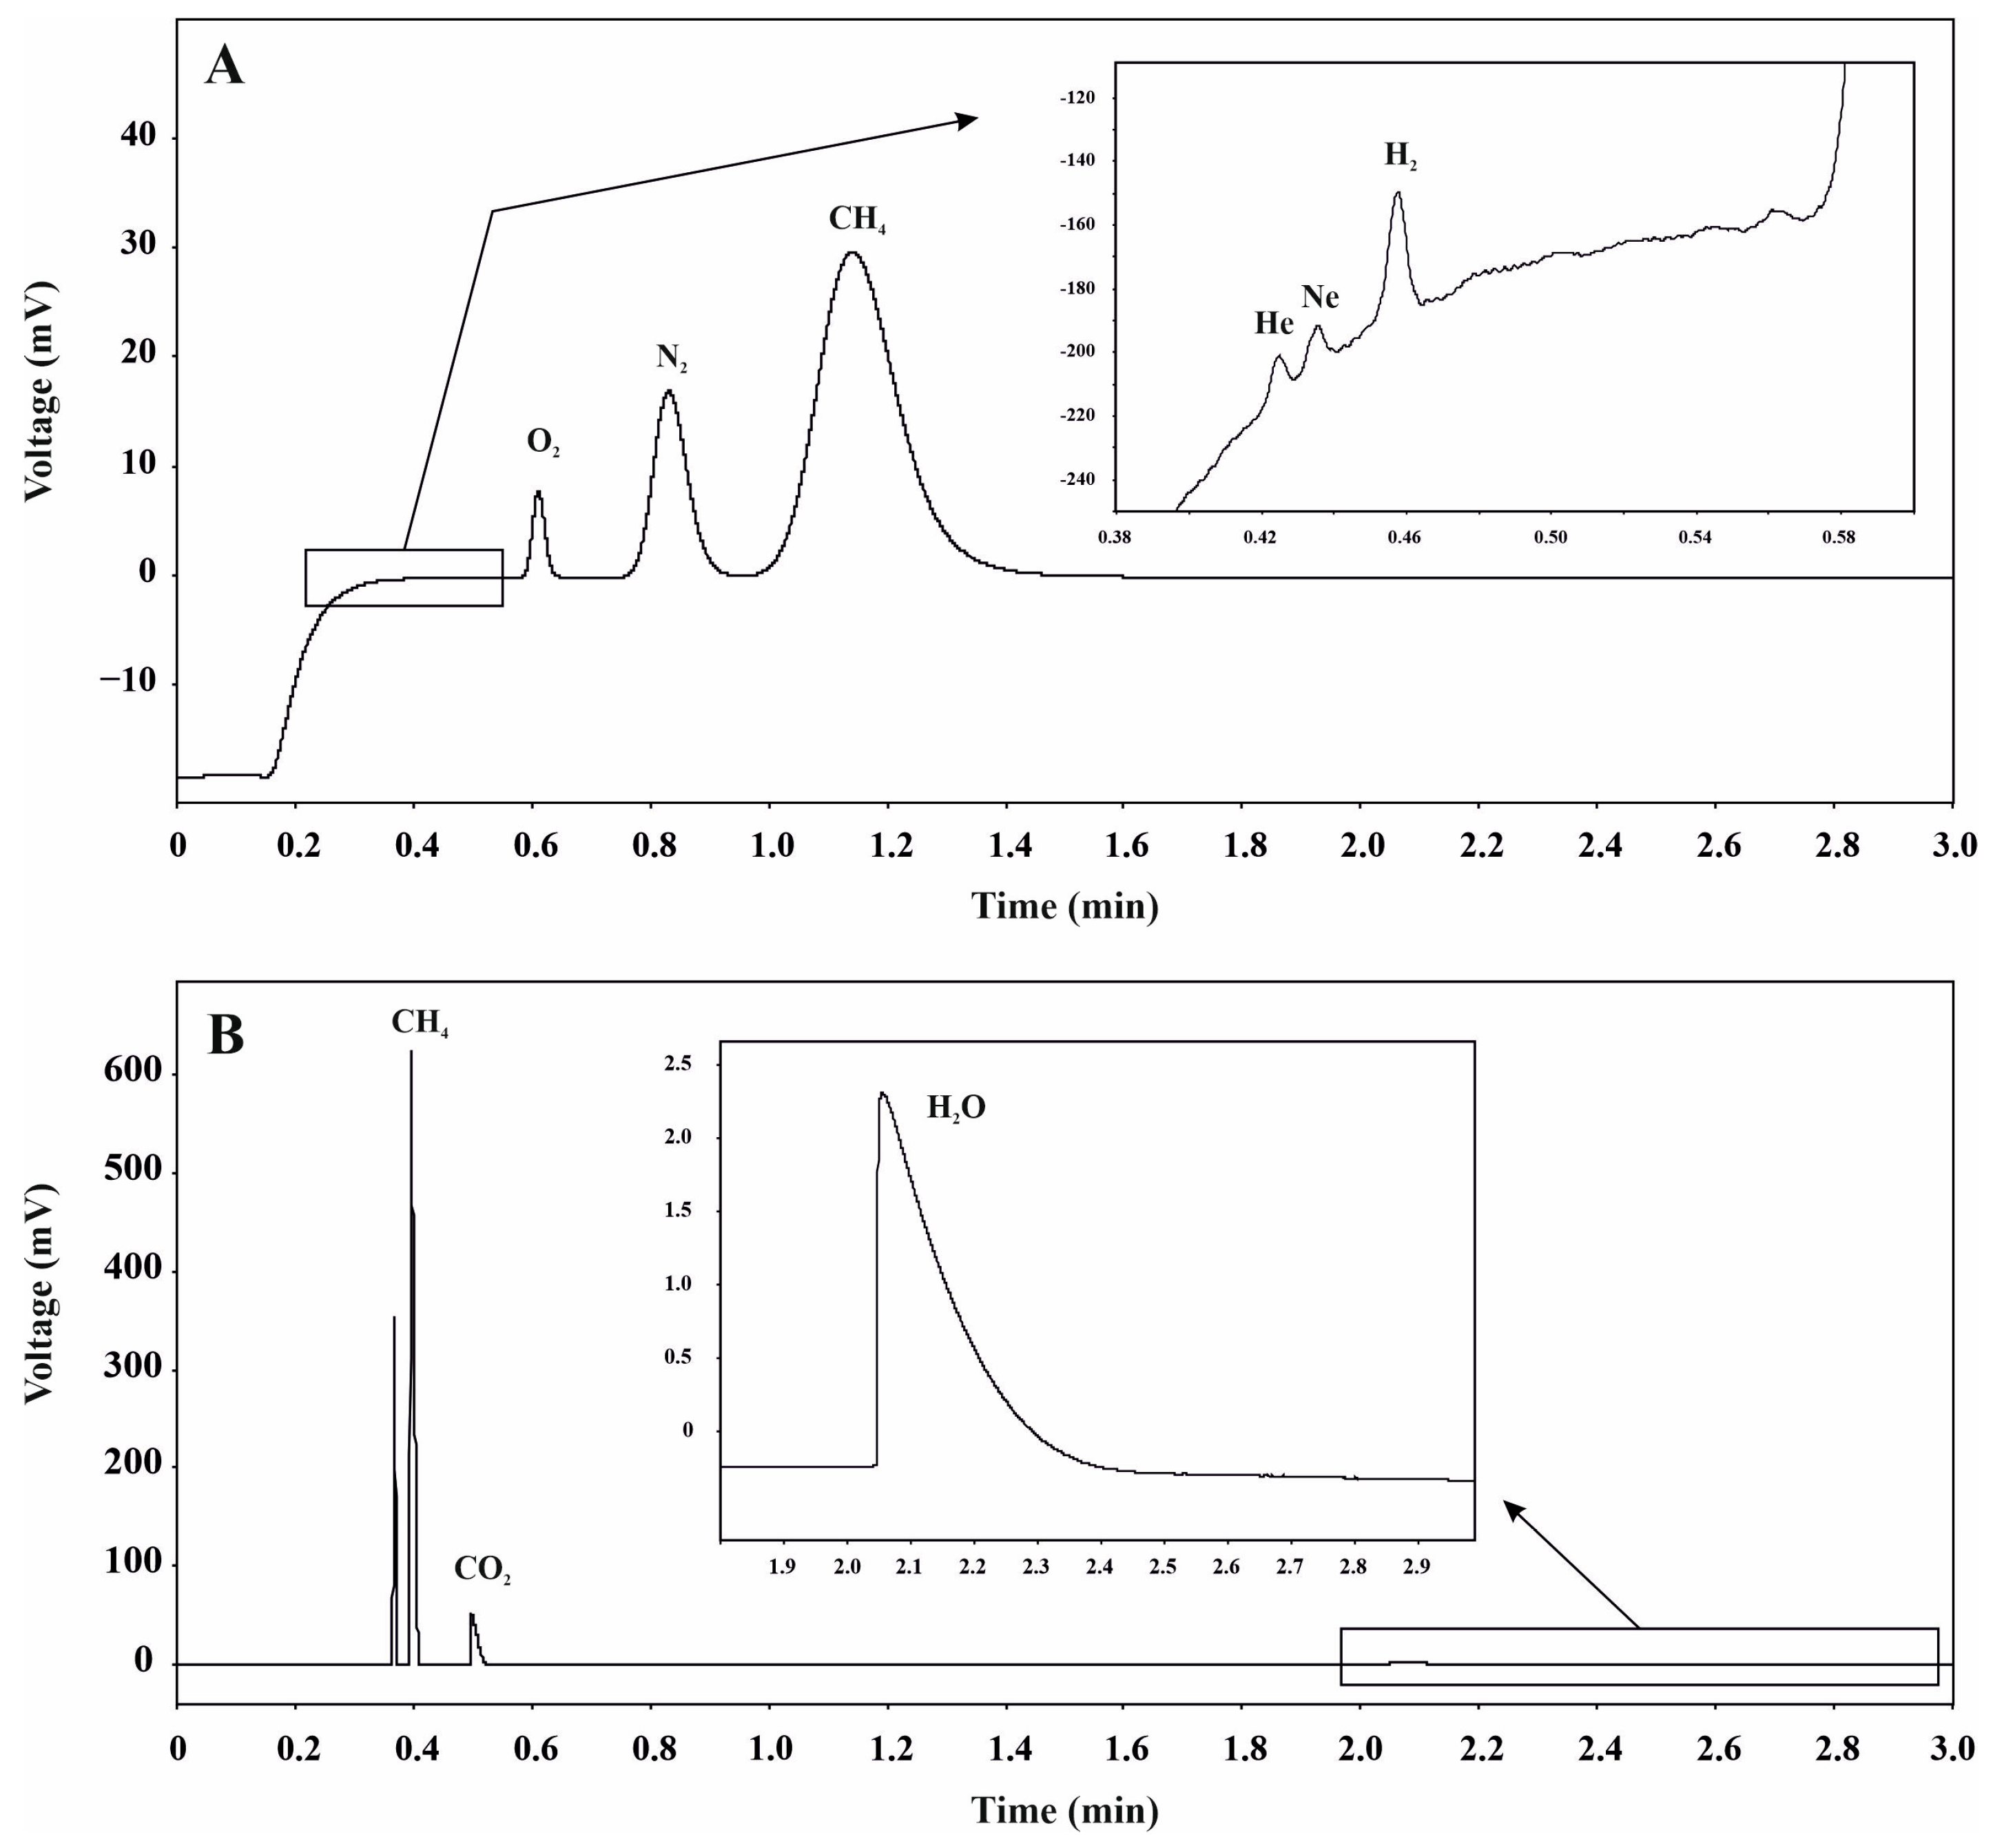
3.1. Determination of the Biogas Composition

Figure 4A,B show the chromatographic separation of the biogas components, while Table 2 shows the results of the analyses with both the concentration of each component and the relative standard deviation (RSD) of the five determinations (n = 5).
The primary composition of the biogas analyzed in February 2021 was as follows: 38.3% CH4, 19.1% CO2, 35.8% N2, 6.8% O2, along with minor components including 2.7 ppmv He, 11.7 ppmv Ne, 1.8 ppmv H2, and 1156.5 ppmv H2O. For the biogas analyzed in October 2022, the main composition was: 42.9% CH4, 25.8% CO2, 27.4% N2, 3.8% O2, along with minor components including 2.7 ppmv He, 12.2 ppmv Ne, 4.5 ppmv H2, and 1234.8 ppmv H2O. H2S was not detected at concentrations exceeding the instrumental DL for this species (65.3 ppmv).
These results reveal an interesting trend: the concentrations of O2 and N2 in the analyzed gas are notably high on both occasions, while the levels of CH4 and CO2 are comparatively lower. This composition deviates significantly from the typical composition of biogas [9]. In a similar study previously published [34], where poultry litter was used as biomass for a biodigester in the Amazon Region of Brazil, the authors reported CH4 and CO2 percentages in the biogas of 52.5% and 47.5%, respectively. In comparison, the present study revealed CH4 concentrations ranging from 38 to 43% and CO2 concentrations ranging from 19 to 26%. This indicates notable differences in the composition of biogas between the two studies, possibly influenced by variations in feedstock, operating conditions, or other factors. The decrease in CH4 concentration in biogas derived from anaerobic digestion can stem from various factors. One possible cause is the presence of inhibitory compounds [35]. For example, the presence of O2 during the biogas production process may inhibit strict anaerobic methanogenic bacteria [36]. Similarly, high levels of N2 in the process pose a risk of ammonia (NH3) accumulation, which is toxic and inhibits methanogenic archaea [7]. Another factor contributing to low CH4 percentages is the diminished quality of substrates, leading to a carbon deficiency in the digestion process and an excess of nitrogen. An inadequate C/N ratio is a common cause of inefficiencies in biodigesters. If the ratio is too high, there may not be enough nitrogen for bacteria to produce proteins; conversely, if it is too low, the surplus of nitrogen can impede the process [37]. Addressing the carbon deficiency could involve adding organic matter to the digestate, such as deceased hens, or incorporating various biosolid wastes.
On the other hand, biogas production from organic matter generates hydrogen sulphide (H2S), up to 3%. Sulphur present in organic matter and water can catalyze its formation, posing toxicity risks and damaging equipment like gas burners and generators. Biogas facilities often address H2S generation during anaerobic digestion through pre-treatment methods or by employing prevention techniques within the digesters. Pre-treatment methods include absorption/adsorption processes, where the gas passes through absorbent materials such as activated carbons or iron particles to remove H2S. In this case, the absence of H2S in the extracted biogas is logical, as iron chips were used as a purification method, which also eliminates moisture.

3.2. Estimation of the Methane Emission

The results of the experiments conducted in the biodigester are presented in Table 3. During the initial experiment in February 2021, measurements were exclusively taken directly from the chimney (as described in Section 2 list (a)). Initially, the CH4/Ne ratios exhibited variability due to disturbance effects associated with the injection of Ne into the chimney. However, stable measurements of CH4/Ne ratios were achieved after 25 min post-injection, stabilizing at levels of approximately 40% for CH4 and 200 ppmv for Ne. The CH4 emission rate remained constant at approximately 204 ± 5 kg·d−1 (310 ± 8 m3·d−1). Figure 5A depicts the curve generated from this experiment, illustrating the CH4 emission (plotted on a logarithmic scale) over time.
The second round of experiments, conducted in October 2022, included measurements taken both directly in the chimney and in the horizontal section of the vent tube (Table 3) (as detailed in Section 2 list (b)), aiming to discern any differences in the estimated flow rates. In the first scenario, stable measurements of CH4/Ne ratios were achieved after 40 min of injection, with concentrations reaching approximately 43% for CH4 and 130 ppmv for Ne. In the second experiment, stable CH4/Ne ratios were attained after 25 min, with concentrations of around 44% for CH4 and 170 ppmv for Ne. Throughout both experiments, the daily CH4 production remained stable, averaging at 330 ± 14 kg·d−1 (502 ± 21 m3·d−1) (as depicted in Figure 5B,C). These results unequivocally demonstrate that the experiment could be conducted in either manner, as the quantified daily CH4 production from each measurement site is perfectly comparable. However, it is worth noting that the measurements obtained in the horizontal part of the ventilation tube stabilized more rapidly. This can be attributed to a more efficient mixing of the biogas and tracer gas within that section of the tube compared to the area near the open-to-air chimney.
The comparison of CH4 production results between the experiments conducted in 2021 and 2022 reveals a notable difference, with the value obtained in 2022 nearly double that of 2021. This increase closely corresponds with the respective populations of laying hens present on the poultry farm during those periods, which were approximately 40,000 in 2022 and 25,000 in 2021. As expected, a higher number of hens correlates with a greater volume of waste produced, resulting in an anticipated increase in daily CH4 production.
This correlation highlights the direct impact of animal population size on biogas generation within the anaerobic digestion process. With more hens on the farm, there is a larger input of organic matter into the digester, providing more substrates for methanogenic bacteria to metabolize and produce CH4. Therefore, it is logical to expect that the CH4 flow would increase proportionally with the number of hens, reflecting the higher availability of organic material for digestion.
Furthermore, variations in management practices or feed composition between the two years could also contribute to differences in CH4 production. For example, changes in diet composition or feeding frequency may influence the types and quantities of organic compounds present in the waste stream, thereby affecting CH4 yield. Therefore, while hen population size is a significant factor influencing CH4 production, other management variables should also be considered when interpreting fluctuations in biogas output over time.

3.3. Comparison with a Model

The design of an efficient biodigester typically involves intricate calculations that can be prone to errors. A valuable approach to constructing a biodigester is leveraging software, a tool enabling the planning and design of biogas plants through mathematical models. In this study, the results obtained from the experiments were juxtaposed with the theoretical outcomes derived using specialized software tailored to the characteristics of the biodigester.
“BIODIGESTOR-pro” developed by Aqualimpia Engineering e.K., Uelzen, Germany [38] was utilized. This software serves as a tool for dimensioning and conceptual designing of both domestic and industrial biodigesters. It boasts a comprehensive database encompassing all existing manure types (such as pig, cattle, chickens, etc.) and various biomasses. By inputting hydrological mean data (including ambient temperature) and specifying the type and substrate for the biodigester feed, the software facilitates dimensioning (volume, base, height) of biodigesters, calculates biogas production (m3·d−1), and estimates electric energy (kWh) and heat (kWh-BTU).
To estimate biogas production using the programme, several basic assumptions were made, considering the climate conditions at the location of the biodigester. Specifically, a minimum ambient temperature of 20 °C for 100 days per year, a medium temperature of 25 °C for 200 days per year, and a maximum temperature of 30 °C for 65 days per year were considered. Additionally, it was assumed that there were 40,000 hens (reflecting the second experiment conducted in October 2022) and that the biodigester feed consisted entirely of hen manure. An average hen was estimated to weigh 1.8 kg, and 100% of the manure was used as digestate. Considering a manure production rate of 0.12 kg·d−1 per hen, the software calculated a theoretical CH4-specific production of 344 m3·d−1 from the biodigester. With a density of 0.656 kg·m−3 for CH4, this production equals 226 kg·d−1.
This value is within the same order of magnitude as the measurements obtained for the same number of hens (~330 kg·d−1) in the second experiment (October 2022), but it aligns more closely with the results of the first experiment (~200 kg·d−1 for 25,000 hens, February 2021). Therefore, this study revealed relatively consistent CH4 production rates across different experiments involving similar numbers of hens. In the first experiment conducted in February 2021, with 25,000 hens, CH4 production averaged approximately 200 kg·d−1, suggesting an estimated CH4 production of 0.008 kg·d−1 per hen. Similarly, in the second experiment conducted in October 2022, CH4 production for the same number of hens reached approximately 330 kg·d−1, resulting in an estimated CH4 production of 0.0132 kg·d−1 per hen. These findings indicate a relatively stable CH4 production per hen across the two experiments, suggesting consistency in environmental conditions, feed composition, or other factors influencing CH4 generation within the biodigester system. Understanding these trends is pivotal for optimizing CH4 production efficiency and assessing the environmental impact of poultry farming practices.
Although there are opportunities to enhance the sophistication of the assumptions obtained in this work using the BIODIGESTOR-pro software (v 3.0), which could potentially lead to a closer alignment with the measured results, it is recommended that these cost-effective or practical measurements be routinely conducted at bioreactors, given that the CH4 emission values closely correlate with the total number of hens.

3.4. Energy Potential of Biogas from Chicken Farms in the Canary Islands

Biogas plays a vital role in renewable energy production. However, for biogas to be effectively utilized as a high-value fuel source or injected into natural gas grids, it must undergo purification to become biomethane, a form consisting mainly of CH4 with a CH4 content of at least 90% to be used, for example, as road fuel [39]. Various purification technologies, such as adsorption with activated carbon, absorption with liquid solvents, gas separation membranes, and catalytic purification, are available. Each technology has its advantages and disadvantages, impacting factors like efficiency, operational costs, and spatial requirements. The choice of purification method depends on factors such as the composition of the feed biogas, the quality requirements of the final product, and site-specific economic and logistical considerations.
Additionally, biogas can be combusted in a combined heat and power plant. The ratio of heat to power generation depends on the technology and dimensions of the biodigester. Generally, 35–40% of biogas can be converted into electricity, while 40–45% can be utilized as heat, which can be employed to maintain or elevate the biodigester temperature or to heat nearby structures. However, 15–25% of energy is typically lost due to inefficiencies [39]. The calorific value of biogas refers to the amount of heat energy it can produce when burned. It is a measure of the biogas’s capacity to generate heat during combustion. This value is important as it indicates how much useful energy can be obtained from the biogas for various purposes, such as electricity generation, heating, or steam production. The higher the calorific value of biogas, the greater its capacity to produce heat energy during combustion, and thus, the more valuable it is as a renewable energy source. Given that the CH4 percentage was estimated at 38.3% (first experiment in February 2021) and 42.9% (second experiment in October 2022), and considering that the calorific value of CH4 is approximately 55.5 kJ/m3 (standard conditions of pressure and temperature), it is estimated that the calorific value of the biogas generated in the first experiment was 21.3 kJ/m3 and 23.8 kJ/m3 in the second. The obtained calorific values for biogas are reasonably good, but its assessment as ‘good’ depends on the context and specific standards of the application. Compared to the calorific value of pure CH4, the obtained values indicate that the biogas in fact contains a significant number of other components besides CH4, which have lower calorific values. While the obtained values may suffice for certain applications like heating or steam production, for applications requiring high energy efficiency or greater energy density, such as electricity generation, a higher value would be preferable. Generally, a biogas value closer to that of pure CH4 would be considered excellent, while lower values may necessitate adjustments in biogas production or a purification process.
In 2023, the Canary Islands conducted a comprehensive census that revealed a substantial population of 3,115,577 hens across various farming systems [40]. This extensive distribution of poultry farming reflects the region’s significant agricultural sector, with poultry production playing a crucial role in meeting both local and regional demands for eggs and poultry products. Considering the prevalence of poultry farming across the islands, it is reasonable to assume that many of these operations could potentially harness renewable energy through the utilization of biodigesters for managing organic waste. Biodigesters are increasingly recognized as valuable tools in agricultural sustainability, allowing farms to convert organic waste into biogas, a renewable energy source comprising primarily CH4 and CO2.
In the biodigester under examination, a CH4 production of 330 kg·d−1 was inferred for the experiment conducted in October 2022 with 40,000 hens on the farm. Considering a molecular weight of 16.04 g·mol−1 and a heat capacity of 35.69 J·mol−1·K−1 for CH4, an energy release of 219 MJ·d−1 at 25 °C could be calculated, equivalent to 61 kWh·d−1. Consequently, this implies an annual energy potential of 22,185 kWh [39]. In the study, in the Amazon Region of Brazil mentioned before [34], the authors reported an average electricity generation of 41,884 kWh per semester from biogas, implying a daily average production of approximately 233.24 kWh. These comparisons highlight differences in energy production between the two studies, underscoring potential variations in system efficiency, operational conditions, or feedstock characteristics.
Assuming that, and if each chicken farm in the Canary Islands would employ a biodigester capable of producing energy equivalent to the one studied (considering that possibly at the time the measurements were taken, the biodigester was not operating at its full capacity), the cumulative energy output from these biodigesters could be substantial. By extrapolating the energy production of the studied biodigester across the entire population of chicken farms, a total annual energy generation of approximately 1,727,977 kWh was estimated. In the Canary Islands, the average electricity consumption per user in 2021 was estimated at 1607 kWh. Therefore, the energy generated from biodigesters could potentially provide electricity to approximately 280 users.
This significant figure underscores the potential of biodigesters to contribute to the region’s energy portfolio while simultaneously addressing environmental concerns related to organic waste management. Moreover, the utilization of biodigesters aligns with broader sustainability goals, promoting the circular economy by converting waste into a valuable resource and reducing greenhouse gas emissions associated with traditional waste disposal methods.
Overall, the widespread adoption of biodigesters in poultry farming represents a promising avenue for advancing renewable energy production and agricultural sustainability in the Canary Islands, contributing to both energy security and environmental stewardship in the region.

4. Conclusions

In this study, the tracer gas technique has been validated as a reliable method for rapidly quantifying CH4 emissions from poultry farm biodigesters, yielding results in less than an hour. Additionally, biogas composition analysis was efficiently conducted by sampling gas from the vent tube and analyzing it using a micro-GC system, with results obtained in under 5 min. These experiments demonstrate the versatility of this technique, showing consistent results whether conducted in the chimney or vent tube and confirming a good correlation with modelling data.
The insights gained from these experiments, including CH4 emission rates and biogas composition, offer valuable understanding of biodigester processes and facilitate optimization of operational conditions for enhanced performance.
Furthermore, the estimation of the energy potential of biogas from chicken farms in the Canary Islands, totalling 1,727,977 kWh·year−1, underscores the significant renewable energy resource available in this sector. This highlights the potential for biodigesters to contribute to the region’s energy sustainability and agricultural waste management efforts, aligning with broader goals of environmental stewardship and renewable energy utilization.

Author Contributions

Conceptualization, M.A.-R., G.V.M., E.P., P.A.H., N.M.P. and J.L.P.C.; data curation, M.A.-R., G.V.M. and J.L.P.C.; formal analysis, M.A.-R. and G.V.M.; investigation, M.A.-R. and G.V.M.; methodology, M.A.-R. and G.V.M.; resources, M.A.-R., G.V.M., E.P. and J.L.P.C.; software, M.A.-R. and G.V.M.; supervision, N.M.P.; validation, M.A.-R. and G.V.M.; visualization, M.A.-R., G.V.M., E.P., P.A.H., N.M.P. and J.L.P.C.; writing—original draft preparation, M.A.-R.; writing—review and editing, M.A.-R., G.V.M., E.P., P.A.H., N.M.P. and J.L.P.C. All authors have read and agreed to the published version of the manuscript.

Funding

This research received no external funding.

Institutional Review Board Statement

Not applicable.

Informed Consent Statement

Not applicable.

Data Availability Statement

The original contributions presented in the study are included in the article, further inquiries can be directed to the corresponding author.

Acknowledgments

We would like to express our gratitude to the late Amadeo E. Rodríguez González, owner of the agro-agricultural operation (Granja Avícola Cardonillo, Tejina, San Cristóbal de La Laguna), as well as to Giovanni D’Orazio and Andrea Alonso for their contributions to Figure 3 and the graphical abstract designs, respectively.

Conflicts of Interest

The authors declare no conflicts of interests.

References

  1. Food and Agriculture Organization. Available online: http://www.fao.org (accessed on 19 April 2024).
  2. Ministry of Agriculture, Fisheries and Food of Spain. Available online: https://www.mapa.gob.es (accessed on 19 April 2024).
  3. Mustafa, E.A.; Hamad, E.M.; Elhassan, M.M.O.; Salman, A.M.A.; Elsiddig, M.A.; Lamyia, M.A. Disposal of dead birds and manure in poultry farms under different productions and management systems in Khartoum State, Sudan. World J. Pharm. Pharm. Sci. 2018, 7, 61–70. [Google Scholar]
  4. Singh, P.; Mondal, T.; Sharma, R.; Mahalakshmi, N.; Gupta, M. Poultry waste management. Int. J. Curr. Microbiol. Appl. Sci. 2008, 7, 701–712. [Google Scholar] [CrossRef]
  5. Dalólio, F.S.; da Silva, J.N.; de Oliveira, A.C.C.; Tinôco, I.D.F.F.; Barbosa, R.C.; de Oliveira Resende, M.; Albino, L.F.T.; Coelho, S.T. Poultry litter as biomass energy: A review and future perspectives. Renew. Sustain. Energy Rev. 2017, 76, 941–949. [Google Scholar] [CrossRef]
  6. FAO. Biogas Technology: A Training Manual for Extension. 1996. Available online: https://www.fao.org/3/ae897e/ae897e.pdf (accessed on 19 April 2024).
  7. Farrow, C.; Crolla, A.; Kinsley, C.; McBean, E. Anaerobic digestion of poultry manure: Process optimization employing struvite precipitation and novel digestion technologies. Environ. Prog. Sustain. Energy 2014, 33, 676–680. [Google Scholar] [CrossRef]
  8. Trujillo, D.; Jarabo, F.; Pérez, C.; Pérez, J.F. Algunos aspectos sobre la digestión anaerobia de gallinazas. Nuestra Cabaña 1987, 26–30. [Google Scholar]
  9. Alves, H.J.; Bley Junior, C.; Niklevicz, R.R.; Frigo, E.P.; Frigo, M.S.; Coimbra-Araújo, C.H. Overview of hydrogen production technologies from biogas and the applications in fuel cells. Int. J. Hydrogen Energy 2013, 38, 5215–5225. [Google Scholar] [CrossRef]
  10. Neshat, S.A.; Mohammadi, M.; Najafpour, G.D.; Lahijani, P. Anaerobic co-digestion of animal manures and lignocellulosic residues as a potent approach for sustainable biogas production. Renew. Sustain. Energy Rev. 2017, 79, 308–322. [Google Scholar] [CrossRef]
  11. FAO. MINENERGIA, PNUD, GEF, Manual del Biogás 2011, Proy. CHI/00/G32. Available online: https://www.fao.org/4/as400s/as400s.pdf (accessed on 19 April 2024).
  12. De Clercq, D.; Wen, Z.; Gottfried, O.; Schmidt, F.; Fei, F. A review of global strategies promoting the conversion of food waste to bioenergy via anaerobic digestion. Renew. Sustain. Energy Rev. 2017, 79, 204–221. [Google Scholar] [CrossRef]
  13. Remion, G.; Moujalled, B.; El Mankibi, M. Review of tracer gas-based methods for the characterization of natural ventilation performance: Comparative analysis of their accuracy. Build. Environ. 2019, 160, 106180. [Google Scholar] [CrossRef]
  14. Van Buggenhout, S.; Van Brecht, A.; Eren Özcan, S.; Vranken, E.; Van Malcot, W.; Berckmans, D. Influence of sampling positions on accuracy of tracer gas measurements in ventilated spaces. Biosyst. Eng. 2009, 104, 216–223. [Google Scholar] [CrossRef]
  15. Gao, N.P.; Wang, R.G.; Wu, Y.; Wu, Z. Study on impact factors of tracer gas method in investigations of gaseous pollutant transport and building ventilation. Build. Simul. 2023, 16, 413–426. [Google Scholar] [CrossRef]
  16. Boadi, D.A.; Wittenberg, K.M.; Scott, S.L.; Burton, D.; Buckley, K.; Small, J.A.; Ominski, K.H. Effect of low and high forage diet on enteric and manure pack greenhouse gas emissions from a feedlot. Can. J. Anim. Sci. 2004, 84, 445–453. [Google Scholar] [CrossRef]
  17. Eugène, M.; Martin, C.; Mialon, M.M.; Krauss, D.; Renand, G.; Doreau, M. Dietary linseed and starch supplementation decreases methane production of fattening bulls. Anim. Feed Sci. Technol. 2011, 166–167, 330–337. [Google Scholar] [CrossRef]
  18. Grainger, C.; Clarke, T.; McGinn, S.M.; Auldist, M.J.; Beauchemin, K.A.; Hannah, M.C.; Waghorn, G.C.; Clark, H.; Eckard, R.J. Methane emissions from dairy cows measured using the sulfur hexafluoride (SF6) tracer and chamber techniques. J. Dairy Sci. 2007, 90, 2755–2766. [Google Scholar] [CrossRef] [PubMed]
  19. Bai, M.; Velazco, J.I.; Coates, T.W.; Phillips, F.A.; Flesch, T.K.; Hill, J.; Mayer, D.G.; Tomkins, N.W.; Hegarty, R.S.; Chen, D. Beef cattle methane emissions measured with tracer-ratio and inverse dispersion modelling techniques. Atmos. Meas. Tech. 2021, 14, 3469–3479. [Google Scholar] [CrossRef]
  20. Loza, C.; Cerón-Cucchi, M.E.; Cabezas-Garcia, E.H.; Ortiz-Chura, A.; Gualdrón-Duarte, L.; Gere, J.I. On the use of the SF6 gas tracer technique in Latin America for measuring methane emissions in ruminants: A review and analysis. N. Z. J. Agric. Res. 2024, 1–30. [Google Scholar] [CrossRef]
  21. Pinares-Patiño, C.S.; Lassey, K.R.; Martin, R.J.; Molano, G.; Fernandez, M.; MacLean, S.; Sandoval, E.; Luo, D.; Clark, H. Assessment of the sulphur hexafluoride (SF6) tracer technique using respiration chambers for estimation of methane emissions from sheep. Anim. Feed Sci. Technol. 2011, 166–167, 201–209. [Google Scholar] [CrossRef]
  22. Yoshida, H.; Mønster, J.; Scheutz, C. Plant-integrated measurement of greenhouse gas emissions from a municipal wastewater treatment plant. Water Res. 2014, 61, 108–118. [Google Scholar] [CrossRef] [PubMed]
  23. Delre, A.; Monster, J.; Samuelsson, J.; Fredenslund, A.M.; Scheutz, C. Emission quantification using the tracer gas dispersion method: The influence of instrument, tracer gas species and source simulation. Sci. Total Environ. 2018, 634, 59–66. [Google Scholar] [CrossRef]
  24. Jensen, M.B.; Møller, J.; Mønster, J.; Scheutz, C. Quantification of greenhouse gas emissions from a biological waste treatment facility. Waste Manag. 2017, 67, 375–384. [Google Scholar] [CrossRef]
  25. Mori, T.; Hernández, P.A.; Salazar, J.M.L.; Pérez, N.M.; Notsu, K. An in-situ method for measuring CO2 flux from volcanic-hydrothermal fumaroles. Chem. Geol. 2001, 177, 85–99. [Google Scholar] [CrossRef]
  26. Sherman, M.H. Tracer-gas techniques for measuring ventilation in a single zone. Build. Environ. 1990, 25, 365–374. [Google Scholar] [CrossRef]
  27. Li, M.; Kozai, T.; Niu, G.; Takagaki, M. Estimating the air exchange rate using water vapour as a tracer gas in a semi-closed growth chamber. Biosyst. Eng. 2012, 113, 94–101. [Google Scholar] [CrossRef]
  28. Mendes, L.B.; Edouard, N.; Ogink, N.W.; van Dooren, H.J.C.; Tinôco, I.d.F.F.; Mosquera, J. Spatial variability of mixing ratios of ammonia and tracer gases in a naturally ventilated dairy cow barn. Biosyst. Eng. 2015, 129, 360–369. [Google Scholar] [CrossRef]
  29. Machmüller, A.; Hegarty, R.S. Alternative tracer gases for the ERUCT technique to estimate methane emission from grazing animals. Int. Congr. Ser. 2006, 1293, 50–53. [Google Scholar] [CrossRef]
  30. Kiwan, A.; Berg, W.; Brunsch, R.; Özcan, S.; Müller, H.J.; Gläser, M.; Fiedler, M.; Ammon, C.; Berckmans, D. Tracer gas technique, air velocity measurement and natural ventilation method for estimating ventilation rates through naturally ventilated barns. Agric. Eng. Int. CIGR J. 2012, 14, 22–36. [Google Scholar]
  31. Samer, M.; Müller, H.J.; Fiedler, M.; Ammon, C.; Gläser, M.; Berg, W.; Sanftleben, P.; Brunsch, R. Developing the 85Kr tracer gas technique for air exchange rate measurements in naturally ventilated animal buildings. Biosyst. Eng. 2011, 109, 276–287. [Google Scholar] [CrossRef]
  32. Samer, M.; Ammon, C.; Loebsin, C.; Fiedler, M.; Berg, W.; Sanftleben, P.; Brunsch, R. Moisture balance and tracer gas technique for ventilation rates measurement and greenhouse gases and ammonia emissions quantification in naturally ventilated buildings. Build. Environ. 2012, 50, 10–20. [Google Scholar] [CrossRef]
  33. Hinkle, M.E.; Kilburn, J.E. The Use of Vacutainer Tubes for Collection of Soil Samples for Helium Analysis; USGS Numbered Series, Open-File Report 79-1441; USGS Publications Warehouse: Reston, VA, USA, 1979.
  34. Mendes Pedroza, M.; Gomes da Silva, W.; Santos de Carvalho, L.; Rocha de Souza, A.; Figueiredo Maciel, G. Methane and electricity production from poultry litter digestion in the amazon region of Brazil: A large-scale study. Waste Biomass Valori. 2021, 12, 5807–5820. [Google Scholar] [CrossRef]
  35. Czatzkowska, M.; Harnisz, M.; Korzeniewska, E.; Koniuszewska, I. Inhibitors of the methane fermentation process with particular emphasis on the microbiological aspect: A review. Energy Sci. Eng. 2020, 8, 1880–1897. [Google Scholar] [CrossRef]
  36. Wresta, A.; Saepudin, A. Estimation of oxygen concentration in the slurry in biogas production without O2 removal in initial process. Energy Procedia 2013, 32, 115–121. [Google Scholar] [CrossRef]
  37. Wang, X.; Lu, X.; Li, F.; Yang, G. Effects of temperature and carbon-nitrogen (C/N) ratio on the performance of anaerobic co-digestion of dairy manure, chicken manure and rice straw: Focusing on ammonia inhibition. PLoS ONE 2014, 9, e97265. [Google Scholar] [CrossRef] [PubMed]
  38. Aqualimpia Engineering e.K., Germany. 2019. Available online: https://www.aqualimpia.com/software-biodigestor (accessed on 19 April 2024).
  39. Foster, W.; Azimov, U.; Gauthier-Maradei, P.; Molano, L.C.; Combrinck, M.; Munoz, J.; Esteves, J.J.; Patino, L. Waste-to-energy conversion technologies in the UK: Processes and barriers—A review. Renew. Sustain. Energy Rev. 2021, 135, 110226. [Google Scholar] [CrossRef]
  40. Estadística Sobre Efectivos de Ganado en Canarias/Series Anuales. Municipios, Islas y Provincias de Canarias. 1998–2023. Available online: https://www.gobiernodecanarias.org/agricultura/ (accessed on 19 April 2024).
Figure 1. Location map of (A) Tenerife in the Canary Islands, (B) agro-agricultural operation in Tejina, Tenerife, and (C) aerial view of the biodigester and the chimney in the agro-agricultural operation where the experiments were carried out.
Sustainability 16 04168 g001
Figure 2. Pictures of (A) the biodigester chimney and the places where the experiment was carried out: (B) the chimney and (C) the vent tube.
Sustainability 16 04168 g002
Figure 3. General scheme of the experiment as it was developed in the vent tube.
Sustainability 16 04168 g003
Figure 4. Chromatograms corresponding to the analysis of a typical sample, in this case taken in the horizontal part of the ventilation tube in October 2022. The plots show the separation of (A) He, Ne, H2, O2, N2 and CH4 in a PLOT Mol Sieve 5Å column of 10 m; (B) CH4, CO2 and H2O in a PoraPLOT Q of 10 m.
Sustainability 16 04168 g004
Figure 5. CH4 emission vs. time in situ measured on (A) February 2021 directly on the chimney; (B) October 2022 directly on the chimney; and (C) October 2022 in the horizontal ventilation tube. After a period of 25–40 min, the initial disruption to air flow caused by the tracer gas insertion stabilizes upon the value accepted.
Sustainability 16 04168 g005
Table 1. Calibration data of the gas components.
Gas ComponentCalibration Data (n = 5)DLmethod (a)
(ppmv)
QLmethod (b)
(ppmv)
Range of Concentration Tested (ppmv)Calibration EquationR2
He2.63–7.50y = 6.77·10−2x2 + 2.17x0.9990.792.63
Ne8.26–6330.00y = 2.82·10−5x2 + 0.28x0.9992.488.26
H21.76–10.00y = −4.02·10−2x2 + 3.29x0.9990.531.76
O276.06–21,000.00y = −2.77·10−8x2 + 0.30x0.99922.8276.06
N2255.77–79,000.00y = −4.28·10−8x2 + 0.27x0.99976.73255.77
CH45.42–246,400.00y = 9.83·10−8x2 + 0.56x0.9991.635.42
CO262.31–235,700.00y = 7.23·10−8x2 + 0.13x0.99918.6962.31
H2S217.67–500.00y = 8.85·10−2x0.99965.30217.67
H2O8.42–1000.00y = 16.70x0.9992.538.42
R2: Determination coefficient. (a) Calculated as the concentration associated with an S/N ratio of 3. (b) Calculated as the concentration associated with an S/N ratio of 10.
Table 2. Main components of the gas coming from the biodigester.
February 2021October 2022
#Hens25,00040,000
% CH4 (RSD, %) (a)38.3 (2)42.9 (1)
% CO2 (RSD, %) (a)19.1 (2)25.8 (1)
% N2 (RSD, %) (a)35.8 (2)27.4 (2)
% O2 (RSD, %) (a)6.8 (3)3.8 (5)
ppm He (RSD, %) (a)2.7 (3)2.0 (5)
ppm Ne (RSD, %) (a)11.7 (5)12.2 (5)
ppm H2 (RSD, %) (a)1.8 (1)4.5 (4)
ppm H2O (RSD, %) (a)1156.5 (2)1234.8 (2)
(a) Mean value of five samples (n = 5).
Table 3. Results of the CH4 emission measurements carried out in the biodigester.
Time
(min)
Tamb
(°C)
Ne Flux
(mL·min−1)
Ne Flux
(kg·d−1)
[CH4]
(ppmv)
[Ne]
(ppmv)
CH4/Ne
Molar Ratio
CH4
Emission
(kg·d−1)
CH4
Emission
(m3·d−1)
February 2021
Measurements in the chimney
026.76982394,25415023312741
425.36982394,75710984543756
826.76982396,6498286054975
1225.66982393,8796427746396
1626.06982397,66751198280122
2026.36982396,646420119397148
2426.56982392,9613471429117177
2826.96981392,8783081609131199
3226.96981394,7572701842150228
3625.66982396,8592691859152232
4025.26982397,0402502007164250
4425.26982398,8012482029166253
4825.56982398,2112212269186283
5226.06982399,0372182304188287
5626.26982401,2202102411197299
6027.26981400,3342022498203309
6426.26982401,3752032498204310
6826.76982398,5222022490203308
7227.26981401,4881952603212323
October 2022
Measurements in the chimney
027.469816691312722234
428.0698112,692315214264
829.8698117,740346575381
1228.5698120,992357576193
1628.0698131,82038105586130
2027.5698146,473431367111169
2427.9698146,443351689137209
2828.4698145,204381487120183
3228.06981368,736994684380578
3628.56981404,9341264056328500
4028.66981423,0451363918317483
4428.66981429,1721334074330502
4828.56981430,3331403866313476
5228.66981431,4541304172338514
5628.56981430,5281304163337513
6028.66981429,9231264296348529
October 2022
Measurements in the vent tube
027.785100441,68345221231219
428.385100443,45722022542539
828.085100441,69210585275380
1227.885100441,5145431026103156
1627.885100441,5583331674167255
2028.085100441,1142082680268408
2427.885100441,7781813072307467
2827.885100441,6391773138314478
3228.885100441,1941683315330503
3627.985100441,5061753181318484
4027.885100443,0211583532353537
4429.485100443,7691633433341520
4827.885100441,8901693297330502
Disclaimer/Publisher’s Note: The statements, opinions and data contained in all publications are solely those of the individual author(s) and contributor(s) and not of MDPI and/or the editor(s). MDPI and/or the editor(s) disclaim responsibility for any injury to people or property resulting from any ideas, methods, instructions or products referred to in the content.

