Article

Precision Regulation and Forecasting of Greenhouse Tomato Growth Conditions Using an Improved GA-BP Model

1
Electrical and Information Engineering College, Jilin Agricultural Science and Technology University, Jilin 132101, China
2
School of Information and Control Engineering, Jilin Institute of Chemical Technology, Jilin 132022, China
3
College of Information Technology, Jilin Agricultural University, Changchun 132101, China
4
Qingdao Innovation and Development Center of Harbin Engineering University, Qingdao 266400, China
*
Authors to whom correspondence should be addressed.
These authors contributed equally to this work.
Sustainability 2024, 16(10), 4161; https://doi.org/10.3390/su16104161
Submission received: 1 March 2024 / Revised: 12 May 2024 / Accepted: 13 May 2024 / Published: 16 May 2024
(This article belongs to the Section Sustainable Agriculture)

Abstract

:
Tomatoes are annual herbaceous plants of the family Solanaceae. They have very stringent requirements for their growing environment and climate conditions. To precisely control the greenhouse environment for tomato growth, this project designed and implemented a monitoring system utilizing programmable logic controllers and a data acquisition system for monitoring. Sensors are installed at key locations in the greenhouse, such as near the ground, in the plant canopy, and under the roof, to monitor environmental parameters such as temperature, humidity, light intensity, and carbon dioxide concentration in real time. A three-layer feedforward GA-BP neural network model was established using soil temperature, soil humidity, air humidity, and illumination as predictive parameters. This technology predicts optimal environmental parameters and performs real-time monitoring and intelligent control, overcoming the traditional BP neural network’s drawbacks of slow convergence, susceptibility to disturbance, and poor generalization ability, with the current model’s average prediction error being less than 5%. It provides a theoretical basis and decision support for precision control and related environmental forecasting in agricultural projects. Based on the growth characteristics, physiological and morphological features of tomatoes, and the comprehensive impact of planting conditions, the technology enhances tomato yield and quality while reducing production costs and labor inputs. It mainly includes the establishment of tomato growth models, measurement and control of environmental parameters, and the design and optimization of intelligent decision control systems. Research outcomes in this field are significant for improving agricultural production efficiency, ensuring food security, and promoting sustainable agricultural development.

1. Introduction

In China, the development of greenhouse vegetable cultivation is booming, and tomatoes are one of the typical greenhouse vegetables [1]. Tomatoes are one of China’s important economic crops, and as a vegetable crop, both its production and scale rank first in the world [2]. Over time, tomato cultivation has become an important channel for farmers to increase their income. Effective control of the greenhouse environment for tomato growth is of great significance for increasing tomato yield [3].
In recent years, China has conducted extensive research on intelligent control technologies for greenhouse cultivation environments [4]. The growth environment for greenhouse tomatoes is now controlled by sensors through hardware modules such as WiFi (Wireless Fidelity), Zigbee, microcontrollers, and PLCs (Programmable Logic Controllers). Tomatoes are annual herbaceous plants that require specific environmental and climate conditions. In the natural environment, the relative humidity for tomato growth is between 60–70%, with daytime temperatures of 20–25 °C and nighttime temperatures of 14–18 °C. However, parameters such as temperature, humidity, and light intensity are largely inertial, leading to issues with controller oversight, prolonged monitoring times, and significant delays [5].
This research has developed an intelligent system to monitor and collect parameters of the tomato growth environment [6]. The system includes various hardware devices, such as multiple sensors, a PLC controller, and a supervisory computer [7]. Sensors are utilized to gather environmental data, which is managed by the PLC controller to facilitate the switching control of these parameters, with data transmission being carried out via the RS-485 bus [8]. The control system features a distributed control architecture, with each subsystem operating independently, ensuring the system’s reliability and safety and laying the groundwork for the expansion of tomato cultivation environment projects [9].
The BP neural network is a feedforward neural network with strong nonlinearity and high prediction accuracy [10]. A common three-layer BP neural network includes an input layer, a hidden layer, and an output layer. Each layer consists of numerous neurons capable of performing various operations connected to the neurons of the subsequent layer. The BP neural network is trained by simulating the excitation and inhibitory information transmission of animal nerves, aiding in the network’s effective prediction [11]. To overcome the tendency of traditional BP neural networks to fall into local minima, this experiment introduces a genetic algorithm. The genetic algorithm is a global optimization algorithm that solves problems through biological evolution and is capable of global optimization [12]. Based on a population, the algorithm iteratively evolves and can eventually obtain the optimal or near-optimal solution to a problem [13].
This paper conducts research at the cultivation base in the Economic Development Zone of Jilin City, Jilin Province, establishing a greenhouse tomato environment control and prediction system based on PLC and a data acquisition and monitoring control system [14]. It monitors the effects of soil temperature, air humidity, soil moisture, CO2 concentration, and light intensity on the tomato growth environment. Moreover, a multilayer feedforward BP neural network model is established to predict and assess the cultivation environment’s light, air humidity, soil temperature, and soil moisture [15]. During training, a large set of training data is used as the “teacher” to feed the cultivation data collected at continuous time points into the neural network [16]. The neural network is used to predict the changing patterns of tomato growth environment parameters, yielding a simultaneous output of predictive parameters [17]. Compared to traditional greenhouse environmental decision models, this study incorporates a BP neural network. The BP neural network, improved by genetic algorithms, demonstrates rapid convergence, high prediction accuracy, and stability, providing a reliable basis for the control and prediction of the tomato growth environment [18]. Through the description above, the cultivation environment management system using the BP neural network can more scientifically and accurately manage the environmental conditions in greenhouses or fields, optimize the crop growth cycle, and improve overall agricultural production efficiency. These advantages are difficult to match with traditional agricultural methods, especially in large-scale or highly automated modern agricultural production.

2. Materials and Methods
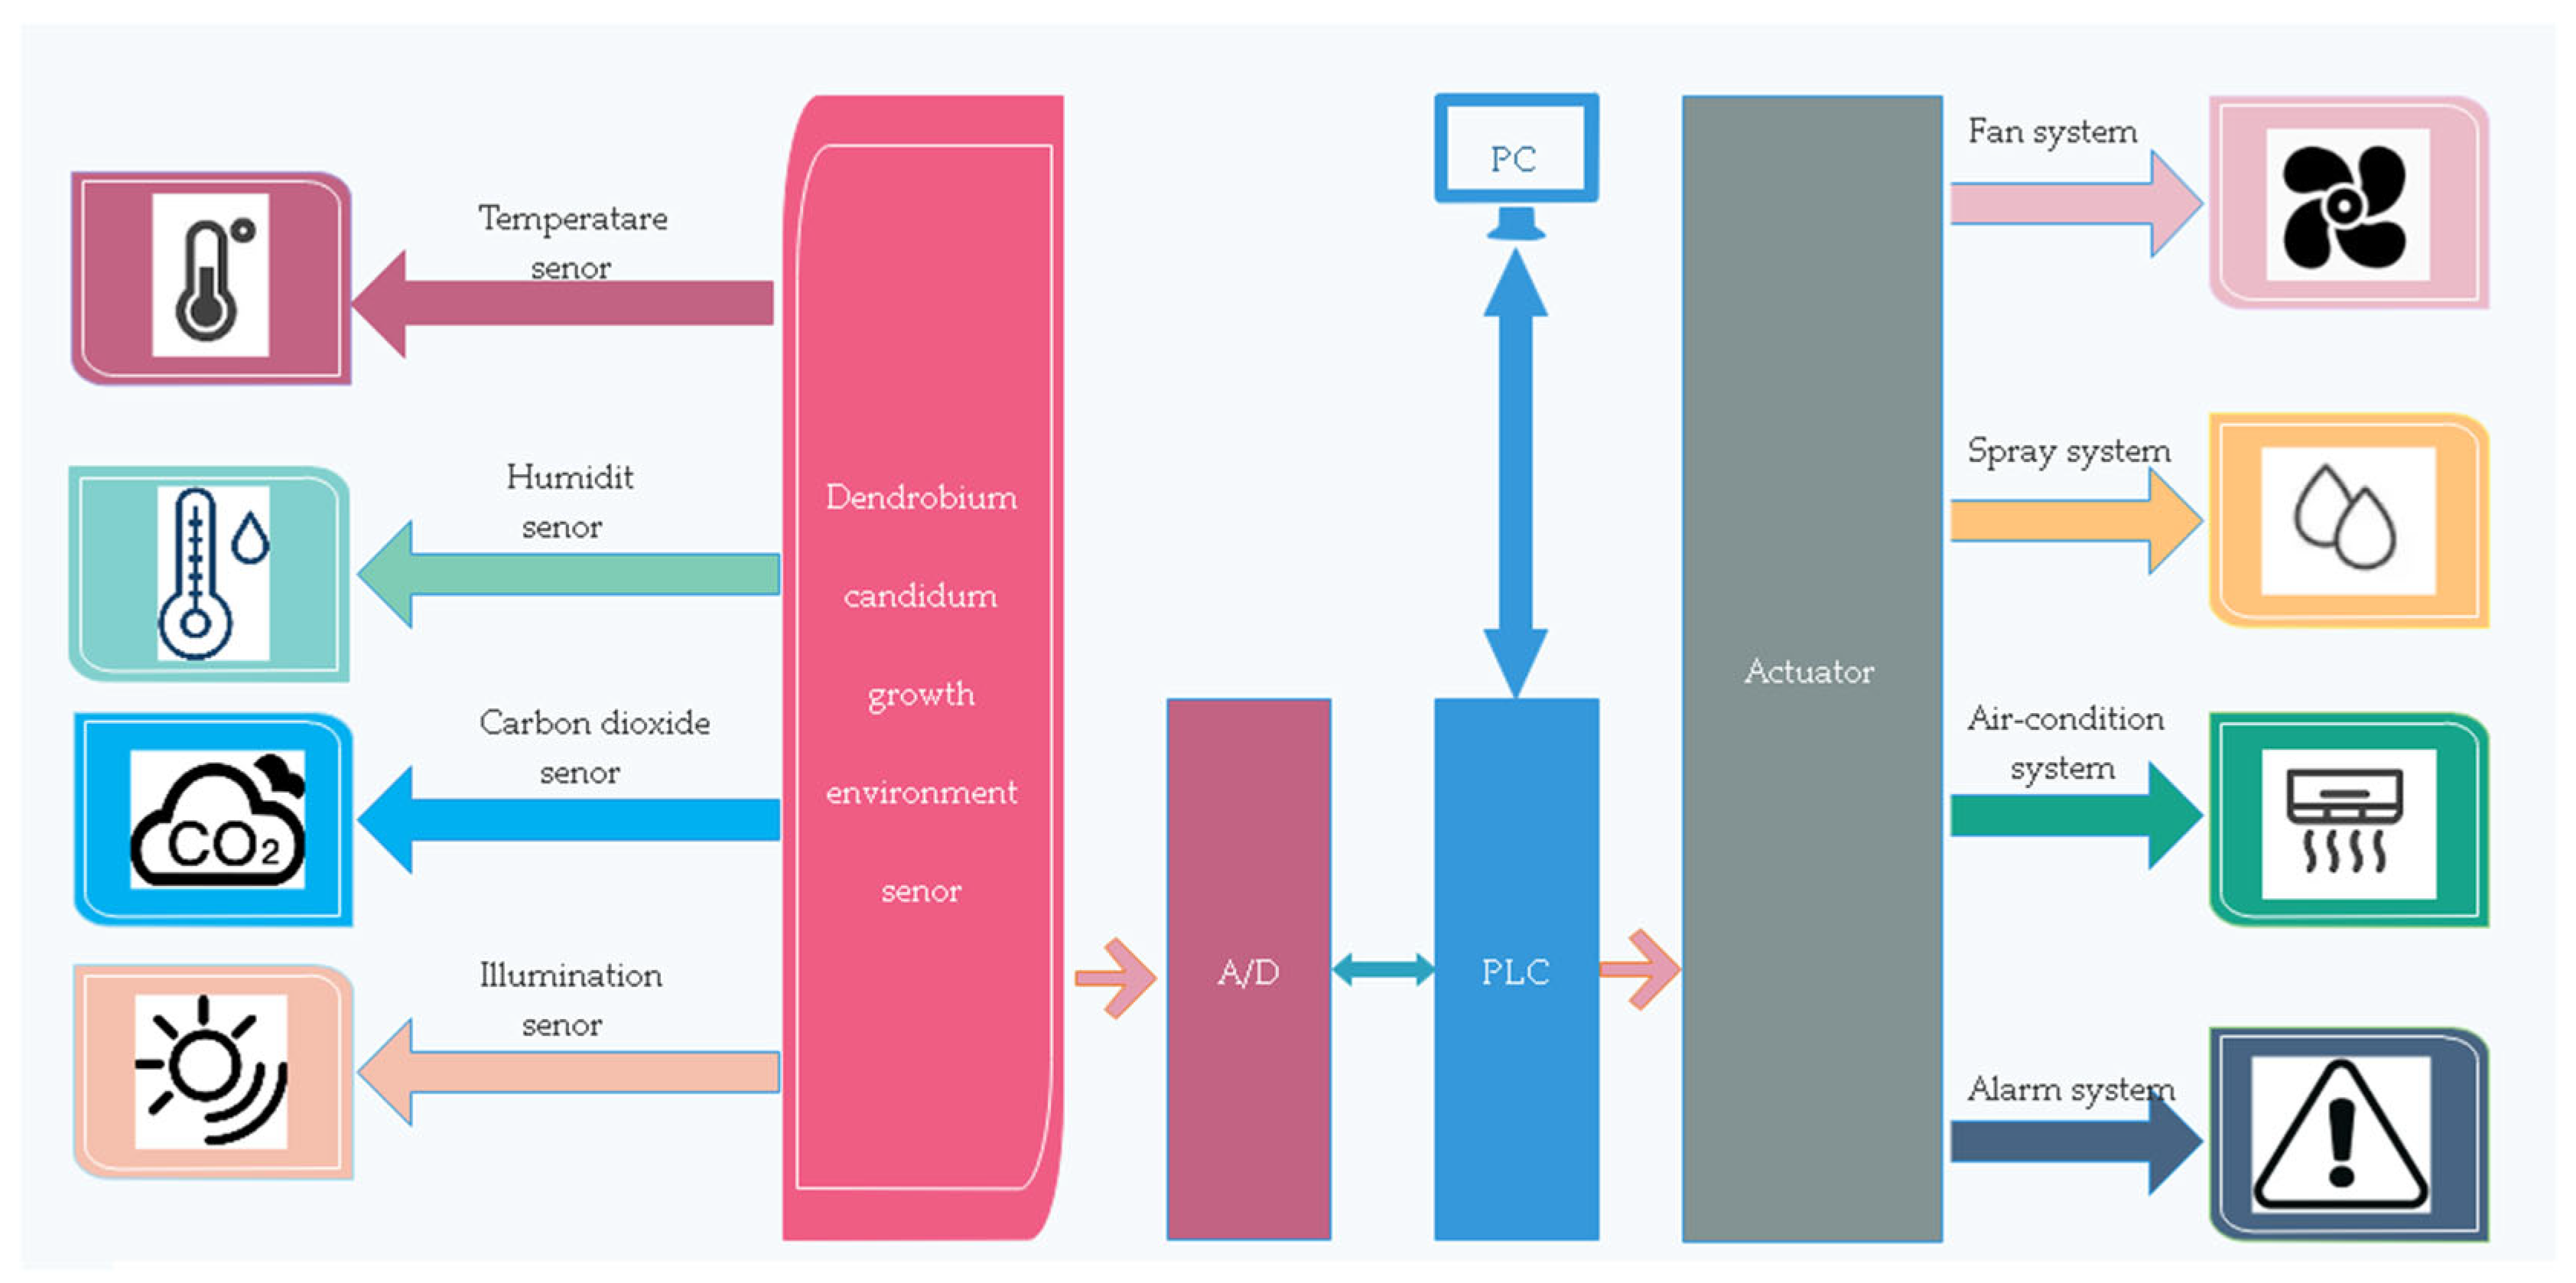
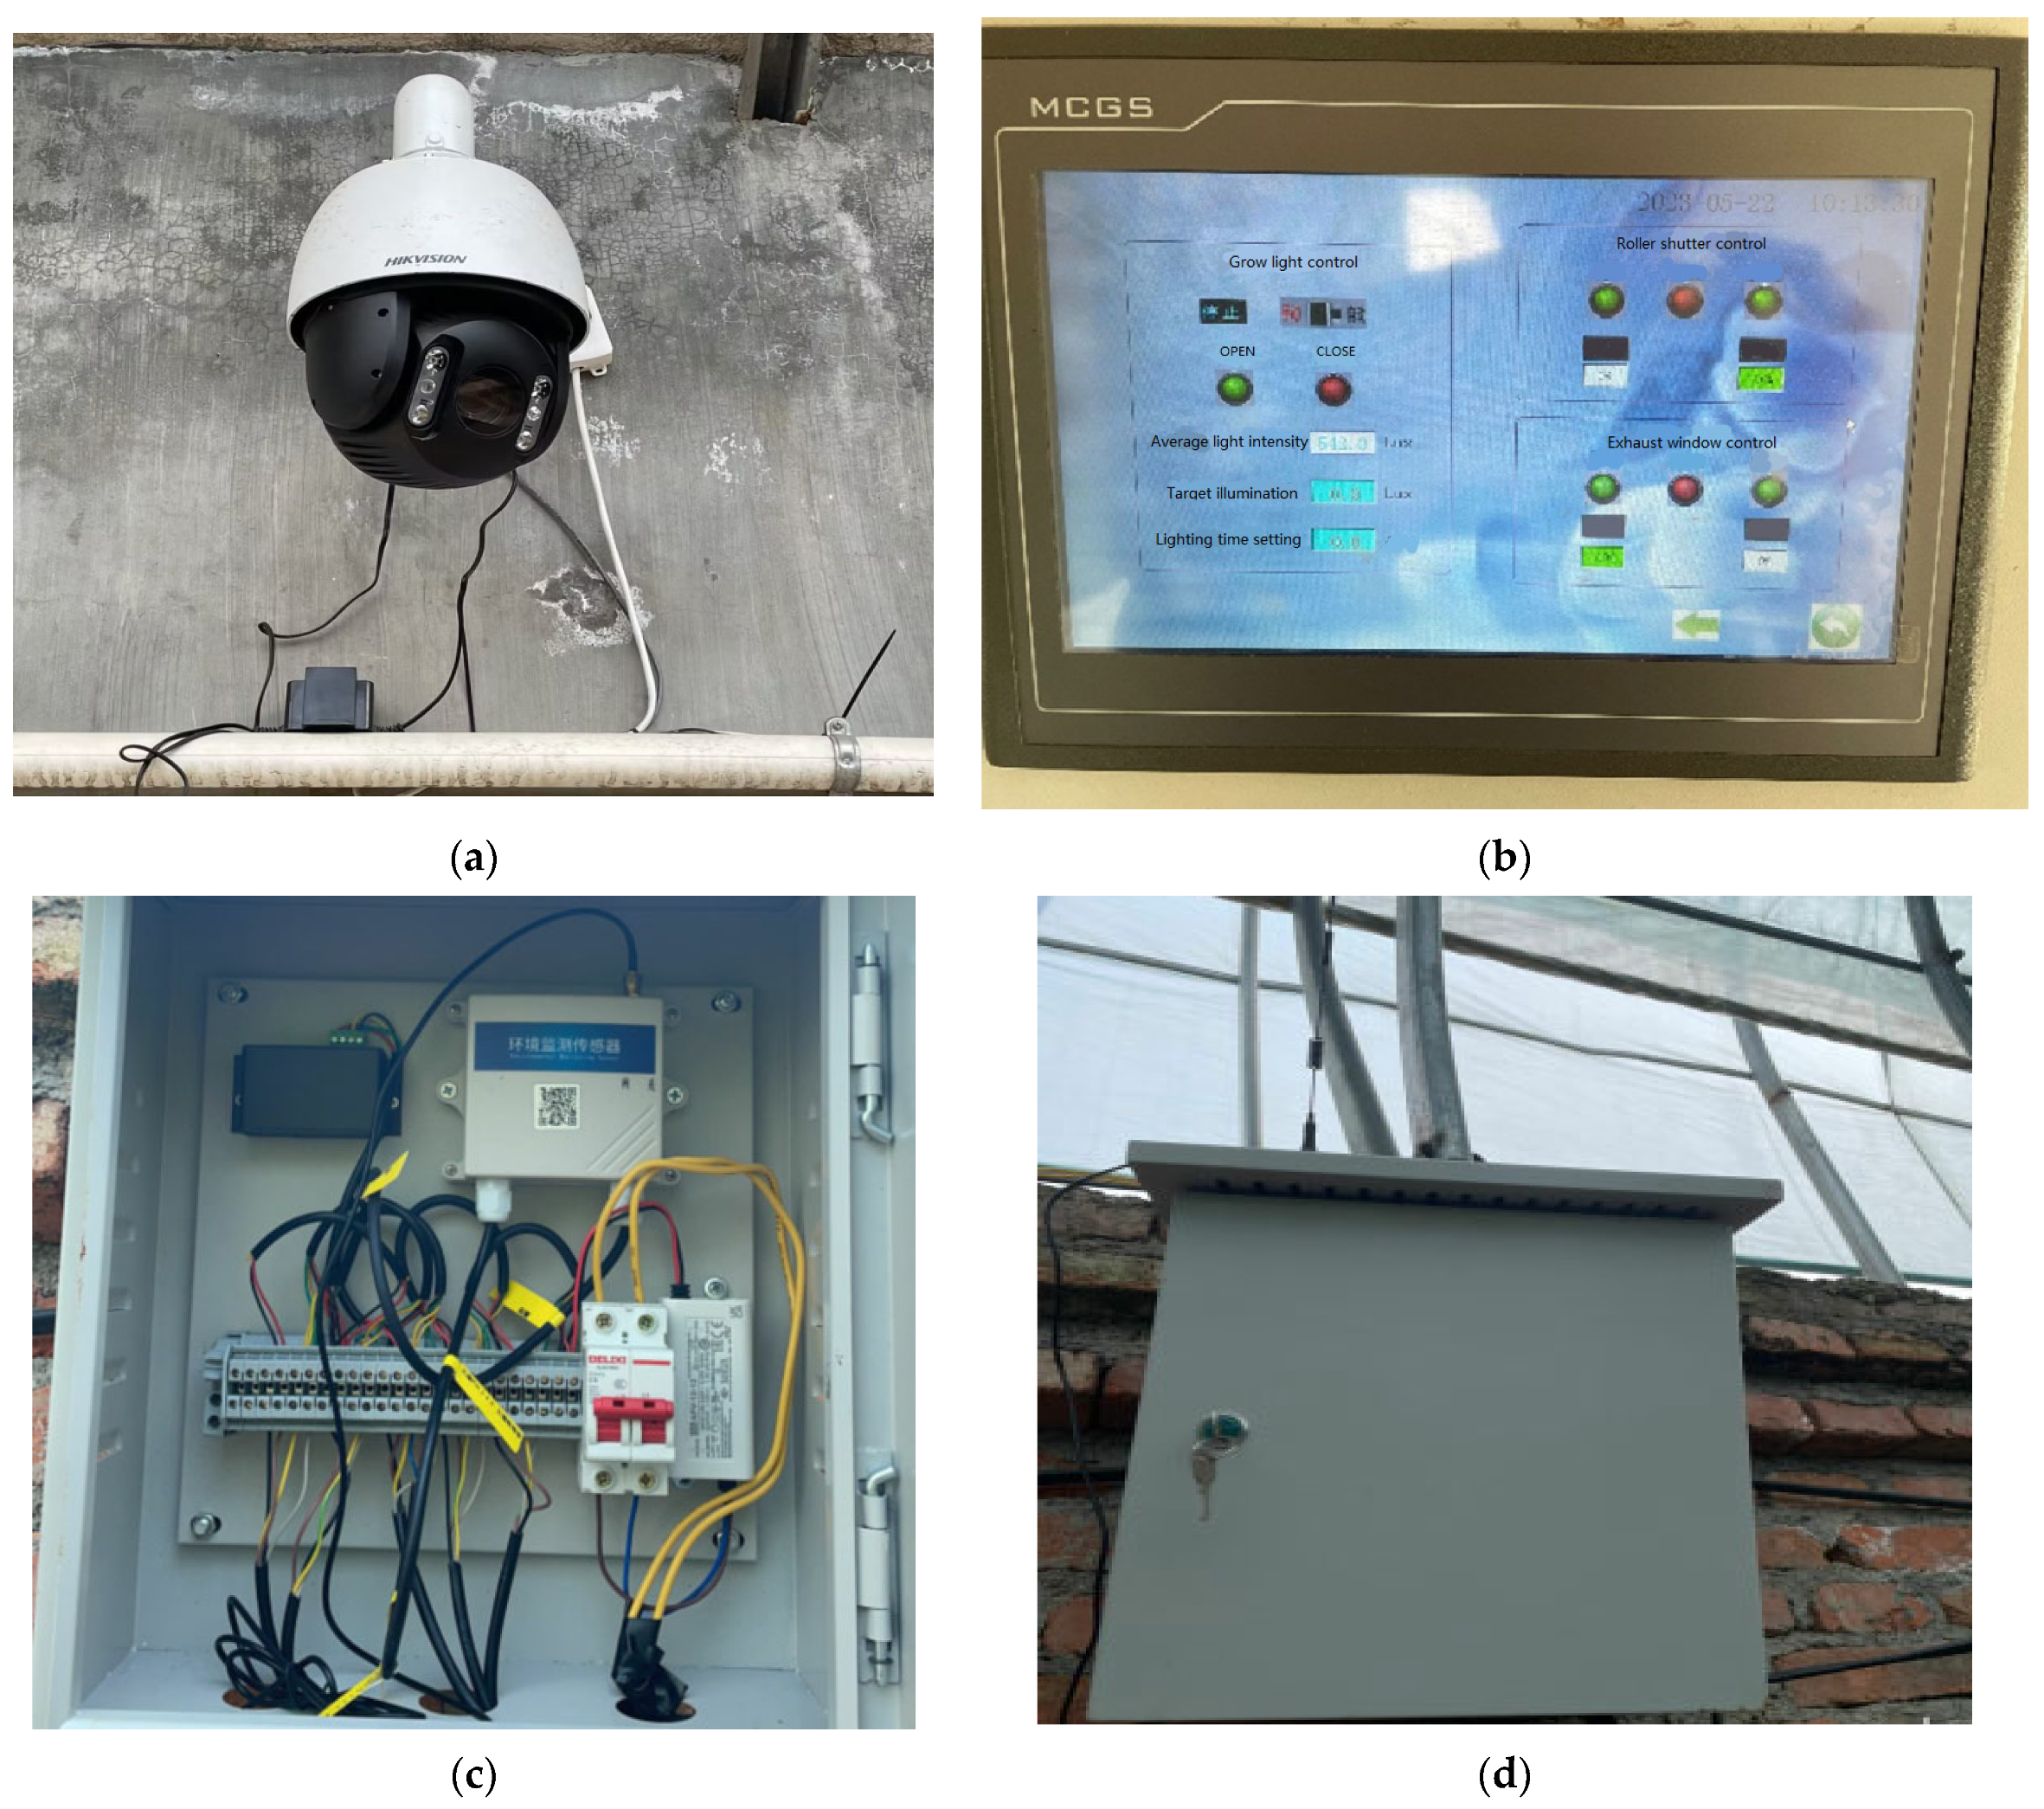
2.1. System Design

This study is based at the cultivation base in the Economic Development Zone of Changyi District, Jilin City, Jilin Province. In selecting the primary environmental factors that influence tomato growth, temperature, humidity, carbon dioxide concentration, and light intensity are identified as the fundamental monitoring and control variables [19]. The overall design of the control system is depicted in Figure 1. This system primarily consists of a data acquisition unit, a control terminal, a PLC (Programmable Logic Controller) unit, and a configuration unit. The PLC serves as the core controller, with a PC acting as the monitoring module, controlling system actuators via serial communication [20]. This design involves the periodic collection of parameters such as temperature, humidity, carbon dioxide levels, and light intensity through sensors, converting these into digital signals via an A/D converter and feeding them into the PLC controller [21].
Expanding upon this, the data acquisition unit of the system plays an indispensable role in ensuring accurate and real-time environmental monitoring within the greenhouse. It utilizes state-of-the-art sensors strategically positioned throughout the facility to capture precise readings of critical parameters such as temperature, humidity, and light intensity. These sensors are engineered to be highly sensitive and exceptionally reliable, offering continuous data streams that are vital for maintaining the ideal growing conditions for tomatoes. This setup not only facilitates the precise control of environmental factors but also enables prompt adjustments to optimize plant health and productivity [22].
The control terminal is the user interface of the system, allowing operators to set desired environmental parameters, view real-time data, and receive alerts. This terminal is user-friendly and provides an intuitive graphical representation of the greenhouse environment, making it easier for operators to make informed decisions [23].
The PLC unit, being the centerpiece of the system, is responsible for processing the input data and executing control actions. It is programmed to interpret the sensor data and compare it with the predefined optimal growth conditions. Based on this comparison, the PLC issues commands to various actuators like heating systems, cooling units, humidifiers, dehumidifiers, CO2 injectors, and lighting systems to adjust the environment accordingly [24].
Furthermore, the configuration unit includes software and hardware components that facilitate seamless integration and communication between different parts of the system [25]. It ensures that data flow between the sensors, PLC, and the control terminal is uninterrupted and secure, safeguarding against data loss or miscommunication [26].
The system’s design also emphasizes energy efficiency and sustainable operation. Optimizing environmental conditions not only promotes better crop yields but also conserves energy and reduces operational costs [27]. Additionally, the system is equipped with self-diagnostic and predictive maintenance features, enhancing its reliability and longevity.
In summary, this advanced control system represents a significant leap in precision agriculture [28]. By leveraging technology to maintain ideal growth conditions, it ensures the production of high-quality tomatoes, ultimately contributing to increased productivity and sustainability in agricultural practices [29].
The hardware control cabinet is shown in Figure 2; it mainly includes sensors and monitors, a parameter display, a control unit inside the cabinet, and a hardware control cabinet.
The system primarily collects parameters through various sensors and control actuators via the internal program of the PLC to turn the related equipment on or off, thereby adjusting the respective parameters [30]. As a result, the parameters are controlled to ensure optimal environmental conditions for the growth of greenhouse tomatoes.

2.2. Parameter Control Strategy

This control system is designed to optimize the growing conditions for greenhouse tomatoes, precisely managing key environmental parameters to ensure crops grow in ideal conditions [31]. Among these parameters, the interplay between temperature and humidity is particularly significant, as they directly affect the physiological activities and water balance of the plants.
Within this highly integrated system, the air conditioning units, heating systems, ventilation systems, and water spray fire extinguishing systems are crucial for maintaining a balance between temperature and humidity [32]. These systems have incorporated coordinated control operations, utilizing complex controls to respond to real-time environmental changes. For instance, when the interior temperature rises above the set optimal growth temperature, the Programmable Logic Controller (PLC) automatically activates the air conditioning unit, engaging fans to expel hot air from the greenhouse and enhance the cooling efficiency of the air conditioners [33]. Conversely, when the temperature falls below the target range, the heating system is activated, and the fans operate in reverse to distribute warm air, ensuring a constant temperature within the greenhouse [34].
Humidity control is equally precise, divided into humidification and dehumidification processes [35]. The humidification primarily relies on a water spray fire extinguishing system that raises the relative humidity in the greenhouse by spraying fine water droplets. These droplets can originate from steam generated by heating pipes or directly from water pipes [36]. When the water from the cooling tanks is insufficient for the water spray system, the system switches to using tap water to maintain the humidity levels [37].
Controlling the concentration of carbon dioxide is also crucial since it is a key raw material for photosynthesis. The system is equipped with a carbon dioxide compensator that automatically kicks in when the CO2 level within the greenhouse falls below the concentration necessary for plant growth, releasing carbon dioxide into the greenhouse [38].
Lighting management is another vital component of the system. It automatically adjusts based on real-time light intensity data within the greenhouse to maintain appropriate levels of light. When the light is insufficient, the system activates shading systems and LED light sources to supplement the lighting, ensuring that the tomatoes can perform effective photosynthesis. Conversely, when natural light is too intense, the system closes the shading facilities to prevent plant damage due to excessive light exposure.
Overall, this intelligent greenhouse control system not only improves the efficiency and precision of crop management but also enhances the quality and yield of greenhouse tomatoes by providing an environment best suited to their growth. Ultimately, it maximizes the sustainability and economic benefits of agricultural production.

2.3. Determination of the Best Parameters

This holistic approach is anticipated to provide actionable insights that can be tailored to different greenhouse setups, leading to a replicable framework for agricultural success.
The study’s methodology involves collecting extensive data on temperature, humidity, CO2 levels, and light intensity—key variables that have a direct impact on tomato growth. This data is then analyzed to establish patterns and correlations with plant health and fruit production. The resulting model, refined through iterative testing and validation, serves as a predictive tool to inform growers about the precise adjustments needed in real time to maintain the ideal growth environment. Additionally, the study explores the economic implications of implementing such a model, considering the balance between improved outcomes and the costs associated with environmental control systems.
To enhance the quality and yield of greenhouse tomatoes, it is essential to simulate an optimal growing environment through precise control. However, the factors influencing plant growth are numerous and complex, making it challenging to pinpoint the most favorable conditions for cultivation [39]. Typically, experimental methods are employed to broadly establish a conducive growth environment.
This study operates on the premise that high-quality tomatoes are cultivated in appropriate environmental conditions. Under this assumption, it is crucial to meticulously record data on environmental changes. Moreover, assessing the yield and quality of the tomatoes is vital. By focusing on data where the yield and size of the tomatoes are comparatively higher, this research employs the method of least squares fitting, along with a review of literature, to determine the optimal growth conditions for greenhouse tomatoes [40].
Expanding on this premise, the research looks beyond just environmental factors and considers the interplay of genetics, soil quality, and agronomic practices. By integrating these broader aspects, the study aims to formulate a comprehensive model that not only predicts but also enhances the growth outcomes for greenhouse tomatoes.
In conclusion, by systematically identifying the optimal conditions for greenhouse tomato growth, the study not only contributes to academic understanding but also offers practical solutions for the agricultural industry, with the potential to significantly elevate both the efficiency and sustainability of tomato farming practices.
The diurnal variation curve of the optimal environmental parameters of tomatoes with a 24-h period is shown in Figure 3. Table 1 shows the collected daily variation characteristics of the greenhouse tomato growing environment, including soil temperature and humidity sensors installed in the soil at the tomato roots and air temperature and humidity sensors installed inside the greenhouse. These devices continuously record data collected from the sensors and store it in internal memory.

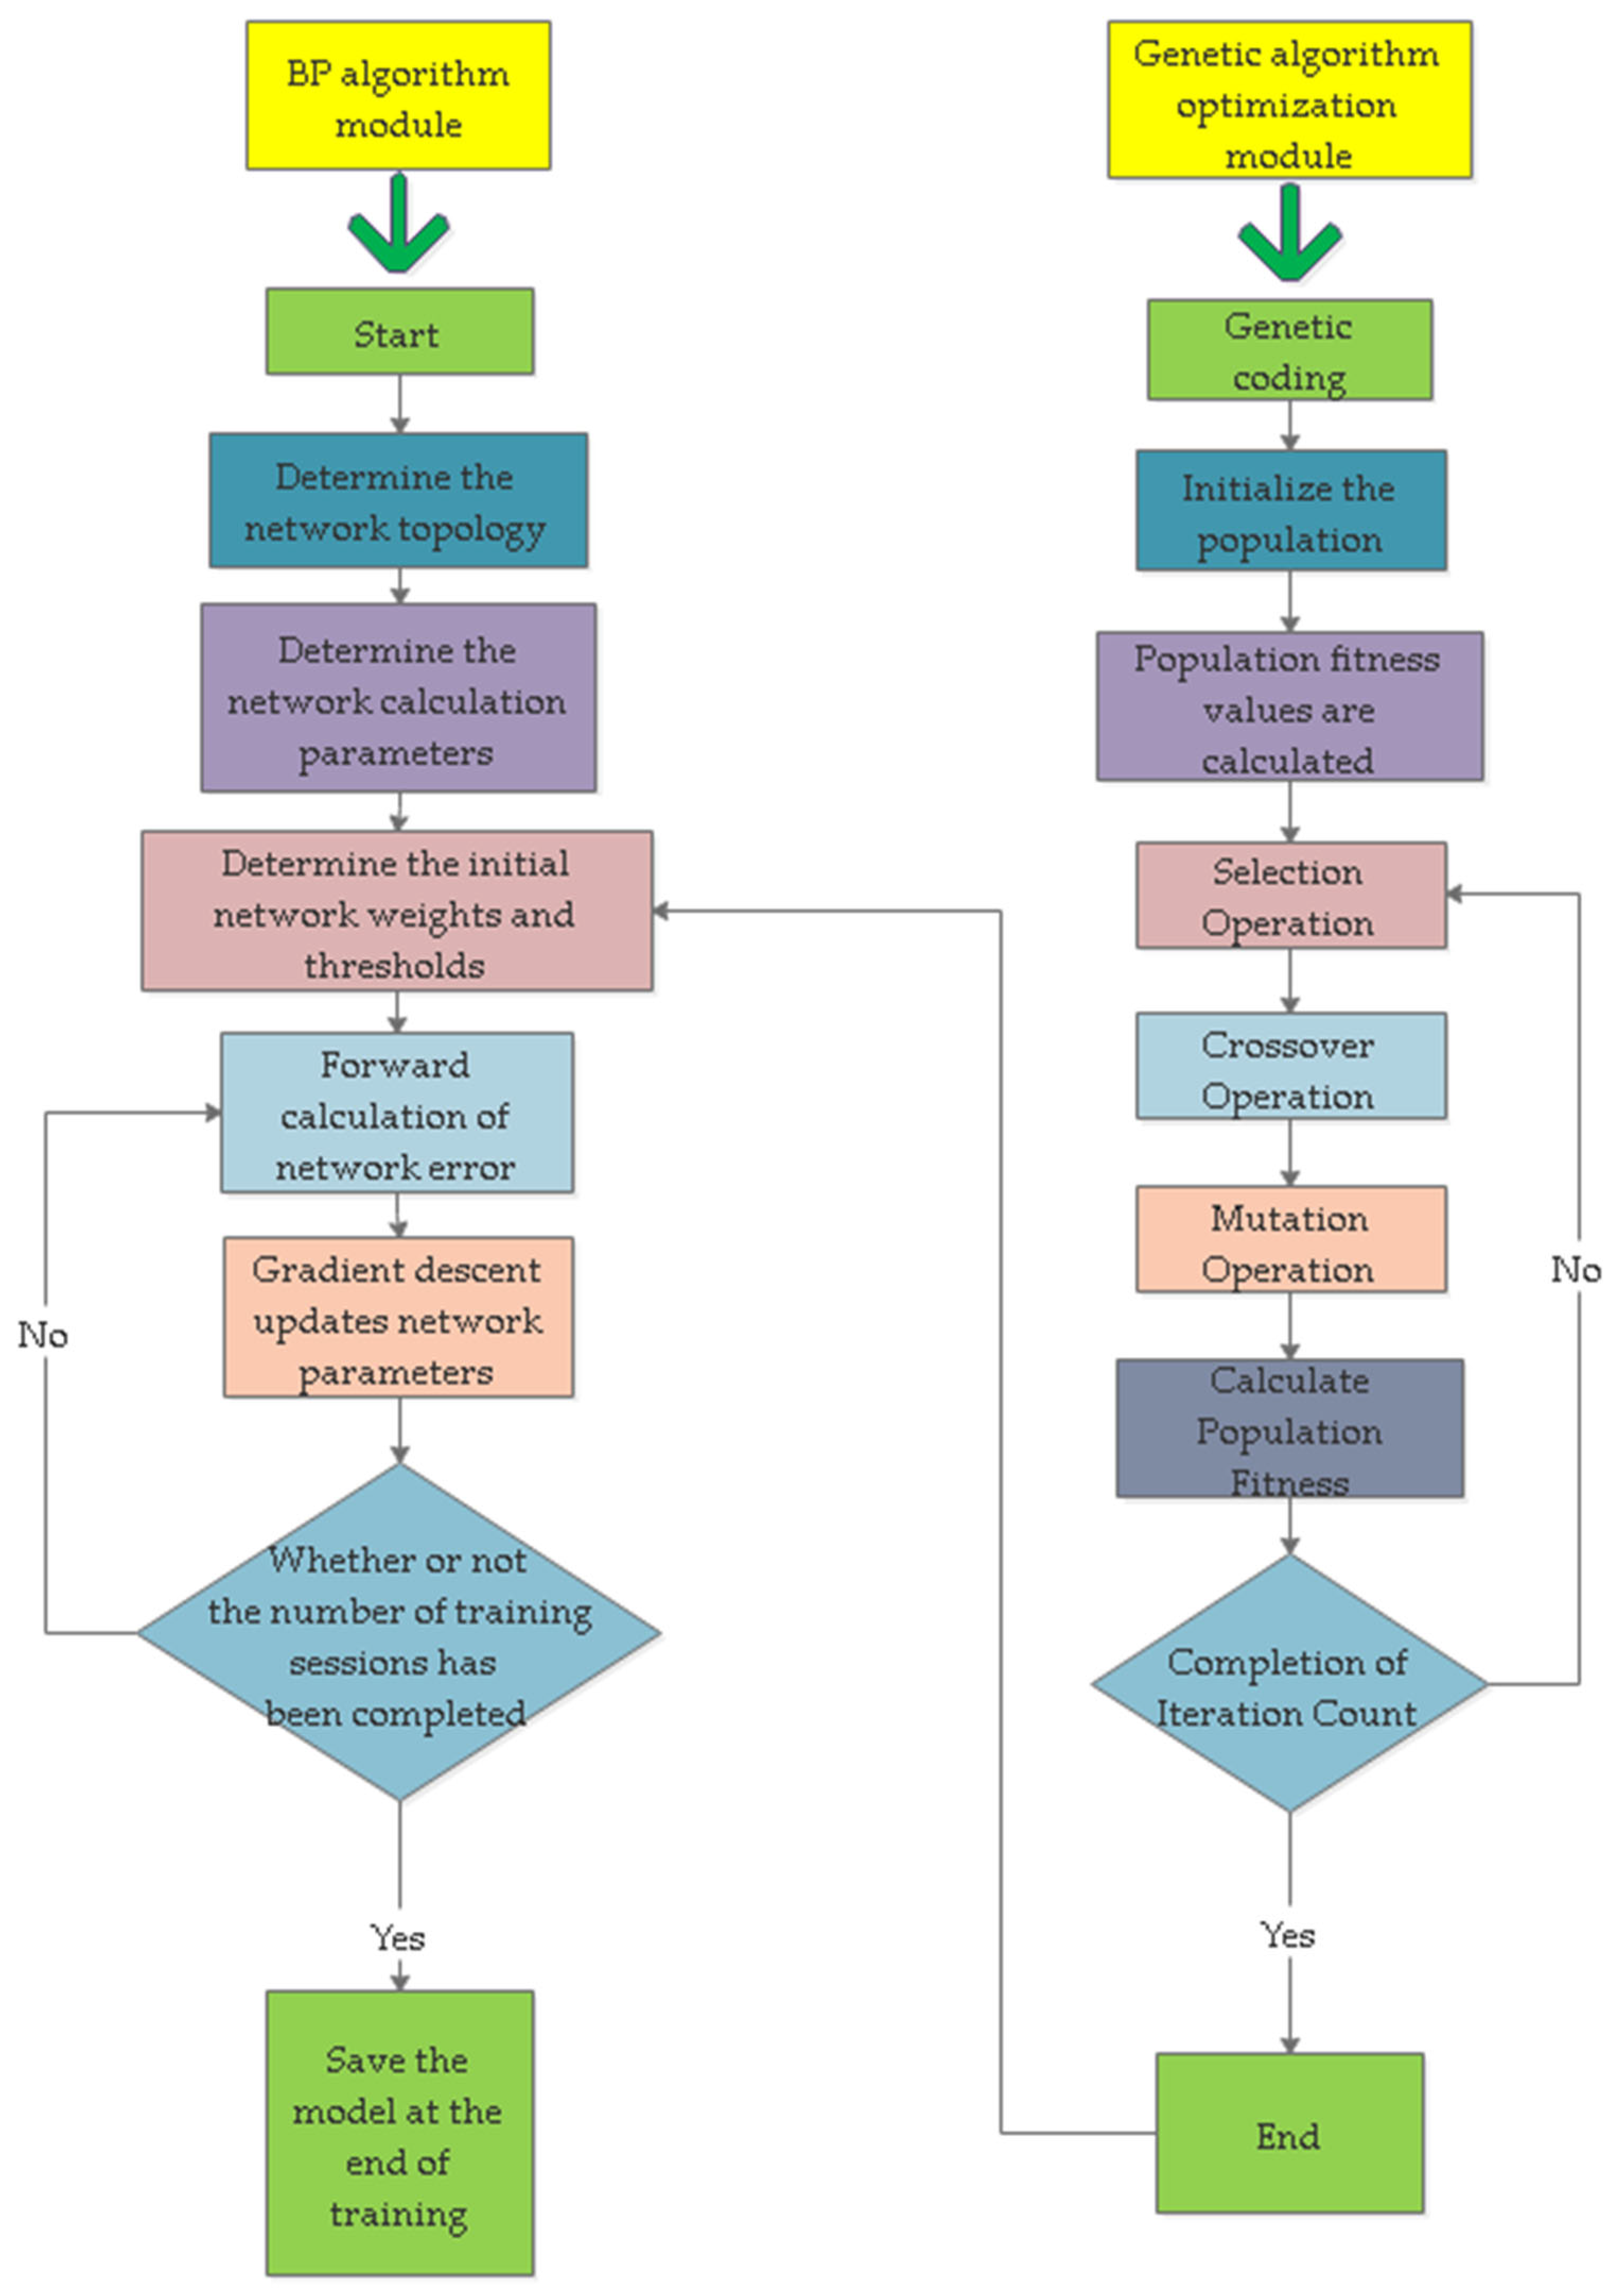
2.4. Establish a BP Neural Network Prediction Model

The BP neural network is a network model that employs a multilayer feedforward structure and is trained through the backpropagation of errors. It uses the gradient descent method to minimize the mean square error between the actual output and the expected output. When the mean square error of the output has not reached its minimum value, the network undergoes an iterative backpropagation process to calculate and correct this error. After several learning iterations, the network determines how the error affects the adjustment of its weights and thresholds. Due to its ability to approximate any nonlinear mapping with high precision, the BP neural network exhibits strong, multidimensional nonlinear learning capabilities and robustness [41]. The structure of the BP neural network is shown in Figure 4.
Soil temperature (Ti n ), air temperature (Hm n ), and soil humidity (Hi n ) are key indicators for measuring the temperature and humidity in cultivation. In Figure 4, D n represents the data of soil temperature (Ti n ), air temperature (Hm n ), and soil humidity (Hi n ) obtained from a single unit. The predictive parameters for tomatoes are constantly changing, but the value of a particular parameter at a certain moment is closely related to its historical data. To ensure the neural network can predict based on the tomato’s historical parameters, this experiment chooses m = 9, using 10 sets of consecutive historical data as input and data from the next period as output. The BP neural network prediction model is represented as follows:
D n + 1 = F ( D n , D n 1 , D n 2 , D n 3 , , D n m )
Here, F(D) represents the neural network’s predictive projection based on past cultivation temperature and humidity data relative to the forecast data. D(n) denotes the value of the predictive parameter at time n.
The fitting ability of a neural network depends on the number of nodes in the hidden layer. Generally, the more nodes in the hidden layer, the stronger the neural network’s fitting ability, but the more difficult it is to train. There is no well-established method for determining the number of hidden layer nodes. In this study, the number is determined based on an empirical formula:
L = b + c + a
Here, L represents the number of nodes in the hidden layer, b is the number of nodes in the input layer, c is the number of nodes in the output layer, and a is an empirical constant. Based on this experiment, using b = 40 and c = 4, the number of nodes in the hidden layer is, therefore, 14.
To ensure sufficient input sensitivity and good fitting of the neural network to sample data, as well as to reduce the adverse effects on training caused by different numerical scales, all data are normalized and mapped within the range [0, 1]:
x . = x x m i n x m a x x m i n
Here, x and x . represent the value of the variable x before and after normalization, respectively. x m a x is the maximum data value, and x m i n is the minimum data value.

3. Results

3.1. Improve the Neural Network with Genetic Algorithm

In traditional BP neural network training, there is a tendency to become stuck in local minima. To avoid this, a genetic algorithm can be introduced for optimization. The genetic algorithm, with its excellent global optimization capability simulating biological evolution, can iteratively evolve to find the optimal or near-optimal solution to a problem. Both BP and genetic algorithms are commonly used and complement each other. Therefore, this study combines these two algorithms to enhance performance and accuracy.
The GA-BP algorithm is a BP neural network algorithm improved by the genetic algorithm. Its concept is to utilize the global optimization ability of the genetic algorithm to obtain optimal initial weights and thresholds for the BP network, thus avoiding falling into local minima. Unlike traditional BP algorithms, the initial weights and thresholds in the GA-BP algorithm are not randomly generated but are optimized through the genetic algorithm. Specifically, the initial weights and thresholds of the BP algorithm are treated as the gene values of individuals in the genetic algorithm, forming chromosomes. Through iterative processes such as selection, crossover, and mutation in the genetic algorithm, an optimal individual is finally obtained. This individual is then used as the initial parameter for training the BP network. As a result, the GA-BP algorithm avoids the pitfalls of local minima in the BP algorithm, enhancing its performance and accuracy. The predictive process of the tomato growth model based on the GA-BP algorithm is shown in Figure 5.
In the selection operator module, the construction method used is the roulette wheel algorithm, which involves the following formula:
p ( x i ) = f ( x i ) j = 1 N f j
If the fitness of a certain part x i is f ( x i ), then p ( x i ) is the probability of being selected.
In the crossover operation module, the construction method used is the uniform crossover operator method, which involves the following formula:
{ x A = x B + ( 1 ) x A x B = x A + ( 1 ) x B
Of these, is a random number known as the expansion factor. Arithmetic crossover is a commonly used method of crossover in genetic algorithms. It involves combining the genes of two individuals through linear combination to generate two new offspring individuals. Genetic algorithms that use arithmetic crossover typically employ floating-point number encoding for chromosomes. For example, when pairing between chromosomes x A and x B , the offspring produced after the crossover operation would be as per the aforementioned formula.

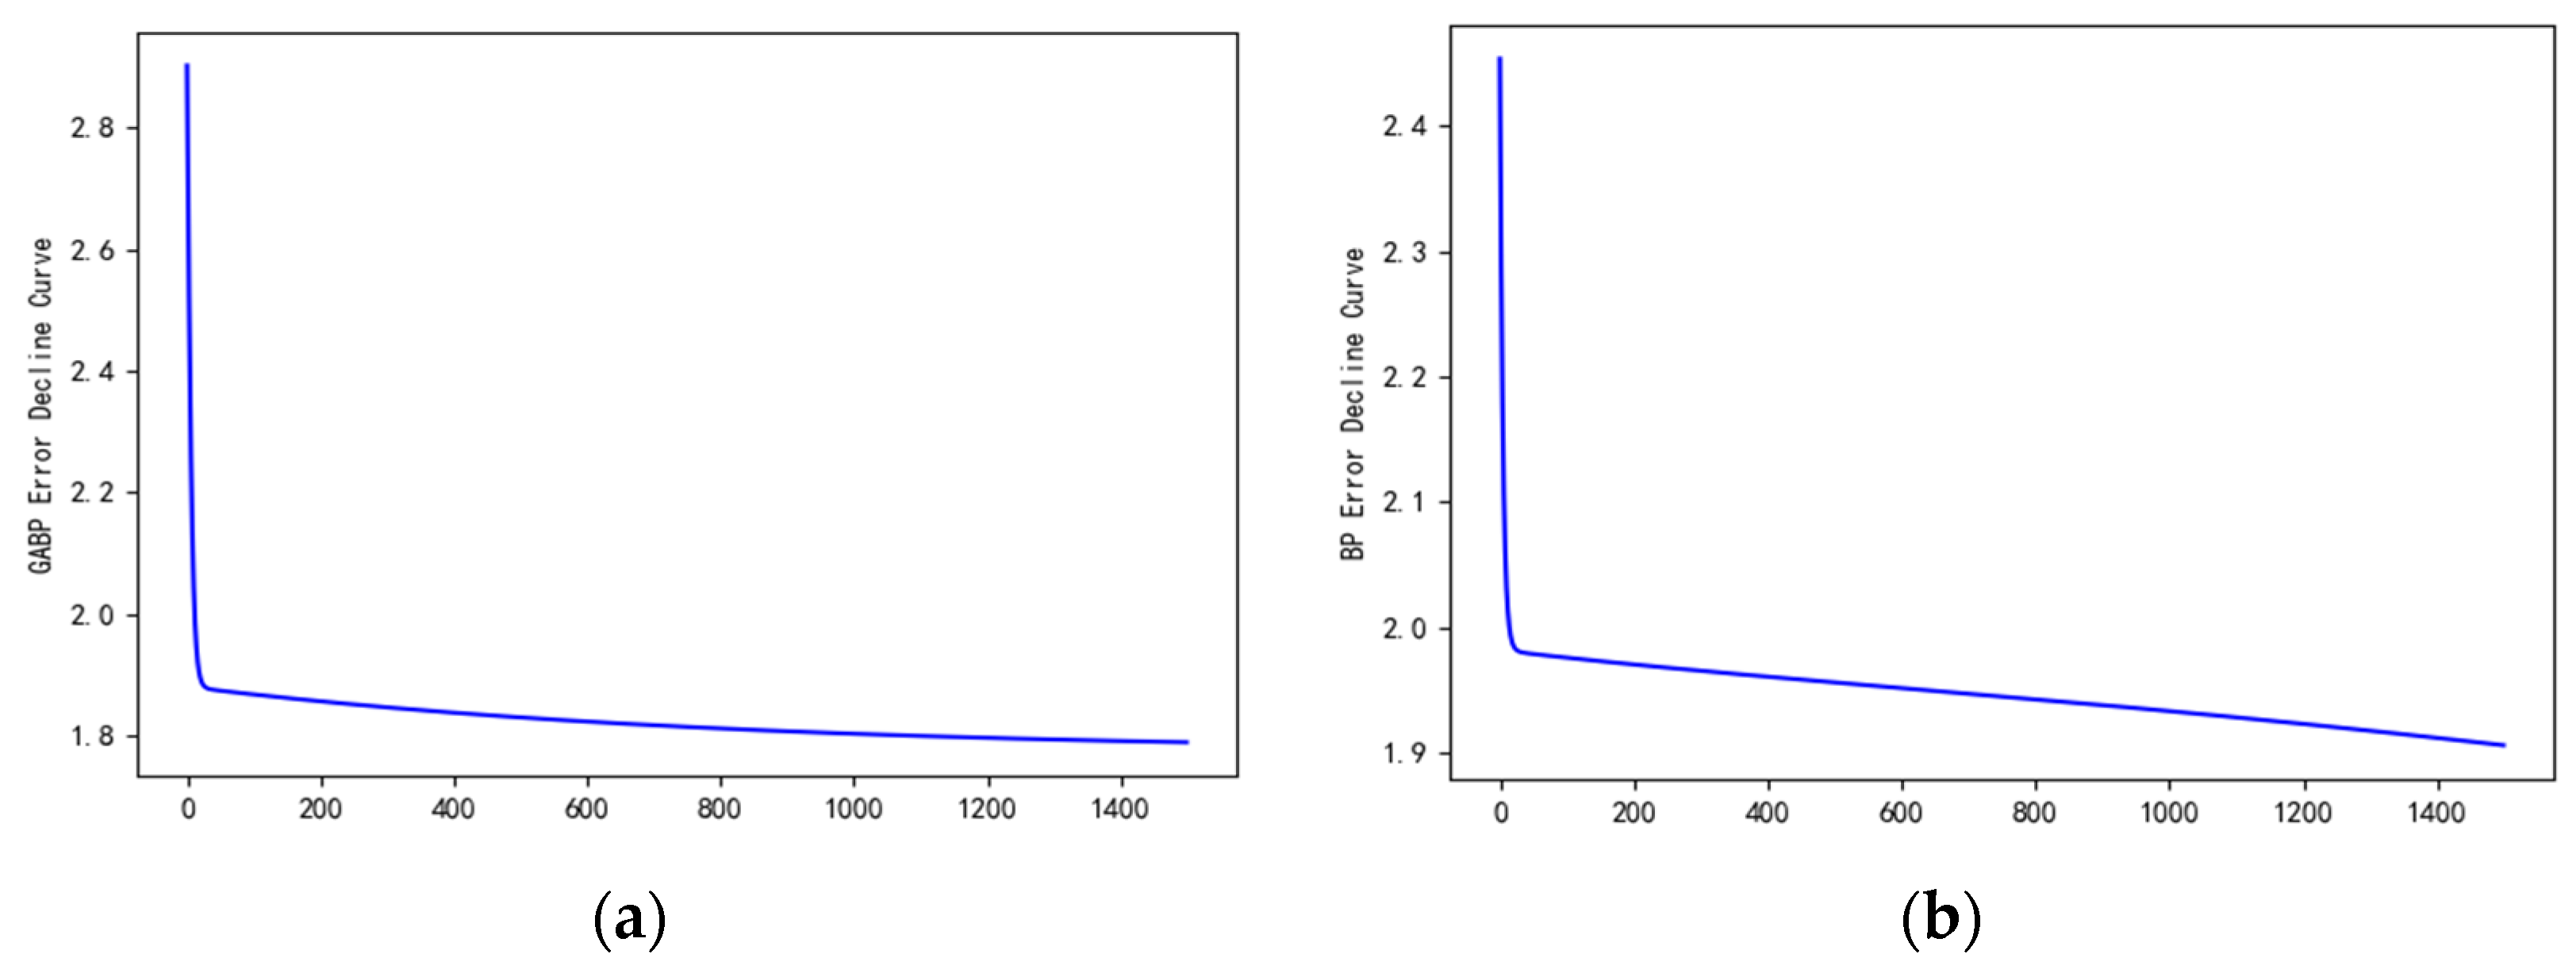
3.2. Comparison of Improved Algorithm and Traditional Algorithm

The Genetic Algorithm (GA) is a search and optimization algorithm inspired by biological evolution. It uses the concept of natural selection to find optimal solutions to problems. In GA, “individual encoding” and “population initialization” are fundamental components.
Individual Encoding:
In GA, each “individual” represents a potential solution in the problem space. The “encoding” of an individual is its specific representation, often in the form of strings like binary strings, real number lists, or other more complex data structures.
Binary Encoding: The most common encoding method, where each individual is represented by a string of binary numbers, with each bit representing a specific feature or parameter of the problem.
Real Number Encoding: For some problems, it’s more natural and convenient to represent each parameter of an individual directly as a real number.
Other Encoding Methods: Other encoding strategies can also be designed based on the nature of the problem, such as permutation encoding or tree encoding.
The choice of encoding strategy should adequately represent the problem space and facilitate genetic operations like crossover and mutation.
Population Initialization:
The “population” refers to a collection of individuals, and population initialization is the process of generating this group of initial solutions at the start of the GA.
Random Initialization: Typically, individuals in a population are initialized by generating their encodings randomly, ensuring broad coverage of the solution space.
Heuristic Initialization: In some cases, prior knowledge of the problem can guide the initialization process for a better starting point.
The size of the population is also an important parameter, influencing the algorithm’s search capability and use of computational resources. A larger population may offer more diverse genes, aiding in exploring the solution space, but also increasing computational costs.
After initialization, the population undergoes genetic operations like selection, crossover (pairing and recombination), and mutation (random changes), simulating natural selection, genetic inheritance, and variation in biological evolution. The purpose is to produce a new generation of solutions where individuals are generally more adapted to the environment (i.e., closer to the optimal solution).

3.3. Analysis

When establishing a tomato growth prediction model, it’s crucial first to determine the number of layers in the BP neural network structure. A three-layer BP neural network, consisting of an input layer, a hidden layer, and an output layer, can approximate any complex nonlinear mapping with arbitrary precision. This approach is based on the Universal Approximation Theorem, which states that a network with a single hidden layer containing a sufficient number of neurons can approximate any continuous function to any degree of accuracy. Therefore, this study employs a three-layer BP network structure.
When applying this to a tomato growth prediction model, it means:
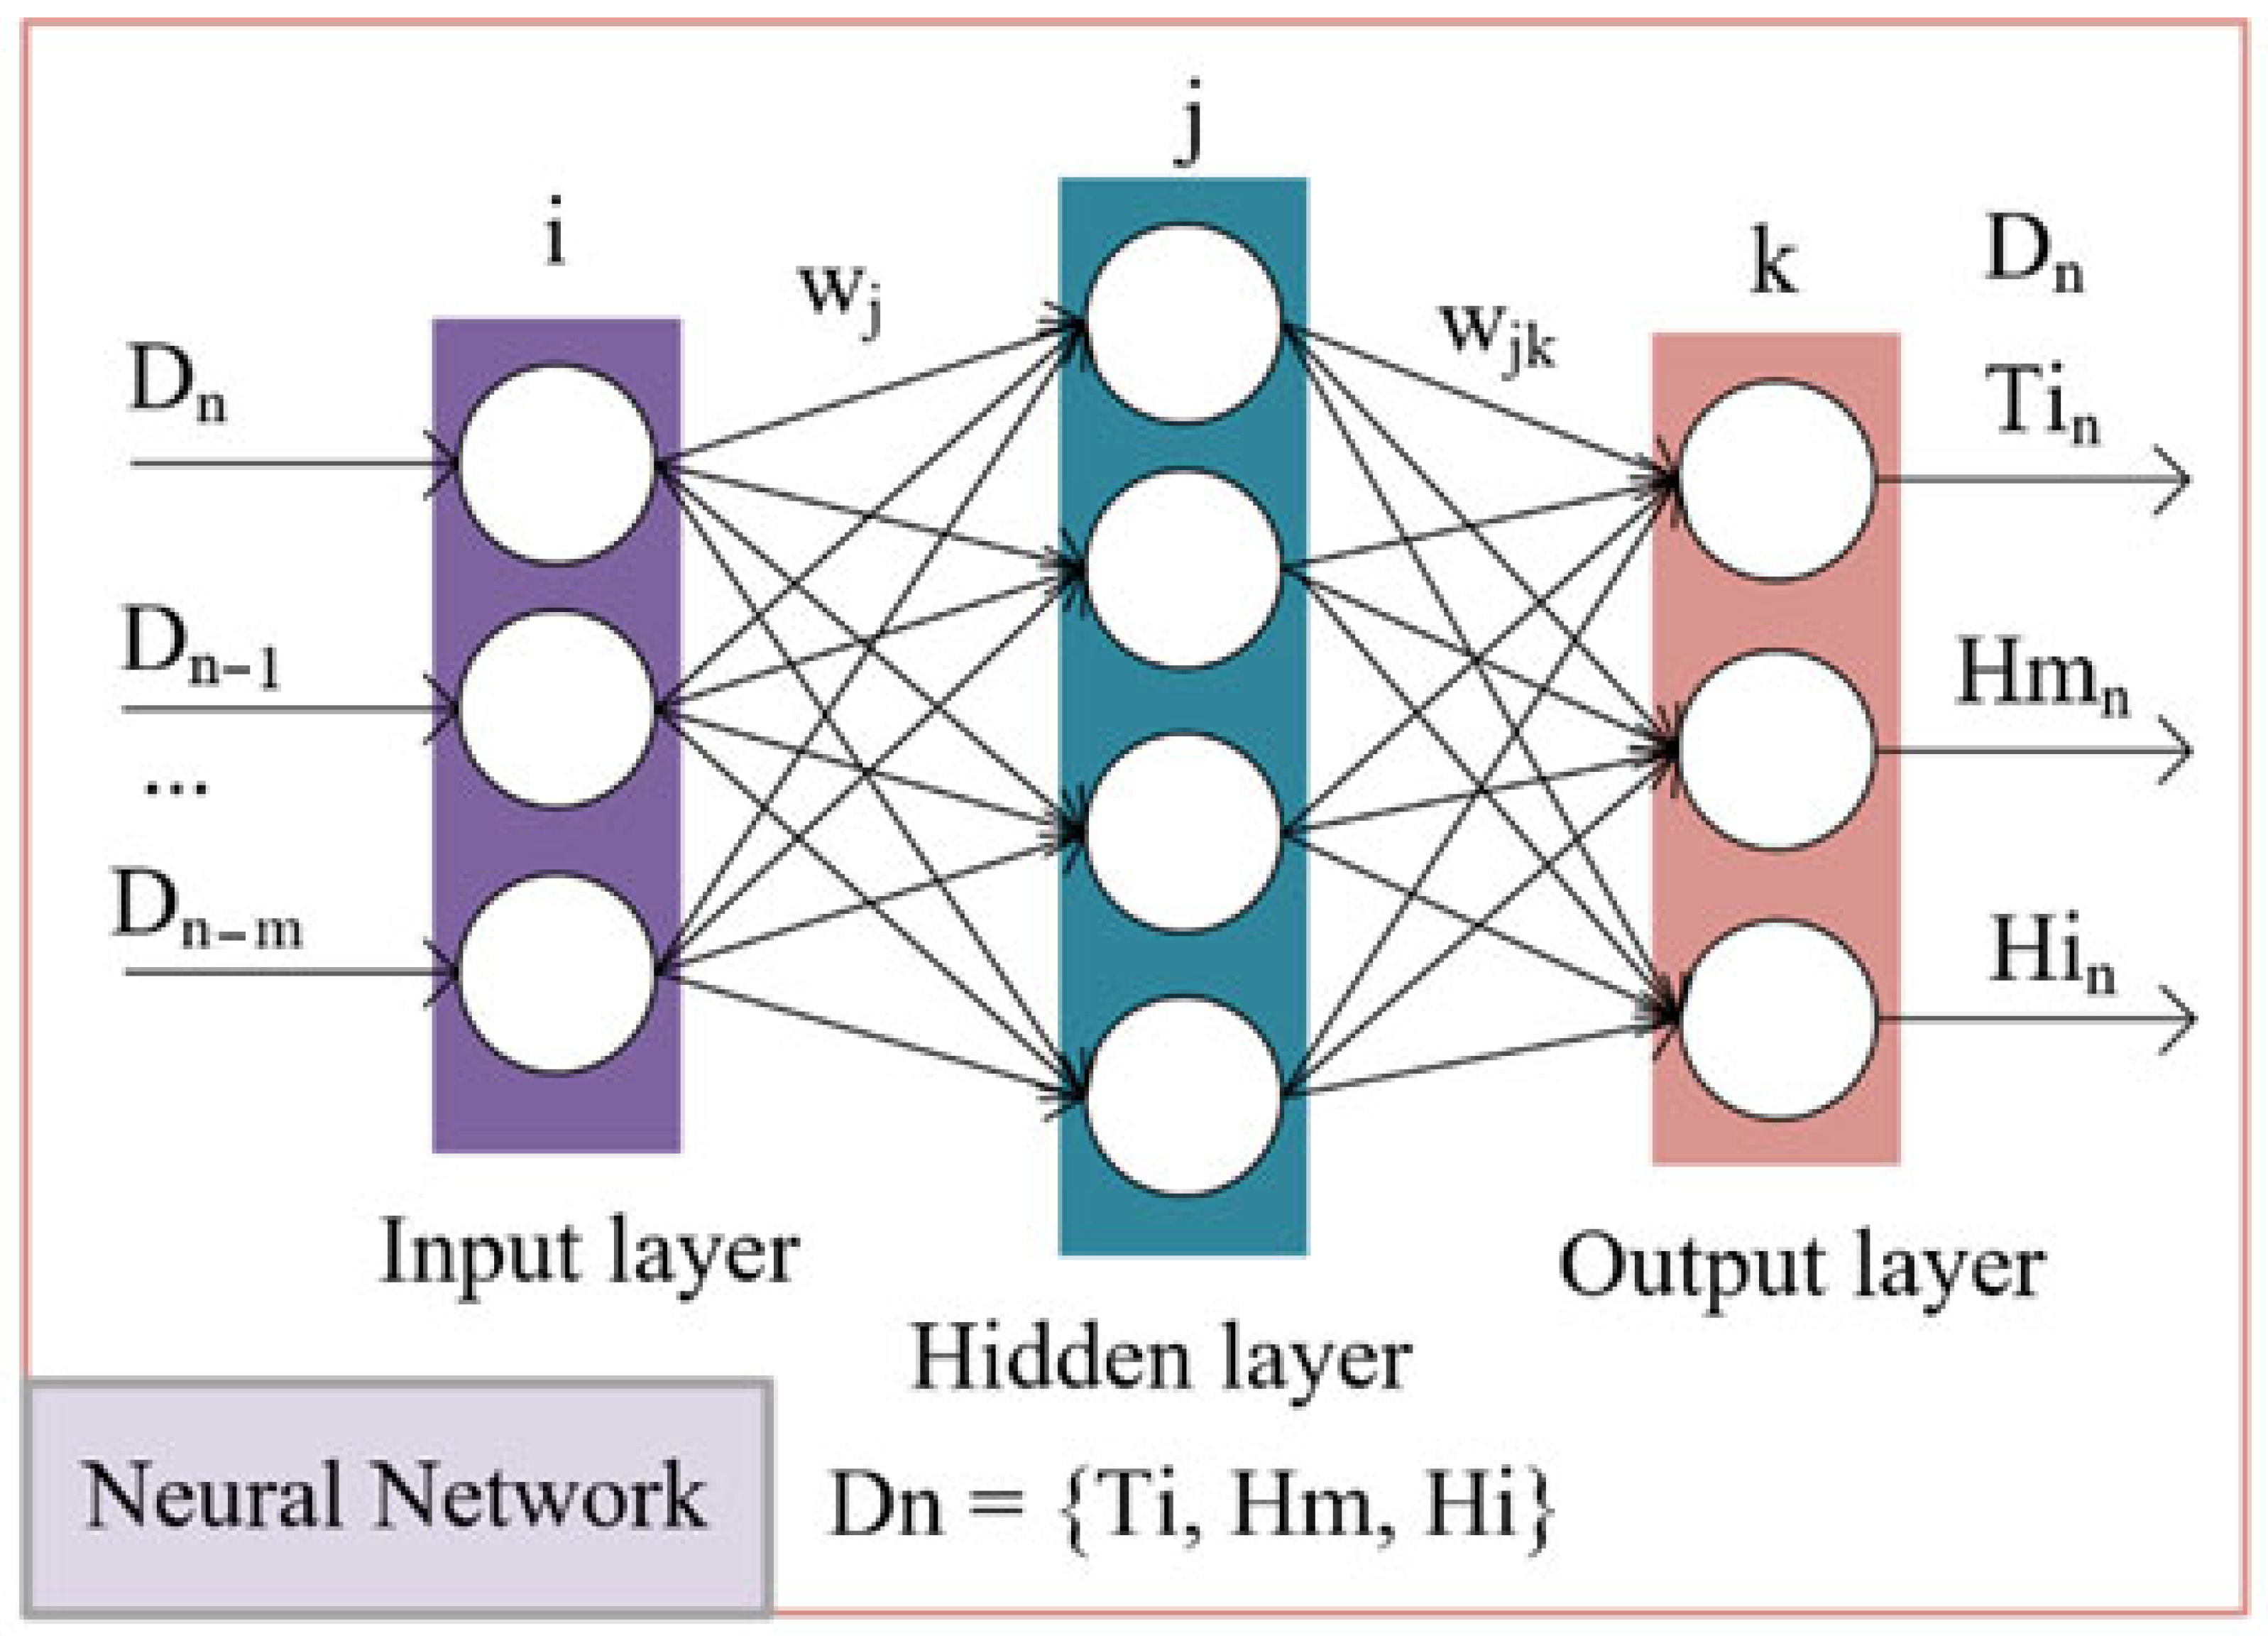
  • Input Layer: There should be as many neurons as there are features relevant to predicting tomato growth. For instance, if soil temperature, humidity, light intensity, and CO2 concentration are used as features, the input layer should have four neurons;
  • Hidden Layer: A crucial part of the BP network, the number of neurons (hidden neurons) in this layer should be determined based on the complexity of the problem, size, and dimensions of the training data. The number of neurons in the hidden layer is not fixed and should be optimized through experimentation to find the best network performance;
  • Output Layer: The number of neurons in the output layer should correspond to the number of prediction targets. In the case of tomato growth prediction, if the goal is to predict a single growth indicator like size or weight, then the output layer may only need one neuron.
Choosing suitable activation functions, learning rates, and other training parameters is also crucial as they impact the network’s learning ability and prediction accuracy. Typically, these hyperparameters are determined through cross-validation and assessment of network performance.
Sufficient data collection is needed to train the network, ensuring it can learn the complex relationships between soil, climate, and plant growth. Moreover, the model requires thorough testing and validation to ensure the accuracy and generalizability of its predictions.
The effectiveness of neural network training can be measured by two key indicators. The first is training performance, reflecting the network’s ability to reproduce known training data. The second is predictive performance, indicating how well the network predicts unknown data. Within a certain range, fitting effectiveness is positively correlated with predictive performance, but overfitting may occur. The results of this prediction are shown in Figure 6.
The Figure shows the prediction results after training with experimental data. The red line represents the actual measured greenhouse humidity data, while the blue line represents the predicted cultivation humidity data. If the two lines coincide, it indicates that the BP neural network can predict changes in humidity in advance within a cycle. The graph shows good periodicity in humidity. With an average relative error of less than 5%, the average prediction accuracy is higher than 95%, demonstrating that the GA-BP algorithm has excellent training and prediction capabilities.
In this experiment, a comparison was made between the traditional BP neural network training algorithm and the GA-improved BP neural network algorithm proposed in this paper [42,43]. By implementing the same temperature and humidity dataset, the specific results are shown in Table 2.
The data shows that the improved neural network performs better in global optimization. Reducing the convergence step size effectively reduces the instability caused by the randomness of input data, thereby enhancing the stability and reliability of the system. Moreover, compared to the traditional BP neural network, the convergence speed of the improved network is significantly faster. This increase in speed is due to the optimized algorithm’s more effective handling of error gradients and weight adjustments, reducing the number of iterations and achieving rapid convergence. Therefore, this improved neural network is not only more precise but also more efficient in handling complex problems. The reduction in convergence step size reduces instability caused by the randomness in inputs. Furthermore, it converges faster than a standard BP neural network. The convergence comparison plot is shown in Figure 7:
In Table 3, data on the quality of the collected tomatoes are shown.

4. Conclusions

Taking the cultivation base in the Economic Development Zone of Changyi District, Jilin City, Jilin Province as the research site, a greenhouse environment precise control and prediction system based on PLC was constructed, enabling control over soil temperature, soil humidity, air temperature, and air humidity. Additionally, a BP neural network model improved by a genetic algorithm was proposed. By establishing this model, the growth environment of greenhouse tomatoes was obtained and predicted. Training the neural network helped determine the general trends of cultivation predictive parameters over time, thereby outputting various predictive parameters simultaneously. The results show that this method not only shortened the network training time but also improved the network’s convergence efficiency and stability. The average relative errors of soil temperature and humidity and air temperature and humidity were all within 5%, making this system a reliable basis for regulating and predicting the greenhouse environment for tomato growth.

Author Contributions

Conceptualization, W.Z. (Wenyu Zhong); formal analysis, Z.L., B.D., M.L. and W.Z. (Wei Zhang); funding acquisition, B.C., M.H. and Y.T.; investigation, Z.L.; methodology, W.Z. (Wei Zhang), B.D., M.L. and B.C.; project administration, Y.T.; resources, B.C., M.H. and Y.T.; software, Z.L. and H.Y.; supervision, W.Z. (Wenyu Zhong); validation, W.Z. (Wei Zhang), B.D. and M.L.; writing—original draft, W.Z. (Wei Zhang); writing—review and editing, B.D. and M.L. All authors have read and agreed to the published version of the manuscript.

Funding

This research was supported by the Jilin Province Science and Technology Development Program Project (Project No. YDZJ202201ZYTS692) and the Project of Exploring Deep Learning in the Swift Management and Application of State-owned Assets (No. 20230052).

Institutional Review Board Statement

Not applicable.

Informed Consent Statement

Not applicable.

Data Availability Statement

Data are contained within the article.

Conflicts of Interest

The authors declare no conflicts of interest.

References

  1. Zhang, Y.; Henke, M.; Li, Y.; Sun, Z.; Li, W.; Liu, X.; Li, T. Estimating the Light Interception and Photosynthesis of Greenhouse-Cultivated Tomato Crops under Different Canopy Configurations. Agronomy 2024, 14, 249. [Google Scholar] [CrossRef]
  2. Fidan, H.; Ulusoy, D.; Albezirgan, H.N. Exploring Effective Strategies for ToBRFV Management in Tomato Production: Insights into Seed Transmission Dynamics and Innovative Control Approaches. Agriculture 2024, 14, 108. [Google Scholar] [CrossRef]
  3. Liu, H.; Shao, M.; Yang, L. Photosynthesis Characteristics of Tomato Plants and Its’ Responses to Microclimate in New Solar Greenhouse in North China. Horticulturae 2023, 9, 197. [Google Scholar] [CrossRef]
  4. Fu, H.; Guo, M.; Shan, X.; Zhang, X.; Sun, Z.; Liu, Y.; Li, T. 13 Cycles of Consecutive Tomato Monoculture Cropping Alter Soil Chemical Properties and Soil Fungal Community in Solar Greenhouse. Horticulturae 2023, 9, 505. [Google Scholar] [CrossRef]
  5. Peng, X.; Yu, X.; Luo, Y.; Chang, Y.; Lu, C.; Chen, X. Prediction Model of Greenhouse Tomato Yield Using Data Based on Different Soil Fertility Conditions. Agronomy 2023, 13, 1892. [Google Scholar] [CrossRef]
  6. Ge, J.; Yu, Z.; Gong, X.; Ping, Y.; Luo, J.; Li, Y. Evaluation of Irrigation Modes for Greenhouse Drip Irrigation Tomatoes Based on AquaCrop and DSSAT Models. Plants 2023, 12, 3863. [Google Scholar] [CrossRef] [PubMed]
  7. Appolloni, E.; Paucek, I.; Pennisi, G.; Manfrini, L.; Gabarrell, X.; Gianquinto, G.; Orsini, F. Winter Greenhouse Tomato Cultivation: Matching Leaf Pruning and Supplementary Lighting for Improved Yield and Precocity. Agronomy 2023, 13, 671. [Google Scholar] [CrossRef]
  8. Fan, Z.; Li, Y.; Jiang, L.; Wang, L.; Li, T.; Liu, X. Analysis of the Effect of Exhaust Configuration and Shape Parameters of Ventilation Windows on Microclimate in Round Arch Solar Greenhouse. Sustainability 2023, 15, 6432. [Google Scholar] [CrossRef]
  9. Han, X.; Sun, Y.; Chen, J.; Wang, Z.; Qi, H.; Liu, Y.; Liu, Y. Effects of CO2 Enrichment on Carbon Assimilation, Yield and Quality of Oriental Melon Cultivated in a Solar Greenhouse. Horticulturae 2023, 9, 561. [Google Scholar] [CrossRef]
  10. Ge, J.; Liu, H.; Gong, X.; Yu, Z.; Li, L.; Li, Y. Root Distribution of Tomato Cultivated in Greenhouse under Different Ventilation and Water Conditions. Plants 2023, 12, 1625. [Google Scholar] [CrossRef] [PubMed]
  11. Tawfik, M.A.; Oweda, K.M.; Abd El-Wahab, M.K.; Abd Allah, W.E. A New Mode of a Natural Convection Solar Greenhouse Dryer for Domestic Usage: Performance Assessment for Grape Drying. Agriculture 2023, 13, 1046. [Google Scholar] [CrossRef]
  12. Lei, H.; Lian, Y.; Du, J.; Pan, H.; Li, X.; Li, D.; Jin, C.; Xiao, Z.; Hou, Y. Dynamic Optimization of Greenhouse Tomato Irrigation Schedule Based on Water, Fertilizer and Air Coupled Production Function. Agronomy 2023, 13, 776. [Google Scholar] [CrossRef]
  13. Liu, H.; Lu, L.; Sun, D.; Liu, P.; Li, Y.; Li, T.; Liu, X. A Two-Factor Thermal Screen Control Strategy for Chinese Solar Greenhouses in High-Latitude Areas. Agronomy 2023, 13, 821. [Google Scholar] [CrossRef]
  14. An, S.; Yang, F.; Yang, Y.; Huang, Y.; Zhangzhong, L.; Wei, X.; Yu, J. Water Demand Pattern and Irrigation Decision-Making Support Model for Drip-Irrigated Tomato Crop in a Solar Greenhouse. Agronomy 2022, 12, 1668. [Google Scholar] [CrossRef]
  15. Yang, L.; Liu, H.; Tang, X.; Li, L. Tomato Evapotranspiration, Crop Coefficient and Irrigation Water Use Efficiency in the Winter Period in a Sunken Chinese Solar Greenhouse. Water 2022, 14, 2410. [Google Scholar] [CrossRef]
  16. Yang, L.; Liu, H.; Cohen, S.; Gao, Z. Microclimate and Plant Transpiration of Tomato (Solanum lycopersicum L.) in a Sunken Solar Greenhouse in North China. Agriculture 2022, 12, 260. [Google Scholar] [CrossRef]
  17. Shao, M.; Liu, H.; Yang, L. Estimating Tomato Transpiration Cultivated in a Sunken Solar Greenhouse with the Penman-Monteith, Shuttleworth-Wallace and Priestley-Taylor Models in the North China Plain. Agronomy 2022, 12, 2382. [Google Scholar] [CrossRef]
  18. Flores-Velázquez, J.; Rojano, F.; Aguilar-Rodríguez, C.E.; Villagran, E.; Villarreal-Guerrero, F. Greenhouse Thermal Effectiveness to Produce Tomatoes Assessed by a Temperature-Based Index. Agronomy 2022, 12, 1158. [Google Scholar] [CrossRef]
  19. Yeo, U.-H.; Lee, S.-Y.; Park, S.-J.; Kim, J.-G.; Choi, Y.-B.; Kim, R.-W.; Shin, J.H.; Lee, I.-B. Rooftop Greenhouse: (1) Design and Validation of a BES Model for a Plastic-Covered Greenhouse Considering the Tomato Crop Model and Natural Ventilation Characteristics. Agriculture 2022, 12, 903. [Google Scholar] [CrossRef]
  20. Si, C.; Qi, F.; Ding, X.; He, F.; Gao, Z.; Feng, Q.; Zheng, L. CFD Analysis of Solar Greenhouse Thermal and Humidity Environment Considering Soil–Crop–Back Wall Interactions. Energies 2023, 16, 2305. [Google Scholar] [CrossRef]
  21. Sharaf-Eldin, M.A.; Yaseen, Z.M.; Elmetwalli, A.H.; Elsayed, S.; Scholz, M.; Al-Khafaji, Z.; Omar, G.F. Modifying Walk-In Tunnels through Solar Energy, Fogging, and Evaporative Cooling to Mitigate Heat Stress on Tomato. Horticulturae 2023, 9, 77. [Google Scholar] [CrossRef]
  22. Ohashi, Y.; Murai, M.; Ishigami, Y.; Goto, E. Light-Intercepting Characteristics and Growth of Tomatoes Cultivated in a Greenhouse Using a Movable Bench System. Horticulturae 2022, 8, 60. [Google Scholar] [CrossRef]
  23. Moreno-Teruel, M.Á.; Molina-Aiz, F.D.; López-Martínez, A.; Marín-Membrive, P.; Peña-Fernández, A.; Valera-Martínez, D.L. The Influence of Different Cooling Systems on the Microclimate, Photosynthetic Activity and Yield of a Tomato Crops (Lycopersicum esculentum Mill.) in Mediterranean Greenhouses. Agronomy 2022, 12, 524. [Google Scholar] [CrossRef]
  24. Sun, L.; Li, B.; Yao, M.; Mao, L.; Zhao, M.; Niu, H.; Xu, Z.; Wang, T.; Wang, J. Simulation of Soil Water Movement and Root Uptake under Mulched Drip Irrigation of Greenhouse Tomatoes. Water 2023, 15, 1282. [Google Scholar] [CrossRef]
  25. Liang, B.; Zhao, S.; Li, Y.; Wang, P.; Liu, Z.; Zhang, J.; Ding, T. Study on the Natural Ventilation Characteristics of a Solar Greenhouse in a High-Altitude Area. Agronomy 2022, 12, 2387. [Google Scholar] [CrossRef]
  26. Appolloni, E.; Paucek, I.; Pennisi, G.; Stringari, G.; Gabarrell Durany, X.; Orsini, F.; Gianquinto, G. Supplemental LED Lighting Improves Fruit Growth and Yield of Tomato Grown under the Sub-Optimal Lighting Condition of a Building Integrated Rooftop Greenhouse (i-RTG). Horticulturae 2022, 8, 771. [Google Scholar] [CrossRef]
  27. Fang, S.-L.; Kuo, Y.-H.; Kang, L.; Chen, C.-C.; Hsieh, C.-Y.; Yao, M.-H.; Kuo, B.-J. Using Sigmoid Growth Models to Simulate Greenhouse Tomato Growth and Development. Horticulturae 2022, 8, 1021. [Google Scholar] [CrossRef]
  28. Zhang, M.; Li, Y.; Liu, J.; Wang, J.; Zhang, Z.; Xiao, N. Changes of Soil Water and Heat Transport and Yield of Tomato (Solanum lycopersicum) in Greenhouses with Micro-Sprinkler Irrigation under Plastic Film. Agronomy 2022, 12, 664. [Google Scholar] [CrossRef]
  29. Jemai, N.; Soussi, M.; Chaibi, M.T. Opportunities for Implementing Closed Greenhouse Systems in Arid Climate Conditions. Horticulturae 2022, 8, 1102. [Google Scholar] [CrossRef]
  30. Zhang, C.; Liu, H.; Wang, C.; Zong, Z.; Wang, H.; Zhao, X.; Wang, S.; Li, Y. Testing and Analysis on the Spatial and Temporal Distribution of Light Intensity and CO2 Concentration in Solar Greenhouse. Sustainability 2023, 15, 7001. [Google Scholar] [CrossRef]
  31. Liu, A.; Xu, D.; Henke, M.; Zhang, Y.; Li, Y.; Liu, X.; Li, T. Determination of the Optimal Orientation of Chinese Solar Greenhouses Using 3D Light Environment Simulations. Remote Sens. 2022, 14, 912. [Google Scholar] [CrossRef]
  32. Grimberg, R.; Teitel, M.; Ozer, S.; Levi, A.; Levy, A. Estimation of Greenhouse Tomato Foliage Temperature Using DNN and ML Models. Agriculture 2022, 12, 1034. [Google Scholar] [CrossRef]
  33. Su, F.; Zhao, Y.; Wang, G.; Liu, P.; Yan, Y.; Zu, L. Tomato Maturity Classification Based on SE-YOLOv3-MobileNetV1 Network under Nature Greenhouse Environment. Agronomy 2022, 12, 1638. [Google Scholar] [CrossRef]
  34. Li, H.; Li, A.; Hou, Y.; Zhang, C.; Guo, J.; Li, J.; Ma, Y.; Wang, T.; Yin, Y. Analysis of Heat and Humidity in Single-Slope Greenhouses with Natural Ventilation. Buildings 2023, 13, 606. [Google Scholar] [CrossRef]
  35. Hong, M.; Zhang, Z.; Fu, Q.; Liu, Y. Water Requirement of Solar Greenhouse Tomatoes with Drip Irrigation under Mulch in the Southwest of the Taklimakan Desert. Water 2022, 14, 3050. [Google Scholar] [CrossRef]
  36. Qi, M.; Gao, H.; Wang, T.; Du, B.; Li, H.; Zhong, W.; Tang, Y. Method for Segmentation of Bean Crop and Weeds Based on Improved UperNet. IEEE Access 2023, 14, 912. [Google Scholar] [CrossRef]
  37. Wang, J.; Shi, P.; Jiang, P.; Hu, J.; Qu, S.; Chen, X.; Chen, Y.; Dai, Y.; Xiao, Z. Application of BP Neural Network Algorithm in Traditional Hydrological Model for Flood Forecasting. Water 2017, 9, 48. [Google Scholar] [CrossRef]
  38. Kumar, M.G.V.; N, V.; Čepová, L.; Raja, M.A.M.; Balaram, A.; Elangovan, M. Evaluation of the Quality of Practical Teaching of Agricultural Higher Vocational Courses Based on BP Neural Network. Appl. Sci. 2023, 13, 1180. [Google Scholar] [CrossRef]
  39. Yu, F.; Zhao, Y.; Lin, Z.; Miao, Y.; Zhao, F.; Xie, Y. Prediction of Mechanical Properties and Optimization of Friction Stir Welded 2195 Aluminum Alloy Based on BP Neural Network. Metals 2023, 13, 267. [Google Scholar] [CrossRef]
  40. Du, Z.; Yao, H.; Fu, Y.; Cao, Z.; Liang, H.; Ren, J. Network Situation Assessment Method Based on Improved BP Neural Network. Electronics 2023, 12, 483. [Google Scholar] [CrossRef]
  41. Yan, J.; Xu, Z.; Yu, Y.; Xu, H.; Gao, K. Application of a Hybrid Optimized BP Network Model to Estimate Water Quality Parameters of Beihai Lake in Beijing. Appl. Sci. 2019, 9, 1863. [Google Scholar] [CrossRef]
  42. Lai, X.; Tu, Y.; Yan, B.; Wu, L.; Liu, X. A Method for Predicting Ground Pressure in Meihuajing Coal Mine Based on Improved BP Neural Network by Immune Algorithm-Particle Swarm Optimization. Processes 2024, 12, 147. [Google Scholar] [CrossRef]
  43. Musiałek, F.; Szabra, D.; Wojtas, J. Time-Efficient SNR Optimization of WMS-Based Gas Sensor Using a Genetic Algorithm. Sensors 2024, 24, 1842. [Google Scholar] [CrossRef] [PubMed]
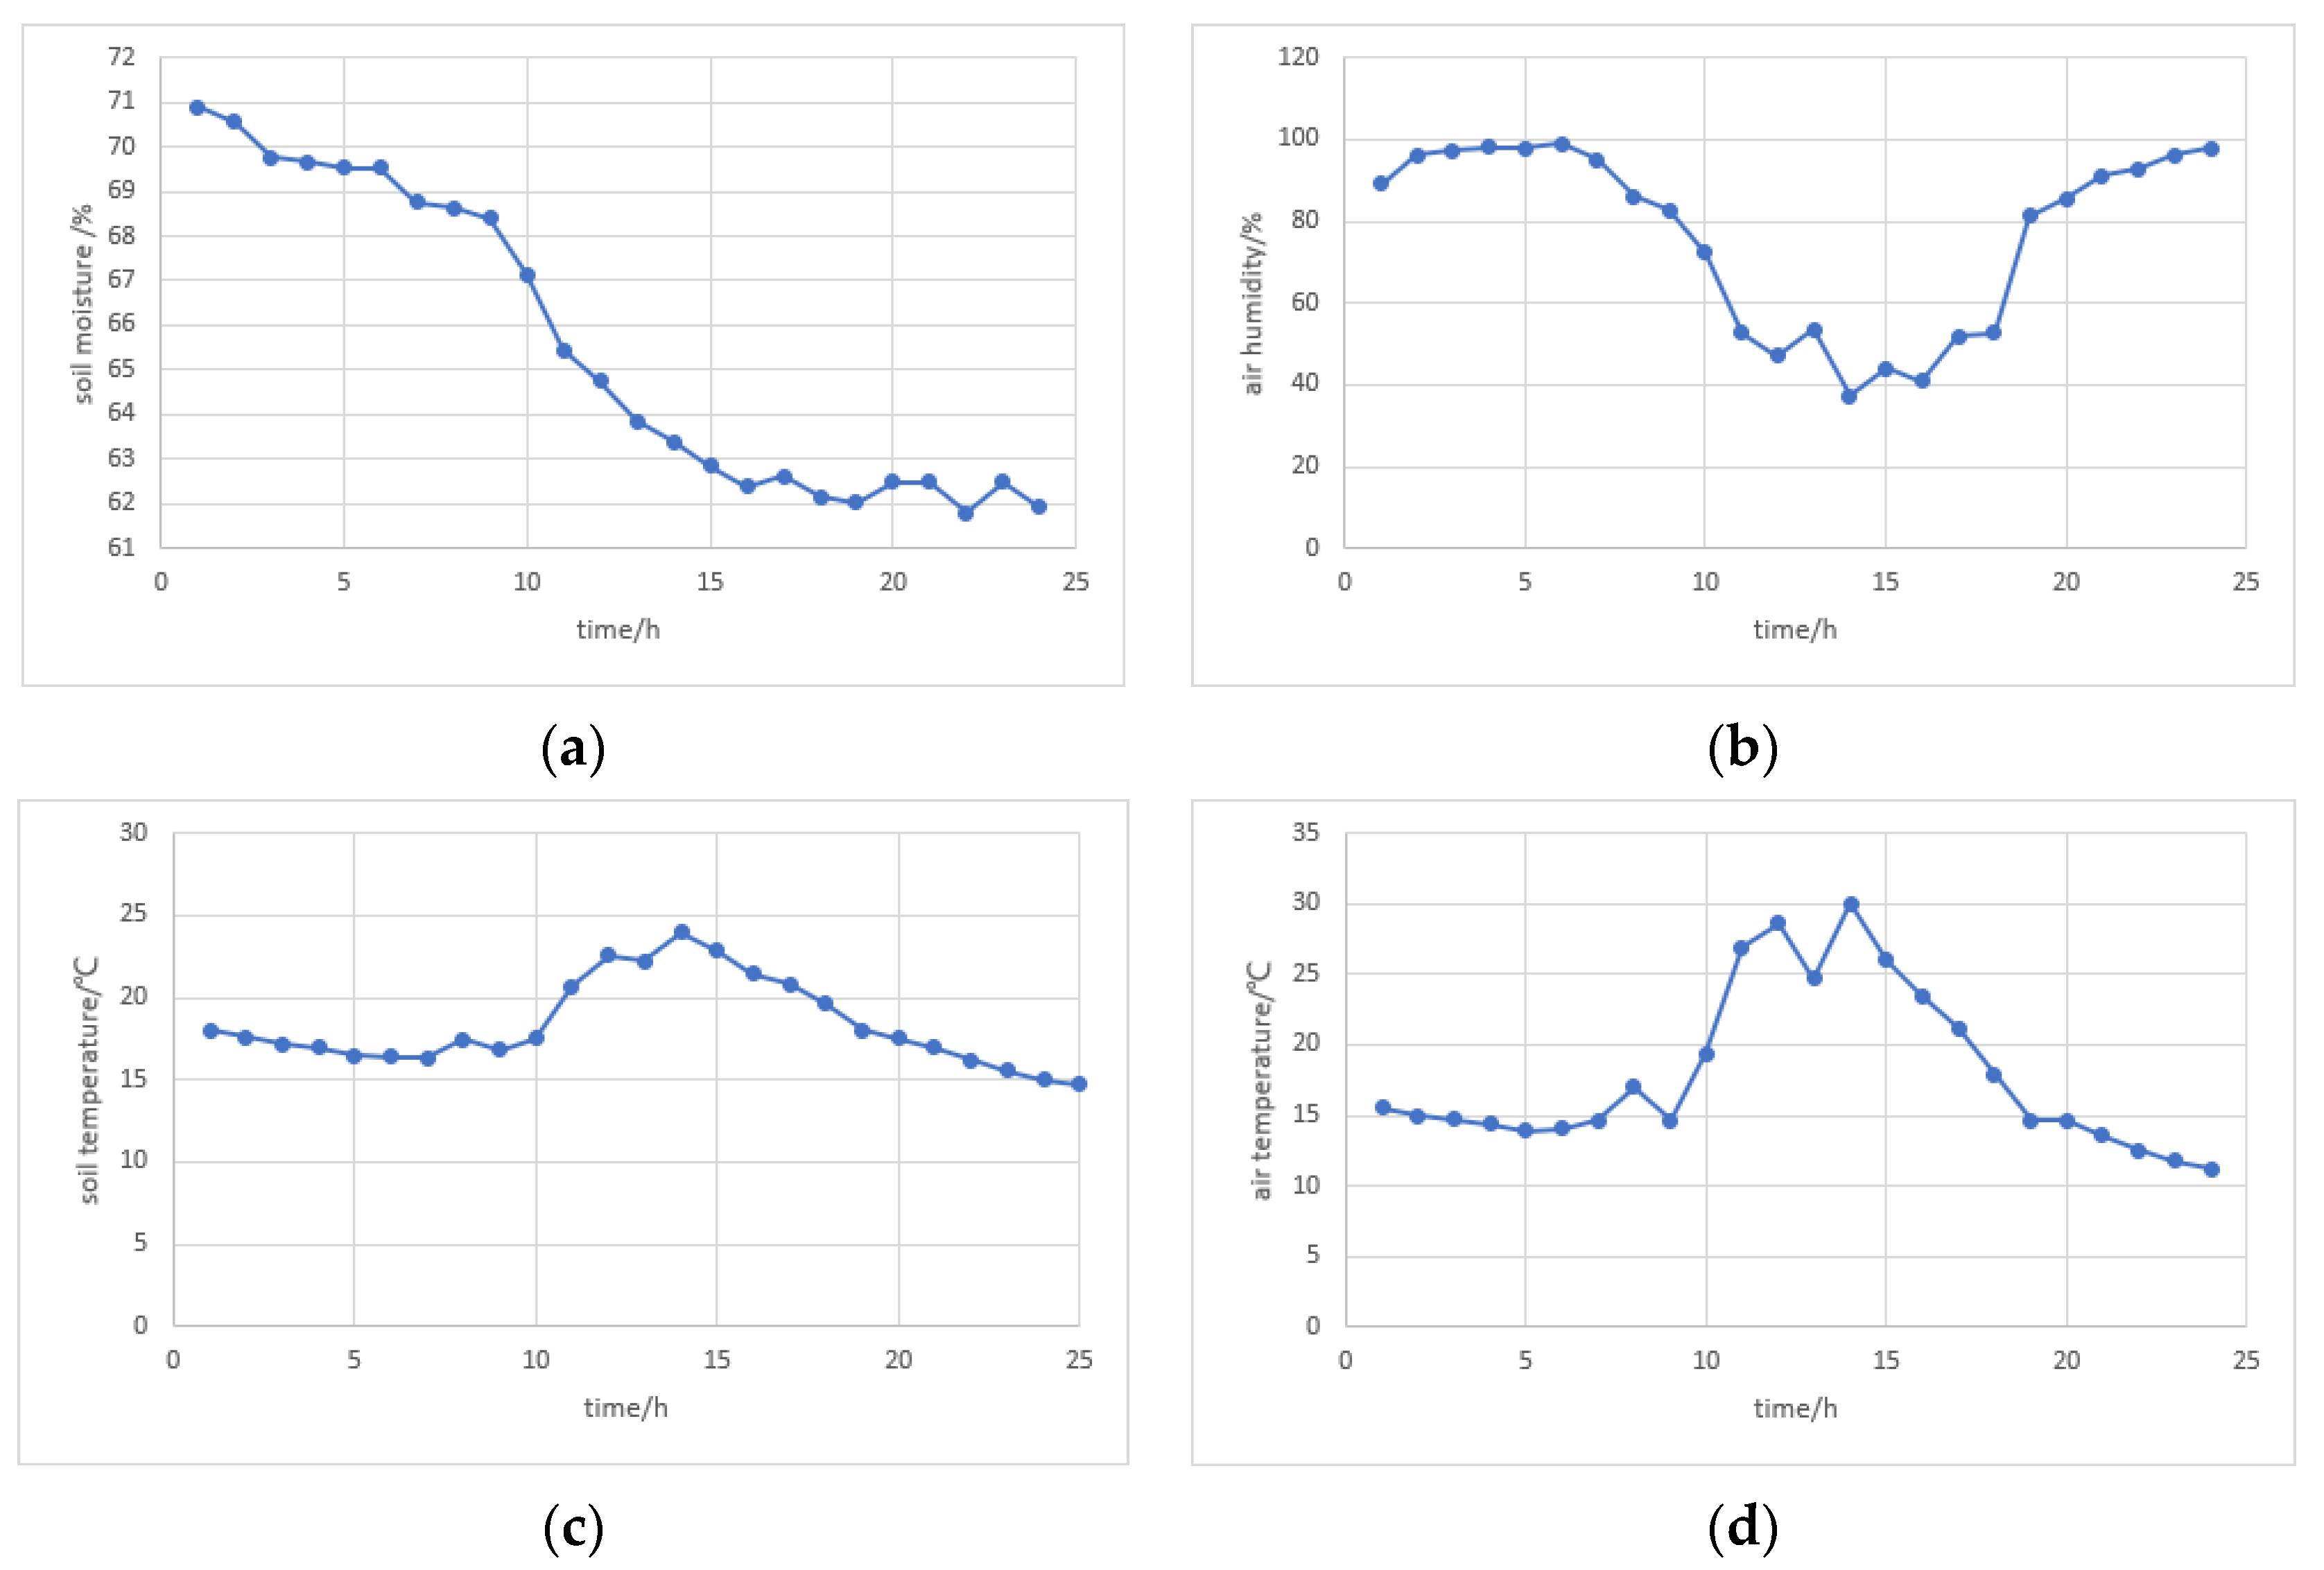
Figure 1. Monitoring system for environmental parameters of tomato growth in the greenhouse.
Sustainability 16 04161 g001
Figure 2. Hardware control system. (a) Sensors and Monitoring Instruments. (b) Parameter Display. (c) Control Unit Inside the Cabinet. (d) Hardware Control Cabinet.
Sustainability 16 04161 g002
Figure 3. Daily Variation of Optimal Growth Environment for Greenhouse Tomatoes. (a) soil moisture; (b) air humidity; (c) soil temperature; (d) air temperature.
Sustainability 16 04161 g003
Figure 4. BP neural network structure diagram.
Sustainability 16 04161 g004
Figure 5. BP Neural Network Structure Improved with Genetic Algorithm.
Sustainability 16 04161 g005
Figure 6. Predict and measure results. (a) Soil Temperature. (b) Soil Humidity. (c) Air Temperature. (d) Air Humidity.
Sustainability 16 04161 g006aSustainability 16 04161 g006b
Figure 7. Comparison of convergence speeds. (a) GABP Convergence Speed and Error; (b) BP Convergence Speed and Error.
Sustainability 16 04161 g007
Table 1. Diurnal variation characteristics of the optimal growth environment of tomato in a greenhouse.
TimeSoil Moisture (%)Air Humidity (%)Soil Temperature (°C)Air Temperature (°C)
2:0071891812.7
4:0070. 69616.911.2
6:0069.595.116.412.4
8:0068.686.117.417.2
10:0067.172.217.525.3
12:0065.447.222.526.5
14:0063.437.423.935.4
16:0062.340.821.426.6
18:0062.152.819.613
20:0062.585.517.511.5
22:0061.892.816.211.3
24:0062.197.714.910.9
Table 2. Comparison of training results from different algorithms.
Convergence ModeTarget ErrorConvergence Step SizeConvergence TimeResult
Traditional BP Neural Network Learning Algorithm0.04%0.64.5 hLarger step size, slower convergence speed
Traditional Genetic Algorithm0.04%0.4Infinite
Improved GA-Based BP Neural Network Learning Algorithm0.04%0.23.4 hCan converge rapidly
Table 3. Tomato quality data.
Developmental StageFruit Horizontal Diameter (mm)Longitudinal Diameter of Fruit (mm)Fruit Fresh Weight (g)Dry Weight (g)Moisture Content (g)
15DAA18.6124.334.930.744.19
15DAA22.2523.896.430.935.50
15DAA22.0932.59.981.398.59
15DAA23.3138.169.471.008.47
15DAA20.2228.446.650.925.73
15DAA22.5636.8110.331.418.92
15DAA18.1223.654.160.303.86
15DAA19.0627.755.130.514.62
15DAA21.0324.985.170.544.63
15DAA16.2323.512.990.302.69
15DAA25.5932.0511.001.139.87
35DAA43.6260.4349.744.0245.72
35DAA31.5743.5922.312.3219.99
35DAA48.7355.5265.825.5760.25
35DAA29.0029.4917.591.5316.06
35DAA43.9261.6461.634.4457.19
35DAA38.6051.8538.333.5734.76
35DAA33.9956.7838.924.0834.84
35DAA40.4565.3556.685.2051.48
35DAA42.0957.4142.213.1839.03
35DAA29.5452.8126.832.5324.30
35DAA39.1761.7342.203.5838.62
35DAA41.3161.2247.394.4042.99
35DAA33.0057.3334.503.3131.19
35DAA30.9252.5326.512.4524.06
35DAA41.8260.7355.854.0751.78
35DAA34.3557.1234.132.9831.15
35DAA36.9058.0740.452.6937.76
35DAA40.4366.0959.684.8854.80
35DAA28.3547.7219.381.7217.66
35DAA36.2057.8237.192.9434.25
35DAA34.7553.7834.563.2531.31
35DAA41.6660.6245.114.0841.03
65DAA49.0058.5173.816.1767.64
65DAA47.1862.5177.074.6172.46
65DAA53.8271.35103.287.8195.47
65DAA50.0376.4893.257.3485.91
65DAA40.9966.6960.084.7755.31
65DAA45.3567.1474.105.8168.29
65DAA39.2268.259.384.6954.69
65DAA42.1159.3254.463.5250.94
65DAA46.8764.5891.275.7785.50
65DAA39.8760.3294.734.1290.61
65DAA48.0070.2785.866.4379.43
65DAA43.3870.9278.416.2272.19
65DAA49.2360.4376.706.2670.44
65DAA55.3074.59120.407.94110.50
Disclaimer/Publisher’s Note: The statements, opinions and data contained in all publications are solely those of the individual author(s) and contributor(s) and not of MDPI and/or the editor(s). MDPI and/or the editor(s) disclaim responsibility for any injury to people or property resulting from any ideas, methods, instructions or products referred to in the content.

