Abstract
This study introduces a developed environmental quality assessment system, detailing its hardware, software, and comparative analysis against a publicly available system. While showing larger deviations in particulate matter and air humidity parameters, the proposed system demonstrates sufficient accuracy in other environmental characteristics. It establishes a standardized operating procedure and evaluates uncertainty and quality assurance measures, ensuring reliability in environmental measurements. The system offers comprehensive capabilities, measuring parameters like total volatile organic compounds, carbon dioxide, temperature, humidity, particulate matter, noise, nitrogen oxides, sulfur oxides, ozone, and carbon monoxide, with real-time monitoring functions for detecting environmental changes. Its user-friendly interfaces, scalability, and potential integration with existing systems enhance its versatility and cost-effectiveness across diverse settings. This study underscores the need for future research to enhance accuracy, reliability, and real-time operability and explore integration with smart city initiatives and environmental management systems. Overall, the proposed system represents a promising advancement in environmental monitoring technology, facilitating comprehensive environmental quality assessment and management.
1. Introduction
The relationship between climate change and air and environmental pollution is complex. Human activities, such as the burning of fossil fuels and deforestation, release both greenhouse gases and pollutants that contribute to the deterioration of air quality and the environment. Greenhouse gas emissions drive climate change, which in turn affects weather patterns, exacerbates natural disasters such as wildfires, and alters air quality. Fine dust particles and soot from combustion processes have a direct impact on air quality and respiratory health. In addition, climate change-induced ocean acidification and disruption of marine ecosystems further contribute to environmental challenges. Addressing these interrelated issues requires comprehensive strategies that simultaneously mitigate climate change and pollution while recognizing the shared drivers and impacts of these global challenges.
Due to their complex interconnectedness, climate change and air and environmental pollution in urban environments pose specific challenges to researchers. Urban areas with concentrated human activity often experience increased levels of air pollution due to vehicle emissions, industrial processes, and energy consumption. These pollutants, including greenhouse gases, contribute to climate change and exacerbate local environmental problems.
Climate change is exacerbating urban heat islands, a phenomenon where cities experience higher temperatures than surrounding areas, affecting air quality and public health. In addition, changing rainfall patterns may affect stormwater management and cause more frequent flooding in urban areas. Addressing these challenges in the urban environment requires integrated strategies targeting both climate change and localized sources of pollution, promoting sustainable urban planning, cleaner transport, and sustainable infrastructure to improve the overall well-being of urban populations.
In 2008, the European Parliament and the Council of the European Union jointly ratified the Directive on Ambient Air Quality and Cleaner Air in Europe [1]. This important piece of legislation aims to reduce pollution to levels that substantially limit negative effects on human health, with a focus on urbanized regions and the general environment. To achieve the goal, the main task is to improve the precision of the data in measuring and evaluating air quality, ensuring that the information reaching the public is thus accurate, understandable, and easily accessible. Through these initiatives, the directive promotes the creation of a healthier and more sustainable living environment for European citizens.
Green policies encompass regulations, initiatives, and practices aimed at promoting environmental sustainability and combating climate change. They are vital for protecting ecosystems, reducing greenhouse gas emissions, and fostering a transition to a low-carbon economy. By addressing environmental challenges, green policies contribute to improving public health, stimulating economic growth, and promoting global cooperation. In summary, green policies play a crucial role in shaping a sustainable future by safeguarding the environment, mitigating climate change, and enhancing overall well-being.
In October 2021 [2,3], the European Commission outlined its work program for 2022, including a plan to review the EU’s ambient air quality directives in the third quarter of 2022. In line with the EU’s ambition for zero pollution, the revision aims to reduce air, water, and soil pollution to levels considered safe by 2050. In response to the European Parliament’s 2021 resolution, the Commission proposed a directive in October 2022 that consolidates existing directives and introduces a target of zero air pollution by 2050. The proposal sets stricter conditions for air quality standards in 2030, especially for fine particulate matter (PM2.5). It also establishes periodic reviews of standards, aligning them with World Health Organization guidelines, and introduces the right to compensation for health-related damages resulting from air quality violations. The legislative report adopted by the Committee on the Environment, Public Health, and Food Safety in June 2023 proposed even stricter limits for 2030. In September 2023, the European Parliament endorsed the report, setting a deadline for achieving the strict limit values until January 2035. The Council reached a common approach in November 2023, proposing adjustments to the target values, reasons for postponing the deadline, and provisions on transboundary pollution. The Council’s position will now be agreed upon with the European Parliament to reach a consensus on the revised directive.
The Intergovernmental Panel on Climate Change (IPCC), an initiative within the United Nations, is committed to providing scientific evidence relating to both natural and human-induced climate influences. A key aspect of the IPCC recommendations emphasizes the need to promote regional climate change research. In line with the directives of the World Meteorological Organization and various international organizations, the IPCC emphasizes the extension of empirical research to regional and local levels. This approach aims to cultivate a comprehensive understanding of the dynamics of climate change, thus contributing to informed policy development and facilitating global efforts to address the challenges posed by climate change.
The deployment of portable air quality and environmental monitoring systems at a strategic level is essential to address the multifaceted challenges of air pollution, environmental degradation, and climate change. These portable systems, with their flexibility and real-time monitoring capabilities, serve as essential tools for implementing strategic initiatives. By precisely deploying these mobile units, authorities can identify sources of pollution, respond quickly to emergencies, and engage communities in the data collection process. These systems, with their high spatial resolution, help map variations in urban air quality, informing urban planning decisions. In addition, the collected data contribute to research, supporting the development of evidence-based policy and the evaluation of the effectiveness of regulatory measures. In essence, the integration of portable measurement systems at a strategic level is a dynamic and proactive approach that increases the overall effectiveness of initiatives aimed at creating sustainable, resilient communities in the face of environmental and climate challenges.
Portable air quality measurement and environmental monitoring systems have a number of advantages, including flexibility, cost-effectiveness, rapid deployment, and improved spatial resolution. As stated, their ability to navigate different environments and offer real-time data is critical for identifying pollution hotspots and assessing localized variations in air quality. Despite these advantages, challenges exist, such as limited capacity for continuous monitoring, potential inaccuracies in sensor calibration, difficulties in data integration and standardization, limitations on monitoring parameters, and sensitivity to power, connectivity, and environmental conditions. Addressing these limitations through regular maintenance, calibration, and advances in technology is essential to exploiting the full potential of these systems and ensuring reliable and comprehensive environmental monitoring.
The aim of this study is to propose and evaluate an environmental quality assessment device that offers comprehensive capabilities for measuring various parameters. Additionally, the research aims to analyze trends in the development of environmental monitoring devices and suggest future directions for improving accuracy, reliability, and integration with smart city initiatives and environmental management systems.
The motivation behind the development of the proposed environmental quality assessment device is driven by the need to address environmental concerns, enhance monitoring technology, fulfill regulatory requirements, empower stakeholders, and advance sustainable development goals. By providing a comprehensive, accurate, and accessible tool for environmental assessment and management, the device aims to contribute to a healthier, more sustainable future for all.
The proposed environmental quality assessment device makes significant contributions to environmental monitoring and management by enhancing data quality, accessibility, regulatory compliance, environmental awareness, and research and innovation. Its accurate monitoring capability, improved accuracy and reliability, user-friendly interfaces, and potential for widespread adoption position it as a valuable tool for addressing environmental challenges and promoting sustainable development.
2. Related Works
2.1. Environmental Monitoring, Performance Metrics, and Quality Assurance
Stawowy et al. [4] highlighted the significance of Automatic Weather Stations (AWS) in delivering real-time data collection essential for monitoring environmental parameters crucial in fields like agriculture and renewable energy. Nevertheless, obstacles persist, including high expenses and ensuring data quality. In addressing these challenges, Mölder [5] discussed the GOEASY project, which uses advanced technologies such as Galileo and mobile platforms equipped with air quality sensors to improve data accuracy and coverage. This approach not only improves access to reliable air quality information but also demonstrates the potential of collaborative applications. Building on this theme, Taştan [6] highlighted the importance of real-time monitoring in indoor environments, especially in assisted living environments. Their proposed AAL system using IoT technology aims to improve living conditions by providing timely air quality alerts. By integrating such systems with existing technologies, there is potential to address issues of independence among the elderly, thereby forming a comprehensive approach to using advanced monitoring techniques to improve the environment and living conditions.
Marinov et al. [7] have entered the realm of low-cost sensors for environmental measurements, highlighting their potential benefits in urban settings. Although advances in micro- and nanotechnology have led to the development of such sensors, challenges remain, including accuracy issues and the need for extensive calibration and maintenance. Despite these limitations, the study suggests that these sensors can still be effectively used to monitor key environmental parameters. Esatbeyoglu et al. [8] have redirected towards forecasting nitrogen dioxide (NO2) levels in both time and space, which is critical to understanding environmental impacts. Their study demonstrates the effectiveness of using in-vehicle measurement technology for continuous, real-time monitoring along designated routes. The research uses a variety of forecasting approaches, with sliding window methods showing promise, especially those involving the averaging of previous rounds. The study highlights the importance of training data immediately prior to test data for improved prediction quality, suggesting future expansion by equipping multiple vehicles with NO2 measurement technology. Building on these topics, Hernández-Rodríguez et al. [9] presented a computerized system for monitoring air parameters designed to improve safety and health. It is customized to detect air quality concerns in both indoor and outdoor environments. While it provides flexibility and possibilities for thorough air quality evaluation, challenges such as system upgrades and mobile application development arise. Nonetheless, this research sets the foundation for efficient air quality monitoring and pollution management efforts.
Taken together, these studies demonstrate ongoing efforts to advance environmental monitoring technologies, from low-cost sensors to predictive modeling and comprehensive monitoring systems. While each work has its own set of advantages and limitations, they collectively contribute to the broader goal of improving environmental quality and public health through innovative monitoring solutions. Future directions could include further refinement of sensor technologies, improvement of predictive models, and addressing logistical challenges for widespread implementation of monitoring systems.
To address the challenges associated with air pollution, Barot et al. [10] have introduced an IoT-based monitoring system, offering advantages in communication topology design, QoS evaluation, and energy consumption optimization. Their system achieves high accuracy in data transmission, demonstrating potential for real-time monitoring of various pollutants both indoors and outdoors. However, limitations arise regarding the presentation of absolute energy savings and the optimization of transmission schemes. Solomon et al. [11] used Aclima, Inc.’s (San Francisco, CA, USA) mobile platform to characterize spatial variations in air pollution, providing valuable information on the distribution of pollutants in urban areas. Despite the reliable performance of the research instruments, uncertainties persist regarding the finer-scale spatial variability and representativeness of the data. Palamar et al. [12] have proposed a remote air pollution monitoring system using IoT technology, offering precise real-time monitoring of hazardous gases. Although affordable and scalable, challenges include calibration and maintenance issues, necessitating continuous updates [13]. Collectively, these works contribute to advancing air quality monitoring methodologies by offering comprehensive solutions while acknowledging limitations and suggesting future directions such as extensive data analysis, improving adaptability, and addressing maintenance challenges to promote the health and safety of the environment.
Wang et al. [14] built an indoor air quality monitoring system using sensor technology and IoT, offering comprehensive detection and real-time visualization of environmental parameters with a practical evaluation algorithm and compatibility with national standards. Despite the advantages of monitoring indoor air quality, potential limitations include periodic sensor calibration and maintenance. In a similar vein, Aashiq et al. [15] introduced an IoT-based portable weather monitoring system, promising comprehensive data availability and usability, albeit with limitations such as battery dependence and sensor reliability challenges. Karnati [16] presented a portable air quality detection device targeting urban pollution issues, offering real-time location-specific data and potential for machine learning analysis, although there are areas for improvement in sensor calibration and user interface refinement. These works collectively highlight the importance of IoT-enabled monitoring systems to address environmental issues while recognizing the importance of addressing limitations and exploring future directions such as improvements in sensor reliability and the integration of predictive analytics for improved usability and efficiency in environmental monitoring and management.
Eriyadi et al. [17] introduced a low-cost measuring system for air quality, targeting industrial pollution and offering the advantages of real-time data collection and analysis through IoT technology, thus enabling proactive measures to preserve air quality in factory settings. Although cost-effective and reliable, potential limitations such as ongoing calibration needs and challenges to scalability in larger industrial complexes are noted. Hassani et al. [18] explored the use of low-cost air quality monitoring technologies, demonstrating citizen-operated Snifferbike sensors to map urban pollution dynamics and inform policy decisions. Despite its utility in non-regulatory monitoring, challenges such as data reliability and spatio-temporal bias require attention. Jayasree et al. [19] have presented a LoRa-based smart urban air quality monitoring system, offering advantages in real-time monitoring and comprehensive coverage in urban areas. Although effective in detecting atmospheric changes, the complexity of implementation and robustness testing under different environmental conditions can present challenges. Overall, these studies highlight the potential of low-cost monitoring technologies to address air pollution while recognizing the importance of overcoming limitations and optimizing systems for wider applicability and reliability in environmental monitoring and management.
Prabu et al. [20] emphasized the urgent need to address the adverse impacts of air pollution on human health and the environment, highlighting the importance of modern pollution monitoring and control technologies. Gayathri et al. [21] introduced an IoT-based air pollution monitoring system offering real-time monitoring and warnings despite limitations in detecting specific gases. Deepthi et al. [22] have proposed a low-cost air pollution monitoring system, highlighting the advantages of detecting polluted areas and facilitating timely responses, although scalability and integration challenges remain. Raysoni et al. [23] reviewed the benefits of low-cost air monitoring sensors in democratizing air quality monitoring while acknowledging limitations in accuracy and spatial variability. Together, these works highlight the importance of technological interventions to address air pollution while recognizing the importance of overcoming challenges such as sensor limitations and integration issues for wider adoption and effective pollution management. Efforts towards collaborative solutions and innovative technologies are central to the ongoing fight against air pollution, ensuring cleaner air for current and future generations.
2.2. Elucidating Research Gaps and Motivations
From the review of the available literature sources, it can be concluded that the standardized methods for determining the characteristics of the air and the environment in general have some disadvantages related to the impossibility of continuously reporting changes in weather conditions and air quality. A solution to this problem is the mobile measurement systems being developed. The main limitations of these systems can be summarized as their insufficient accuracy compared to classical methods for measuring environmental parameters. Also, these devices require periodic calibration and adjustment.
Measuring devices are sensitive to changes in ambient humidity and temperature, which makes it difficult to use them when, for example, fog appears.
In the reviewed literature, researchers tend to develop measuring devices that utilize only a few sensors tailored to the specific task they are addressing. There is a lack of developments in which measurement systems are applied to solve a wider range of tasks related to both air and environmental quality determination. This is necessary because changes in air quality and climate factors are interrelated.
It is necessary to propose a measurement system that allows the measurement of both air and environmental characteristics.
3. Material and Methods
3.1. Overall Research Methodology Steps and Details
The general research methodology is presented in Figure 1. In the first stage, a selection of hardware components was made, and the tools for creating software for the measurement system were presented. Also introduced is the GUI creation tool. The next stage involves collecting data from a reference measuring station. These data were used in evaluating the performance accuracy of the proposed device. From here, the uncertainty and the way to ensure the quality of operation of the device are determined. In the last stage, a comparative analysis of the proposed measuring device and others that are available in the available literature is conducted.
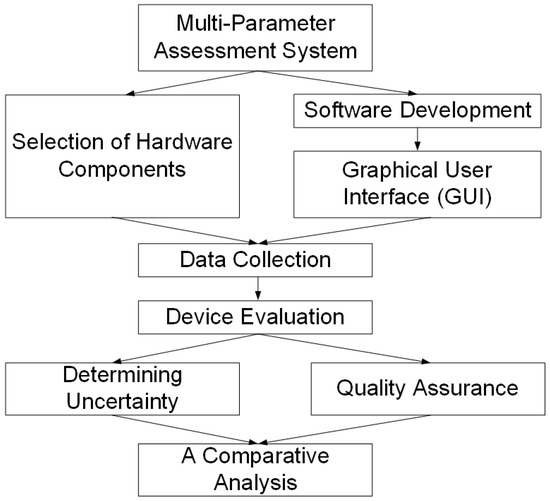
Figure 1.
Flowchart of the research methodology.
3.2. Hardware and Software Components of the Mobile Measurement System
Mega 2560 single-board microcomputer (Kuongshun Electronic Ltd., Shenzhen, China). Nextion Discovery 2.4” programmable display NX3224F024 (ITEAD Intelligent Systems Co. Ltd., Shenzhen, China) is a universal human–machine interface (HMI) solution with a resistive touch screen. The TFT display, which has 65,536 colors and a resolution of 320 × 240 pixels, communicates through a serial interface (UART), facilitating programming and communication with the microcontroller. The graphical user interface was developed in the program Nextion Editor v.1.65.1 (ITEAD Intelligent Systems Co. Ltd., Shenzhen, China).
The SD memory card module includes a card slot, a converter for logic levels, and a buffer circuit. The single-board microcomputer interfaces with the SDcard module using the <SPI.h> and <SD.h> libraries.
A SanDisk Extreme Pro 32 GB micro SDHC memory card (Western Digital Corp., Milpitas, CA, USA) was used.
A total of 20,000 mAh Model QS15 Power Bank Battery was used (Silicon Power Computer & Communications Inc., New Taipei City, Taiwan).
The modules of the measuring system are located in a junction box with dimensions of 180 × 140 × 80 mm and IP54 protection class (Jv Electric Ltd., Chernozemen, Bulgaria).
A sensor module includes a TSL2591 light sensor with an I2C interface, providing sufficiently accurate illuminance readings in a wide range of up to 88,000 Lux. The compact 27 × 20 mm board features two mounting holes and a pre-mounted interface connector for easy integration. Powered from 3.3 V to 5 V, the module consumes a minimum of 0.4 mA of current (5 µA in standby mode). Equipped with a logic-level converter. The module also detects infrared light, improving its versatility for a variety of applications.
A sensor module incorporating the advanced BOSH BMP388 digital barometer designed for precise measurements of pressure, temperature, and altitude (altimeter). Operating in a universal voltage range of 3 V to 5 V, this module can be seamlessly integrated into various projects using the I2C or SPI digital interfaces. The compact 30 × 22 mm module includes a 4-pin JST connector for I2C power and a 7-pin connector for SPI or I2C. With sufficient accuracy, the module can measure pressure in the range of 300 to 1250 hPa, altitude up to 9000 m, and temperature from −20 to +85 °C.
The digital sensor DHT22 (Aosong (Guangzhou) Electronics Co., Ltd., Guangzhou, China) operates in a universal voltage range of 3.3 to 5 V DC, providing precise measurements of relative air humidity (0–99% RH) with an accuracy of ±2% (at 25 °C) and a resolution of up to 0.1%. In addition, it offers temperature readings in the range of −40 to 80 °C, showing an accuracy of ±0.5 °C and a resolution of 0.1 °C. With a fast refresh rate of 1 Hz, the sensor uses the “One Wire” protocol and integrates with the “DHT.h” library for efficient data processing and reading every 1 s.
TVOC, eCO2, H2, and ethanol sensors. The digital sensor SGP30 (Pimoroni Ltd., Sheffield, UK) is designed to detect concentrations of the specified gases, and this sensor uses an I2C digital communication interface with address 0 × 58. Seamless integration is facilitated by the <Wire.h> and “Adafruit_SGP30.h” libraries. The device allows simultaneous measurement of TVOC and eCO2. H2 and ethanol concentrations are retrieved as decimal values from the sensor’s ADC. Automatic humidity and temperature compensation increases accuracy for H2 and ethanol data usage as well. The conversion formulas are specified in the sensor technical specification.
The Noise Sensor (Waveshare Electronics, Shenzhen, China) uses an electret microphone operating in the frequency range of 50 to 20,000 Hz. The microphone has a sensitivity of 52 dB, contributing to precise noise measurements. With a supply voltage of 3.3 to 5.3 V DC, this module integrates seamlessly into various devices. Specialized software code, as reported in Parajuli [24], captures noise levels through analog output readings in 50 ms windows, aiding in determining loudness in dB.
The fine particulate matter (PM) sensor SDS011 (Shandong NOVA Technology Co., Ltd., Jinan, China) features a digital output and operates at a 5 V DC supply voltage with a current consumption of 70 ± 10 mA. Using a UART interface at TTL levels, the SDS011 provides a 1 Hz refresh rate, reading data every 1 s. Specially designed for PM2.5 and PM10 measurements in the range of 0 to 999.9 μg/m3, this sensor is supported by the <SDS011-select-serial.h> library for seamless integration with the single-board microcomputer and reliable operation.
Sensors for NOx, SOx, and O3. The MQ-135 sensor (Waveshare Electronics, Shenzhen, China) uses a sensing mechanism based on changes in electrical resistance in its sensitive layer. Calibrable for specific gases, it uses an analog output, feeding data to a single-board microcomputer. The humidity and temperature correction factors improve the accuracy measured by the DHT22 sensor. Using a pattern commonly found in MQ-xx series sensors, it detects gas concentrations through precise parameter tuning and advanced signal processing.
CO sensor. The MQ-9 sensor (Waveshare Electronics, Shenzhen, China) determines the concentration of carbon monoxide by converting analog output data into a voltage range of 0 to 5 V, seamlessly integrated with a single-board microcomputer. Based on the manufacturer’s specifications, the load, fresh air resistance, and sensor resistance are aligned. To enhance accuracy, a correction factor adjusting for humidity and temperature is implemented, utilizing readings from a DHT22 sensor to measure temperature and relative humidity [25].
3.3. Evaluation of the Proposed Device through Comparative Analysis
By conducting benchmarking, this study juxtaposed the proposed device with existing solutions in the relevant field. This method enables the assessment of how the acquired outcomes enhance the present state of the field, providing fresh avenues for bolstering competitiveness and potential market worth. Establishing a robust groundwork for forthcoming research, development, and engineering endeavors, benchmarking facilitates informed decision-making and enhances the comprehensive evaluation of a proposed device’s performance.
The “proposed measurement system” (PS) was compared with the “compared measurement system” (CS), which is available at the Internet address https://air.yambol.bg/portal/dashboard/03087810 (accessed on 3 March 2024). The platform is a development of Itansformers Labs Ltd. (ThingsLog, Sofia, Bulgaria).
3.4. Data Collection for Evaluation of Device Accuracy
The process of collecting data to assess the accuracy of an experimental device demands meticulous planning and execution to guarantee sufficiently dependable results. The precise protocol varies depending on the device’s nature and its intended application. For the proposed device, data collection follows a generally accepted methodology [26]. Table 1 shows the steps involved in this process.

Table 1.
Stages of data collection for experimental evaluation of device accuracy.
3.5. Determining Uncertainty and Quality Assurance
Uncertainty definition and quality assurance are two of the main steps to obtain reliable and credible measurement results with the proposed device. Through them, the accuracy and consistency of the measurements and compliance with the regulatory requirements are evaluated [27].
Table 2 presents the stages for uncertainty definition and quality assurance. The stages are described briefly in accordance with the more commonly used practices and methodologies in this regard.
Table 2.
Determining uncertainty and quality assurance of the proposed measurement system.
A univariate regression model conducted the comparative analysis between the measurements with the proposed and compared systems. Its characteristics are evaluated. The coefficient of determination, R2, sum of squared errors (SSEs), total sum of squares (SSTO), and root mean square error (RMSE) were determined. The errors are calculated according to the following formulas:
where yi pred are predicted values, yi are measured values, and ymean is the mean value of measured values.
All of the data were processed using the Matlab 2017b software system (MathWorks Inc., Natick, MA, USA). All data were processed at a level of significance of α = 0.05.
4. Results
Figure 2 shows a block diagram of the proposed device. The main element is a single-board microcomputer that controls the entire measuring system. All components of this system are powered by a common power source. In the left part are the power supply unit and the display for visualizing measurement data and working with the system user. The first group of sensors located in the right part are those for the environment. The last group of sensors on the right side of the diagram are those mainly measuring air quality.
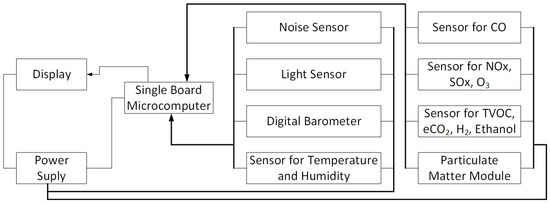
Figure 2.
A block diagram of the proposed device.
The selected hardware components were used to construct an experimental mobile measurement system, as illustrated in Figure 3. The Mega 2560 serves as the central control unit. The MQ-135, MQ-9, and noise sensors are connected to the analog inputs of the single-board microcomputer. The SD card module is connected via an SPI serial interface. The display and the fine dust sensor are connected to the UART inputs of the single-board microcomputer. Using a “one wire” interface, the humidity and temperature sensors are connected. The sensors for TVOC, eCO2, H2, and ethanol are connected to the serial I2C channel, the light sensor, and the atmospheric pressure sensor. The entire electrical circuit works with a 20,000 mAh power bank for a reliable power supply.
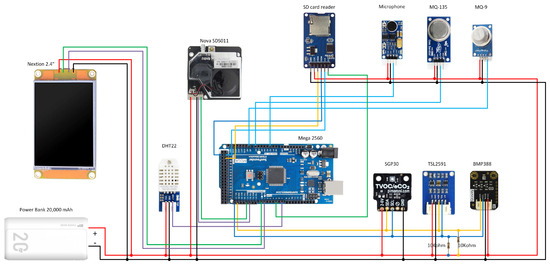
Figure 3.
Electrical schematic of measuring device—general view.
Figure 4 illustrates the algorithm of the program implemented on the single-board computer. This control program is developed to gather data from various sensors connected to the single-board computer and execute several tasks, such as storing data on an SD card and transmitting data to the display via serial communication. Upon program initiation, the SD card and digital sensors are initialized, and serial communication between the single-board computer and the display is established. The program continuously reads data from the sensors, corrects humidity and temperature measurements, and compiles the corrected data into a string, which is then saved to a file on the SD card. Subsequently, the program transmits the sensor data for visualization on the display. The complete listing of the control program can be found in Appendix A.
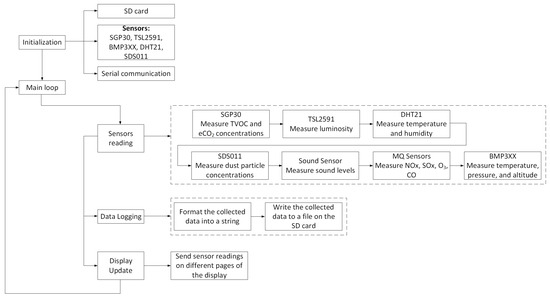
Figure 4.
Flowchart of the proposed program for a single-board microcomputer.
Illustrated in Figure 5, the experimental measurement system is mounted in a compact polymer box with dimensions of 180 × 140 × 80 mm, which has an IP57 protection class. In the upper part, the suction tube of the sensor for fine dust particles and the button for turning on the system are located. On the front panel is the monitor display, and through technological holes, the primary converters for CO2, humidity, and temperature sensors, as well as the microphone and gas sensors MQ-135 and MQ-9, are located. Conveniently designed, there are connectors on the side for an external power source and for accessing the SD memory card. The battery is located inside the box and can be accessed after removing the protective cover.
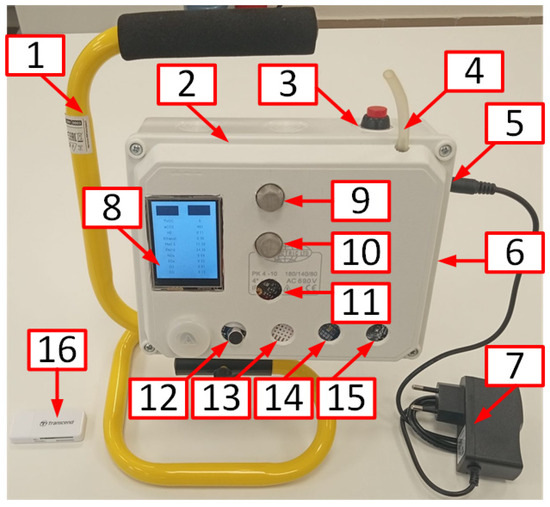
Figure 5.
The experimental setup for measuring environmental characteristics—general view. 1—handle and stand; 2—body; 3—power button; 4—suction pipe of sensor for fine dust particles; 5—connector for an external power adapter; 6—hole for access to an SD memory card; 7—external power supply unit DC 5 V 2 A; 8—display; 9—sensor MQ-9; 10—sensor MQ-135; 11—barometric pressure sensor; 12—noise sensor; 13—humidity and temperature sensor; 14—light sensor; 15—sensor for TVOC and CO2; 16—USB SD memory card reader.
Figure 6 displays screenshots of the graphical user interface (GUI) of the measurement system. The GUI comprises six primary screens. Upon powering on the device, users are greeted with the “Main Menu” screen, which serves as the gateway to the other screens. The initial sub-screen accessed by selecting “Measurement” showcases the main air characteristics presented in digital format. The subsequent sub-screen within “Measurement” provides numerical data concerning environmental characteristics.
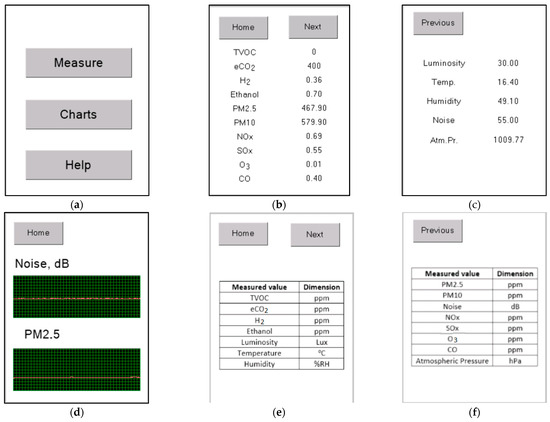
Figure 6.
Graphical user interface of the measurement system: (a) main menu; (b) first measurement screen; (c) second measurement screen; (d) charts; (e) first help screen; (f) second help screen.
The Graphs tab displays noise and fine particulate matter graphs. The Help menu is also divided into two sub-screens. The first sub-screen displays the units of measurement of the air characteristics, and the second sub-screen displays the units of measurement of the environmental characteristics. A “Home” button is available for each of the screens, through which the user returns to the “Main Menu.” The choice to display specific graphs for fine particulate matter and noise is due to the importance of monitoring noise and fine particulate matter in the context of environmental quality assessment. Other air characteristics and environmental data are presented in digital form on a “Measurement” screen to offer a comprehensive view of the measured parameters. The design of the user interface is based on the priorities and goals of the measurement system, and the selected parameters reflect the main factors that the system aims to monitor and provide information about.
The procedure for working with the device is presented in Figure 7. Starting from turning it on to using the features of the device, as well as accessing the recorded data, the device can be powered by a mains or battery. After the user selects one of these two operating modes, a check is made to see whether the memory card to which the data is saved is inserted. If all initial conditions are met, the user presses the start button, and the sensors begin to measure the environmental characteristics for which they are designed. These measurements are recorded on the memory card. During the operation of the device, the user can use the graphical interface to observe the change in measured characteristics in text or graphic mode. Helpful information can also be obtained. After the measurement is finished, the user presses the stop button to turn off the device. With the supply voltage cut off, the memory card can be removed and the data transferred to a personal computer for further processing.
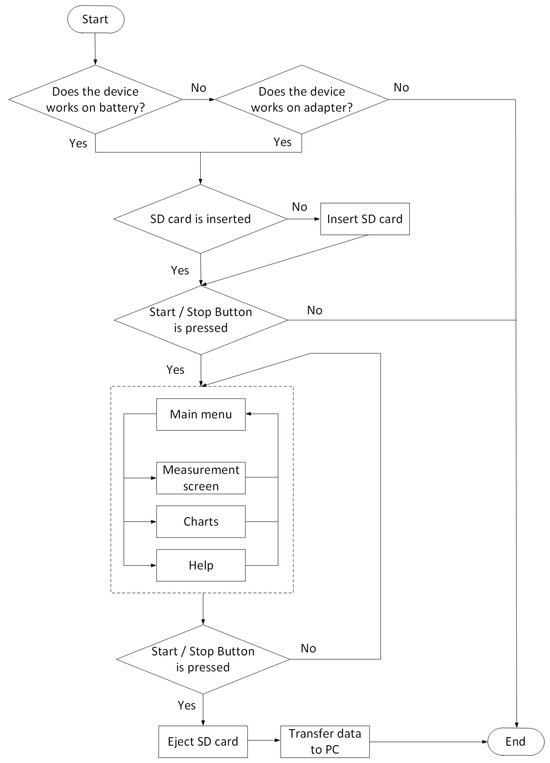
Figure 7.
Operating procedure for the proposed device.
Table 3 shows data from measurements with the proposed system. Atmospheric pressure values remain relatively stable throughout the stages, with minor fluctuations observed. This assumes constant ambient conditions or a negligible impact on the measurement system due to changes in atmospheric pressure. Air quality parameters (TVOC, eCO2, H2, ethanol, PM2.5, and PM10) show different trends in different stages. For example, TVOC and eCO2 show a general trend of decreasing from stage 1 to stage 3, followed by an increase in stages 4 to 6. This fluctuation may indicate changes in indoor air quality or ventilation patterns across the stages. PM2.5 and PM10 concentrations also show fluctuations, potentially influenced by factors such as occupancy, indoor activities, or external environmental conditions. Temperature and humidity levels show slight variations between stages. Overall, the temperature remains relatively stable, while the humidity shows a slight increase from stage 1 to stage 3 before stabilizing. These fluctuations may be due to seasonal changes or variations in indoor conditions. Light intensity showed a consistent increasing trend across stages, indicating potential changes in daylight exposure or artificial lighting conditions over time. The noise level remained relatively stable across stages, suggesting constant background noise levels within the observed environment. The levels of air pollutants (NOx, SOx, O3, CO) show different trends in different stages. For example, NOx and SOx concentrations generally remain stable or show slight fluctuations, while O3 and CO concentrations show minimal variation. These trends can be influenced by factors such as ventilation, occupancy, or external sources of pollution.
Table 3.
Measurements with the proposed system for six stages. All data have statistically significant differences at p < 0.05.
Table 4 presents data from measurements with the proposed and compared systems. The proposed system generally shows higher PM2.5 concentrations than the benchmark system in all stages. However, differences in PM10 concentrations varied between stages, with no consistent pattern observed. Both systems show comparable temperature and humidity levels across the stages, with minor fluctuations observed. These fluctuations may be due to changes in environmental conditions or system performance. Barometric pressure readings are relatively consistent between the two systems in all stages, indicating similar measurement capabilities in this aspect.
Table 4.
Measurements from the proposed and compared systems. All data have statistically significant differences at p < 0.05.
The proposed system consistently shows higher PM2.5 concentrations compared to the compared system across all stages. This suggests that the proposed system may be more sensitive or capable of detecting smaller particulate matter particles than the compared system. The differences in PM2.5 concentrations between the two systems are statistically significant, indicating a systematic variation in measurement between them.
In contrast to PM2.5, the differences in PM10 concentrations between the proposed and compared systems vary between stages, with no consistent pattern observed. This variability may indicate differences in the measurement capabilities of the two systems regarding larger particulate matter particles.
Both systems show comparable temperature and humidity levels across the stages, with minor fluctuations observed. These fluctuations are likely influenced by changes in environmental conditions or variations in system performance. The consistency in temperature and humidity readings between the proposed and compared systems suggests that both systems are capable of accurately measuring these parameters.
Barometric pressure readings are relatively consistent between the proposed and compared systems in all stages, indicating similar measurement capabilities in this aspect. The consistency in barometric pressure measurements suggests that both systems are reliable in capturing changes in atmospheric pressure, which is essential for understanding atmospheric dynamics and weather patterns.
A comparative analysis was made between the data measured with the proposed system and the compared system. Figure 8 shows the results of this analysis. The largest scatter in the measurement data is observed for PM2.5 and humidity. These two characteristics open to a lesser degree the data measured with the compared system. In all other cases, the coefficient of determination exceeds 0.9, which is indicative that those measured with the proposed system and the compared one are sufficiently close to each other.
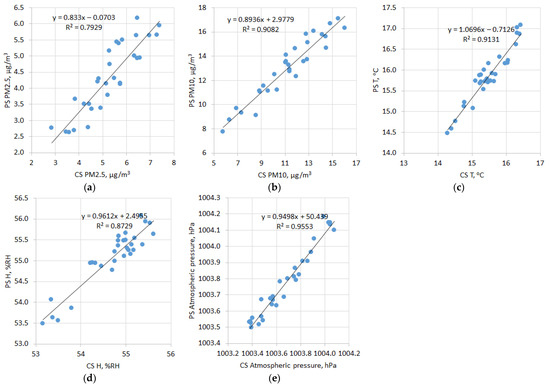
Figure 8.
A comparative analysis between the proposed and compared systems. (a) PM2.5; (b) PM10; (c) temperature; (d) humidity; (e) atmospheric pressure. PS—proposed system; CS—compared system.
Table 5 shows the results of the comparative analysis between the proposed and compared measurement systems. The results presented in graphic form fully correspond to those in the table. The lowest values of the determination coefficient and the highest values of peas show PM2.5 and humidity. With these two characteristics, R2 ranges from 0.79 to 0.87, which indicates that the accuracy is high enough. In the remaining cases, the coefficient of determination is over 0.9, and the errors have relatively low values. These results show that the data measured with the proposed system correspond with sufficient accuracy to those determined with the compared system.
Table 5.
Results from a comparative analysis between proposed and compared systems.
Table 6 presents a comparative analysis between the proposed environmental quality assessment device and such technical means by other authors. The proposed device features a wide range of environmental quality parameters, including TVOC, CO2, temperature, humidity, fine particulate matter, noise, NOx, SOx, O3, and CO. This indicates a specialized approach to environmental quality assessment, which is critical to obtaining a comprehensive understanding of environmental conditions. Hernández-Rodríguez [9] and Aashiq et al. [15] present devices that focus on specific parameters such as TVOC, CO2, and NOx. Although these devices may be excellent at measuring these particular parameters with high accuracy, they lack the ability to provide a broader assessment of environmental quality. The proposed device demonstrates its ability to measure various parameters by integrating appropriate sensor technologies, including the measurement of both gaseous pollutants (e.g., CO2, NOx) and physical parameters (e.g., temperature, humidity, and noise). This integration of technologies improves the device’s flexibility and applicability in various environmental monitoring scenarios. Some devices used in the comparison, including the proposed device, focus on monitoring atmospheric pollutants such as NOx, SOx, and O3. This shows a shared interest in air quality assessment, particularly with regard to pollutants that contribute to environmental degradation and pose risks to human health.
Table 6.
Devices for measuring environmental quality characteristics.
Important aspects of the development and use of the proposed device include uncertainty and quality assurance. These aspects are presented in Table 7. Through aspects such as improvement and evaluation, routine setup and maintenance, consistency and accuracy, disturbance and fault assessment, recognition of external influences, alignment and unified sampling, and standard operating procedure (SOP) development, the device demonstrates robustness and reliability in monitoring environmental applications. The coefficient of determination indicates strong agreement between the device and reference systems, while routine calibration and maintenance procedures ensure optimal operating conditions and accuracy. Consistency and precision are assessed by the coefficient of variation, with multiple measurements assessing reproducibility and reliability. The detection and correction of interference and damage, the recognition of external influences, uniform calibration protocols, and the development of standardized operating procedures further increase the reliability of the device, providing users with accurate and consistent environmental data to make an informed decision.
Table 7.
Determined the uncertainty and quality assurance of the proposed device.
5. Discussion
The results presented in this work improve those of Wang et al. [14], Aashiq et al. [15], and Karnati [16]. The mentioned authors develop air quality assessment systems, but since their main direction is the implementation of IoT systems, this requires limiting the set of sensors used and, accordingly, the measured air characteristics. In the present work, this problem is solved by recording the measured data on an SD memory card and accordingly determining a total of 14 environmental characteristics.
Efforts towards collaborative solutions and innovative technologies are central to the ongoing fight against air pollution, ensuring cleaner air for current and future generations. In this regard, Eriyadi et al. [17], Hassani et al. [18], and Jayasree et al. [19] propose IoT-based solutions for determining ambient air characteristics. While some of the proposed systems specifically target industrial pollution, the device proposed in this work offers a wider range of monitoring parameters, including indoor and outdoor pollutants, temperature, humidity, and noise. This measurement capability enables a more holistic understanding of environmental conditions, making it applicable in a variety of non-industrial scenarios. Most of the measurement systems developed by other authors require ongoing calibration and maintenance; the proposed device integrates real-time monitoring technology without frequent calibration needs. This feature ensures continuous and accurate data collection, enabling proactive measures to preserve air quality in factories, urban areas, and other sites.
The proposed environmental quality assessment device offers significant improvements over existing developments by providing comprehensive parameter measurement, improved reliability, scalability, and integration potential. These improvements contribute to more effective pollution management and address pressing environmental challenges related to air pollution and the environment in general.
Although the IoT-based system of Gayathri et al. [21] offers real-time monitoring, it may have limitations in the detection of specific gases. In contrast, the proposed device can measure a wide range of parameters, including specific gases such as TVOC, CO2, NOx, SOx, O3, and CO, offering a more comprehensive approach to pollution monitoring. This ability to measure various pollutants increases the device’s effectiveness in addressing the adverse effects of air pollution on human health and the environment.
The low-cost air pollution monitoring system of Deepthi et al. [22] highlighted the advantages of detecting contaminated areas and facilitating timely responses. However, scalability and integration challenges remain. The proposed device addresses these challenges by offering integrated technology and real-time monitoring capabilities, increasing data reliability and accuracy. This improvement allows for more effective pollution management and timely interventions to mitigate the adverse impacts of air pollution.
Raysoni et al. [23], in reviewing the benefits of low-cost air monitoring sensors in democratizing air quality monitoring, acknowledge limitations in accuracy and spatial variability. The proposed device mitigates these limitations by offering scalability and integration potential. Its user-friendly interfaces and potential scalability improve accessibility and applicability in a variety of settings, while its potential for integration with existing systems improves the feasibility of widespread deployment. This improvement allows for more accurate and comprehensive monitoring of air quality, contributing to effective pollution management efforts.
6. Conclusions
The proposed environmental quality assessment device represents a significant advancement in environmental monitoring technology, offering a comprehensive solution with several key advantages. Its ability to measure a wide array of parameters, encompassing TVOC, CO2, temperature, humidity, particulate matter, noise, NOx, SOx, O3, and CO, provides a comprehensive understanding of environmental conditions. This breadth of measurement, coupled with integrated technology and real-time monitoring capabilities, ensures precise and timely detection of environmental changes, empowering stakeholders to take proactive measures.
The comparative analysis between the proposed and compared measurement systems indicates enough accuracy between the two devices. PM2.5 and humidity exhibit the lowest determination coefficients and highest p-values. Despite this, with R2 values ranging from 0.79 to 0.87, the accuracy remains sufficiently high. Moreover, for other characteristics, the coefficient of determination exceeds 0.9, accompanied by relatively low errors. These outcomes demonstrate that the data obtained from the proposed system has a high level of accuracy when compared to those obtained from the reference measurement system.
The proposed device stands out for its ability to measure a broad spectrum of environmental parameters, including gaseous pollutants and physical factors crucial for comprehensive monitoring. Unlike devices focusing on specific parameters, the proposed device offers versatility, integrating various sensor technologies to provide an accurate assessment of environmental quality. Also, there is a shared emphasis among several devices, including the proposed one, on monitoring atmospheric pollutants, indicating a common interest in addressing air quality concerns.
Moreover, the device’s user-friendly interfaces and potential scalability enhance accessibility and applicability across diverse settings. Its possible integration with existing systems not only streamlines deployment but also amplifies its cost-effectiveness, making widespread adoption feasible. This amalgamation of features positions the device as a promising tool for holistic environmental quality assessment and management, capable of fostering environmental awareness and supporting public health and sustainable development initiatives across sectors.
The comparative analysis underscores a trend toward the development of more complex and multifunctional environmental monitoring devices. Future research in this domain could focus on refining the accuracy, reliability, and real-time capabilities of such devices, as well as exploring avenues for integration with smart city initiatives and environmental management systems. By continuously enhancing the functionality and interoperability of these systems, stakeholders can harness their full potential to address pressing environmental challenges and promote collective action toward a sustainable future.
The proposed environmental quality assessment device introduces novel features and advancements that improve the accuracy, versatility, accessibility, and usability of environmental monitoring technology. Its comprehensive measurement capabilities, integrated technology, real-time monitoring capabilities, user-friendly interfaces, scalability, and potential for integration set it apart as a promising tool for accurate environmental quality assessment and management.
The proposed environmental quality assessment device offers a versatile and effective solution for addressing environmental challenges and promoting sustainable development across sectors. Its practical applications span from environmental monitoring and management to public health and urban planning, contributing to a healthier and more sustainable future.
Author Contributions
Conceptualization, Z.Z. and P.V.; methodology, Z.Z. and M.V.; software, Z.Z. and A.T.; validation, D.K., A.T. and M.V.; formal analysis, M.V.; investigation, Z.Z. and A.T.; resources—A.T.; data curation, Z.Z. and M.V.; writing—original draft preparation, Z.Z. and M.V.; writing—review and editing—Z.Z. and P.V.; visualization—Z.Z. and M.V.; supervision, Z.Z. and P.V.; project administration, Z.Z. All authors have read and agreed to the published version of the manuscript.
Funding
This work was administrative and technically supported by the Bulgarian national program “Development of Scientific Research and Innovation at Trakia University in the Service of Health and Sustainable Well-Being”—BG-RRP-2.004-006-C02.
Institutional Review Board Statement
Not applicable.
Informed Consent Statement
Not applicable.
Data Availability Statement
All of the data are contained within the article.
Conflicts of Interest
The authors declare no conflicts of interest.
Abbreviations
| AAL | Ambient assisted living |
| ADC | Analog-to-digital converter |
| AP | Atmospheric pressure |
| AWS | Automatic weather station |
| CO | Carbon monoxide |
| CO2 | Carbon dioxide |
| CS | Compared system |
| CV | Coefficient of variation |
| GPS | Global positioning system |
| HC | Hydrocarbons |
| I2C | Inter-integrated circuit |
| IDE | Integrated development environment |
| IPCC | Intergovernmental Panel on Climate Change |
| IoT | Internet of things |
| LPG | liquefied petroleum gas |
| NOx | Nitrogen oxides |
| PS | Proposed system |
| PM | Particulate matter |
| QoS | Quality of service |
| RH | Relative humidity |
| RMSE | Root mean squared error |
| SD card | Secure digital card |
| SDHC | Secure Digital High Capacity |
| SOP | Standardized operating procedure |
| SOx | Sulfur oxides |
| SPI | Serial Peripheral Interface |
| SSE | Sum of squared errors |
| SSTO | Total sum of squares |
| TFT | Thin film transistor |
| TTL | transistor–transistor logic |
| TVOC | total volatile organic compounds |
| UART | Universal asynchronous receiver-transmitter |
| USB | Universal serial bus |
| VOC | Volatile organic compounds |
| WGS | World geodetic system |
Appendix A
| Listing A1. Listing of the program for a single-board microcomputer. | |
| #include <SDS011-select-serial.h> #include <Wire.h> #include “Adafruit_SGP30.h” #include <Adafruit_Sensor.h> #include “Adafruit_TSL2591.h” #include “DHT.h” #include <Adafruit_Sensor.h> #include “Adafruit_BMP3XX.h” #include <SPI.h> #include <SD.h> String sendThis = ““; //Declare and initialise the string we will send to Nextion String stringData; float p10,p25; SDS011 my_sds(Serial2); const int chipSelect = 5; //SPI chip select for SD card #define SEALEVELPRESSURE_HPA (1013.25) Adafruit_BMP3XX bmp; #define DHTPIN 7 //data pin for DHT22 sensor #define DHTTYPE DHT22 DHT dht(DHTPIN, DHTTYPE); Adafruit_SGP30 sgp; Adafruit_TSL2591 tsl = Adafruit_TSL2591(2591); //sample window for sound sensor const int sampleWindow = 50; // Sample window width in mS (50 mS = 20Hz) unsigned int sample; uint32_t getAbsoluteHumidity(float temperature, float humidity) { // approximation formula from Sensirion SGP30 Driver Integration chapter 3.15 const float absoluteHumidity = 216.7f * ((humidity/100.0f) * 6.112f * exp((17.62f * temperature)/(243.12f + temperature))/(273.15f + temperature)); // [g/m^3] const uint32_t absoluteHumidityScaled = static_cast<uint32_t>(1000.0f * absoluteHumidity); // [mg/m^3] return absoluteHumidityScaled; } void configureSensor(void){ tsl.setGain(TSL2591_GAIN_LOW); tsl.setTiming(TSL2591_INTEGRATIONTIME_300MS); tsl2591Gain_t gain = tsl.getGain(); switch(gain); } void setup() { Serial.begin(9600); Serial1.begin(9600); Serial2.begin(9600); if (!SD.begin(chipSelect)) { Serial.println(“Card failed, or not present”); // do not do anything more: while (1); } Serial.println(“card initialized.”); File dataFile = SD.open(“datalog.txt”, FILE_WRITE); if (dataFile) { dataFile.println(“Begin”); dataFile.close(); // print to the serial port too: Serial.println(“Begin”); } // if the file is not open, pop up an error: else { Serial.println(“error opening datalog.txt”); } Wire.begin(); bmp.begin_I2C(); // Set up oversampling and filter initialization bmp.setTemperatureOversampling(BMP3_OVERSAMPLING_8X); bmp.setPressureOversampling(BMP3_OVERSAMPLING_4X); bmp.setIIRFilterCoeff(BMP3_IIR_FILTER_COEFF_3); bmp.setOutputDataRate(BMP3_ODR_50_HZ); pinMode (A2, INPUT); pinMode (A7, INPUT); if (! sgp.begin()){ //Serial.println(“Sensor not found:(“); while (1); } dht.begin(); } int counter = 0; void loop() { //SGP30 read and check TVOC eCO2 H2 Ethanol measurement if (! sgp.IAQmeasure()) { //Serial.println(“Measurement failed”); return; } uint32_t a1=sgp.TVOC; uint32_t a2=sgp.eCO2; if (! sgp.IAQmeasureRaw()) { //Serial.println(“Raw Measurement failed”); return; } //H2 and Ethanol concentrations, according to the datasheet float h2ref=14055; float ethref=19831; float h2=sgp.rawH2; float eth=sgp.rawEthanol; float h21=0.4*exp((h2ref-h2)/512); float eth1=0.5*exp((ethref-eth)/512); float a3=h21; float a4=eth1; //Lux measurement TSL2591 float b1 = tsl.getLuminosity(TSL2591_VISIBLE); b1=b1/10; float c1 = dht.readTemperature(); float c2 = dht.readHumidity(); //dust sensor read SDS011 float d1; float d2; my_sds.read(&p25,&p10); d1=p25; d2=p10; //sound sensor unsigned long startMillis= millis(); // Start of sample window float peakToPeak = 0; // peak-to-peak level unsigned int signalMax = 0; //minimum value unsigned int signalMin = 1024; //maximum value // collect data for 50 mS while (millis() - startMillis < sampleWindow){ sample = analogRead(A2); //get reading from microphone if (sample < 1024) // toss out spurious readings { if (sample > signalMax) { signalMax = sample; // save just the max levels } else if (sample < signalMin) { signalMin = sample; // save just the min levels } } } peakToPeak = signalMax − signalMin; // max − min = peak-peak amplitude float db = map(peakToPeak,20,900,49.5,90); //calibrate for deciBels float e1=db; //MQ-135 NOx measure float RL = 20.1; float Ro = 10.0; float A = 116.6020682; float B = -2.769034857; float T1=c1; //temperature float H1=c2; //humidity float v = analogRead(A7)*(5.0/1023.0); float cf1=-0.03*T1-0.003*(H1-33)+0.0003*T1*T1+0.000025*T1*(H1 − 33); cf1=abs(cf1); float Rs = ((5.0/v) − 1)*(RL); float ratio1 = Rs/Ro; float ratio=ratio1/cf1; float f1 = A * pow(ratio, B); //NOx, ppm //MQ-135 SOx measure A=331.51; B=-0.974; float f2 = A * pow(ratio, B); f2=f2/100; //SOx, ppm //MQ-135 O3 measure float f3=9.4783 * pow(ratio, 2.3348);f3=f3/100000; //O3, ppm //MQ-9 CO measure A = 595; B = -2.24; float v1 = analogRead(A8)*(5.0/1023.0); float cf2=-0.02*T1-0.004*(H1-33)+0.0002*T1*T1+0.00004*T1*(H1-33); cf2=abs(cf2); Rs = ((5.0/v1)-1)*(RL); ratio1 = Rs/Ro; ratio=ratio1/cf2; float g1 = A * pow(ratio, B); //CO, ppm | //BM388 float altitude = bmp.readAltitude(SEALEVELPRESSURE_HPA); float Pressure = bmp.pressure/100; //hPa float Temperature = bmp.temperature; //Final String with all Data String cdata =String(Pressure)+”,”+String(a1)+”,”+String(a2)+”,”+String(a3)+”,”+String(a4)+”, ”+String(b1)+”,”+String(c1)+”,”+String(c2)+”,”+String(d1)+”, ”+String(d2)+”,”+String(e1)+”,”+String(f1)+”,”+String(f2)+”, ”+String(f3)+”,”+String(g1)+”,”; //SD Card File dataFile1 = SD.open(“datalog1.txt”, FILE_WRITE); if (dataFile1) { dataFile1.println(cdata); dataFile1.close(); // print to the serial port too: //Serial.println(cdata); } // if the file is not open, pop up an error: else { Serial.println(“error opening datalog1.txt”); } //Sender Arduino Board Code (Master) //Serial1.println(); //Serial1.println(cdata); cdata=““; // Printing the values on the Nextion //Page 1 values sendThis = “page1.t10.txt=“; sendThis+=(“\”“); //symbol “ sendThis.concat(a1); stringData=String(sendThis); Serial.print(stringData); Serial.write(0x22); //symbol “ Serial.write(0xff); Serial.write(0xff); Serial.write(0xff); //End of line sendThis = “page1.t11.txt=“; sendThis+=(“\”“); //symbol “ sendThis.concat(a2); stringData=String(sendThis); Serial.print(stringData); Serial.write(0x22); //symbol “ Serial.write(0xff); Serial.write(0xff); Serial.write(0xff); //End of line sendThis = “page1.t12.txt=“; sendThis+=(“\”“); //symbol “ sendThis.concat(a3); stringData=String(sendThis); Serial.print(stringData); Serial.write(0x22); //symbol “ Serial.write(0xff); Serial.write(0xff); Serial.write(0xff); //End of line sendThis = “page1.t13.txt=“; sendThis+=(“\”“); //symbol “ sendThis.concat(a4); stringData=String(sendThis); Serial.print(stringData); Serial.write(0x22); //symbol “ Serial.write(0xff); Serial.write(0xff); Serial.write(0xff); //End of line sendThis = “page1.t14.txt=“; sendThis+=(“\”“); //symbol “ sendThis.concat(d1); stringData=String(sendThis); Serial.print(stringData); Serial.write(0x22); //symbol “ Serial.write(0xff); Serial.write(0xff); Serial.write(0xff); //End of line sendThis = “page1.t15.txt=“; sendThis+=(“\”“); //symbol “ sendThis.concat(d2); stringData=String(sendThis); Serial.print(stringData); Serial.write(0x22); //symbol “ Serial.write(0xff); Serial.write(0xff); Serial.write(0xff); //End of line sendThis = “page1.t16.txt=“; sendThis+=(“\”“); //symbol “ sendThis.concat(f1); stringData=String(sendThis); Serial.print(stringData); Serial.write(0x22); //symbol “ Serial.write(0xff); Serial.write(0xff); Serial.write(0xff); //End of line sendThis = “page1.t17.txt=“; sendThis+=(“\”“); //symbol “ sendThis.concat(f2); stringData=String(sendThis); Serial.print(stringData); Serial.write(0x22); //symbol “ Serial.write(0xff); Serial.write(0xff); Serial.write(0xff); //End of line sendThis = “page1.t18.txt=“; sendThis+=(“\”“); //symbol “ sendThis.concat(f3); stringData=String(sendThis); Serial.print(stringData); Serial.write(0x22); //symbol “ Serial.write(0xff); Serial.write(0xff); Serial.write(0xff); //End of line sendThis = “page1.t19.txt=“; sendThis+=(“\”“); //symbol “ sendThis.concat(g1); stringData=String(sendThis); Serial.print(stringData); Serial.write(0x22); //symbol “ Serial.write(0xff); Serial.write(0xff); Serial.write(0xff); //End of line //Page 2 values sendThis = “page2.t4.txt=“; sendThis+=(“\”“); //symbol “ sendThis.concat(b1); stringData=String(sendThis); Serial.print(stringData); Serial.write(0x22); //symbol “ Serial.write(0xff); Serial.write(0xff); Serial.write(0xff); //End of line sendThis = “page2.t5.txt=“; sendThis+=(“\”“); //symbol “ sendThis.concat(c1); stringData=String(sendThis); Serial.print(stringData); Serial.write(0x22); //symbol “ Serial.write(0xff); Serial.write(0xff); Serial.write(0xff); //End of line sendThis = “page2.t6.txt=“; sendThis+=(“\”“); //symbol “ sendThis.concat(c2); stringData=String(sendThis); Serial.print(stringData); Serial.write(0x22); //symbol “ Serial.write(0xff); Serial.write(0xff); Serial.write(0xff); //End of line sendThis = “page2.t7.txt=“; sendThis+=(“\”“); //symbol “ sendThis.concat(e1); stringData=String(sendThis); Serial.print(stringData); Serial.write(0x22); //symbol “ Serial.write(0xff); Serial.write(0xff); Serial.write(0xff); //End of line sendThis = “page2.t9.txt=“; sendThis+=(“\”“); //symbol “ sendThis.concat(Pressure); stringData=String(sendThis); Serial.print(stringData); Serial.write(0x22); //symbol “ Serial.write(0xff); Serial.write(0xff); Serial.write(0xff); //End of line //Send to chart Page 3 sendThis = “add 2,0,”; sendThis.concat(round(e1)); stringData=String(sendThis); Serial.print(stringData); Serial.write(0xff); Serial.write(0xff); Serial.write(0xff); //End of line sendThis = “add 4,0,”; sendThis.concat(round(d1)); stringData=String(sendThis); Serial.print(stringData); Serial.write(0xff); Serial.write(0xff); Serial.write(0xff); //End of line delay(2000); //SGP_30 counter counter++; if (counter == 30) { counter = 0; uint16_t TVOC_base, eCO2_base; if (! sgp.getIAQBaseline(&eCO2_base, &TVOC_base)) { //Serial.println(“Failed to get baseline readings”); return; } // Serial.print(“****Baseline values: eCO2: 0x”); Serial.print(eCO2_base, HEX); // Serial.print(“ & TVOC: 0x”); Serial.println(TVOC_base, HEX); } } |
References
- Directive 2008/50/EC of the European Parliament and of the Council of 21 May 2008 on Ambient Air Quality and Cleaner Air for Europe. Available online: https://www.eea.europa.eu/policy-documents/directive-2008-50-ec-of (accessed on 11 May 2024).
- European Parliament, Resolution of 25 March 2021 on the Implementation of the Ambient Air Quality Directives, 2020/2091(INI). Available online: https://www.europarl.europa.eu/doceo/document/TA-9-2021-0107_EN.html (accessed on 11 May 2024).
- European Committee of the Regions, Opinion. Revision of the EU Ambient Air Quality Legislation, CdR 6180/2022. Available online: https://cor.europa.eu/en/our-work/Pages/OpinionTimeline.aspx?opId=CDR-6180-2022 (accessed on 11 May 2024).
- Stawowy, M.; Olchowik, W.; Rosiński, A.; Dąbrowski, T. The Analysis and Modelling of the Quality of Information Acquired from Weather Station Sensors. Remote Sens. 2021, 13, 693. [Google Scholar] [CrossRef]
- Mölder, M. A Mobile Platform for Measuring Air Pollution in Cities Using Gas Sensors. Master’s Thesis, KTH Skolan för Elektroteknik Och Datavetenskap, Stockholm, Sweden, 2018. [Google Scholar]
- Taştan, M. An IoT Based Air Quality Measurement and Warning System for Ambient Assisted Living. Eur. J. Sci. Technol. 2019, 16, 960–968. [Google Scholar] [CrossRef]
- Marinov, M.; Topalov, I.; Nikolova, B.; Nikolov, G.; Djamiykov, T. Smart Multisensor Node for Environmental Parameters Monitoring in Urban Areas. In Proceedings of the 2019 X National Conference with International Participation (ELECTRONICA), Sofia, Bulgaria, 16–17 May 2019; pp. 1–4. [Google Scholar]
- Esatbeyoglu, E.; Sass, A.; Cassebaum, O.; Schulze, S. Data Driven Air Quality Prediction based on Mobile Measurement. E3S Web Conf. 2019, 101, 03001. [Google Scholar] [CrossRef]
- Hernández-Rodríguez, E.; Schalm, O.; Martínez, A. Development of a Low-Cost Measuring System for the Monitoring of Environmental Parameters That Affect Air Quality for Human Health. J. Eng. Technol. Ind. Appl. 2020, 6, 13. [Google Scholar]
- Barot, V.; Kapadia, V.; Pandya, S. QoS Enabled IoT Based Low Cost Air Quality Monitoring System with Power Consumption Optimization. Cybern. Inf. Technol. 2020, 20, 122–140. [Google Scholar] [CrossRef]
- Solomon, P.; Vallano, D.; Lunden, M.; LaFranchi, B.; Blanchard, C.; Shaw, S. Mobile-platform measurement of air pollutant concentrations in California: Performance assessment, statistical methods for evaluating spatial variations, and spatial representativeness. Atmos. Meas. Tech. 2020, 13, 3277–3301. [Google Scholar] [CrossRef] [PubMed]
- Palamar, A.; Karpinski, M.; Palamar, M.; Halyna Osukhivska, H.; Mytnyk, M. Remote Air Pollution Monitoring System Based on Internet of Things. In Proceedings of the ITTAP’2022: 2nd International Workshop on Information Technologies: Theoretical and Applied Problems, Ternopil, Ukraine, 22–24 November 2022. [Google Scholar]
- Alili, I. The changes in percipation regime in Republic of Macedonia during the second half of 20-th century. Acad. Sci. J. Linguist. Lit. Educ. Cult. Idest 2009, 232–237. Available online: https://www.uni-sofia.bg/var/ezwebin_site/storage/original/application/b136755bb7a8c6dc4bf4c049e169cddd (accessed on 11 May 2024).
- Wang, C.; Liu, H.; Ji, H.; Wu, Y. A Design of Indoor Air-Quality Monitoring System. J. Phys. Conf. Ser. 2022, 2366, 012011. [Google Scholar] [CrossRef]
- Aashiq, M.; Kurera, W.; Thilekaratne, M.; Saja, A.; Rouzin, M.; Neranjan, N.; Yassin, H. An IoT based handheld environmental and air quality monitoring station. Acta IMEKO 2023, 12, 1–8. [Google Scholar] [CrossRef]
- Karnati, H. IoT-Based Air Quality Monitoring System with Machine Learning for Accurate and Real-time Data Analysis. arXiv 2023, arXiv:2307.00580. [Google Scholar]
- Eriyadi, M.; Notosudjono, D.; Setiana, H.; Yakin, M. Low-cost mobile air quality monitoring based on internet of things for factory area. Indones. J. Electr. Eng. Comput. Sci. 2023, 32, 545–554. [Google Scholar] [CrossRef]
- Hassani, A.; Castell, N.; Watne, Å.; Schneider, P. Citizen-operated mobile low-cost sensors for urban PM2.5 monitoring: Field calibration, uncertainty estimation, and application. Sustain. Cities Soc. 2023, 95, 104607. [Google Scholar] [CrossRef]
- Jayasree, G.; Anjali, G.; Saraswathi, D.; Shamshujeya, S. LoRa based smart city air quality monitoring system. Int. J. Creat. Res. Thoughts 2023, 11, e760–e766. [Google Scholar]
- Prabu, M.; Boomika, V.; Bala, S.; Prisha, G. Digital Air Quality Monitoring System. Int. J. Res. Publ. Rev. 2023, 4, 413–419. [Google Scholar] [CrossRef]
- Gayathri, S.; Alamelu, N.; Anuchiyadevi, K.; Arthi, M. IoT Based Air Pollution Monitoring System. Int. Res. J. Educ. Technol. 2023, 5, 494–497. [Google Scholar]
- Deepthi, G.; Krishna, C.; Vamsi, M.; Krishna, V. Solar based air quality monitoring using internet of things. ZKG Int. 2023, 8, 1784–1791. [Google Scholar]
- Raysoni, A.; Pinakana, S.; Mendez, E.; Wladyka, D.; Sepielak, K.; Temby, O. A Review of Literature on the Usage of Low-Cost Sensors to Measure Particulate Matter. Earth 2023, 4, 168–186. [Google Scholar] [CrossRef]
- Parajuli, A. Arduino Based Decibel Meter with Sound Sensor. Available online: https://iotprojectsideas.com/arduino-based-decibel-meter-with-sound-sensor (accessed on 3 January 2024).
- Correia, C.; Martins, V.; Matroca, B.; Santana, P.; Mariano, P.; Almeida, A.; Almeida, S.M. A Low-Cost Sensor System Installed in Buses to Monitor Air Quality in Cities. Int. J. Environ. Res. Public Health 2023, 20, 4073. [Google Scholar] [CrossRef] [PubMed]
- Taherdoost, H. Data Collection Methods and Tools for Research; A Step-by-Step Guide to Choose Data Collection Technique for Academic and Business Research Projects. Int. J. Acad. Res. Manag. 2021, 10, 10–38. [Google Scholar]
- Possolo, A. Simple Guide for Evaluating and Expressing the Uncertainty of NIST Measurement Results. In NIST Technical Note 1900; U.S. Department of Commerce, National Institute of Standards and Technology: Gaithersburg, MD, USA, 2015. [Google Scholar]
Disclaimer/Publisher’s Note: The statements, opinions and data contained in all publications are solely those of the individual author(s) and contributor(s) and not of MDPI and/or the editor(s). MDPI and/or the editor(s) disclaim responsibility for any injury to people or property resulting from any ideas, methods, instructions or products referred to in the content. |
© 2024 by the authors. Licensee MDPI, Basel, Switzerland. This article is an open access article distributed under the terms and conditions of the Creative Commons Attribution (CC BY) license (https://creativecommons.org/licenses/by/4.0/).