The Impacts of the Poverty Alleviation Relocation Program (PARP) on Households’ Education Investment: Evidence from a Quasi-Experiment in Rural China


1
School of Agricultural Economics and Rural Development, Renmin University of China, Beijing 100872, China
2
China Anti-Poverty Research Institute, Renmin University of China, Beijing 100872, China
*
Author to whom correspondence should be addressed.
Sustainability 2024, 16(10), 3986; https://doi.org/10.3390/su16103986
Submission received: 7 April 2024
/
Revised: 2 May 2024
/
Accepted: 8 May 2024
/
Published: 10 May 2024
Abstract
:Families’ education investment in their children is crucial for fostering and accumulating human capital among rural children in China. This study examines the impact of the Poverty Alleviation Relocation Program (PARP) on household education investment using panel data from a large-scale survey conducted in 16 counties across 8 provinces over three waves. Employing a staggered difference-in-differences (DID) method, we find a significant increase in average education investment per student in households following the PARP’s implementation, supported by multiple robustness tests. Mechanism analysis reveals that the increase is primarily driven by a higher household income and lower medical expenses among relocated families. Heterogeneity analysis shows notable variations based on relocation attributes and household characteristics, with stronger effects particularly observed for dispersed relocation, scattered resettlement, and household heads with over 6 years of education or in good health. The impact is sustained and strengthens with longer durations of relocation. Our findings offer valuable insights for enhancing rural household education investment.
1. Introduction
Education is widely acknowledged in economics as a key strategy for enhancing human capital and breaking the intergenerational transmission of poverty. The human capital literature reveals that educational attainment equips individuals with essential skills, knowledge, and competencies required for success in the labor market [1,2,3]. Pursuing education not only enhances employability but also increases earning potential [4,5] and facilitates adaptation to dynamic economic circumstances [6]. Moreover, providing equal educational opportunities for disadvantaged families can alleviate inequality stemming from family background, thereby promoting social justice and equality [7]. Furthermore, education is recognized as a primary driver of economic growth in impoverished rural areas, fostering a skilled workforce and stimulating innovation and productivity [8,9]. However, the effective implementation and enhancement of rural education necessitate comprehensive policy support encompassing investment, institutional development, and heightened social awareness.
According to the human capital theory, family investment in children’s education significantly shapes educational outcomes. Families typically adopt a “cost–benefit” framework, weighing the excepted benefits of education, such as increased earning potential and improved job prospects, against associated costs like tuition fees and foregone income from not working [10]. Consequently, differences in children’s academic achievement primarily result from variations in family educational investment [11]. Limited resources often constrain parents from low-income households, leading to inadequate investment in their children’s education and negative impacts on academic performance [2]. Research by Gross corroborates this, showing a positive correlation between students’ cognitive skills and their parents’ socioeconomic status, indicating that children from more affluent backgrounds tend to access greater educational resources and support, thereby positively influencing their academic outcomes [12]. Additionally, family education investment perpetuates socio-economic inequalities while fostering intergenerational social mobility, highlighting the importance of understanding its determinants to promote educational equity and social progress [13,14]. Therefore, the significance of investing in children’s education has motivated researchers to explore the determinants of family education investment.
Studies across rural China have consistently revealed a substantial disparity in educational investment between rural and urban families, with rural families exhibiting substantially lower levels of investment. China’s fiscal education funds have successfully met the long-term objective of allocating at least 4% of the budget towards education, effectively addressing the disparity in public education expenditure between urban and rural areas and alleviating the issue of inadequate funding for rural education [15]. However, a notable gap in family education investment between urban and rural regions persists during early life stages, largely attributed to the unequal distribution of educational resources between urban and rural areas [16,17]. According to the China Institute of Education Finance study in 2019, rural primary school students had an average household education expenditure of CNY 1905, which is significantly lower than the national average of CNY 4014 and the average expenditure for urban primary school students (CNY 6575) [18]. Similarly, rural middle school students allocated an average of CNY 3821 towards their education, which is significantly less than urban middle school students who spent CNY 9199 on average [19]. The disparities in educational investment among urban and rural families primarily stem from factors such as economic circumstances [20,21], cultural customs [22], and educational ideologies [23].
Beyond internal family dynamics, recent studies have increasingly examined the impact of external economic policies on household education investment in rural areas. While evidence supporting the effect of these policies on family education investment has emerged more recently, earlier international studies primarily focused on land and tax policies. For example, Ferrara and Milazzo [24] have affirmed that inheritance policies regarding land heritage in Ghanaian matrilineal societies limited family investment in matrilineal children’s education. Edmonds et al. [25] demonstrated the significant negative impact of tariff reform in India on education investment. Albertus et al. [26] found that higher exposure to land reform across Peru in the 1970s negatively impacted household educational investment. Similarly, previous research in rural China has tended to focus on reforms such as the registered residence system [27], rural tax policies [28], and new rural insurance policies [29,30], examining their effects on family education investment. Most of these policies influence family education investment behavior by alleviating income risks and financial constraints faced by households, thereby encouraging increased investment in education [31].
China implemented an extensive poverty alleviation effort from 2016 to 2020, ultimately leading to the official declaration that absolute poverty had been eliminated from the country’s rural regions in early 2021 [32]. While several studies have investigated the spillover effects of poverty alleviation policies on family education investment during this period in rural China, focusing on targeted poverty alleviation [33], industrial poverty alleviation [34], and financial poverty alleviation policies [35], none have yet examined the impact of the Poverty Alleviation Relocation Policy on household education investment.
The Poverty Alleviation Relocation Program (PARP), considered one of the most extensive re-housing initiatives ever undertaken, played a crucial role in poverty alleviation efforts [36]. It aimed to improve living conditions for rural families by providing new residences, benefiting a total of 10 million extremely impoverished households between 2016 and 2020 (Data source: http://www.scio.gov.cn/ztk/dtzt/44689/45216/index.htm, accessed on 6 April 2024). Unlike traditional poverty alleviation measures, such as food or cash transfers and agricultural subsidies, the PARP directly targeted living conditions by ensuring access to essential amenities like clean water, electricity, schools, and clinics. As a resource-intensive policy intervention, the PARP has garnered significant attention from researchers studying its causal effects on participants’ economic and social outcomes. Research indicates that the PARP has various positive impacts, including poverty reduction [37], decreased household livelihood vulnerability [38], improved non-agricultural employment opportunities [39], increased income [40], and enhanced women’s decision-making power [41]. Additionally, the PARP has led to the reshaping of neighboring social networks [42] and an increase in income inequality among relocated households [43]. Despite these findings, limited exploration has been conducted on the PARP’s influence on human capital investment within relocated households.
This study aims to expand and enhance existing research on the impact of the PARP by investigating whether it influenced educational investment within relocated households. The timing of relocation was determined by county-level governments, providing a plausibly exogenous assignment of targeted households to resettlements. Our objective is to identify the causal effect of relocation on education investment. However, addressing potential endogeneity concerns, such as reverse causality and selection bias regarding households’ relocation decisions, poses a significant challenge in determining the causal effect of relocation on outcome variables [44,45]. To mitigate these concerns, we employ a panel data and a difference-in-differences (DID) model for causal identification.
While research on the relationship between migration and family education investment is expanding globally, there remains a scarcity of studies from developing countries. Existing research primarily originates from the United States [46,47,48,49,50,51] and Europe [52,53]. Liu et al.’s [38] study, to the best of our knowledge, is the first to examine the impact of relocation and settlement programs on education expenditure in the context of a developing country. However, the study only focused on specific provinces in China or narrow geographic areas (i.e., Shanxi). Therefore, our study’s first contribution is to enhance the literature by collecting data from a nationwide sample of 798 households in rural regions of China to examine the effect of the PARP on household education investment.
Another significant contribution of this study is the utilization of quasi-experimental methods—the staggered difference-in-differences (DID) model. The approach effectively controls for the influence of other trending factors and addresses differences between the treatment and control groups prior to the experiment, ensuring the exogeneity of policy shocks and leading to a more accurate estimation of causal effects [54]. Previous studies have been limited by data availability, often resorting to qualitative methods to analyze the impact of the Poverty Alleviation Relocation Program on education investment [55]. This research distinguishes itself from the previous literature by analyzing the causal effect of the PARP on family education investment.
The remainder of the paper is organized as follows: Section 2 introduces the PARP in China and presents a conceptual framework for understanding its effect on household education investment. Section 3 discusses the data and provides descriptive analysis, followed by Section 4, which comprises two parts of empirical analyses. Firstly, we estimate the impact of the PARP on household education investment. Secondly, we discuss the underlying mechanisms of the PARP. Finally, Section 5 concludes this study.
2. Institutional Background and Theoretical Framework
2.1. The PARP Program
China’s Poverty Alleviation Relocation Program (PARP) has evolved distinct stages, reflecting the country’s ongoing efforts to combat poverty and enhance living conditions for rural disadvantaged populations [56]. Originating from early forms of ecological migration, such as the Diaozhuang Migration in the 1980s, organized PARP initiatives began to take shape [57]. The introduction of the 8-7 Plan in 1993 marked the nation’s first comprehensive poverty alleviation strategy, targeting communities in areas with severe poverty and challenging living conditions [58]. Subsequent phases from 2001 to 2010 focused on experimentation and pilot projects, refining relocation strategies and evaluating their impact on poverty alleviation to shape future policy directions. From 2010 to 2015, the PARP expanded its scope to encompass a broader range of regions and households, emphasizing holistic poverty alleviation through relocation, infrastructure development, and livelihood improvement. Official statistics indicate that between 2001 and 2015, the central government allocated CNY 36.3 billion to the program, resulting in the relocation of 6.8 million impoverished individuals (Data sources: https://www.gov.cn/xinwen/2020-12/03/content_5566758.htm, accessed on 6 April 2024).
Our study focuses on the latest and most intensive phase of the PARP, implemented across 22 provinces from 2016 to 2020 [59]. During this period, the Chinese government employed various strategies to implement the poverty alleviation relocation policy. Firstly, the government formulated relevant policy documents and regulations to outline the criteria for identifying relocation targets, resettlement plans, and support policies for industrial development post-relocation. Secondly, the government increased investment in infrastructure construction and public service facilities in relocation areas to ensure that relocated households could access basic services such as education, healthcare, and employment in their new living environment. Moreover, the government actively encouraged enterprises to participate in the industrial development of relocation areas, fostering local economic growth. This period witnessed a significant escalation of the PARP’s efforts aimed at achieving targeted poverty alleviation goals by relocating millions of households to regions with improved living conditions and access to essential services. By the end of 2020, over 9.6 million people living in inhospitable areas had been lifted out of poverty, with approximately CNY 600 billion allocated for the program (Data sources: https://www.ndrc.gov.cn/xwdt/xwfb/202106/t20210630_1285081_ext.html, accessed on 6 April 2024).
2.2. Conceptional Framework
The classical theory of human capital suggests that family investments in education, as a strategy for resource allocation, are influenced by the overall family budget [31]. In an ideal scenario without credit constraints, optimal decision making in family education investment would align its internal return with that of the capital market. However, within the context of household budget constraints, families may reduce their expenditure on education, thereby impacting the accumulation of human capital [60]. The persistent low levels of human capital in rural China may stem from long-standing credit constraints on households [61]. The PARP, as a poverty alleviation policy aimed at reducing poverty and increasing income, has the potential to influence family education investments by altering the cost of living or expected income levels. Specifically, the PARP can affect investment in education for relocated households through several mechanisms (refer to Figure 1).
Firstly, the PARP can effectively increase relocated households’ income, thereby promoting family investment in education, known as the “income effect”. Before relocation, households often reside in remote areas with inadequate infrastructure and public services, limiting their income-earning opportunities due to the limited environmental resources. The PARP enables households to break free from poverty traps caused by resource scarcity and build up family economic capital [38]. During the relocation process, assistance leads to significant improvements in the living conditions of relocated families, transitioning them from living in land and grass houses to spacious, bright, secure, and sturdy new residences [37]. Moreover, improvements in transportation infrastructure create favorable conditions for households to boost their income. Post-relocation assistance focuses on employment, industry, ecology, and finance, creating conditions for relocated households to fully utilize livelihood capital, stimulate internal momentum, and enhance family income [62], thereby generating an income effect and enhancing the education investment of relocated households [33].
Secondly, the PARP can significantly reduce households’ medical expenses, thereby enhancing investment in children’s education, known as the “complementary effect”. Illnesses among rural family members can result in health shocks, increasing healthcare costs and impacting education expenditure for children [63]. Improving infrastructure and public services in resettlements can effectively alleviate the medical burden of relocated households [64]. Substantial funds have been invested in settlement areas to enhance healthcare facilities, including hospitals, sanitation centers, and medical clinics [65]. These initiatives aim to improve medical conditions in resettlements, reduce treatment costs, provide convenient services for relocated households, ensure effective treatment of major diseases, promote health maintenance, and ultimately reduce household medical expenses, alleviating pressures on family budgets [66]. Furthermore, upgraded infrastructure, such as roads, electricity, communications, and waste disposal facilities, improves living convenience for relocated households, leading to changes in hygiene, waste disposal, and energy consumption practices among family members, enhancing healthy human capital and further reducing household medical expenses [67].
Based on the analysis above, our hypotheses can therefore be stated as follows:
Hypothesis 1.
The PARP has a significantly positive impact on educational investment in relocated households.
Hypothesis 2a.
The PARP can enhance the income of relocated households, consequently promoting educational investment, which we term the “income effect”.
Hypothesis 2b.
The PARP can reduce the medical expenses of relocated households, thereby stimulating educational investment, referred to as the “complementary effect”.
3. Empirical Design
3.1. Data Resources
The dataset used in this study was derived from a longitudinal survey conducted on rural impoverished households participating in the PARP scheme. The primary objective of the program is to systematically assess the efficacy of the PARP scheme, providing valuable insights for shaping national policies on relocation and urbanization. The baseline survey, conducted in 2015 by Renmin University of China, employed a stratified random sampling strategy to select sample households. The samples were drawn from 8 provinces with the largest populations earmarked for relocation (the selection of the 8 sampled provinces was based on national plan to relocate populations exceeding 500,000 during the 13th Five-Year Plan period, which ensured the representativeness of the samples. These provinces are Hubei, Hunan, Guangxi, Sichuan, Guizhou, Yunnan, Shaanxi, and Gansu). Based on the sampled province selection criteria, two large relocation counties were randomly chosen from each selected province, considering both the planned scale of relocation and geographical distribution. The sampled counties encompassed fifteen districts and counties across five originally concentrated contiguous areas of extremely poor regions (the regions include Qinba Mountain, Yunnan Guangxi Guizhou rocky desertification area, Wuling Mountain area, Liupan Mountain area, and Wumeng Mountain area), along with one former national poor county located outside the area.
Following the selection of the sample counties, a combination of stratified random sampling methodologies was employed, considering factors such as the planned number of relocated households, relocation timing, and relocation destinations. Two to three townships were randomly selected from each sample county, with two administrative villages chosen randomly from each township. Additionally, one to two village groups were randomly selected from each administrative village. Finally, each village group randomly selected eight registered relocation households and one to two non-registered relocation households intending to relocate synchronously. In 2016 and 2018, follow-up waves were conducted for relocated households, resettlement communities, and those yet to be relocated, as well as origin villages.
The sample comprised registered poverty-stricken households and households relocated synchronously as part of the 13th Five-Year Plan for the PARP. Excluded from the sample were poverty-stricken households that had been cleared, abandoned for relocation, or that were beneficiaries of policies such as dangerous house renovation, rural scenic area development, and old site reconstruction. Additionally, our sample was limited to households with students, as our dependent variable focused on student education investment. After eliminating observations with missing information, we obtained a sample of 2394 observations from 798 households over three waves. Among these, 94 households were relocated in 2016, 342 households in 2017, and 562 households in 2018. A summary of the households’ relocation process is provided in Figure 2.
3.2. Variable Selection
3.2.1. Dependent Variable
The dependent variable in this study is the average education investment within the household. Due to data availability, we utilize the average education investment per-student within the household. Following existing studies [34], “investment in family education” refers to the essential educational costs accrued by students throughout their schooling, primarily encompassing miscellaneous expenses, school uniform fees, and boarding and living expenses paid to the school for their children.
3.2.2. Independent Variable
The independent variable in this study is the relocation status of households. Following previous studies [37,41], “Relocated” is defined as the completion of the relocation process, determined by whether someone has moved into a new home as indicated in the questionnaire. A value of 0 signifies a new home that has not been moved into, while a value of 1 represents a new home that has been occupied. Therefore, “Relocated” is treated as a binary dummy variable.
3.2.3. Control Variables
Previous studies indicate that family education investment is influenced by various factors, such as characteristics of the householder [68], family traits [69], and the policy context [70]. To better identify the impact of the PARP on households’ educational investment, this study selects control variables from these three aspects: (1) head of household characteristics, including gender, age, ethnicity, marital status, education level, and physical health status. (2) Family characteristics, such as whether the household belongs to registered poverty-stricken households, which help control for the impact of education poverty alleviation policies on household education investment [71]. Additionally, we consider the proportion of elderly individuals aged 65 and above, the proportion of children aged 6 and below in households, and family size to reflect the family population structure. We also incorporate annual increases in the fixed assets of households to control for household asset dynamics (please refer to Appendix A Table A1 for a detailed inventory of household assets). (3) Education investment policy characteristics. Previous studies have highlighted the “crowding out effect” of increased public education expenditure on household education expenditure [72]. Therefore, this study includes the level of government public education expenditure at the provincial level (logarithmic) to account for the impact of public education policies.
3.2.4. Descriptive Statistics
The basic demographic and socioeconomic characteristics of the sample households are reported in Table 1. An analysis of shifts in the proportion of relocated sample households revealed that it was 28.8% in 2016, significantly increasing to 70.6% by 2018, mirroring the national Poverty Alleviation Relocation process [36]. Over the period from 2015 to 2018, there was a notable rise in the average investment in education per student, increasing from 4.211 to 4.707.
Looking at the characteristics of the household heads, the data show that 93.5% of household heads are male, and 69.7% are of Han nationality, with the average age of the head of household being around 50 years old. More than 85% of the household heads are married. The average educational attainment of the household heads was approximately 6 years, consistent with other studies conducted in rural China, which suggests that a significant portion of the rural population has not completed compulsory education [41]. Additionally, the percentage of healthy household heads rose from 49.4% in 2015 to 68.2% in 2018.
Among the families in our sample, almost all the sampled households were identified as poor households, implying that the relocation targets for the PARP are impoverished households. The average family size ranged from 4.492 to 4.762, with elderly individuals comprising an average proportion of 10.2% to 14.7%, and children accounting for 5.9% to 6.8% on average. The annual increase in newly added fixed assets per household rose from 1.557 to 6.427, indicating an improvement in the living standards of relocated families.
3.3. Empirical Strategy
3.3.1. Treatment Effect of the PARP
The key challenge in identifying treatment effects lies in addressing the selection issue related to PARP participation. To tackle this challenge, we employed a staggered difference-in-differences (DID) method and conducted an event study to assess the parallel trend assumption across different groups [73]. Although we found no evidence to reject the parallel pre-trend with raw data, we enhanced precision by utilizing pre-treatment entropy balancing to estimate the average treatment effect on the treated (ATT). However, it is crucial to note that the weighting method in entropy balancing only addresses observed characteristics, leaving significant unobserved differences between treated and control groups for valid ATT estimation. To mitigate this, we utilized three-wave panel data and a two-way fixed effects model to control for variables that remain constant over time [74]. Additionally, we performed several robustness checks to further ensure the validity of the causal conclusion.
3.3.2. Baseline DID Design
Given that the relocation of rural households for poverty alleviation is an ongoing process and that not all households planning to relocate simultaneously complete their relocation, the number of relocated households gradually increased from 2016 to 2018. The traditional difference-in-differences model is no longer appliable to this study [75]. Hence, drawing on research by Beck, Levine, and Levkov [76] and utilizing the staggered difference-in-difference (DID) model, we employed the following model:
where represents the average education investment per-student within household i at year t; is the treatment variable, which equals 1 if household i has relocated to the new community in year t, and zero otherwise. The coefficient is the ATT of the PARP; are time-variant observable covariates at the household level, including head, family demographics, and provincial characteristics. are the household fixed effects, controlling for time-invariant unobservable characteristics, while are year fixed effects, controlling for variables constant across households but varying across years. Finally, is the error term.
3.3.3. Parallel Trend Assumption
The DID identification relies on the parallel trend assumption, suggesting that the difference in outcomes between the treatment and control groups would remain constant without treatment [77]. However, this assumption may be violated if initially more disadvantaged individuals are disproportionately selected into the treatment group, as discussed in Section 3.3.1. Additionally, if these individuals exhibit different development trajectories, the parallel trend assumption might not hold. To assess this, we conducted an event study of the PARP, following previous studies [76,78], to examine evidence for parallel pre-trends. The empirical model is as follows:
where is a set of dummies indicating a five-year window around the relocation year of the PARP (from three years before to two years after) (specifically, the forward term for the first three waves before relocation and the lagged term for the last two waves after relocation are obtained by subtracting the years of data collection (2015, 2016, and 2018) from the years of relocation occurrence (2016, 2017, and 2018)). m = 0 signifies the year when the relocation took place, and m = −2, −1, 0, 1, 2. In the regression, we used the group where m = −3 as a benchmark. Thus, measures the treatment effect of assigning a household into the treatment group m years after the relocation compared to the effect three years before the relocation.
4. Empirical Results
4.1. Impacts on Education Investment
Table 2 summarizes the findings of estimating Equation (1) for average education investment per student. The regression results in column (1) indicate that the coefficient for relocation, without any control variables, is 0.701 and significant at the 1% level, which suggests that the PARP effectively stimulated per-student household education investment. Upon incorporating control variables for head, family, and provincial characteristics, it was observed that the PARP increased per-student education investment for relocated households by 68.1%, which is statistically significant at the 5% level, indicating a robust estimation outcome.
Examining the impact of control variables, the age of the household head, marital status, health status, and the proportion of elderly individuals aged 65 and above in the family demonstrate significant positive or negative effects on education investment in relocated households. Specifically, the age and marital status of the household head positively influence education investment, with consistent and robust results. Conversely, the health status of household heads negatively impacts education investment, consistent with findings from previous studies [41]. Moreover, the coefficient for the proportion of elderly individuals aged 65 and above in households is significantly negative, indicating that eldercare responsibilities within households can diminish education investment in children [79].
4.2. Results of Event Study
Figure 3 presents the results of the event study. The horizontal axis on the graph represents the number of periods before and after the implementation of the PARP, while the vertical axis indicates the average education investment per-student for the relocated households. Each dot plotted along the trend line corresponds to the estimated coefficient in Equation (2). The size of the coefficients is estimated, and dashed lines represent the 95% confidence interval of the treatment effect. Specifically, the coefficient – appears to be near the horizontal axis and statistically insignificant, confirming that we cannot reject the null hypothesis, which states that the treatment and control groups have the same trajectory of per-student education investment before relocation. However, when considering the dynamic effects of the PARP, the coefficient – significantly rejects the null hypothesis, implying that the positive impact of the PARP on household education investment is statistically significant.
4.3. Robustness Checks
We conducted several robustness checks to further ensure the validity of the causal conclusion.
First, to address potential biases and ensure the reliability of our baseline results, we performed a permutation test with random assignments. This test helps to mitigate over-rejection issues that arise from serial correlation [80]. By advancing the treatment timeline by one year and aligning it one year prior to the PARP’s implementation, we assessed the robustness of our findings. Additionally, we extended the regression model to include the scenario of relocating one year sooner. The variable ‘Pre_relocated’ serves as a binary indicator, representing relocation one year before poverty alleviation. For example, if households relocate in 2017, the variable equals 1 in 2016 and subsequent years, and 0 in years prior to 2016. The results summarized in Table 3 show that the coefficient of ‘pre_relocated’ is not significant, indicating the absence of anticipated effects. Even after incorporating lagged variables, the PARP coefficients remain significant, indicating the baseline regression results’ robustness. Furthermore, we conducted a placebo test for treatment grouping by constructing virtual grouping variables [78]. The test details are presented in Appendix A Figure A1.
Second, to minimize differences in observable characteristics between the two groups, we employed propensity score matching (PSM) and difference-in-differences (DID) estimation based on matched samples to mitigate self-selection issues. Initially, the probit model estimated the propensity score, and a one-to-one nearest neighbor matching method matched the treatment and control groups. Samples not meeting the ‘common support hypothesis’ were removed, and a baseline regression was conducted on the matched samples (the propensity score matching method only removed 42 out of 2394 observations, retaining 98.25% of the total sample. this retention rate suggests that the causal effect of the total sample regression exhibits strong statistical significance). The estimated results in columns (1) and (2) of Table 4 are consistent with previous findings. Additionally, for robustness testing, we substituted the model with a hybrid Ordinary Least Squares (OLSs) model. The results in Columns (3) and (4) of Table 4 indicate a significantly positive estimated coefficient for relocation, further supporting our findings.
Third, this study utilized balanced panel data from two waves in 2015 and 2016 while maintaining the use of the asymptotic difference-in-differences (DID) method to estimate causal regression. The estimation outcomes are presented in columns (5) and (6) of Table 4, demonstrating a consistent linear relationship between the coefficient for relocation and earlier studies. Significantly, the coefficient exhibits a higher level of statistical significance in this study, thereby reinforcing the reliability of the previously stated empirical analysis findings.
Finally, to address the potential bias stemming from time-variant unobservables, we applied the method proposed by Oster [81], building on the framework established by Altonji et al. [82]. In column 1 of Appendix A Table A3, we provide the selection ratio, which exceeds 1, indicating that the selection on unobservables would need to be nearly four times stronger than the selection on observables to nullify the treatment effect. However, given that we control for a comprehensive set of covariates, this scenario is implausible. Additionally, the estimated treatment bound in column 2 confirms that the selection on unobservables is unlikely to drive our baseline results. Therefore, bias arising from time-varying unobservables is not a major endogeneity concern in our study.
4.4. Mechanism Analysis
The previous section indicates that the PARP has a causal effect on boosting households’ education investment. In this section, we delve deeper into the underlying mechanisms through which relocation may alter family education investment. The theoretical analysis identifies the “income effect” resulting from higher household incomes and the “complementary effect” resulting from lower family medical expenditure as two micro-mechanisms that influence education investment for relocated households. Building on the existing literature and in line with current practices, the test for these mechanisms continues to use the progressive dual differentiation model from the benchmark model (1). However, the dependent variable is substituted with the proxy variable necessary for verifying the mechanism.
4.4.1. Income Effect
Theoretical analysis suggests that Poverty Alleviation Relocation Policies can increase household incomes, thereby alleviating household budget constraints and potentially influencing household education investment. In this study, we use the per capita net income to measure household income, replacing the interpreted variable in model (1) with ‘net income per household’ to assess the mechanisms through which poverty relocation affects household education investment. Table 5 presents the results, indicating that regardless of whether the control variable is included, the PARP has a positive impact on per-family net income that is significant at a statistical level of 1%. This demonstrates that relocation increases the income level of relocated households, generating an income effect that contributes to increased investment in family education.
4.4.2. Complementary Effect
The second possible mechanism explored in this study is the ‘complementary effect’ between household health expenditure and education investment, wherein poverty relocation policies facilitate increased household education investment by reducing household health expenditure and enhancing health human capital. We utilize the ‘family self-paying medical expenditures’ from the questionnaire to measure household medical expenses, which are then processed numerically to reflect the impact of poverty alleviation relocation on family health expenses. The estimated results are presented in Table 6. The negative coefficient associated with relocation indicates a significant decrease in household health expenditure after relocation compared to non-relocated households. This reduction in the burden of family health care expenses serves as an important mechanism for facilitating poverty alleviation and relocation policies, ultimately leading to increased investment in family education.
4.5. Heterogeneity in Effects
In this section, we explore several potential sources of heterogeneity in the relocation effects on average education investment per-student within household. Specifically, we first examine the heterogeneous effects of relocation attributes. We then investigate whether the impact of relocation varies by household head characteristics.
4.5.1. Heterogeneous Analysis by Relocation Characteristics
During the relocation and resettlement process, eligible households can participate in different relocation types (i.e., urban or rural, whole village or dispersed). Table 7 presents the treatment effect of the Poverty Alleviation Relocation Program (PARP) on per-student education investment based on different subsamples categorized by relocation method, resettlement model, and resettlement location. Our findings reveal significant variations in the treatment effects based on these categorizations. We observe that households subjected to the dispersed relocation method experience the highest treatment effect, indicating a more pronounced impact on per-student education investment compared to other methods. Moreover, we find that the scattered resettlement model exhibits the strongest treatment effect among the resettlement models analyzed. Furthermore, our analysis reveals differences in treatment effects across resettlement locations, with towns showing the highest impact followed by counties and villages. These findings underscore the importance of considering heterogeneity in the analysis of poverty alleviation relocation programs to better understand their effectiveness in promoting households’ education investment within family.
4.5.2. Heterogeneous Analysis by Relocation Durations
For relocated households, the duration since relocation varies from 2016 to 2018. Table 8 illustrates the diverse effects of relocation durations, with non-relocated households serving as the reference group. The estimated coefficients of Duration_1, Duration_2, and Duration_3 are notably positive, suggesting that the impact of relocation on per-student education investment persists even after 2 years. However, the significance of Duration_1 is only significant at a 10% level, suggesting that relocation may not have an immediate effect on per-student education investment within relocated households.
4.5.3. Heterogeneous Analysis by Household Characteristics
The variation in cultural and healthy human capital among rural households may result in differing effects of the PARP on education investment [83]. We examine the diverse effects of the PARP on education investment across households with varying characteristics, such as the education levels and health statuses of household heads. Specifically, we use a 6-year education threshold for household heads to explore heterogeneous impacts. Household heads’ health conditions are classified as healthy or unhealthy. Table 9 presents the results, indicating that the PARP has a stronger effect on education investment for relocated households with heads educated for over 6 years, suggesting a greater influence on families with higher cultural capital. The regression analysis on sub-sample data of head-of-household health conditions reveals that the PARP significantly boosts education investment in relocated households with healthy heads, with a statistically significant impact at a 5% level. However, the impact on education investment in relocated households with unhealthy heads is not statistically significant. This implies that poverty reduction programs through relocation are more effective in enhancing education investment for households with higher levels of healthy human capital.
5. Discussion and Policy Recommendations
The accumulation of human capital, which is crucial for high-quality rural development, relies on sufficient educational investments. Family education investment stands out as a significant factor shaping human capital development. This paper offers empirical evidence that the PARP significantly influences per-student education investment within households, aligning with prior studies in developed settings [50,51]. Using data from three waves of surveys of China’s Poverty Alleviation Relocation Program aimed at relocating poor rural households to more favorable locations, we identify the causal effect of relocation on family education investment within households by exploiting timing and implementation variations. Our DID results reveal a significant positive effect of relocation on the per-student education investment of relocated households, which is consistent with previous research in rural China that either utilized qualitative research methods or focused on only one specific region of China [38,55]. Robustness checks, including placebo testing, alternative models, and adjustments to the treatment time window, also support these findings. Our heterogeneity analysis indicates that the impact of whole-village relocation on household education investment is greater than that of dispersed relocation. Within dispersed resettlement, the impact is larger than in centralized resettlement, and in town resettlement, it surpasses both county and village resettlement. The effect of the PARP on education investment persists even after 2 years. Additionally, there is a significant impact on households with higher cultural capital and health human capital.
The effectiveness of policies incentivizing households to relocate to areas with better opportunities in the developed world has been studied for decades. However, less research has been conducted on the effects of various relocation programs in developing countries. By examining an unprecedented poverty alleviation relocation program in rural China, this study provides insightful evidence of the positive impact of relocation programs on household education investment, particularly in terms of per-student education investment within households. Furthermore, this study contributes to the literature evaluating China’s poverty alleviation programs and offers guidance for promoting the accumulation of human capital among rural children in China from the perspective of geographical migration. Finally, our study supports policies that emphasize sustainable income increase and reduction in household medical expenses for rural and poor populations.
6. Limitations and Future Directions
We acknowledge several limitations in our study. Firstly, despite employing a staggered DID model and conducting robustness tests, the selection of relocated households was based on voluntary participation rather than random selection, potentially leading to self-selection bias. This limitation is common in many previous studies. Secondly, due to data constraints, we used the average education investment per student in the household as the dependent variable. However, this prevented us from directly assessing education investment for each individual student, hindering a direct evaluation of the PARP’s impact on children’s education investment in rural households. Thirdly, the implementation period of the PARP for China’s “13th Five-Year Plan” was from 2016 to 2020, while the baseline data we collected were from 2015. If we could collect more recent data on the issue, it would enhance this study’s relevance. Fourthly, our study only focused on the short-term impact of the PARP on children’s education investment in rural households and did not explore its long-term effects, making direct comparisons with international research findings challenging.
This study’s limitations suggest several avenues for further research. Firstly, to mitigate self-selection bias, alternative methodologies like randomized controlled trials (RCTs) could be employed to evaluate the Poverty Alleviation Relocation Program (PARP). Secondly, future studies should aim to collect data on the education investment of each individual student within rural households and analyze how the PARP impacts the allocation of educational investment among students, taking into account variables such as gender and the number of siblings. Thirdly, expanding our research on this issue by obtaining the latest data from surveys conducted on poverty alleviation relocation projects would be beneficial. Finally, investigating the long-term effects of the PARP on education investment and child development using large-scale longitudinal data would be valuable, allowing for comparisons with research conducted in developed countries.
Author Contributions
Conceptualization, S.W. and L.Z.; methodology, S.W. and L.Z.; formal analysis, S.W. and L.Z.; investigation, L.Z. and S.W.; resources, S.W.; data curation, L.Z.; writing—original draft preparation, L.Z.; writing—review and editing, S.W. and L.Z.; visualization, S.W. and L.Z.; supervision, S.W.; project administration, S.W.; funding acquisition, S.W. All authors have read and agreed to the published version of the manuscript.
Funding
This research was supported by the Science Research Fund Project of Renmin University of China (Grant number 22XNLG07).
Institutional Review Board Statement
This study did not require ethical approval as no sensitive personal data was analyzed. Procedures were followed to ensure that GDPR was complied with for the collection and analysis of information from persons.
Informed Consent Statement
Informed consent was obtained from all subjects involved in the study.
Data Availability Statement
The datasets used and/or analyzed during the current study are available from the corresponding author upon reasonable request.
Acknowledgments
Many people assisted to make this project and paper possible. In particular, we would like to acknowledge Huanguang Qiu for his work on methodological guidance.
Conflicts of Interest
The authors declare no conflict of interest.
Appendix A. Premutation Test by Randomly Assigning Treatment Groups
During the placebo test, we employed a method of simultaneous randomization of policy timing and treatment group samples. Specifically, we randomly selected the same number of households from all samples as in the original treatment group. We also randomly determined the timing of policy implementation to construct a new treatment group with random policy timing and treatment group. According to Figure 2, we found that during the period from 2016 to 2018, 94, 248, and 220 sample households, respectively underwent Poverty Alleviation Relocation and entered the treatment group. Therefore, based on the data, we generated virtual sample households undergoing poverty alleviation relocation. Subsequently, we re-estimated the baseline regression model and conducted 500 repetitions of random experiments.
The procedure involved constructing a matrix for 500 random samplings. While controlling for household characteristics of the treatment and control groups, provincial-level public education expenditure characteristics, individual and time fixed effects, the “fictional” samples were plugged into Equation (1) for 500 repetitions of DID estimation. Subsequently, the results of the 500 regression estimations were plotted as scatter plots and kernel density estimation curves to validate whether the policy effect of poverty alleviation relocation on education investment in relocated households was influenced by other policy contaminations or incidental, random factors.
The results of the placebo test are shown in Figure A1. Firstly, to ascertain the effectiveness of the placebo test, two conditions need to be met: (1) the majority of the kernel density curve lies above the dashed line at a p-value of 0.1; (2) the coefficients of the DID estimations after 500 regressions are randomly distributed around 0, with the randomized coefficients generally smaller than the estimated values obtained using real data. From the figure, it can be observed that the placebo test in this section is effective.
Figure A1.
Distribution of estimated coefficients of the permutation test.


Table A1.
Items of Fixed Assets.
| Items | Number | Assessed Value |
|---|---|---|
| Durable Goods | ||
| TV | ||
| Refrigerator | ||
| Washing Machine | ||
| Water Heater | ||
| Computer | ||
| Phone | ||
| Motorcycle | ||
| Car | ||
| … | ||
| Productive Fixed Assets | ||
| Tractor | ||
| Production vehicle | ||
| Three-wheeled Production Vehicle | ||
| Agricultural Machinery | ||
| Electric motor | ||
| … |
Table A2.
Descriptive Statistics of Household Educational Investment at the County Level.
| County ID | Ln(Per-Student Education Investment) | |
|---|---|---|
| Mean | SD | |
| 4201 | 4.650 | 3.435 |
| 4202 | 4.245 | 3.243 |
| 4301 | 5.909 | 2.789 |
| 4302 | 5.274 | 3.029 |
| 4501 | 3.417 | 3.655 |
| 4502 | 3.936 | 3.582 |
| 5101 | 5.229 | 2.950 |
| 5102 | 4.849 | 2.581 |
| 5201 | 3.365 | 3.500 |
| 5202 | 4.433 | 3.716 |
| 5301 | 3.145 | 2.810 |
| 5302 | 3.045 | 3.299 |
| 6101 | 4.217 | 2.789 |
| 6102 | 4.212 | 2.831 |
| 6201 | 5.727 | 2.962 |
| 6202 | 4.929 | 3.135 |
Table A3.
Oster Test: Robustness to time-variant unobservables.
| Parameter Assumptions | ||
|---|---|---|
| (1) | (2) | |
| Estimation | δ | “True” β bound |
| 3.922 | [0.681, 0.738] |
Notes: Columns 1 and 2 report the estimated selection ratio and the treatment bound, respectively. The Rmax, with unobservables and observables included, is assumed to be 1.3 times the of the regression with a full set of controls, as suggested by Oster (2019) [81].
References
- Blundell, R.; Dearden, L.; Meghir, C.; Sianesi, B. Human capital investment: The returns from education and training to the individual, the firm and the economy. Fisc. Stud. 1999, 20, 1–23. [Google Scholar] [CrossRef]
- Becker, G.S. Human Capital: A Theoretical and Empirical Analysis, with Special Reference to Education; University of Chicago Press: Chicago, IL, USA, 2009. [Google Scholar]
- Koerselman, K.; Uusitalo, R. The risk and return of human capital investments. Labour Econ. 2014, 30, 154–163. [Google Scholar] [CrossRef]
- Lanzi, D. Capabilities, human capital and education. J. Socio-Econ. 2007, 36, 424–435. [Google Scholar] [CrossRef]
- Ali, M.; Egbetokun, A.; Memon, M.H. Human capital, social capabilities and economic growth. Economies 2018, 6, 2. [Google Scholar] [CrossRef]
- Jamison, E.A.; Jamison, D.T.; Hanushek, E.A. The effects of education quality on income growth and mortality decline. Econ. Educ. Rev. 2007, 26, 771–788. [Google Scholar] [CrossRef]
- Yang, J.; Qiu, M. The impact of education on income inequality and intergenerational mobility. China Econ. Rev. 2016, 37, 110–125. [Google Scholar] [CrossRef]
- Moulton, J. Improving Education in Rural Areas: Guidance for Rural Development Specialists; The World Bank: Washington, DC, USA, 2001. [Google Scholar]
- Wu, F.; Zhang, D.; Zhang, J. Unequal education, poverty and low growth—A theoretical framework for rural education of China. Econ. Educ. Rev. 2008, 27, 308–318. [Google Scholar] [CrossRef]
- Li, Z.; Qiu, Z. How does family background affect children’s educational achievement? Evidence from Contemporary China. J. Chin. Sociol. 2018, 5, 13. [Google Scholar] [CrossRef]
- Cheadle, J.E. Parent educational investment and children’s general knowledge development. Soc. Sci. Res. 2009, 38, 477–491. [Google Scholar] [CrossRef]
- Gross, S. Early mathematics performance and achievement: Results of a study within a large suburban school system. J. Negro Educ. 1993, 62, 269–287. [Google Scholar] [CrossRef]
- Holmlund, H.; Lindahl, M.; Plug, E. The causal effect of parents’ schooling on children’s schooling: A comparison of estimation methods. J. Econ. Lit. 2011, 49, 615–651. [Google Scholar] [CrossRef]
- Qin, X.; Wang, T.; Zhuang, C.C. Intergenerational transfer of human capital and its impact on income mobility: Evidence from China. China Econ. Rev. 2016, 38, 306–321. [Google Scholar] [CrossRef]
- Wang, D.; Fang, J.; Zhang, Q. Design, measurement, and characteristic analysis of uncertainty indices for education fiscal policies: A case study of China. Asia Pac. Educ. Rev. 2021, 22, 483–493. [Google Scholar] [CrossRef]
- Zhang, G.; Li, J. Comparative Analysis of Educational Investment Capacity in Urban and Rural Households in China. J. Agrotech. Econ. 2011, 91–101. [Google Scholar] [CrossRef]
- Liu, A.; Li, W.; Xie, Y. Changes in family investment in children’s out-of-school education in China, 2010–2018. Chin. Sociol. Rev. 2024, 1–25. [Google Scholar] [CrossRef]
- Huang, B.; Xu, C.; Wang, D.; Hu, X. Compulsory education finance in China. China Rev. 2021, 21, 259–290. [Google Scholar]
- Yi, W. In-school or out-of-school: Household spending on children’s basic education in China. J. East China Norm. Univ. 2020, 38, 103. [Google Scholar]
- Yeung, W.J.; Linver, M.R.; Brooks-Gunn, J. How money matters for young children’s development: Parental investment and family processes. Child Dev. 2002, 73, 1861–1879. [Google Scholar] [CrossRef]
- Naoi, M.; Akabayashi, H.; Nakamura, R.; Nozaki, K.; Sano, S.; Senoh, W.; Shikishima, C. Causal effects of family income on educational investment and child outcomes: Evidence from a policy reform in Japan. J. Jpn. Int. Econ. 2021, 60, 101122. [Google Scholar] [CrossRef]
- Kremer-Sadlik, T.; Fatigante, M. Investing in children’s future: Cross-cultural perspectives and ideologies on parental involvement in education. Childhood 2015, 22, 67–84. [Google Scholar] [CrossRef]
- Dizon-Ross, R. Parents’ beliefs about their children’s academic ability: Implications for educational investments. Am. Econ. Rev. 2019, 109, 2728–2765. [Google Scholar] [CrossRef]
- La Ferrara, E.; Milazzo, A. Customary norms, inheritance, and human capital: Evidence from a reform of the matrilineal system in Ghana. Am. Econ. J. Appl. Econ. 2017, 9, 166–185. [Google Scholar] [CrossRef]
- Edmonds, E.V.; Pavcnik, N.; Topalova, P. Trade adjustment and human capital investments: Evidence from Indian tariff reform. Am. Econ. J. Appl. Econ. 2010, 2, 42–75. [Google Scholar] [CrossRef]
- Albertus, M.; Espinoza, M.; Fort, R. Land reform and human capital development: Evidence from Peru. J. Dev. Econ. 2020, 147, 102540. [Google Scholar] [CrossRef]
- Ye, J.; Cai, L.; Shi, X.; Cheng, M. Pursuing a brighter future: Impact of the Hukou reform on human capital investment in migrant children in China. China Econ. Rev. 2024, 85, 102160. [Google Scholar] [CrossRef]
- Ren, W.; Liang, R. Rural Tax and Fee Burden and Human Capital Accumulation—An Empirical Study Based on the Rural Tax and Fee Reform. Public Financ. Res. 2022. [Google Scholar] [CrossRef]
- Dong, S.; Zhang, Z.; Han, Y.; Si, Y. Do pension subsidies reduce household education expenditure inequality? Evidence from China. Int. Rev. Econ. Financ. 2023, 87, 532–540. [Google Scholar] [CrossRef]
- Zheng, X.; Shangguan, S.; Shen, Z.; Yang, H. Social pensions and Children’s educational outcomes: The case of new rural pension scheme in China. J. Fam. Econ. Issues 2023, 44, 502–521. [Google Scholar] [CrossRef]
- Caucutt, E.M.; Lochner, L. Early and late human capital investments, borrowing constraints, and the family. J. Political Econ. 2020, 128, 1065–1147. [Google Scholar] [CrossRef]
- Lugo, M.A.; Raiser, M.; Yemtsov, R. Whats Next for Poverty Reduction Policies in China? 2021. Available online: https://policycommons.net/artifacts/4142945/whats-next-for-poverty-reduction-policies-in-china/4951462/ (accessed on 6 April 2024).
- Liu, A.; Shang, C.; Li, Y. Research on The Impact of Targeted Poverty Alleviation Policies on Rural Family Education Investment. Econ. Theory Bus. Manag. 2023, 43, 99–112. [Google Scholar]
- Wang, S.; Zhou, Y. Industrial Poverty Alleviation, Income Growth and Family Education Expenditure: Quasi-experimental Research Based on Industrial Poverty Alleviation Demonstration Pilot Project. J. Agrotech. Econ. 2023, 4–19. [Google Scholar] [CrossRef]
- You, J.; Wang, S.; Sun, K. Unpacking the Causes and Mechanisms of Impact of Microfinance on Education. J. Agrotech. Econ. 2020, 4–22. [Google Scholar] [CrossRef]
- Qiu, H.; Hong, J.; Wang, X.; Filipski, M. Home sweet home: Impacts of living conditions on worker migration with evidence from randomized resettlement in China. J. Econ. Behav. Organ. 2024, 220, 558–583. [Google Scholar] [CrossRef]
- Liu, M.; Feng, X.; Zhao, Y.; Qiu, H. Impact of poverty alleviation through relocation: From the perspectives of income and multidimensional poverty. J. Rural. Stud. 2023, 99, 35–44. [Google Scholar] [CrossRef]
- Liu, W.; Xu, J.; Li, J. The influence of poverty alleviation resettlement on rural household livelihood vulnerability in the western mountainous areas, China. Sustainability 2018, 10, 2793. [Google Scholar] [CrossRef]
- Zhu, Y.; Guan, R.; Yu, J. How does poverty alleviation relocation affect the non-agricultural employment of women’s labor forces? Evidence from southern Shaanxi Province. Land 2022, 12, 84. [Google Scholar] [CrossRef]
- Leng, G.-X.; Feng, X.-L.; Qiu, H.-G. Income effects of poverty alleviation relocation program on rural farmers in China. J. Integr. Agric. 2021, 20, 891–904. [Google Scholar] [CrossRef]
- Ding, Y.; Wang, X.; de Brauw, A.; Qiu, H. Catch up with my husband as I can: Women’s decision-making power consequences of China’s poverty alleviation relocation program. World Dev. 2024, 173, 106433. [Google Scholar] [CrossRef]
- Hu, W.; Xie, Y.; Yan, S.; Zhou, X.; Li, C. The reshaping of neighboring social networks after poverty alleviation relocation in rural china: A two-year observation. Sustainability 2022, 14, 4607. [Google Scholar] [CrossRef]
- Li, C.; Wang, L.; Feldman, M.W.; Li, S. Poverty and income inequality effects of the relocation program in Shaanxi, China. Asian-Pac. Econ. Lit. 2021, 35, 41–59. [Google Scholar] [CrossRef]
- Bazzi, S.; Gaduh, A.; Rothenberg, A.D.; Wong, M. Skill transferability, migration, and development: Evidence from population resettlement in Indonesia. Am. Econ. Rev. 2016, 106, 2658–2698. [Google Scholar] [CrossRef]
- Nakamura, E.; Sigurdsson, J.; Steinsson, J. The gift of moving: Intergenerational consequences of a mobility shock. Rev. Econ. Stud. 2022, 89, 1557–1592. [Google Scholar] [CrossRef]
- Popkin, S.J.; Rosenbaum, J.E.; Meaden, P.M. Labor market experiences of low-income black women in middle-class suburbs: Evidence from a survey of gautreaux program participants. J. Policy Anal. Manag. 1993, 12, 556–573. [Google Scholar] [CrossRef]
- Kling, J.R.; Liebman, J.B.; Katz, L.F. Experimental analysis of neighborhood effects. Econometrica 2007, 75, 83–119. [Google Scholar] [CrossRef]
- Kling, J.R.; Liebman, J.B.; Katz, L.F.; Sanbonmatsu, L. Moving to Opportunity and Tranquility: Neighborhood Effects on Adult Economic Self-Sufficiency and Health from a Randomized Housing Voucher Experiment. Available at SSRN 588942. 2004. Available online: https://papers.ssrn.com/sol3/papers.cfm?abstract_id=588942 (accessed on 6 April 2024).
- Johnson, O., Jr. A systematic review of neighborhood and institutional relationships related to education. Educ. Urban Soc. 2012, 44, 477–511. [Google Scholar] [CrossRef]
- Chyn, E. Moved to opportunity: The long-run effects of public housing demolition on children. Am. Econ. Rev. 2018, 108, 3028–3056. [Google Scholar] [CrossRef] [PubMed]
- Chetty, R.; Hendren, N.; Katz, L.F. The effects of exposure to better neighborhoods on children: New evidence from the moving to opportunity experiment. Am. Econ. Rev. 2016, 106, 855–902. [Google Scholar] [CrossRef]
- Klein, A. Did children’s education matter? Family migration as a mechanism of human capital investment: Evidence from nineteenth-century Bohemia. Econ. Hist. Rev. 2011, 64, 730–764. [Google Scholar] [CrossRef]
- Taylor, N.; Freeman, M. International research evidence on relocation: Past, present, and future. Fam. LQ 2010, 44, 317. [Google Scholar]
- Dimick, J.B.; Ryan, A.M. Methods for evaluating changes in health care policy: The difference-in-differences approach. JAMA 2014, 312, 2401–2402. [Google Scholar] [CrossRef]
- Sun, Y.; Ren, S. Social Integration and Educational Support of Relocated Children. Contemp. Youth Res. 2021, 71–76. [Google Scholar]
- Yang, Y.; Liu, Y. The code of targeted poverty alleviation in China: A geography perspective. Geogr. Sustain. 2021, 2, 243–253. [Google Scholar] [CrossRef]
- Yang, Y.; de Sherbinin, A.; Liu, Y. China’s poverty alleviation resettlement: Progress, problems and solutions. Habitat Int. 2020, 98, 102135. [Google Scholar] [CrossRef]
- Rogers, S.; Li, J.; Lo, K.; Guo, H.; Li, C. China’s rapidly evolving practice of poverty resettlement: Moving millions to eliminate poverty. Dev. Policy Rev. 2020, 38, 541–554. [Google Scholar] [CrossRef]
- Cheng, L. China’s Poverty Alleviation Resettlement: A Review of Policy and Progress. In China’s Poverty Alleviation Resettlement and Rural Transformation; Springer: Singapore, 2023; pp. 43–57. [Google Scholar]
- Lochner, L.J.; Monge-Naranjo, A. The nature of credit constraints and human capital. Am. Econ. Rev. 2011, 101, 2487–2529. [Google Scholar] [CrossRef]
- Démurger, S.; Wang, X. Remittances and expenditure patterns of the left behinds in rural China. China Econ. Rev. 2016, 37, 177–190. [Google Scholar] [CrossRef]
- Xu, Y.; Shi, G.; Dong, Y. Effects of the post-relocation support policy on livelihood capital of the reservoir resettlers and its implications—A study in Wujiang sub-stream of Yangtze river of China. Sustainability 2022, 14, 2488. [Google Scholar] [CrossRef]
- Li, R.; Zhang, Z. Health risks and health poverty alleviation practices in China: Review and prospects. Environ. Public Health Res. 2023, 1, 155. [Google Scholar]
- Lo, K.; Xue, L.; Wang, M. Spatial restructuring through poverty alleviation resettlement in rural China. J. Rural. Stud. 2016, 47, 496–505. [Google Scholar] [CrossRef]
- Dai, X.; Wang, L.; Ren, Y. The effects of China’s targeted poverty alleviation policy on the health and health equity of rural poor residents: Evidence from Shaanxi Province. Healthcare 2020, 8, 256. [Google Scholar] [CrossRef]
- Lu, J.; Zhang, M.; Zhang, J.; Xu, C.; Cheng, B. Can health poverty alleviation project reduce the economic vulnerability of poor households? Evidence from Chifeng City, China. Comput. Ind. Eng. 2021, 162, 107762. [Google Scholar] [CrossRef]
- Zhu, Y.; Shibasaki, S.; Guan, R.; Yu, J. Poverty alleviation relocation, fuelwood consumption and gender differences in human capital improvement. Int. J. Environ. Res. Public Health 2023, 20, 1637. [Google Scholar] [CrossRef] [PubMed]
- Conley, D.; Glauber, R. Parental educational investment and children’s academic risk: Estimates of the impact of sibship size and birth order from exogenous variation in fertility. J. Hum. Resour. 2006, 41, 722–737. [Google Scholar] [CrossRef]
- Sun, X.; Huang, A. Analysis of Chinese Family Education Investment and Its Demographic Variables. Open J. Soc. Sci. 2019, 7, 15. [Google Scholar] [CrossRef]
- Liu, Z. The economic impact and determinants of investment in human and political capital in China. Econ. Dev. Cult. Chang. 2003, 51, 823–849. [Google Scholar] [CrossRef]
- Xiao, H.; Zheng, X.; Xie, L. Promoting pro-poor growth through infrastructure investment: Evidence from the Targeted Poverty Alleviation program in China. China Econ. Rev. 2022, 71, 101729. [Google Scholar] [CrossRef]
- Yuan, C.; Zhang, L. Public education spending and private substitution in urban China. J. Dev. Econ. 2015, 115, 124–139. [Google Scholar] [CrossRef]
- Zhang, L.; Xie, L.; Zheng, X. Across a few prohibitive miles: The impact of the Anti-Poverty Relocation Program in China. J. Dev. Econ. 2023, 160, 102945. [Google Scholar] [CrossRef]
- Imai, K.; Kim, I.S. On the use of two-way fixed effects regression models for causal inference with panel data. Political Anal. 2021, 29, 405–415. [Google Scholar] [CrossRef]
- Athey, S.; Imbens, G.W. Design-based analysis in difference-in-differences settings with staggered adoption. J. Econom. 2022, 226, 62–79. [Google Scholar] [CrossRef]
- Beck, T.; Levine, R.; Levkov, A. Big bad banks? The winners and losers from bank deregulation in the United States. J. Financ. 2010, 65, 1637–1667. [Google Scholar] [CrossRef]
- Roth, J. Pretest with caution: Event-study estimates after testing for parallel trends. Am. Econ. Rev. Insights 2022, 4, 305–322. [Google Scholar] [CrossRef]
- Li, P.; Lu, Y.; Wang, J. Does flattening government improve economic performance? Evidence from China. J. Dev. Econ. 2016, 123, 18–37. [Google Scholar] [CrossRef]
- Mu, R.; Du, Y. Pension coverage for parents and educational investment in children: Evidence from urban China. World Bank Econ. Rev. 2017, 31, 483–503. [Google Scholar]
- Zhou, Y.; Huang, X.; Shen, Y.; Tian, L. Does targeted poverty alleviation policy lead to happy life? Evidence from rural China. China Econ. Rev. 2023, 81, 102037. [Google Scholar] [CrossRef]
- Oster, E. Unobservable selection and coefficient stability: Theory and evidence. J. Bus. Econ. Stat. 2019, 37, 187–204. [Google Scholar] [CrossRef]
- Altonji, J.G.; Elder, T.E.; Taber, C.R. Selection on observed and unobserved variables: Assessing the effectiveness of Catholic schools. J. Political Econ. 2005, 113, 151–184. [Google Scholar] [CrossRef]
- Hong, J.; Liu, M.; Qiu, H.; Feng, X. Can a poverty alleviation programme really help vulnerable rural households? Insights from China. Appl. Econ. 2023, 1–14. [Google Scholar] [CrossRef]
Figure 1.
Mechanisms of the PARP affecting education investment of households.
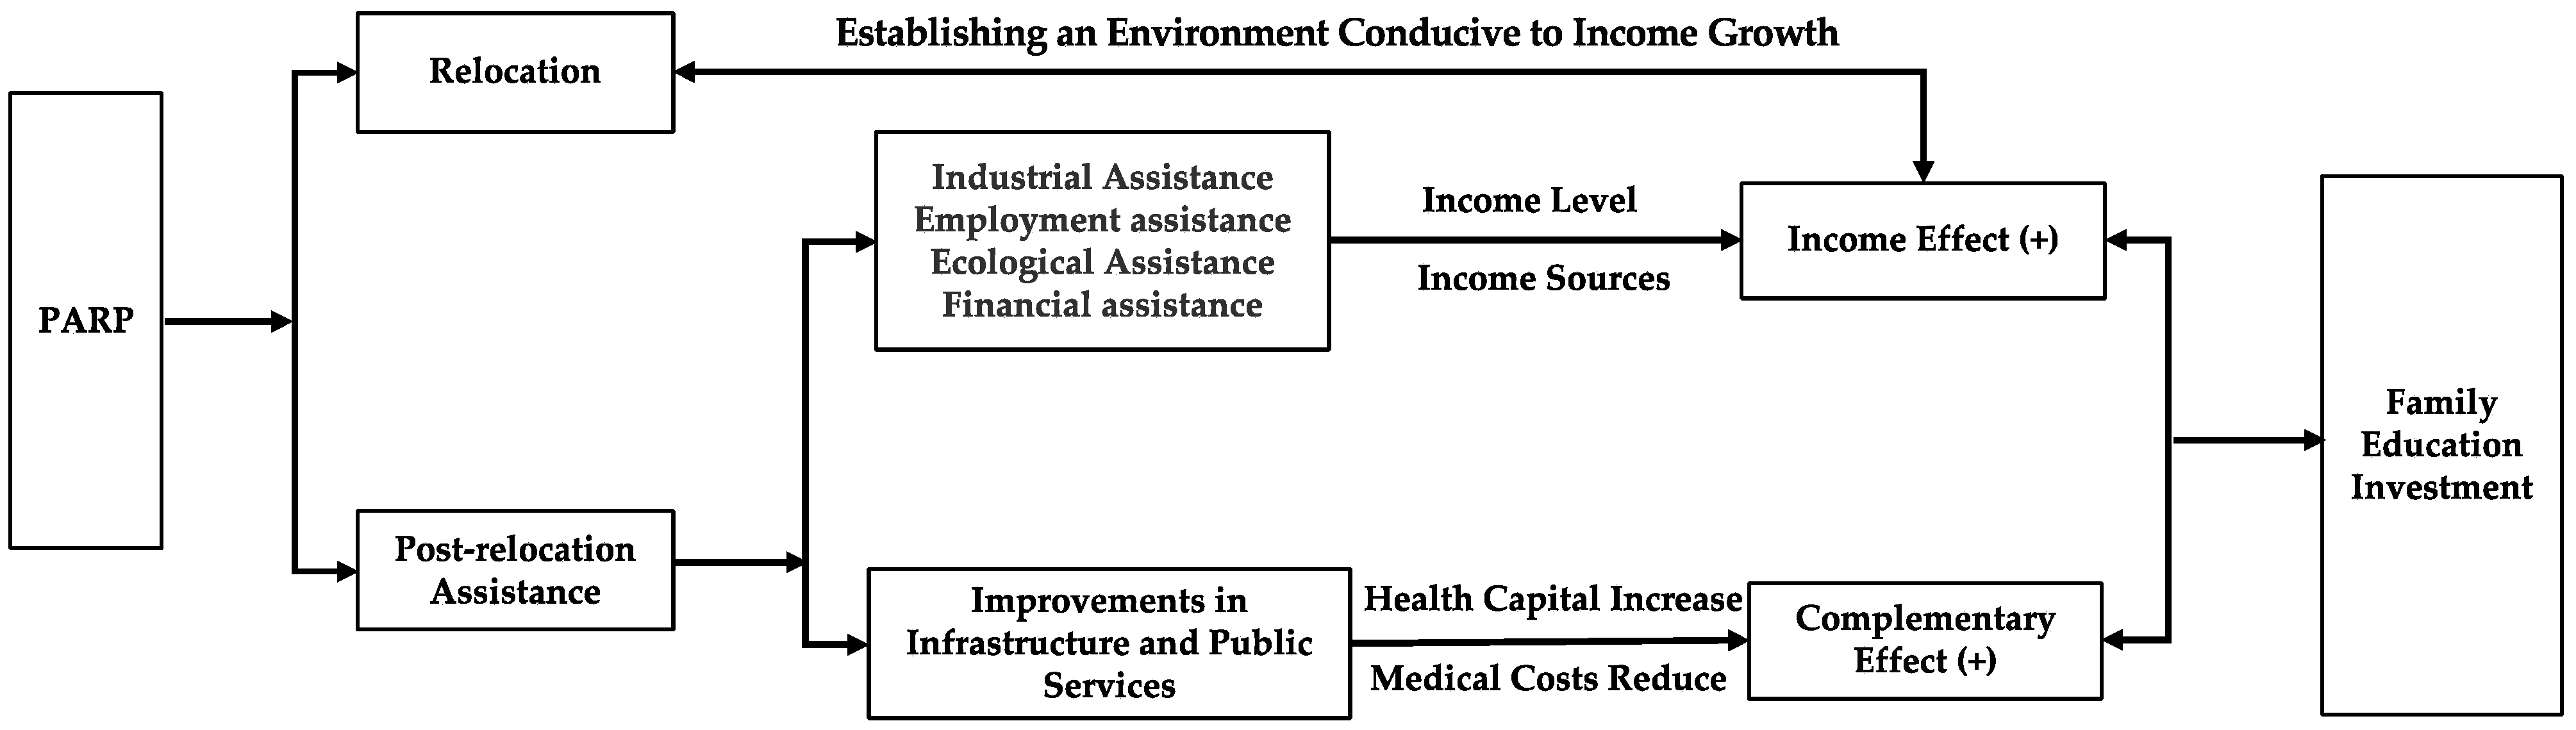
Figure 2.
The relocation process of the PARP households.

Figure 3.
Treatment effect on average education investment per-student before and after relocation.
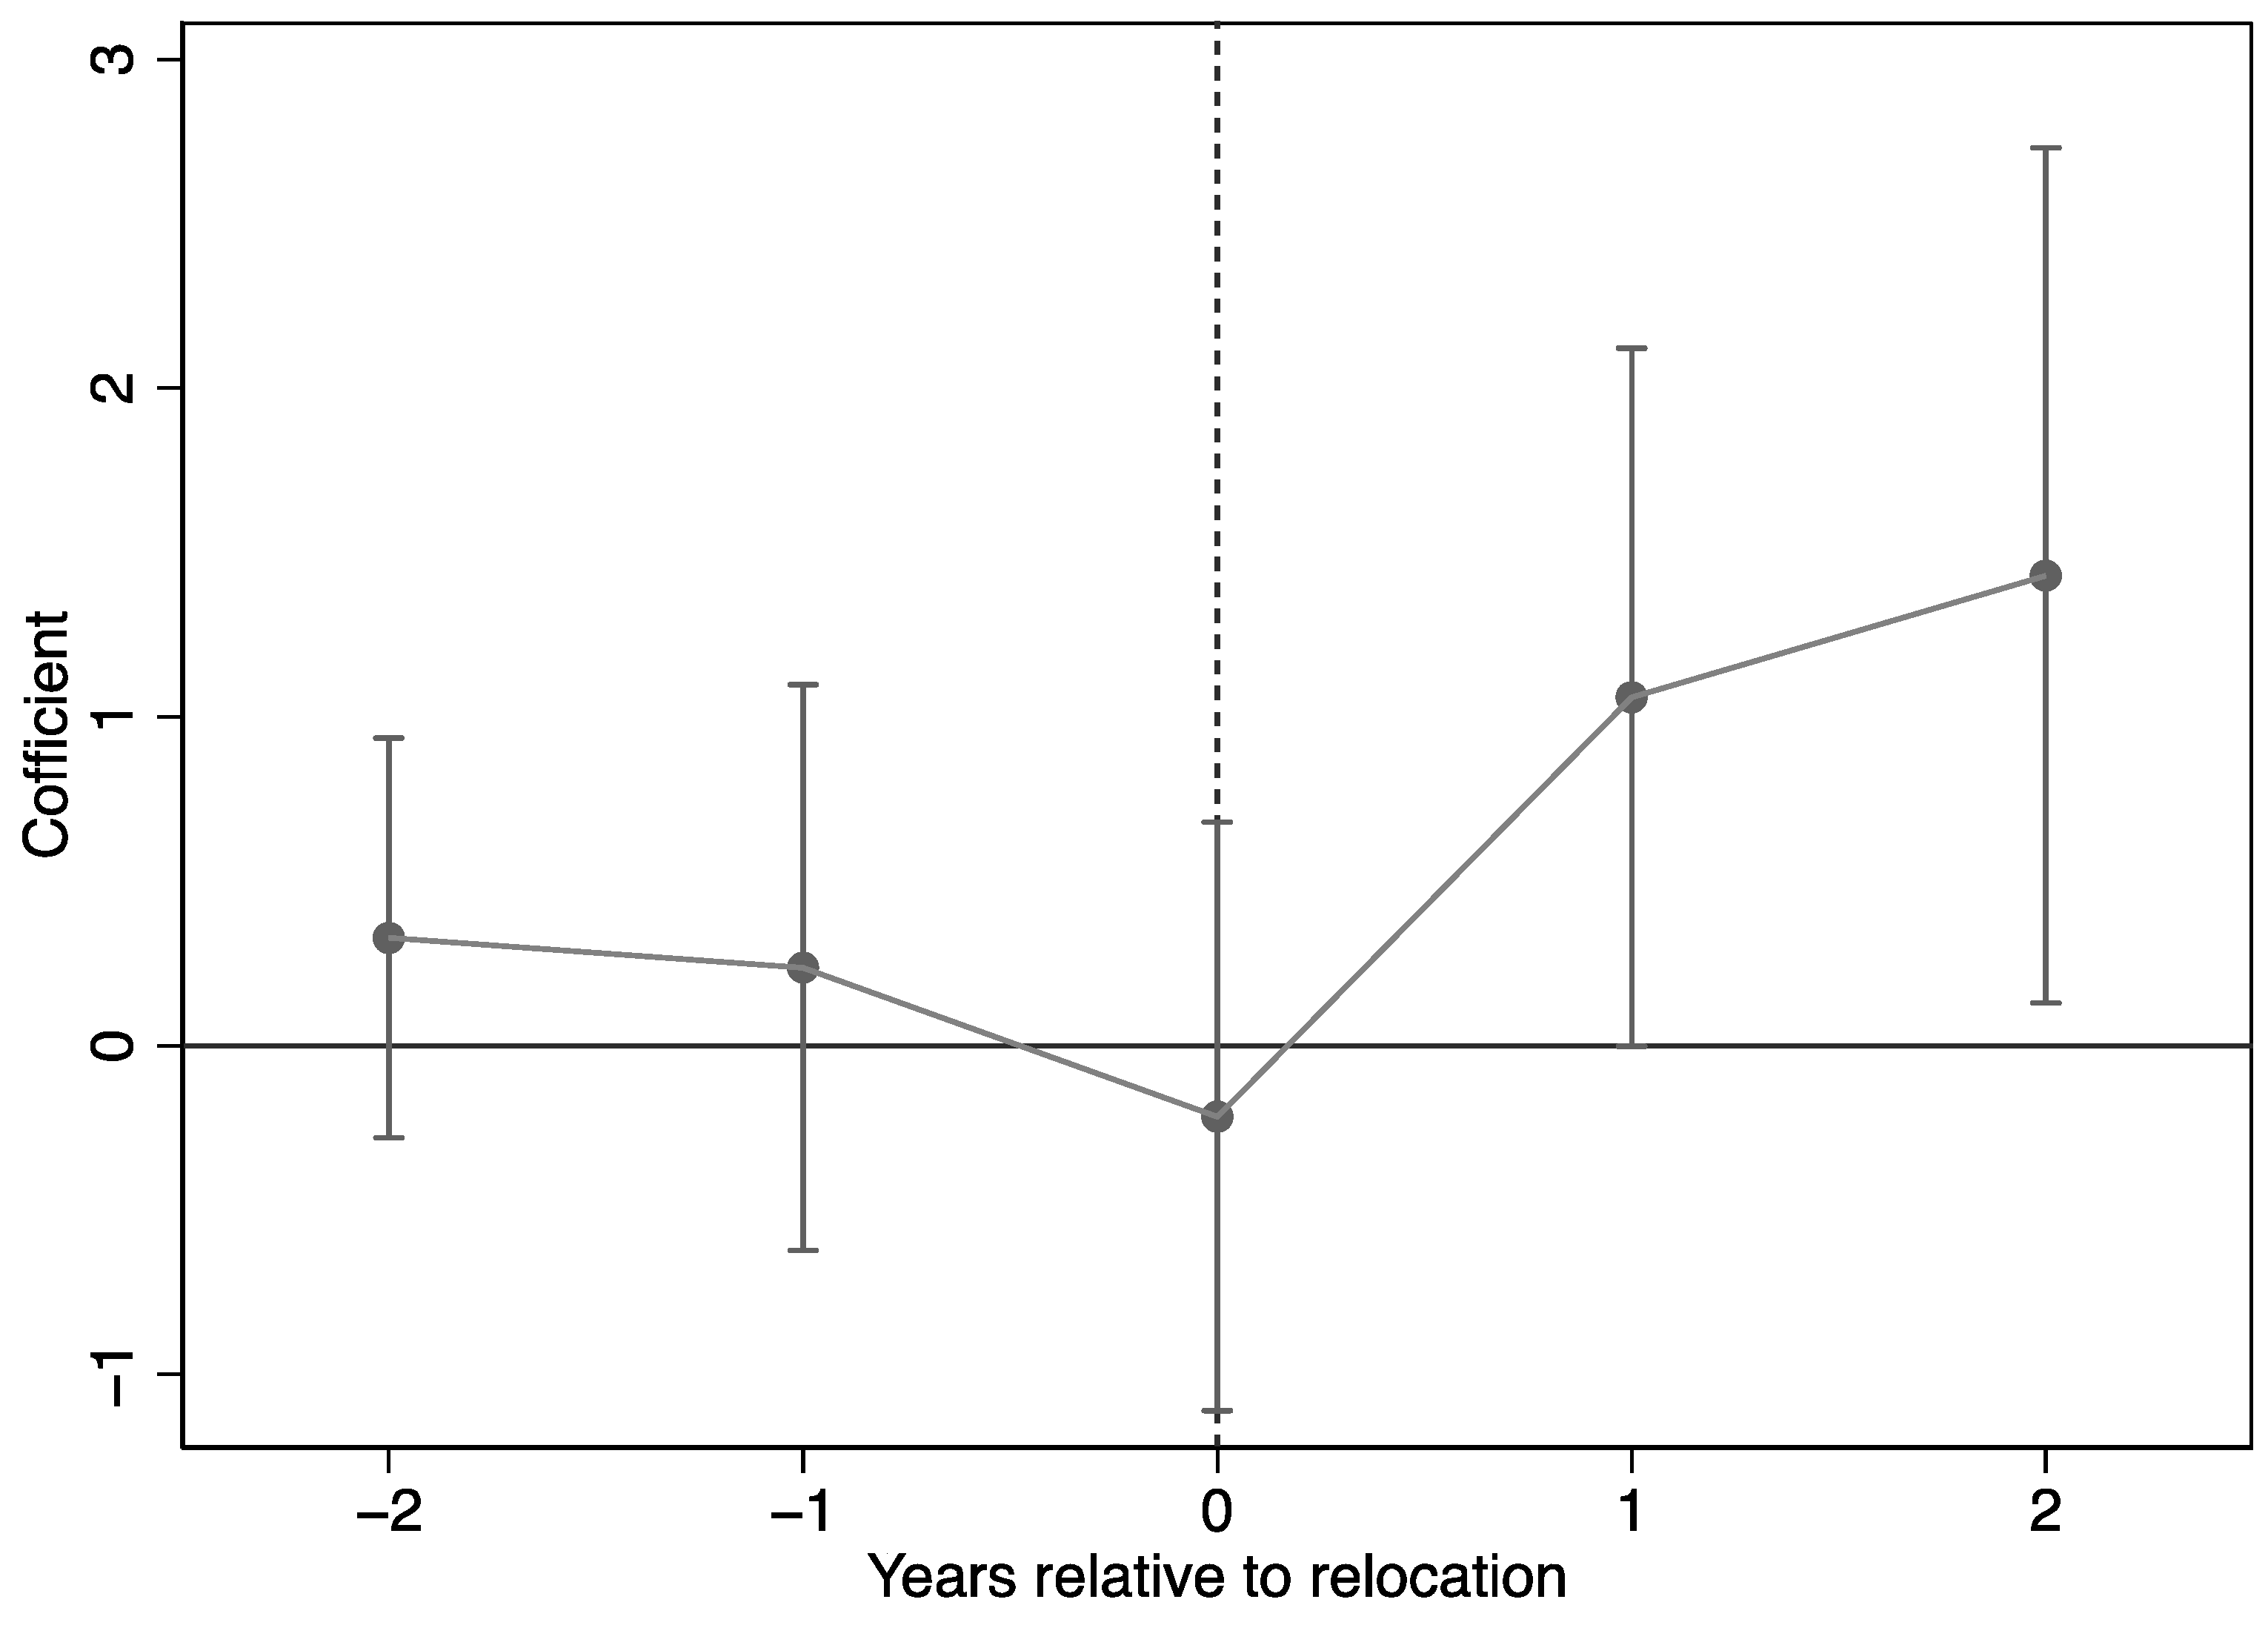
Table 1.
Descriptive statistics for variables (N = 2394).
| 2015 | 2016 | 2018 | ||||
|---|---|---|---|---|---|---|
| Mean | SD | Mean | SD | Mean | SD | |
| (1) | (2) | (3) | (4) | (5) | (6) | |
| Independent variable | ||||||
| Relocated (1 = yes; 0 = otherwise) | 0 | 0 | 0.288 | 0.453 | 0.706 | 0.456 |
| Dependent variable | ||||||
| Ln(per-student education investment) | 4.211 | 3.336 | 4.269 | 2.368 | 4.707 | 3.076 |
| Control variables | ||||||
| Head characteristics | ||||||
| Gender (1 = Male; 0 = otherwise) | 0.935 | 0.247 | 0.935 | 0.246 | 0.935 | 0.247 |
| Age (in years) | 49.246 | 11.803 | 50.135 | 11.889 | 51.929 | 11.685 |
| Ethnicity (1 = han; 0 = otherwise) | 0.697 | 0.460 | 0.697 | 0.460 | 0.697 | 0.460 |
| Married (1 = Yes; 0 = otherwise) | 0.875 | 0.331 | 0.867 | 0.340 | 0.883 | 0.321 |
| Educational level (in years) | 5.655 | 3.617 | 5.777 | 3.575 | 6.091 | 3.544 |
| Healthy status (1 = health; 0 = otherwise) | 0.494 | 0.500 | 0.551 | 0.498 | 0.682 | 0.466 |
| Family characteristics | ||||||
| Poverty-stricken household (1 = yes, 0 = otherwise) | 0.922 | 0.268 | 0.935 | 0.247 | 0.949 | 0.221 |
| Family size (number) | 4.729 | 1.324 | 4.762 | 1.338 | 4.492 | 1.644 |
| Proportion of elderly people age ≥ 65 years (percentage) | 0.102 | 0.149 | 0.121 | 0.146 | 0.147 | 0.257 |
| Proportion of children aged ≤6 years | 0.068 | 0.120 | 0.061 | 0.115 | 0.059 | 0.161 |
| Ln(Annual increase in fixed assets for household) | 1.557 | 2.852 | 4.684 | 3.611 | 6.427 | 3.388 |
| Provincial characteristic | ||||||
| Ln(Public education funding) | 6.668 | 0.233 | 6.754 | 0.224 | 6.880 | 0.244 |
Table 2.
Treatment effect of the PARP on per-student education investment.
| Per-Student Education Investment | ||||
|---|---|---|---|---|
| (1) | (2) | (3) | (4) | |
| Relocated | 0.701 *** | 0.658 ** | 0.691 ** | 0.681 ** |
| (1 = yes; 0 = otherwise) | (0.267) | (0.266) | (0.272) | (0.271) |
| Age | 0.043 * | 0.046 * | 0.046 * | |
| (in years) | (0.025) | (0.025) | (0.025) | |
| Married | 1.106 ** | 1.076 ** | 1.078 ** | |
| (1 = yes; 0 = otherwise) | (0.474) | (0.473) | (0.475) | |
| Education level | 0.055 | 0.056 | 0.057 | |
| (in years) | (0.056) | (0.056) | (0.056) | |
| Healthy status | −0.407* | −0.379 * | −0.354 | |
| (1 = health; 0 = otherwise) | (0.217) | (0.218) | (0.216) | |
| Poverty-stricken household | −0.757 | −0.774 | ||
| (1 = yes, 0 = otherwise) | (0.526) | (0.523) | ||
| Family size | 0.110 | 0.098 | ||
| (number) | (0.145) | (0.146) | ||
| Proportion of elderly people age ≥ 65 years | −2.017 * | −2.060 * | ||
| (percentage) | (1.145) | (1.147) | ||
| Proportion of children aged ≤6 years | 1.422 | 1.359 | ||
| (percentage) | (1.335) | (1.341) | ||
| Ln(Annual increase in fixed assets for household) | 0.042 | 0.047 | ||
| (0.031) | (0.032) | |||
| Ln(Public education funding) | 3.952 | |||
| (2.614) | ||||
| Constant | 3.924 *** | 0.701 | 0.666 | −25.958 |
| (0.185) | (1.466) | (1.684) | (17.710) | |
| Year fixed effect | Yes | Yes | Yes | Yes |
| Household fixed effect | Yes | Yes | Yes | Yes |
| Within R2 | 0.006 | 0.017 | 0.025 | 0.027 |
| Number of households | 798 | 798 | 798 | 798 |
| Observations | 2394 | 2394 | 2394 | 2394 |
Notes: Columns 2, 3, and 4 also controlled for the gender and ethnicity of the heads of households and were all omitted due to the use of household and year bidirectional fixed effects models. Standard errors clustered at the household level are reported in parentheses. Significance levels of 1%, 5%, and 10% are denoted by ***, **, and *, respectively.
Table 3.
Placebo test of treatment effect of the PARP on per-student education investment.
| Per-Student Education Investment | ||||
|---|---|---|---|---|
| (1) | (2) | (3) | (4) | |
| Relocated | 0.717 ** | 0.620 ** | 0.688 ** | 0.633 ** |
| (1 = yes; 0 = otherwise) | (0.296) | (0.292) | (0.294) | (0.294) |
| Pre_relocated | 0.024 | −0.056 | −0.004 | −0.071 |
| (1 = yes; 0 = otherwise) | (0.423) | (0.422) | (0.422) | (0.423) |
| Age | 0.044 * | 0.046 * | 0.046 * | |
| (in years) | (0.025) | (0.025) | (0.025) | |
| Married | 1.105 ** | 1.076 ** | 1.076 ** | |
| (1 = yes; 0 = otherwise) | (0.474) | (0.474) | (0.475) | |
| Education level | 0.055 | 0.056 | 0.057 | |
| (in years) | (0.056) | (0.056) | (0.056) | |
| Healthy status | −0.409 * | −0.379 * | −0.355 | |
| (1 = health; 0 = otherwise) | (0.217) | (0.218) | (0.217) | |
| Poverty-stricken household | −0.756 | −0.772 | ||
| (1 = yes, 0 = otherwise) | (0.527) | (0.524) | ||
| Family size | 0.110 | 0.098 | ||
| (number) | (0.145) | (0.146) | ||
| Proportion of elderly people age ≥ 65 years | −2.017 * | −2.062 * | ||
| (percentage) | (1.145) | (1.147) | ||
| Proportion of children aged ≤ 6 years | 1.421 | 1.345 | ||
| (percentage) | (1.333) | (1.340) | ||
| Ln(Annual increase in fixed assets for household) | 0.042 | 0.047 | ||
| (0.031) | (0.032) | |||
| Ln(Public education funding) | 4.002 | |||
| (2.615) | ||||
| Constant | 3.907 *** | 0.728 | 0.668 | −26.261 |
| (0.363) | (1.494) | (1.710) | (17.694) | |
| Year fixed effect | Yes | Yes | Yes | Yes |
| Household fixed effect | Yes | Yes | Yes | Yes |
| Within R2 | 0.006 | 0.017 | 0.025 | 0.027 |
| Number of households | 798 | 798 | 798 | 798 |
| Observations | 2394 | 2394 | 2394 | 2394 |
Notes: Columns 2, 3, and 4 also controlled for the gender and ethnicity of the head of household and were all omitted due to the use of household and year bidirectional fixed effects models. Standard errors clustered at the household level are reported in parentheses. Significance levels of 1%, 5%, and 10% are denoted by ***, **, and *, respectively.
Table 4.
Results of other robustness tests.
| Per-Student Education Investment | ||||||
|---|---|---|---|---|---|---|
| PSM-DID | Hybrid OLS | Two Time Periods | ||||
| (1) | (2) | (3) | (4) | (5) | (6) | |
| Relocated | 0.602 ** | 0.601 ** | 0.676 *** | 0.575 *** | 1.083 *** | 1.089 *** |
| (1 = yes; 0 = otherwise) | (0.274) | (0.276) | (0.164) | (0.196) | (0.369) | (0.381) |
| Controls | No | Yes | No | Yes | No | Yes |
| Constant | 3.990 *** | −23.856 | 3.921 *** | 0.840 | 3.600 *** | 4.672 |
| (0.190) | (17.874) | (0.143) | (2.483) | (0.326) | (32.412) | |
| Year fixed effect | Yes | Yes | Yes | Yes | ||
| Household fixed effect | Yes | Yes | Yes | Yes | ||
| Within R2 | 0.005 | 0.029 | 0.009 | 0.043 | 0.014 | 0.038 |
| Number of households | 784 | 784 | 798 | 798 | 547 | 547 |
| Observations | 2352 | 2352 | 2394 | 2394 | 1094 | 1094 |
Notes: Columns 1, 2, 5, and 6 also controlled for the gender and ethnicity of the heads of households and were all omitted due to the use of household and year bidirectional fixed effects models. Standard errors clustered at the household level are reported in parentheses. Significance levels of 1%, and 5% are denoted by ***, and **, respectively.
Table 5.
The mechanism of the PARP on per-student education investment: income effect.
| Per Capita Net Income | ||
|---|---|---|
| (1) | (2) | |
| Relocated | 0.963 *** | 0.214 *** |
| (1 = yes; 0 = otherwise) | (0.053) | (0.077) |
| Controls | Yes | |
| Constant | 8.120 *** | −17.249 *** |
| (0.018) | (2.392) | |
| Year fixed effect | Yes | Yes |
| Household fixed effect | Yes | Yes |
| Within R2 | 0.177 | 0.299 |
| Number of households | 798 | 798 |
| Observations | 2394 | 2394 |
Notes: Standard errors clustered at the household level are reported in parentheses. Significance levels of 1% is denoted by ***.
Table 6.
The mechanism of the PARP on per-student education investment: complementary effect.
| Household Health Expenditure | ||
|---|---|---|
| (1) | (2) | |
| Relocated | −1.497 *** | −0.580 *** |
| (1 = yes; 0 = otherwise) | (0.130) | (0.162) |
| Controls | Yes | |
| Constant | 6.923 *** | 46.205 *** |
| (0.043) | (5.370) | |
| Year fixed effect | Yes | Yes |
| Household fixed effect | Yes | Yes |
| Within R2 | 0.082 | 0.206 |
| Number of households | 798 | 798 |
| Observations | 2394 | 2394 |
Notes: Standard errors clustered at the household level are reported in parentheses. Significance levels of 1% is denoted by ***.
Table 7.
Treatment effect of the PARP on per-student education investment based on relocation attributes.
Table 7.
Treatment effect of the PARP on per-student education investment based on relocation attributes.
| Per-Student Education Investment | |||||||
|---|---|---|---|---|---|---|---|
| Relocation Method | Resettlement Model | Resettlement Location | |||||
| Whole-Village Relocation | Dispersed Relocation | Centralized Resettlement | Scattered Resettlement | County | Town | Village | |
| Relocated | 0.946 * | 1.202 ** | 1.675 *** | 2.981 *** | 0.621 ** | 1.039 ** | 0.463 ** |
| (1 = yes; 0 = otherwise) | (0.422) | (0.521) | (0.330) | (0.435) | (0.260) | (0.349) | (0.190) |
| Controls | Yes | Yes | Yes | Yes | Yes | Yes | Yes |
| Constant | −41.618 | 19.141 | −7.356 | −32.943 | −26.451 | −22.405 | −28.810 |
| (31.521) | (33.201) | (18.506) | (29.968) | (74.491) | (55.746) | (33.543) | |
| Year fixed effect | Yes | Yes | Yes | Yes | Yes | Yes | Yes |
| Household fixed effect | Yes | Yes | Yes | Yes | Yes | Yes | Yes |
| Within R2 | 0.047 | 0.046 | 0.045 | 0.182 | 0.117 | 0.174 | 0.045 |
| Observations | 642 | 955 | 1244 | 356 | 303 | 260 | 1041 |
Notes: Standard errors clustered at the household level are reported in parentheses. Significance levels of 1%, 5%, and 10% are denoted by ***, **, and *, respectively.
Table 8.
Treatment effect of the PARP on per student education investment based on relocation duration.
Table 8.
Treatment effect of the PARP on per student education investment based on relocation duration.
| Per-Student Education Investment | ||
|---|---|---|
| Coefficient | Standard Error (SE) | |
| (1) | (2) | |
| Duration_1 | 0.604 * | 0.338 |
| Duration_2 | 0.927 *** | 0.337 |
| Duration_3 | 1.697 *** | 0.467 |
| Controls | Yes | |
| Constant | 1.173 | 0.640 |
| Year fixed effect | Yes | |
| Household fixed effect | Yes | |
| Within R2 | 0.044 | |
| Observations | 2394 | |
Notes: Duration_1 refers to relocation in the current year, Duration_2 refers to one year after the relocation, and Duration_3 refers to two years after the relocation. Standard errors clustered at the household level are reported in parentheses. Significance levels of 1%, and 10% are denoted by ***, and *, respectively.
Table 9.
Treatment effect of the PARP on per-student education investment based on household characteristics.
Table 9.
Treatment effect of the PARP on per-student education investment based on household characteristics.
| Per-Student Education Investment | ||||
|---|---|---|---|---|
| Head’s Education Levels | Head’s Healthy Status | |||
| Over 6 Years | Less than or Equal to 6 Years | Healthy | Unhealthy | |
| Relocated | 0.791 ** | 0.493 ** | 0.840 ** | 0.511 |
| (1 = yes; 0 = otherwise) | (0.332) | (0.201) | (0.392) | (0.527) |
| Controls | Yes | Yes | Yes | Yes |
| Constant | −13.252 | −48.735 * | −51.602 ** | 11.618 |
| (29.188) | (25.498) | (24.991) | (34.660) | |
| Year fixed effect | Yes | Yes | Yes | Yes |
| Household fixed effect | Yes | Yes | Yes | Yes |
| Within R2 | 0.032 | 0.053 | 0.049 | 0.026 |
| Observations | 1003 | 1391 | 1569 | 825 |
Notes: Standard errors clustered at the household level are reported in parentheses. Significance levels of 5%, and 10% are denoted by **, and *, respectively.
Disclaimer/Publisher’s Note: The statements, opinions and data contained in all publications are solely those of the individual author(s) and contributor(s) and not of MDPI and/or the editor(s). MDPI and/or the editor(s) disclaim responsibility for any injury to people or property resulting from any ideas, methods, instructions or products referred to in the content. |
© 2024 by the authors. Licensee MDPI, Basel, Switzerland. This article is an open access article distributed under the terms and conditions of the Creative Commons Attribution (CC BY) license (https://creativecommons.org/licenses/by/4.0/).
Share and Cite
MDPI and ACS Style
Wang, S.; Zheng, L. The Impacts of the Poverty Alleviation Relocation Program (PARP) on Households’ Education Investment: Evidence from a Quasi-Experiment in Rural China. Sustainability 2024, 16, 3986. https://doi.org/10.3390/su16103986
AMA Style
Wang S, Zheng L. The Impacts of the Poverty Alleviation Relocation Program (PARP) on Households’ Education Investment: Evidence from a Quasi-Experiment in Rural China. Sustainability. 2024; 16(10):3986. https://doi.org/10.3390/su16103986
Chicago/Turabian StyleWang, Sangui, and Lijuan Zheng. 2024. "The Impacts of the Poverty Alleviation Relocation Program (PARP) on Households’ Education Investment: Evidence from a Quasi-Experiment in Rural China" Sustainability 16, no. 10: 3986. https://doi.org/10.3390/su16103986
Note that from the first issue of 2016, this journal uses article numbers instead of page numbers. See further details here.