Abstract
The escalating energy consumption seen in the BRICS countries, namely Brazil, Russia, India, China, and South Africa, presents a substantial environmental problem, resulting in the depletion of resources, amplified carbon emissions, and endangering the well-being of ecological systems. The study examines the potential of green innovation to alleviate these adverse effects. By combining green technology with strong institutions and responsible energy consumption, we argue that the BRICS nations can significantly reduce their ecological footprint. This research, encompassing data from 1995 to 2022, employs Driscoll–Kraay and panel quantile regression to analyze the complex interplay of institutional quality, energy consumption, green innovation, and ecological footprints across the BRICS countries. Our findings reveal that green innovation is crucial in mitigating the ecological footprint, particularly when combined with resilient institutional quality and controlled energy use. Conversely, factors like high energy consumption, natural resource rent, and urbanization contribute to an increased ecological footprint. Notably, the study emphasizes the critical role of both institutional quality and renewable energy consumption in effectively reducing the ecological burden within the BRICS nations. These findings suggest that prioritizing investments in green technology and institutional development, even amidst high energy demands, represents a viable strategy for the BRICS nations to achieve sustainable growth and environmental responsibility.
1. Introduction
Today’s most urgent global challenges are ecological shifts and environmental deterioration. Thus, promoting sustainable ecological policies has become necessary for emerging and developed nations [1,2,3]. The massive increase in carbon emissions has caused numerous serious problems around the planet. Carbon emissions have recently spiked all over the world due to the high production and use of energy [4,5]. Emerging economies have grown rapidly during the last ten years, leading the world economy [6]. Expanding the economy promotes the construction of necessary infrastructure and raises people’s standard of living. However, developmental processes have unavoidable side effects, especially when nations repeatedly prioritize growth over protecting the environment [7].
Carbon emissions have recently spiked all over the world due to the high production and use of energy [2]. Urgent attention from officials and researchers is vital to mitigate this pressing environmental crisis [8]. Energy demand, industrial revolution, economic development, and various other factors are causing global warming [9,10]. Energy, an essential economic factor, may help move sustainable development objectives forward. The leading cause of global pollution is the energy production processes of most industrialized nations, which rely on traditional fuels such as gas, coal, and oil [11]. Since the start of the Industrial Revolution, carbon emissions have increased to previously unheard-of levels—possibly increasing by as much as 50% [12]. Excessive energy use has two effects: it increases carbon emissions and creates electrical volatility [9]. The issue of energy instability that emerging economies face arises from their reliance on extensive use of fossil fuels [3]. Therefore, it is very difficult for policymakers to evaluate the environmental effects of energy policy. One potential approach to energy diversification is the use of renewable energy. The energy market will be better able to weather shocks if it becomes less dependent on fossil fuels [13].
Recently, innovations in green technology have emerged as a significant global tool for cutting carbon releases [14,15]. Many countries implement these technologies across all economic sectors to promote sustainable development. Innovative technology and business practices are essential for green growth, particularly in recognizing the importance of environmental technologies in policy and decision-making processes [16]. Sustainable and ecological technology is a subset of green or eco-technology, which encompasses a constantly changing range of practices, materials, and processes ranging from non-toxic cleaning agents to energy generation techniques. Alam and Murad [16] consider the immediate and long-term consequences of anything on the ecosystem. Green innovative technology and managerial green innovation are the two primary strands of green innovation, as Qi et al. [17] noted. Green technological innovation aims to achieve a harmonic balance between the economy and the environment by protecting the environment through manufacturing [18]. This is accomplished by creating products and technology that conserve raw resources and energy and by efficiently utilizing energy.
In addition, institutions play a pivotal role in minimizing ecological footprints and improving environmental quality [19]. Through laws and regulations, institutions have the authority to influence environmental quality either directly or indirectly. In this way, institutional advancements like democracy, law and order, government stability, and the fight against corruption can all serve as significant stimulants for enhancing the excellence of the environment. When institutional quality is inadequate, it is impossible to impose stringent environmental restrictions and ensure that firms would adhere to ecological practices [20,21]. Further, Lau et al. [22] also stated that institutional quality is a factor in legislation and policy that lessens environmental harm. Establishing a solid legal and regulatory framework upholds public confidence, fosters inclusive institutions, and increases institutional responsibility and transparency [23]. Impartial institutions advocate for robust laws and a strong rule of law, impacting how closely firms abide by relevant ecological standards. However, it may be demonstrated that corruption secondarily obstructs environmental quality. There is a risk that partial-trust authorities may push for lax environmental laws and regulations and obstruct renewable energy projects [24]. A government that is stable enough to maintain its power could control the amount of energy consumed, even though environmental laws are not as strict as they should be [25].
In terms of rising economies worldwide, the BRICS countries rank highest. According to Zhang and Wang [26], they have a significant influence on global economic progress. In 2007, the estimated BRICS GDP (Gross Domestic Product) share of USD was 18.82 trillion (or 23.3%). Due to their combined membership comprising 41% of the global population, the BRICS countries substantially influence the global economy. Furthermore, according to Hussain et al. [27], the BRICS nations encompass almost 25% of the global area. The BRICS countries’ rapid economic growth, however, has impacted the preservation of the environment. In entirety, the BRICS countries are estimated to have created 13.985 billion tons of carbon emissions. Stated differently, the BRICS countries produced 41% of global CO2 (carbon dioxide) emissions [28]. For well-informed and long-lasting policy development, it is essential to investigate how green technologies, institutions, and energy affect the ecological footprints of the BRICS nations.
The BRICS nations are undergoing swift economic expansion, although their environmental impact is troubling. This study examines the impact of energy consumption, institutional quality, and the adoption of green technologies on ecological footprints. This study is innovative since it goes beyond studying single elements to explore their collective impact, providing a more detailed comprehension of BRICS’ distinct developmental obstacles. This study is critical because it has the capability to provide beneficial insights for policy decisions in the BRICS countries. The study aims to help these nations balance economic prosperity and environmental responsibility by determining the best mix of green technologies, robust institutions, and sustainable energy practices. This position is of great importance since the BRICS countries have a significant impact on the global economy and other developing nations may learn from their sustainable development achievements.
The following portions of the study are organized according to this format: prior research is reviewed in Section 2. An explanation of the theory and the model are given in Section 3. Information about the sources, methods, and data used are provided in Section 4. In Section 5, we go over the results and discussion. Section 6 concludes the research and discusses the policy implications.
2. Literature Review
Environmental sustainability has become an increasingly pressing concern, capturing the attention of scholars. This heightened interest has led to the development of a broader spectrum of empirical research. The ecological footprint (EF) is a popular metric for measuring impact on the environment. Several recent research projects have investigated what causes ecological footprints to grow or shrink. Urbanization, renewable energy, resource extraction, and technical progress are some of the aforementioned variables [29,30,31,32,33].
The development of new technologies, as well as the creative use of existing technology, are included in technological innovation. Ahmad et al. [34] state that this entails creating innovative ideas, creating and executing new patents, and altering how things are produced. Technological innovation is thought to be a crucial solution to environmental problems. It can reduce carbon dioxide emissions by using a variety of techniques. These include carbon absorption in photosynthetic processes in biomass systems, carbon storage in fossil fuel infrastructure, and energy storage device use in power production.
In addition, there are several ways in which green technology might influence environmental preeminence. As technology continues to progress, scientists and policymakers are starting to see the value of technological innovation in reducing CO2 emissions, [34,35]. Similarly, Islam et al. [36] found that TI negative shock can raise CO2 emissions.
Yang et al. [37] examined the impact of technical innovation on preventing environmental damage. Using the second-generation advanced estimator, they analyzed data from the BRICS countries. Their results confirmed that BRICS countries’ EFs have decreased due to technological advancement. Using the STIRPAT (Stochastic Impacts by Regression on Population, Affluence, and Technology) method, Kihombo, Ahmed, Chen, Adebayo, and Kirikkaleli [30] looked at the impacts of technology innovation on carbon emission reductions in the MENA (Middle East and North Africa) and West Asian nations from 1990 to 2017. Modern technologies have the potential to enhance environmental quality, as per their study. Ahmad et al. [38] investigated the impact of technical advancement on EF from 1984 to 2016 using the CS-ARDL (Cross-Sectional Autoregressive Distributed Lag) method. Based on their findings, technical progress is detrimental to EF.
The environmental impact of energy use has been the subject of an increasing amount of academic inquiry in recent years. Numerous aspects of this connection have been explored by researchers in different nations and situations [39]. Maji and Adamu [40] looked at the impact of using renewable energy sources on Nigeria’s sustainability, while considering government efficiency. From 1985 to 2014, researchers Usman et al. [41] examined the link between economic development, biomass capacity, and renewable energy consumption as well as the consequences of US trade policy on environmental deterioration. Khan et al. [42] examined Pakistan’s energy use, water availability, and carbon dioxide emissions.
Based on a variety of statistical tests, Shahzad et al. [43] assessed the correlation between fossil fuels, environmental impact, and the intricate structure of the US economy. Taking into account real production and economic growth results, Usman et al. [44] scrutinized the effects of globalization and renewable energy on the ecological footprint. Umar et al. [45] used several econometric techniques to study how changes in biomass energy consumption, fossil fuel energy consumption, and the growth of the transportation sector’s economy in the US affected CO2 emissions. A decrease in emissions connected to transportation is a result of both biomass energy and real GDP, in contrast to fossil fuel energy, which is a key source of these emissions.
Renewable energy sources may, nevertheless, have a negative influence on the environment, according to Sayed et al. [46], who assessed the environmental consequences of small- and medium-scale power production systems that used wind, hydropower, biomass, and geothermal energy. Looking at the issue from a supply-side angle, Gani [47] determined that the production of electricity from fossil fuels worsens environmental problems. Based on their analysis of the top 10 solar energy-consuming countries, Sharif, Meo, Chowdhury, and Sohag [29] found that solar power is an excellent approach to reducing our ecological footprint. They utilized quantile-on-quantile regression to look at how solar energy consumption changes over time.
Yang et al. [48] observed that poor institutional quality in developing nations is linked to high pollution levels and ineffective economic performance. As a result, the government can miss out on chances to establish prestigious institutions and enact sensible budgetary policies. More precisely, many nations suffering from these organizations usually lack the political and legal frameworks required to encourage economic growth. According to Ayad et al. [49], countries with weak or inadequate institutions also struggle to regulate price fluctuations.
Using two-stage least square and panel threshold techniques, Jahanger et al. [50] examined the impact of institutional quality on carbon emissions from 1990 to 2018 using a worldwide panel of 73 developing nations. The study indicated that CO2 emissions were lower for those with institutions with higher levels of excellence. Furthermore, an examination of Somalia from 1990 to 2017 by Warsame et al. [51] verified that sustainable ecosystems are the result of high-quality institutions, and they also found a link between environmental degradation and institutional quality.
According to Hussain and Mahmood [52], who examined data from 1984 to 2019, institutional quality in Pakistan had an uneven effect on EF. The data show that positive shocks have a negative effect on EF while negative shocks have a good effect. The data show that EF increases with GDP and energy consumption but decreases significantly with better institutional quality. Using second-generation panel analytic methodologies, Bekun et al. [53] investigated the association between economic independence and institutional quality in the E-7 countries. Evidence suggests that the E-7 nations’ weak institutional frameworks threaten their capacity to maintain environmentally sustainable practices.
Rehman et al. [54] examined the association between low institutional quality and environmental damage in the ASEAN (Association of Southeast Asian Nations) states using data gathered from 1990 to 2018. For both the long and short term, we used the pooled mean group (PMG) estimator. A clean atmosphere and lowered EF are the results of high-quality institutions, according to the PMG findings. In terms of environmental quality, the empirical investigation found that higher institutional qualities were better. Emmanuel et al. [55] examined the impact of institutional quality on EF in a global panel of 101 countries from 1995 to 2017. The expected results show that raising the institutional quality of different estimators raises the atmosphere’s level. Sun et al. [56] also looked at eleven countries (N-11) from 1990 to 2018 and how environmental effect correlated with institutional quality. We overcome the panel data problems by using the CS-ARDL approach to look at both long- and short-term connections.
According to Godil et al. [57], the institutions in India play a significant role in promoting environmental protection through their efforts to decrease dependence on traditional energy sources. Alola et al. [58] examine the environmental elements that support sustainable growth in the European Union. We find that renewable energy increases ecological quality and non-renewable energy decreases sustainability, using the PMG-ARDL as an evaluation instrument. Hassan et al. [59] states that as CO2 emissions in Pakistan increase, so does the quality of the country’s institutions. The environmental impact of the G7 nations is increasing due to urbanization, according to Ahmed, Ahmad, Murshed, Shah, Mahmood, and Abbas [9]. A related study by Le and Ozturk [60] found that CO2 emissions in emerging market nations rose in tandem with GDP, government spending, and the quality of institutions. By illustrating the varied effects in various contexts, these studies elucidate the intricate link between institutional quality and environmental consequences.
Ahmad, Jiang, Majeed, Umar, Khan, and Muhammad [38], who analyzed panel data from 22 developing nations, provide more support for this. They used CS-ARDL to make the case that technological advancements help slow down environmental deterioration and that more economic activity and more natural resource availability make things more sustainable. Ahmed et al. [61] found EF to be associated with urbanization, economic growth, human capital, natural resources, and China’s growth in urbanization. Data from the Bayer and Hack co-integration test show that EF rises with natural resources, urbanization, and economic progress, but falls with human capital. Using ARDL as their estimating approach, Hassan et al. [62] suggest that Pakistan’s natural resources and economic growth boost its EF.
Majeed et al. [63] examine the practices of six Gulf Corporation Council (GCC) member states in relation to economic globalization, carbon dioxide emissions, disaggregated energy use, and natural resource management. This research substitutes carbon dioxide emissions for environmental damage and uses CS-ARDL as its estimating approach. The findings demonstrate that renewable energy sources, natural resources, and economic globalization may all contribute to better environmental conditions. As a result of human activities such as growing cities, increasing economies, and relying on non-renewable energy sources, the ecology is suffering.
This extensive literature review examines the various factors influencing ecological footprint (EF), a metric used to measure environmental impact. Studies have explored how urbanization, renewable energy use, resource extraction, and technological advancements can affect EF. Technological innovation, particularly green technology, is seen as a key solution for environmental issues, with research highlighting its potential to reduce carbon emissions. The relationship between energy consumption and environmental impact is well-established, with studies examining the effects of both renewable and fossil fuel use. Additionally, strong institutions are linked to improved environmental outcomes, as research demonstrates their positive influence on reducing pollution and promoting sustainable practices. However, a gap exists in fully understanding how these factors interact, particularly in developing economies like the BRICS nations (Brazil, Russia, India, China, and South Africa). This study aims to address this gap by analyzing how green technology adoption, institutional quality, and energy consumption patterns collectively influence the ecological footprint of the BRICS countries. The summary of the literature review is exhibited in Table A2 in Appendix A.
This research is significant for BRICS policymakers. The study aims to uncover the best combinations of characteristics that reduce the ecological footprint to provide insights for balancing economic growth and environmental responsibility. This method can significantly influence and lead other developing countries in achieving a sustainable future. This study enhances understanding of how the BRICS countries might successfully transition towards a more environmentally sustainable and economically prosperous future for their populations and the Earth.
3. Theoretical Framework
Building a comprehensive model that accounts for the interplay between renewable energy, green technology innovation, and institutional quality in assessing environmental degradation is the overarching goal of this research. Researchers have suggested adopting the famous STIRPAT model for this study due to the unique properties of the variables [64]. Using regression analysis, Dietz and Rosa [65] created the IPAT (Impact = Population × Affluence × Technology) model to look at the potential impacts of technology, income, and population. To measure the effects of human activities on the environment, the IPAT model is often used. One way to visualize the IPAT equation is as follows:
Environmental prominence influences are denoted by I, population size is denoted by P, wealth is represented by A, and technical development is shown by T. Despite its shortcomings, the IPAT model is most often used to evaluate how human actions affect environmental quality. It ignores the role that human behavior and choices play as other key drivers of environmental quality. The IPAT model also fails to take into consideration the fact that important environmental factors might have non-proportional or non-monotonic impacts. Dietz and Rosa [65] recognized these limitations and created an enhanced IPAT framework called the STIRPAT model to address them.
When it comes to IPAT’s shortcomings, the STIRPAT model has you covered. The model can handle several types of data with ease, including panel data, time series, and cross-sectional data, giving you additional options for how to explain the influence of each variable. In contrast to the IPAT method, the STIRPAT framework adds socio-cultural aspects into its evaluation of environmental quality. It sheds light on the intricate web of connections between people’s actions and their surrounding environments. Here is the STIRPAT model’s fundamental equation:
On the other hand, for nation i at time t, P stands for population, A for wealth, and T for technology. The C represents the constant component in the STIRPAT model, ε stands for the random error term, and , , and are the coefficients for the components P, A, and T, respectively. Subscripts t and i stand for the year and nation, respectively.
The ecological footprint is the primary topic of this work. The factors contributing to the ecological footprint have been the subject of recent empirical studies using the popular STIRPAT model [66,67,68]. The STIRPAT model’s technical ideas are comprehensive and multi-faceted, say York et al. [69]. As a measure of environmentally friendly technology, the study looks at renewable energy use and patent amount. Examining the effect on environmental footprint, the research also considers institutional excellence. By comparing theoretical models with actual research, scientists may be able to better understand the interconnected web of factors influencing institutional quality, renewable energy, technological progress, and the ecological footprint. Insights from this study could guide decisions and policies that boost the economy in the long run without sacrificing environmental protections.
Model Specification
To quantify the extent to which the natural environments of the BRICS countries are degrading, this research uses the ecological footprint (EF). Institutional quality, urbanization, rent from natural resources, innovation in green technology, energy consumption, and usage of renewable energy were some of the characteristics examined in this empirical study as they related to ecological footprint. This supports the findings of earlier studies [38,70,71].
In Equation (3) above, EF stands for ecological footprint, Ins for institutional quality, and UR and NRR for urbanization and natural resource rent, respectively. GTI stands for green technological innovations, EC for energy consumption, and REC for renewable energy consumption.
We added the interaction term “green technological innovation with energy consumption” to Equation (3) to examine the mitigating effect of green technological innovation with energy consumption on EF. Thus, the empirical model provided in Equation (4) is used to examine how ecological footprint is reduced by green technology innovation in relation to energy consumption.
To investigate the moderating impact of green tech innovation with institutional quality on EF, we updated Equation (3) to include the interaction term of green tech innovation with institutional quality . Therefore, we use the empirical approach in Equation (5) to look at how green technology innovation with institutional quality reduces ecological footprint.
4. Data Description and Methodology
The purpose of this research is to assess the long-term effects on the BRICS nations’ environmental impact of factors such as institutional quality, urbanization, rent from natural resources, green technological innovation, energy use, and the percentage of that energy that comes from renewable sources.
4.1. Data Description
This research looked at BRICS nations’ energy use and institutional quality in relation to green technology innovation from 1995 to 2022. We obtain our data from three distinct sources. The Ecological Footprint obtains its data from the Global Footprint Network. Statistics on Rule of Law (RL), Government Effectiveness (GE), Control of Corruption (CC), Political Stability and Absence of Violence (PSAV), and Voice and Accountability (VA) are all part of the World Governance Indicators (WGI) data compiled by the World Bank. The World Bank oversees the World Development Indicators database, which provides the data for all other variables.
To understand the interplay between green technological innovation, institutional quality, energy consumption, and ecological footprint in the BRICS countries, it is necessary to consider the study’s components. Institutional quality, urbanization, rent from natural resources, green technology innovation, energy consumption, and consumption of renewable energy sources are all independent factors that will have an impact on the ecological footprint. The worldwide hectares per capita, which include agriculture, forest land, grazing space, construction land, and carbon footprint are used to calculate the ecological footprint. This measure enables a thorough understanding of how human activity affects environmental eminence. One key indicator of an institution’s efficiency and efficiency in advancing sustainable development is its institutional quality. Voice and accountability, political stability and absence of violence, effectiveness of government, quality of regulators, rule of law, and control of corruption are the six global governance indicators used to evaluate. On the other side, urbanization reveals the geographical distribution of economic activity and its effects on pollution. The total amount of rent from natural resources includes rent from coal (both hard and soft), oil, natural gas, minerals, and forests. Green technological innovation, calculated through the number of patents filed by residents, may be used to gauge the nation’s ability to create and implement innovative technologies that support sustainable development. Per capita energy consumption is expressed in kilograms of oil equivalent. The proportion of renewable energy used is crucial as it shows how committed a nation is to sustainable development. Table 1 describes the variables, symbols, descriptions, and likely signs. Below, the anticipated effects of respective variables on ecological footprint are discussed individually.

Table 1.
Variables: Signs, Symbols, and Descriptions.
The administrative constraints caused by political instability, the rule of law, corruption, and other issues are considered positive signs of institutional quality [72,73]. By improving institutional quality to support environmental policies or the inputs and outputs of technical progress, institutions contribute to sustainable development, which is the assurance of environmental quality [74]. The need for more energy in urban areas accelerates environmental degradation. Moreover, cities have higher energy consumption from fossil fuels because of increased traffic and electricity generation from the industrial and domestic sectors. Urbanization boosts economic activities, consequently increasing environmental degradation [75]. On the other side, there are several reasons why urbanization has positive environmental effects that outweigh its negative ones. For example, the increased income levels that come with urbanization support the environment-friendly services industry and increase the demand for environmental quality that lowers EF.
Furthermore, EF is decreased by urbanization since it offers more excellent facilities and higher living standards than rural areas. In addition, urbanization might spur innovation, research, and development that ultimately reduces EF [76]. Resources, including water, air, soil, forests, and energy, are included in NRR, and human activity increases using these natural resources. Furthermore, there is a clear correlation between the use of NRR and other activities like mining, transportation, energy generation, agricultural, and industrial operations. Pollution arises as a consequence of these activities, as they lead to the discharge of trash and pollutants emissions [38,62]. For GTI, the rationale is that the targeted countries increased technological advancements to improve environmental results and lessen their EF [77,78]. Conversely, one reason is the absence of clean energy technologies [79]. Further increases in energy consumption lead to a larger ecological impact and higher carbon emissions [32,64]. Deploying renewable energy sources not only helps lower ecological footprint levels, but they also replace non-renewable energy sources and fossil fuels. This is why cutting down on environmental impact requires a surge in renewable energy use [80,81].
4.2. Methodology
This study adopts a robust panel data analysis approach to evaluate the long-lasting effects of institutional quality, urbanization, resources, green technology, renewable energy sources, and energy consumption on the ecological footprints of BRICS countries. Analysis of cross-sectional dependence and second-generation panel unit root tests verify data accuracy while testing for slope homogeneity and using Driscoll–Kraay standard errors to mitigate potential biases. Panel quantile regression examines the varied impacts at different levels of environmental footprint, providing a thorough insight into the environmental difficulties and sustainability prospects of BRICS countries.
4.2.1. Construction of Institutional Quality Index
We used the procedures outlined by Apergis and Ozturk [82] and Yasin, Ahmad, and Chaudhary [64] to build an all-encompassing political institution index. Regulatory Quality (RQ), Control of Corruption (CC), Rule of Law (RL), Voice and Accountability (VA), and Government Effectiveness (GE) were among the several factors that used data. As exhibited in Table A1, in Appendix A, we kept just one component following the criteria of Kaiser [83]. According to this criterion, we need to keep only elements or factors whose eigenvalues are more significant than one. Bartlett’s test for sphericity was used to find and eliminate sample errors and non-collinear variables.
4.2.2. Cross-Section Dependence Test
For panel data analysis to rule out cross-sectional dependence, a CD assessment is required beforehand. It is important to take CD into account since it might cause erroneous findings [64]. According to Nathaniel et al. [84], CD occurs when there is a reciprocal dependence between two or more cross-sectional units. To evaluate cross-sectional dependence, we used the following equation, which is based on Pesaran [85] test for CD:
CD measures the degree to which several cross-sections are interdependent. Three variables comprise the following expression: is the period, is the sample size, and is the sample estimate of the cross-sectional correlation of errors across entities and .
4.2.3. Slope Heterogeneity Test
The dispersion tests of Pesaran and Yamagata [86] and Swamy [87] provide the basis of the slope heterogeneity test that follows the cross-sectional dependency analysis. Panel estimators may not be applicable to all BRICS nations due to differences in demographics, socioeconomic status, and other factors. The following is the expression of the empirical model for this test:
The delta tilde is represented by and the adjusted delta tilde is represented by .
4.2.4. Panel Unit Root Analysis
We used the cross-sectionally adjusted Im et al. [88] panel unit root test to evaluate whether stable qualities exist in environmental sustainability. The cross-sectionally augmented DF (CADF) tests are combined in this test by calculating their simple average. The factors considered in this assessment are ecological footprints (calculated in global hectares and energy consumption), urbanization, natural resource rent, green technological innovations that are environmentally friendly, institutional quality, energy consumption, and energy consumption from renewable sources. Pesaran [89] method incorporates cross-sectional averages, lagged levels, and early differences between separate series to enhance the Dickey–Fuller regression (CADF). The following is the formula for the CADF unit root test:
In the above phrase, Y denotes the variable being analyzed ∆ denotes the difference operator, suggesting a first-order differencing of the variable; and displays the error term. For the unobserved common factor, a proxy is provided in the form of the cross-sectional average .
For the sake of analytical simplicity, Pesaran [90] used a slightly modified estimate for the t-value for instead of the conventional one. To prove that the modified t-statistic is free of nuisance parameters as for any constant T > 3 and for the case when is followed by , we may derive its asymptotic distribution. Based on the work of Im, Pesaran, and Shin [88], Pesaran [90] proposes an improved IPS-test for cross-sectional analysis:
In contrast, the cross-sectionally enhanced Dickey–Fuller statistic for the iith cross-sectional unit, , is given by the t-ratio of in the CADF (covariate augmented Dickey–Fuller) regression. We demonstrate that the CIPS (cross-sectionally augmented Im, Pesaran, and Shin) statistic’s distribution is non-standard even when N is large. In contrast, Im, Pesaran, and Shin [88] found that, for large enough N, the standardized average of individual ADF statistics followed a normal distribution when we assume cross-sectional independence.
4.2.5. Panel Co-Integration Test
We incorporated the Kao panel co-integration test [91]. Although it uses cross-homogenous coefficients on the first-stage regressors, it is executed in a manner akin to that of the Pedroni test. However, that provides homogenous coefficients and intercepts specific to a given cross-section for the first-stage regressors. In other words, these tests are limited to bivariate systems and do not capture heterogeneity under the alternative hypothesis (i.e., when the co-integration relation contains just one regressor). Each panel has the same co-integration vector and slope coefficient, as shown by the following equation. Here, .
The test statistic, as determined by ADF regression, is:
Asymptotically, the distribution approaches for all test statistics.
4.2.6. Driscoll–Kraay Standard Error
There is a possibility that cross-sectional dependency may lead to incorrect estimations. We used fixed-effect models with Driscoll–Kraay standard errors for our regression analysis to address this problem. Regarding issues with differences across groups, dependency in longitudinal data, and sequential correlation, Driscoll and Kraay [92] first presented the Driscoll–Kraay technique. This method works well with balanced and imbalanced datasets and can effectively handle missing values [93]. Additionally, it has shown accuracy and consistency in addressing cross-sectional dependence issues, producing robust standard errors [94]. This method was chosen since previous studies have shown that it is acceptable in similar research, particularly when tackling stationarity difficulties [95].
4.2.7. Panel Quantile Regression
We adopt a quantile regression (QR) model with a distinct FE. Consequently, we can express the response of the tth observation on the ith individual’s conditional quantile function as follows:
The exogenous covariates’ p-vector is represented by , while the response variable is denoted by . The restricted -quantile of is indicated by (, ) and is depicted by . The quantile, τ, of interest may have an impact on both the impacts particular to each individual and the effects of the variables (), according to this model.
Although, in most cases, each of and β may depend on , we conceal this dependence and take to be constant throughout the study project to simplify notation. The ’s are used to pinpoint any distinguishing source of variability or hidden heterogeneity that other factors failed to account for adequately.
It is crucial to make clear in the QR model that no alteration can eliminate the fixed effects (FE). This inherent challenge implies that a comprehensive approach is necessary, as mentioned by Abrevaya and Dahl [96]. Early differencing methods identified from Gaussian models can occasionally produce surprising outcomes. Convergence quantiles for random variables are also quite challenging problems.
5. Results and Discussion
We set out to examine the BRICS nations’ environmental imprints across time by looking at how factors including institutional quality, urbanization, rent from natural resources, green technological innovation, energy consumption, and use of renewable energy have played a role. When comparing the BRICS nations, Russia’s energy consumption and environmental impact are the most prominent, while India’s sustainability potential is the most promising (Figure 1). Green technology adoption differs, with Brazil leading, and China and South Africa showing potential. Renewable energy use is rising globally, with Brazil at the forefront. China leads in urbanization, while Russia falls behind. China is falling behind in natural resource rent, while Russia excels; both countries are increasingly dependent on resources. This provides a detailed and balanced view of the BRICS landscape, emphasizing advancements and obstacles in resource management and sustainable development. A radar chart of descriptive statistics has been provided in Figure 2.
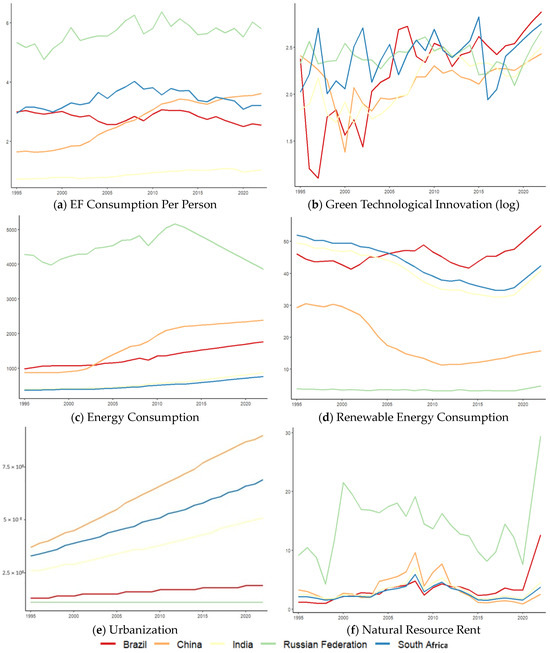
Figure 1.
Analysis of key variables in BRICS economies.
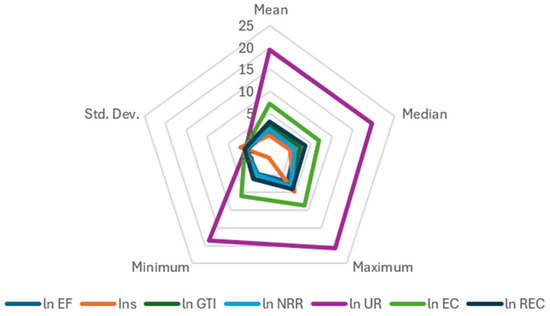
Figure 2.
Descriptive statistics.
Figure 3 showcases a correlation heat plot depicting the relationships between key variables. The ecological footprint positively correlates with green technological innovation, information and communication technology, total natural resource rent, and energy consumption. Conversely, it correlates negatively with urbanization, institutional quality, and renewable energy consumption. This nuanced analysis offers insights into the intricate interplay among these variables, shaping our understanding of their environmental impact.
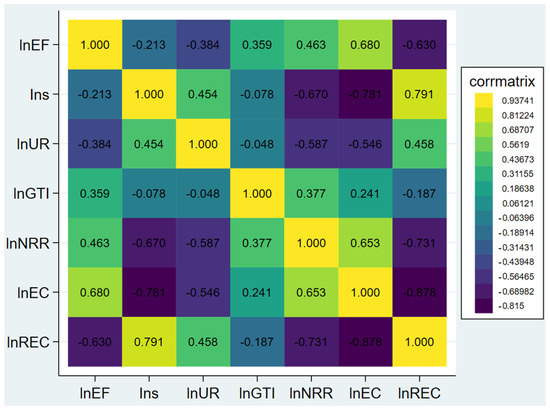
Figure 3.
Heat plot of correlations.
The cross-sectional dependence findings of the Pesaran [85], Breusch–Pagan LM, Pesaran scaled LM, and bias-corrected scaled LM CD tests are presented in Table 2. There will be an impact on the other BRICS nations from any changes made to variables like EF, Ins, UR, NRR, GTI, EC, and REC in any one of the BRICS nations. This demonstrates how the BRICS nations are connected. Consequently, a significant level of dependency among the panel variables is visible, meaning that one country’s disturbances tend to propagate to other BRICS nations.
Table 2.
Cross-Sectional Dependence Analysis.
After making sure there is cross-sectional dependency, we ran the CIPS test—second generation panel unit root test—on the variables’ integration orders. Table 3 displays the results of the unit root test as well as the variables’ apparent integration using a different order. To take the possibility of serial correlations into consideration, we use the lag of the variable. Also included in the test equation are drifts and trends. At the 1% level of significance, the CIPS unit root test consistently finds that all variables are stationary at their first difference.
Table 3.
Unit Root Analysis.
Table 4 shows that the Pesaran slope heterogeneity test found the issue of slope heterogeneity in the data, as demonstrated by the significant delta and adjusted delta results. Both conventional unit root testing and co-integration techniques may be affected by this.
Table 4.
Slope Homogeneity Test.
Based on Kao’s [91] panel co-integration test, the findings in Table 5 show the long-term link between the explanatory variables and the ecological footprint. This problem leads us to conclude that the current model’s variables have a long-term relationship. Overall, we find that, when the control variables are considered, ecological footprint maintains a long-term equilibrium relationship with green technology innovation and institutional quality.
Table 5.
Panel Kao Co-integration Test.
The influence of each variable (Ins, UR, NRR, GTI, EC, and REC) on ecological footprint is examined using the Driscoll–Kraay technique. Table 6 presents the results of the Driscoll–Kraay and panel quantile regression techniques (its results have been made at the 50% quantile of each model) concerning the impact of energy consumption, institutional quality, and green technological innovation on the ecological footprint of the economies of the BRICS countries. The BRICS nations’ ecological footprint is heavily impacted by several factors, including urbanization, rent from natural resources, renewable energy sources, institutional quality, and green technology innovation, as well as energy consumption.
Table 6.
Driscoll–Kraay and Panel Quantile Regression Estimations.
Model 1 in Table 6 looked at each independent variable (Ins, UR, NRR, GTI, EC, and REC) to find the relationship with an ecological footprint. Model 1 in Table 6 looked at the relationships with an ecological footprint for each independent variable (Ins, UR, NRR, GTI, EC, and REC). Model 2 has also determined the combined influence of energy consumption and green technological innovation in the form of interaction terms. Similarly, Model 3 illustrates the interaction term’s combined impact in terms of green technical innovation and institutional quality. The coefficients for renewable energy consumption, green technical innovation, and institutional quality are all negative and substantial.
Model 1’s conclusion shows that a 1% increase in institutional quality (Ins) directly reduces the ecological footprint for DKr and PQ by 0.3232 percent and 0.0549 percent, respectively. The outcomes are similar to those of Raza et al. [97] and Qing et al. [98]. By supporting effective environmental governance, promoting sustainable practices, and upholding the law, strong institutional quality can assist the BRICS countries in minimizing their environmental impact. Robust institutions that guarantee accountability, openness in decision-making, and the rule of law are necessary for upholding environmental regulations and making polluters answerable [99].
According to Model 1, for DKr and PQ, an increase in urbanization (UR) of 1% corresponds to an increase in the ecological footprint of 0.6585% and 0.1383%, respectively. The results are consistent with those of Abdo et al. [100] and Arif et al. [101]. Studies such as the one conducted by Seto et al. [102], which highlights the environmental consequences of urban growth in fast-expanding regions such as the BRICS countries, lend credence to this. Furthermore, urbanization in developing countries is linked to expanding ecological footprints and environmental deterioration, according to a study by Angel et al. [103].
Next, the ecological footprint for the DrK and PQ approaches rises by 0.1156% and 0.0236%, as well, for every 1% increase in natural resource rent (NRR), according to Model 1. The results are similar to those of Ahmad, Jiang, Majeed, Umar, Khan, and Muhammad [38] and Sun, Tian, Mehmood, Zhang, and Tariq [56].This is because there is a lack of consideration for sustainability when encouraging resource mining and exploitation. Ecological footprints are exacerbated when governments or corporations take natural resources for financial gain, often leading to habitat destruction, biodiversity loss, and environmental deterioration. In addition, if the proceeds from resource extraction are not reinvested in sustainable development or conservation initiatives, a vicious cycle of resource depletion and environmental destruction could continue. Sustainable resource management and fair resource rent distribution minimize ecological footprints and protect the environment in emerging countries such as the BRICS nations [104].
Further, the ecological footprint for DKr and PQ reduces by 0.3537 and 0.1020 percent, respectively, with a 1% increase in green technological innovation (GTI), according to Model 1. The outcomes align with those of Yang, Jahanger, and Ali [37], Ahmad, Youjin, Žiković, and Belyaeva [34], and Razzaq, Sharif, Afshan, and Li [35]. Green technology innovation has the potential to decrease the ecological footprint of the BRICS countries through promoting the development and use of more efficient and cleaner technologies in various industries. These advancements boost resource efficiency in manufacturing processes, make switching from fossil fuels to renewable energy sources easier, and enhance waste management strategies. Green technology also aids in reducing greenhouse gas emissions and the effects of climate change, which lowers ecological footprints overall [105].
After that, a 1% increase in energy consumption (EC) results in a 1.2735 percentage point spike in the ecological footprint for case DKr and a 0.0785 percent gain for case PQ. The outcomes are steady with those of Qayyum et al. [106] and Lu [107]. The BRICS countries’ high reliance on fossil fuels raises greenhouse gas emissions and damages the ecosystem; hence, their energy consumption might harm the environment. High energy use is usually the result of transportation, manufacturing, and domestic needs, which exacerbates pollution, ruins habitats, and depletes resources. Research highlighting the significant environmental consequences of energy consumption in emerging countries such as the BRICS group, such as that performed by Mi et al. [108], supports this.
For DKr and PQ, the ecological footprint decreased by 0.2491% and 0.3535%, respectively, while the renewable energy consumption (REC) increased by 1%. The results accord with Yasin, Ahmad, Amin, Sattar, and Hashmat [3], Raza, Habib, and Hashmi [97], and Sahoo et al. [109]. The BRICS countries minimize their ecological footprints by using renewable energy, lowering greenhouse gas emissions, preventing environmental deterioration, and promoting sustainable energy practices. By harnessing renewable energy sources like solar, wind, and hydroelectric power, these countries may reduce their reliance on fossil fuels, which are significant contributors to habitat destruction, air and water pollution, and climate change. Renewable energy has significant environmental benefits for developing economies like those of the BRICS group [110].
In addition, Model 2 shows a robust negative interaction effect between energy consumption (EC) and green technological innovation (GTI) for both DKr and PQ. This finding suggests that GTI is a moderating factor, lowering pollutant emissions and, thus, the environmental impact of energy use. The results follow those of Kihombo, Ahmed, Chen, Adebayo, and Kirikkaleli [30] and Yang, Jahanger, and Ali [37]. This finding supports the notion that investing in green technologies holds the potential for achieving environmental sustainability.
Afterward, we analyzed Model 3 and found a statistically significant negative coefficient for the interaction term, including GTI and Ins. This suggests that GTI moderates the relationship between environmental outcomes and institutional quality, enhancing the beneficial effects of robust institutions on reducing environmental challenges. The findings align with the research conducted by Warsame, Sheik-Ali, Mohamed, and Sarkodie [51] and Sayed, Wilberforce, Elsaid, Rabaia, Abdelkareem, Chae, and Olabi [46]. These findings underscore the nuanced impacts of various factors on environmental outcomes.
6. Conclusions, Policy Implications, and Limitations
This study, spanning 1995 to 2022, investigated the complex interplay between energy consumption, institutional quality, green technological advancements, and the ecological footprint of the BRICS nations (Brazil, Russia, India, China, and South Africa). While factors like urbanization and resource extraction were found to contribute to a larger ecological footprint, the study highlights the crucial role of green technological advancements and robust institutional frameworks in mitigating this impact. Our findings, based on advanced statistical analyses, reveal that green innovation significantly mitigates the ecological footprint, particularly when combined with strong institutions and responsible energy consumption.
This study’s findings translate into actionable policy recommendations for BRICS nations seeking sustainable development. Prioritizing investment in green technologies like renewable energy and efficient infrastructure, alongside fostering good governance through transparent regulations and public participation, can significantly contribute to a smaller ecological footprint. Additionally, promoting responsible energy use through public awareness campaigns and pricing mechanisms that reflect environmental costs can further support sustainable practices.
BRICS nations can achieve sustainable development through green innovation by strategically investing in solar and wind energy projects facilitated by streamlined permitting processes. Additionally, investments in energy-efficient buildings and smart grids, coupled with carbon-pricing mechanisms, can significantly reduce energy consumption. Strengthening institutions and promoting responsible energy consumption are crucial aspects of this approach. By decoupling economic growth from environmental degradation, BRICS nations can benefit their citizens and contribute to global efforts in combating climate change and fostering a sustainable future for all.
Limitations
This research provides insights into the beneficial impact of green innovation on ecological footprints in BRICS countries, while also recognizing specific constraints. The research primarily examines a defined period (1995–2022) and may not include the changing patterns of energy use, environmentally friendly technology, and institutional structures. Furthermore, the study mostly focuses on ecological footprints, and a more comprehensive evaluation that incorporates other environmental indicators like air and water pollution might provide a more comprehensive perspective. Moreover, the study employs data from the five BRICS nations, and assessing its applicability to other emerging economies may need additional research due to their distinct socio-economic circumstances. To overcome these limitations, future research could consider extending the duration of the study, investigating a broader spectrum of environmental variables, and broadening the analysis to include a more varied group of developing countries.
Author Contributions
Writing—original draft preparation, J.Z.; Conceptualization, validation, and formal analysis, I.Y. All authors have read and agreed to the published version of the manuscript.
Funding
This research received no external funding.
Institutional Review Board Statement
Not applicable.
Informed Consent Statement
Not applicable.
Data Availability Statement
The data presented in this study are available at https://www.footprintnetwork.org/ and https://databank.worldbank.org/, accessed on 25 January 2024.
Conflicts of Interest
The authors declare no conflict of interest.
Appendix A
Table A1.
PCA for Institutional Quality Index.
Table A1.
PCA for Institutional Quality Index.
| Component | Eigenvalue | Difference | Proportion | Cumulative |
| 1 | 4.522430 | 3.639180 | 0.7437 | 0.7537 |
| 2 | 0.883248 | 0.669169 | 0.1472 | 0.9009 |
| 3 | 0.214078 | 0.017863 | 0.0357 | 0.9366 |
| 4 | 0.196215 | 0.081412 | 0.0327 | 0.9693 |
| 6 | 0.069230 | 0.0115 | 1.0000 | |
| Demo Indicators | Factor Loadings | Unexplained | FD Indicators | KMO |
| CC | 0.4405 | 0.1226 | Overall | 0.8698 |
| GE | 0.4392 | 0.1276 | ||
| PSAV | 0.4252 | 0.1824 | ||
| RQ | 0.4478 | 0.0929 | ||
| RL | 0.4419 | 0.1167 | ||
| VA | 0.1909 | 0.8353 | ||
| Bartlett’s test for sphericity: 1085.771 (0.000) | ||||
Note: Only the first component was extracted. A sample’s statistical analysis suitability is measured by Kaiser–Meyer–Olkin (KMO).
Table A2.
Literature Review Summary.
Table A2.
Literature Review Summary.
| Authors | Region and Time | Variables | Methodology | Findings |
|---|---|---|---|---|
| Yasin, Ahmad, Amin, Sattar and Hashmat [3] | BRICS, 1995–2017 | Agricultural production, renewable energy, energy consumption, financial development, forest rent, domestic investment | Panel Spatial Correlation Consistent Least-Squares Dummy Variables (PSCC-LSDV) estimation and Panel Quantile Regression (PQR) | Financial development, renewable energy, and agricultural production help to mitigate the carbon emissions and ecological footprint |
| Saqib, Ozturk, Usman, Sharif and Razzaq [81] | United States,1990Q1–2018Q4 | Climate technologies, trade, and consumption-based carbon emissions (CCE) | Novel QARDL and Granger Causality-in-Quantiles | The use of recycling and climate-related technology effectively reduces the impact of CCE in the long term. |
| Islam, Shahbaz, Sultana, Wang, Sohag and Abbas [36] | Bangladesh, 1980–2020 | Net savings, Natural resource depletion, Technological innovation (TI), democracy, CO2 emissions | NARDL | TI negative shock can raise CO2 emissions |
| Yang, Jahanger and Ali [37] | BRICS countries, 1990–2016 | Remittance Inflows, Financial Development, Technological Innovations, Ecological Footprint (EF) | Robust econometric (second-generation) techniques | BRICS countries’ EFs have decreased due to technological advancement. |
| Kihombo, Ahmed, Chen, Adebayo and Kirikkaleli [30] | MENA (Middle East and North Africa) and West Asian nations, 1990–2017 | Technological innovation, Financial Development, Economic growth, Ecological Footprint | FMOLS technique | Modern technologies have the potential to enhance environmental quality |
| Ahmad, Jiang, Majeed, Umar, Khan and Muhammad [38] | Emerging economies, 1984–2016 | Natural Resources, Technological Innovations, Economic Growth, Ecological Footprint (EF) | CS-ARDL method | Technical progress is detrimental to EF |
| Koengkan and Fuinhas [39] | Latin American and Caribbean (LAC), 1990 to 2014 | Carbon dioxide emissions (CO2), Renewable Energy Transition (RET), Gross domestic production (GDP), Trade openness, Urbanization index | Panel Autoregressive Distributed lags (PARDL) model | RET in the short and long-run has a negative impact on emissions of CO2 |
| Usman, Alola and Sarkodie [41] | United States, 1985Q1–2014Q4 | Renewable Energy Consumption, Economic Growth, Biocapacity, Trade Policy, Ecological Footprint | ARDL model | Increased use of renewable energy sources hurts the ecological footprint, which may be linked to a decrease in environmental deterioration. |
| Shahzad, Fareed, Shahzad and Shahzad [43] | United States (US), 1965Q1–2017Q4 | Economic Complexity (EC), Energy Consumption (FFEC), Ecological Footprint (EF) | QARDL model | EC and FFEC substantially augment the EF in the US. |
| Usman, Akadiri and Adeshola [44] | USA, 1985Q1 to 2014Q4 | Renewable Energy (REN), Globalization (GLOB), Ecological Footprint (EF), Financial Development (FD), Real Output (REO) | ARDL estimation approach | REN and REO exhibit a detrimental influence on EF, while FD and GLOB exert a positive influence on EF. |
| Umar, Ji, Kirikkaleli and Alola [45] | USA, 1981Q1 and 2019Q4 | Biomass Energy Consumption (BEC), Fossil Fuel (FF), Energy Consumption (EC), Economic Growth (GDP), CO2 emissions | FMOLS, DOLS, and CCR | The reduction in transportation-related emissions may be attributed to both BEC and real GDP, as opposed to FF. |
| Yang, Ali, Hashmi and Jahanger [48] | Forty Two Developing countries, 1984–2016 | Income Inequality, Institutional Quality (IQ), carbon dioxide | Driscoll–Kraay regression, FMOLS, Pooled Mean Group (PMG) | High pollution levels and poor economic performance are associated with low IQ in developing countries. |
| Jahanger, Usman and Ahmad [50] | Seventy Three Developing nations, 1990–2018 | Natural Resources, Institutional Quality, carbon emissions, Globalization | Two-Stage least square, Panel threshold techniques | Institutions with greater degrees of excellence had reduced CO2 emissions. |
| Warsame, Sheik-Ali, Mohamed and Sarkodie [51] | Somalia, 1990–2017 | Arable Land (Environmental Degradation), Renewable Energy, Population, Institutional Quality, Economic Growth, Gross Capital Formation | ARDL | Sustainable ecosystems are the result of high-quality institutions, and they also found a link between environmental degradation and institutional quality. |
| Hussain and Mahmood [52] | Pakistan, 1984–2019 | Institutional Quality (IQ), Ecological Footprint (EF), Energy Consumption (EC), GDP | Non-linear ARDL | Positive shocks harm EF while negative shocks have a good effect. EF increases with GDP and EC but decreases significantly with better IQ |
| Rehman, Gill and Ali [54] | ASEAN, 1990–2018 | ICT, Institutional Quality (IQ), GDP, Energy Consumption (EC), Ecological Footprint (EF) | Pooled Mean Group (PMG) estimator | A clean atmosphere and lowered EF are the results of high-quality institutions |
| Emmanuel, et al. [55] | 101 developing nations, 1995–2017 | Foreign Capital, Domestic Capital Formation, Institutional Quality (IQ), Democracy, Ecological Footprint (EF) | Dynamic Common Correlation Effect (DCCE) technique | Raising the IQ of different estimators raises the atmosphere’s level. |
| Sun, Tian, Mehmood, Zhang and Tariq [56] | N-11 nations, 1990–2018 | Income Inequality (IINEQ), Natural Resources (NAT), Human Development (HD), and quality of institutions (IQ), Ecological Footprint (EF) | CS-ARDL method | Improvements in NAT, HD, and IQ have a positive effect on the environment. IINEQ exacerbates social disparities, thereby exerting a detrimental impact on the ecosystem. |
| Alola, Bekun and Sarkodie [58] | 16-EU countries,1997–2014 | Ecological Footprint (EF), Real GDP, Trade Openness, Fertility Rate, Renewable (REN), Non-renewable Energy Consumption (NON-REN) | PMG-ARDL model | The role of NON-REN in depleting environmental quality while REN was found to improve environmental sustainability. |
| Le and Ozturk [60] | 47 Emerging Market and Developing Economies (EMDEs), 1990–2014 | Globalization (GLOB), Financial Development (FD), Government Expenditures (GOVEXP), Institutional Quality (IQ), CO2 emissions, Energy Consumption (EC), GDP per capita | CCEMG, AMG, DCCE | GLOB, FD, and EC increase CO2 emissions |
| Hassan, Xia, Khan and Shah [62] | Pakistan, 1970–2014 | GDP, Natural Resources (NR), Ecological Footprint (EF) | ARDL model | Pakistan’s NR and GDP boost its EF |
| Majeed, Wang, Zhang and Kirikkaleli [63] | Gulf Cooperation Council (GCC) nations, 1990 to 2018 | Natural Resources (NR), Economic Globalization (EGLOB), Energy Consumption (EC), CO2, Urbanization (URBAN), Economic Growth (EG) | CS-ARDL approach | Renewable Energy Sources (RES), NR, and EGLOB may all contribute to better environmental conditions. |
References
- Anwar, M.A.; Madni, G.R.; Yasin, I. Environmental quality, forestation, and health expenditure: A cross-country evidence. Environ. Dev. Sustain. 2021, 23, 16454–16480. [Google Scholar] [CrossRef]
- Hashmi, N.I.; Alam, N.; Jahanger, A.; Yasin, I.; Murshed, M.; Khudoykulov, K. Can financial globalization and good governance help turning emerging economies carbon neutral? Evidence from members of the BRICS-T. Environ. Sci. Pollut. Res. 2023, 30, 39826–39841. [Google Scholar] [CrossRef] [PubMed]
- Yasin, I.; Ahmad, N.; Amin, S.; Sattar, N.; Hashmat, A. Does agriculture, forests, and energy consumption foster the carbon emissions and ecological footprint? fresh evidence from BRICS economies. Environ. Dev. Sustain. 2024, 1–21. [Google Scholar] [CrossRef]
- Akbar, U.; Li, Q.-L.; Akmal, M.A.; Shakib, M.; Iqbal, W. Nexus between agro-ecological efficiency and carbon emission transfer: Evidence from China. Environ. Sci. Pollut. Res. 2021, 28, 18995–19007. [Google Scholar] [CrossRef]
- Yasin, I.; Naseem, S.; Anwar, M.A.; Madni, G.R.; Mahmood, H.; Murshed, M. An analysis of the environmental impacts of ethnic diversity, financial development, economic growth, urbanization, and energy consumption: Fresh evidence from less-developed countries. Environ. Sci. Pollut. Res. Int. 2022, 29, 79306–79319. [Google Scholar] [CrossRef] [PubMed]
- Nibedita, B.; Irfan, M. Energy mix diversification in emerging economies: An econometric analysis of determinants. Renew. Sustain. Energy Rev. 2024, 189, 114043. [Google Scholar] [CrossRef]
- Ahmad, M.; Ahmed, Z.; Yang, X.; Hussain, N.; Sinha, A. Financial development and environmental degradation: Do human capital and institutional quality make a difference? Gondwana Res. 2022, 105, 299–310. [Google Scholar] [CrossRef]
- Zhang, Y.; Li, L.; Sadiq, M.; Chien, F. The impact of non-renewable energy production and energy usage on carbon emissions: Evidence from China. Energy Environ. 2023, 0958305X221150432. [Google Scholar] [CrossRef]
- Ahmed, Z.; Ahmad, M.; Murshed, M.; Shah, M.I.; Mahmood, H.; Abbas, S. How do green energy technology investments, technological innovation, and trade globalization enhance green energy supply and stimulate environmental sustainability in the G7 countries? Gondwana Res. 2022, 112, 105–115. [Google Scholar] [CrossRef]
- Zhou, R. Economic growth, energy consumption and CO2 emissions—An empirical study based on the Yangtze River economic belt of China. Heliyon 2023, 9, e19865. [Google Scholar] [CrossRef]
- Behera, J.; Mishra, A.K. Renewable and non-renewable energy consumption and economic growth in G7 countries: Evidence from panel autoregressive distributed lag (P-ARDL) model. Int. Econ. Econ. Policy 2020, 17, 241–258. [Google Scholar] [CrossRef]
- Newell, R.; Raimi, D.; Villanueva, S.; Prest, B. Global energy outlook 2021: Pathways from Paris. Resour. Future 2021, 8, 39. [Google Scholar]
- Eren, B.M.; Taspinar, N.; Gokmenoglu, K.K. The impact of financial development and economic growth on renewable energy consumption: Empirical analysis of India. Sci. Total Environ. 2019, 663, 189–197. [Google Scholar] [CrossRef]
- Nikzad, R.; Sedigh, G. Greenhouse gas emissions and green technologies in Canada. Environ. Dev. 2017, 24, 99–108. [Google Scholar] [CrossRef]
- Weina, D.; Gilli, M.; Mazzanti, M.; Nicolli, F. Green inventions and greenhouse gas emission dynamics: A close examination of provincial Italian data. Environ. Econ. Policy Stud. 2016, 18, 247–263. [Google Scholar] [CrossRef]
- Alam, M.M.; Murad, M.W. The impacts of economic growth, trade openness and technological progress on renewable energy use in organization for economic co-operation and development countries. Renew. Energy 2020, 145, 382–390. [Google Scholar] [CrossRef]
- Qi, G.; Shen, L.Y.; Zeng, S.; Jorge, O.J. The drivers for contractors’ green innovation: An industry perspective. J. Clean. Prod. 2010, 18, 1358–1365. [Google Scholar] [CrossRef]
- Qing, L.; Usman, M.; Radulescu, M.; Haseeb, M. Towards the vision of going green in South Asian region: The role of technological innovations, renewable energy and natural resources in ecological footprint during globalization mode. Resour. Policy 2024, 88, 104506. [Google Scholar] [CrossRef]
- Salman, M.; Long, X.; Dauda, L.; Mensah, C.N. The impact of institutional quality on economic growth and carbon emissions: Evidence from Indonesia, South Korea and Thailand. J. Clean. Prod. 2019, 241, 118331. [Google Scholar] [CrossRef]
- Abid, M. Impact of economic, financial, and institutional factors on CO2 emissions: Evidence from sub-Saharan Africa economies. Util. Policy 2016, 41, 85–94. [Google Scholar] [CrossRef]
- Muhammad, S.; Long, X. Rule of law and CO2 emissions: A comparative analysis across 65 belt and road initiative (BRI) countries. J. Clean. Prod. 2021, 279, 123539. [Google Scholar] [CrossRef]
- Lau, L.-S.; Choong, C.-K.; Eng, Y.-K. Carbon dioxide emission, institutional quality, and economic growth: Empirical evidence in Malaysia. Renew. Energy 2014, 68, 276–281. [Google Scholar] [CrossRef]
- Ritzen, J.; Woolcock, M. Social cohesion, public policy, and economic growth: Implications for countries in transition. In Proceedings of the Address Prepared for the Annual Bank Conference on Development Economics (Europe), Paris, France, 26–28 June 2000. [Google Scholar]
- Wang, Z.; Zhang, B.; Wang, B. The moderating role of corruption between economic growth and CO2 emissions: Evidence from BRICS economies. Energy 2018, 148, 506–513. [Google Scholar] [CrossRef]
- Damania, R.; Fredriksson, P.G.; List, J.A. Trade liberalization, corruption, and environmental policy formation: Theory and evidence. J. Environ. Econ. Manag. 2003, 46, 490–512. [Google Scholar] [CrossRef]
- Zhang, Y.-J.; Wang, W. Do renewable energy consumption and service industry development contribute to CO2 emissions reduction in BRICS countries? Environ. Sci. Pollut. Res. 2019, 26, 31632–31643. [Google Scholar] [CrossRef] [PubMed]
- Hussain, J.; Khan, A.; Zhou, K. The impact of natural resource depletion on energy use and CO2 emission in Belt & Road Initiative countries: A cross-country analysis. Energy 2020, 199, 117409. [Google Scholar]
- Wu, L.; Liu, S.; Liu, D.; Fang, Z.; Xu, H. Modelling and forecasting CO2 emissions in the BRICS (Brazil, Russia, India, China, and South Africa) countries using a novel multi-variable grey model. Energy 2015, 79, 489–495. [Google Scholar] [CrossRef]
- Sharif, A.; Meo, M.S.; Chowdhury, M.A.F.; Sohag, K. Role of solar energy in reducing ecological footprints: An empirical analysis. J. Clean. Prod. 2021, 292, 126028. [Google Scholar] [CrossRef]
- Kihombo, S.; Ahmed, Z.; Chen, S.; Adebayo, T.S.; Kirikkaleli, D. Linking financial development, economic growth, and ecological footprint: What is the role of technological innovation? Environ. Sci. Pollut. Res. 2021, 28, 61235–61245. [Google Scholar] [CrossRef] [PubMed]
- Jahanger, A.; Usman, M.; Murshed, M.; Mahmood, H.; Balsalobre-Lorente, D. The linkages between natural resources, human capital, globalization, economic growth, financial development, and ecological footprint: The moderating role of technological innovations. Resour. Policy 2022, 76, 102569. [Google Scholar] [CrossRef]
- Yasin, I.; Ahmad, N.; Chaudhary, M.A. Catechizing the Environmental-Impression of Urbanization, Financial Development, and Political Institutions: A Circumstance of Ecological Footprints in 110 Developed and Less-Developed Countries. Soc. Indic. Res. 2020, 147, 621–649. [Google Scholar] [CrossRef]
- Yasin, I.; Aslam, A.; Siddik, A.B.; Abbass, K.; Murshed, M. Offshoring the scarring causes and effects of environmental challenges faced by the advanced world: An empirical evidence. Environ. Sci. Pollut. Res. Int. 2023, 30, 79335–79345. [Google Scholar] [CrossRef] [PubMed]
- Ahmad, N.; Youjin, L.; Žiković, S.; Belyaeva, Z. The effects of technological innovation on sustainable development and environmental degradation: Evidence from China. Technol. Soc. 2023, 72, 102184. [Google Scholar] [CrossRef]
- Razzaq, A.; Sharif, A.; Afshan, S.; Li, C.J. Do climate technologies and recycling asymmetrically mitigate consumption-based carbon emissions in the United States? New insights from Quantile ARDL. Technol. Forecast. Soc. Chang. 2023, 186, 122138. [Google Scholar] [CrossRef]
- Islam, M.M.; Shahbaz, M.; Sultana, T.; Wang, Z.; Sohag, K.; Abbas, S. Changes in environmental degradation parameters in Bangladesh: The role of net savings, natural resource depletion, technological innovation, and democracy. J. Environ. Manag. 2023, 343, 118190. [Google Scholar] [CrossRef]
- Yang, B.; Jahanger, A.; Ali, M. Remittance inflows affect the ecological footprint in BICS countries: Do technological innovation and financial development matter? Environ. Sci. Pollut. Res. 2021, 28, 23482–23500. [Google Scholar] [CrossRef]
- Ahmad, M.; Jiang, P.; Majeed, A.; Umar, M.; Khan, Z.; Muhammad, S. The dynamic impact of natural resources, technological innovations and economic growth on ecological footprint: An advanced panel data estimation. Resour. Policy 2020, 69, 101817. [Google Scholar] [CrossRef]
- Koengkan, M.; Fuinhas, J.A. Exploring the effect of the renewable energy transition on CO2 emissions of Latin American & Caribbean countries. Int. J. Sustain. Energy 2020, 39, 515–538. [Google Scholar]
- Maji, I.K.; Adamu, S. The impact of renewable energy consumption on sectoral environmental quality in Nigeria. Clean. Environ. Syst. 2021, 2, 100009. [Google Scholar] [CrossRef]
- Usman, O.; Alola, A.A.; Sarkodie, S.A. Assessment of the role of renewable energy consumption and trade policy on environmental degradation using innovation accounting: Evidence from the US. Renew. Energy 2020, 150, 266–277. [Google Scholar] [CrossRef]
- Khan, M.M.; Zaman, K.; Irfan, D.; Awan, U.; Ali, G.; Kyophilavong, P.; Shahbaz, M.; Naseem, I. Triangular relationship among energy consumption, air pollution and water resources in Pakistan. J. Clean. Prod. 2016, 112, 1375–1385. [Google Scholar] [CrossRef]
- Shahzad, U.; Fareed, Z.; Shahzad, F.; Shahzad, K. Investigating the nexus between economic complexity, energy consumption and ecological footprint for the United States: New insights from quantile methods. J. Clean. Prod. 2021, 279, 123806. [Google Scholar] [CrossRef]
- Usman, O.; Akadiri, S.S.; Adeshola, I. Role of renewable energy and globalization on ecological footprint in the USA: Implications for environmental sustainability. Environ. Sci. Pollut. Res. 2020, 27, 30681–30693. [Google Scholar] [CrossRef] [PubMed]
- Umar, M.; Ji, X.; Kirikkaleli, D.; Alola, A.A. The imperativeness of environmental quality in the United States transportation sector amidst biomass-fossil energy consumption and growth. J. Clean. Prod. 2021, 285, 124863. [Google Scholar] [CrossRef]
- Sayed, E.T.; Wilberforce, T.; Elsaid, K.; Rabaia, M.K.H.; Abdelkareem, M.A.; Chae, K.-J.; Olabi, A. A critical review on environmental impacts of renewable energy systems and mitigation strategies: Wind, hydro, biomass and geothermal. Sci. Total Environ. 2021, 766, 144505. [Google Scholar] [CrossRef] [PubMed]
- Gani, A. Fossil fuel energy and environmental performance in an extended STIRPAT model. J. Clean. Prod. 2021, 297, 126526. [Google Scholar] [CrossRef]
- Yang, B.; Ali, M.; Hashmi, S.H.; Jahanger, A. Do income inequality and institutional quality affect CO2 emissions in developing economies? Environ. Sci. Pollut. Res. 2022, 29, 42720–42741. [Google Scholar] [CrossRef]
- Ayad, H.; Sari-Hassoun, S.E.; Usman, M.; Ahmad, P. The impact of economic uncertainty, economic growth and energy consumption on environmental degradation in MENA countries: Fresh insights from multiple thresholds NARDL approach. Environ. Sci. Pollut. Res. 2023, 30, 1806–1824. [Google Scholar] [CrossRef]
- Jahanger, A.; Usman, M.; Ahmad, P. Investigating the effects of natural resources and institutional quality on CO2 emissions during globalization mode in developing countries. Int. J. Environ. Sci. Technol. 2023, 20, 9663–9682. [Google Scholar] [CrossRef]
- Warsame, A.A.; Sheik-Ali, I.A.; Mohamed, J.; Sarkodie, S.A. Renewables and institutional quality mitigate environmental degradation in Somalia. Renew. Energy 2022, 194, 1184–1191. [Google Scholar] [CrossRef]
- Hussain, M.; Mahmood, N. Do positive and negative shocks of institutional quality affect the ecological footprint in a developing economy? Soc. Responsib. J. 2023, 19, 1365–1378. [Google Scholar] [CrossRef]
- Bekun, F.V.; Gyamfi, B.A.; Köksal, C.; Taha, A. Impact of financial development, trade flows, and institution on environmental sustainability in emerging markets. Energy Environ. 2023, 0958305X221147603. [Google Scholar] [CrossRef]
- Rehman, S.u.; Gill, A.R.; Ali, M. Information and communication technology, institutional quality, and environmental sustainability in ASEAN countries. Environ. Sci. Pollut. Res. 2023, 1–14. [Google Scholar] [CrossRef]
- Emmanuel, O.N.B.; Fonchamnyo, D.C.; Thierry, M.A.; Dinga, G.D. Ecological footprint in a global perspective: The role of domestic investment, FDI, democracy and institutional quality. J. Glob. Responsib. 2023, 14, 431–451. [Google Scholar] [CrossRef]
- Sun, Y.; Tian, W.; Mehmood, U.; Zhang, X.; Tariq, S. How do natural resources, urbanization, and institutional quality meet with ecological footprints in the presence of income inequality and human capital in the next eleven countries? Resour. Policy 2023, 85, 104007. [Google Scholar] [CrossRef]
- Godil, D.I.; Sharif, A.; Ali, M.I.; Ozturk, I.; Usman, R. The role of financial development, R&D expenditure, globalization and institutional quality in energy consumption in India: New evidence from the QARDL approach. J. Environ. Manag. 2021, 285, 112208. [Google Scholar]
- Alola, A.A.; Bekun, F.V.; Sarkodie, S.A. Dynamic impact of trade policy, economic growth, fertility rate, renewable and non-renewable energy consumption on ecological footprint in Europe. Sci. Total Environ. 2019, 685, 702–709. [Google Scholar] [CrossRef] [PubMed]
- Hassan, S.T.; Khan, S.U.-D.; Xia, E.; Fatima, H. Role of institutions in correcting environmental pollution: An empirical investigation. Sustain. Cities Soc. 2020, 53, 101901. [Google Scholar] [CrossRef]
- Le, H.P.; Ozturk, I. The impacts of globalization, financial development, government expenditures, and institutional quality on CO2 emissions in the presence of environmental Kuznets curve. Environ. Sci. Pollut. Res. 2020, 27, 22680–22697. [Google Scholar] [CrossRef]
- Ahmed, Z.; Asghar, M.M.; Malik, M.N.; Nawaz, K. Moving towards a sustainable environment: The dynamic linkage between natural resources, human capital, urbanization, economic growth, and ecological footprint in China. Resour. Policy 2020, 67, 101677. [Google Scholar] [CrossRef]
- Hassan, S.T.; Xia, E.; Khan, N.H.; Shah, S.M.A. Economic growth, natural resources, and ecological footprints: Evidence from Pakistan. Environ. Sci. Pollut. Res. 2019, 26, 2929–2938. [Google Scholar] [CrossRef] [PubMed]
- Majeed, A.; Wang, L.; Zhang, X.; Kirikkaleli, D. Modeling the dynamic links among natural resources, economic globalization, disaggregated energy consumption, and environmental quality: Fresh evidence from GCC economies. Resour. Policy 2021, 73, 102204. [Google Scholar] [CrossRef]
- Yasin, I.; Ahmad, N.; Chaudhary, M.A. The impact of financial development, political institutions, and urbanization on environmental degradation: Evidence from 59 less-developed economies. Environ. Dev. Sustain. 2021, 23, 6698–6721. [Google Scholar] [CrossRef]
- Dietz, T.; Rosa, E.A. Effects of population and affluence on CO2 emissions. Proc. Natl. Acad. Sci. USA 1997, 94, 175–179. [Google Scholar] [CrossRef] [PubMed]
- Wang, P.; Wu, W.; Zhu, B.; Wei, Y. Examining the impact factors of energy-related CO2 emissions using the STIRPAT model in Guangdong Province, China. Appl. Energy 2013, 106, 65–71. [Google Scholar] [CrossRef]
- Li, B.; Liu, X.; Li, Z. Using the STIRPAT model to explore the factors driving regional CO2 emissions: A case of Tianjin, China. Nat. Hazards 2015, 76, 1667–1685. [Google Scholar] [CrossRef]
- Huang, J.; Li, X.; Wang, Y.; Lei, H. The effect of energy patents on China’s carbon emissions: Evidence from the STIRPAT model. Technol. Forecast. Soc. Chang. 2021, 173, 121110. [Google Scholar] [CrossRef]
- York, R.; Rosa, E.A.; Dietz, T. STIRPAT, IPAT and ImPACT: Analytic tools for unpacking the driving forces of environmental impacts. Ecol. Econ. 2003, 46, 351–365. [Google Scholar] [CrossRef]
- Uddin, G.A.; Alam, K.; Gow, J. Ecological and economic growth interdependency in the Asian economies: An empirical analysis. Environ. Sci. Pollut. Res. 2019, 26, 13159–13172. [Google Scholar] [CrossRef]
- Christoforidis, T.; Katrakilidis, C. The dynamic role of institutional quality, renewable and non-renewable energy on the ecological footprint of OECD countries: Do institutions and renewables function as leverage points for environmental sustainability? Environ. Sci. Pollut. Res. 2021, 28, 53888–53907. [Google Scholar] [CrossRef]
- Saba, C.S.; David, O.O. Convergence patterns in global ICT: Fresh insights from a club clustering algorithm. Telecommun. Policy 2020, 44, 102010. [Google Scholar] [CrossRef]
- Acheampong, A.O.; Dzator, J.; Savage, D.A. Renewable energy, CO2 emissions and economic growth in sub-Saharan Africa: Does institutional quality matter? J. Policy Model. 2021, 43, 1070–1093. [Google Scholar] [CrossRef]
- Bhattarai, M.; Hammig, M. Institutions and the environmental Kuznets curve for deforestation: A crosscountry analysis for Latin America, Africa and Asia. World Dev. 2001, 29, 995–1010. [Google Scholar] [CrossRef]
- Dada, J.T.; Al-Faryan, M.A.S. Linking per capita income, renewable energy, natural resources, trade, and Urbanisation to material footprint: Insights from Saudi Arabia. Energy Nexus 2024, 13, 100269. [Google Scholar] [CrossRef]
- Charfeddine, L.; Mrabet, Z. The impact of economic development and social-political factors on ecological footprint: A panel data analysis for 15 MENA countries. Renew. Sustain. Energy Rev. 2017, 76, 138–154. [Google Scholar] [CrossRef]
- Zeraibi, A.; Balsalobre-Lorente, D.; Murshed, M. The influences of renewable electricity generation, technological innovation, financial development, and economic growth on ecological footprints in ASEAN-5 countries. Environ. Sci. Pollut. Res. 2021, 28, 51003–51021. [Google Scholar] [CrossRef] [PubMed]
- Usman, M.; Balsalobre-Lorente, D.; Jahanger, A.; Ahmad, P. Are Mercosur economies going green or going away? An empirical investigation of the association between technological innovations, energy use, natural resources and GHG emissions. Gondwana Res. 2023, 113, 53–70. [Google Scholar] [CrossRef]
- Raghutla, C.; Chittedi, K.R. The effect of technological innovation and clean energy consumption on carbon neutrality in top clean energy-consuming countries: A panel estimation. Energy Strategy Rev. 2023, 47, 101091. [Google Scholar] [CrossRef]
- Yang, Q.; Huo, J.; Saqib, N.; Mahmood, H. Modelling the effect of renewable energy and public-private partnership in testing EKC hypothesis: Evidence from methods moment of quantile regression. Renew. Energy 2022, 192, 485–494. [Google Scholar] [CrossRef]
- Saqib, N.; Ozturk, I.; Usman, M.; Sharif, A.; Razzaq, A. Pollution haven or halo? How European countries leverage FDI, energy, and human capital to alleviate their ecological footprint. Gondwana Res. 2023, 116, 136–148. [Google Scholar] [CrossRef]
- Apergis, N.; Ozturk, I. Testing environmental Kuznets curve hypothesis in Asian countries. Ecol. Indic. 2015, 52, 16–22. [Google Scholar] [CrossRef]
- Kaiser, H.F. An index of factorial simplicity. Psychometrika 1974, 39, 31–36. [Google Scholar] [CrossRef]
- Nathaniel, S.P.; Murshed, M.; Bassim, M. The nexus between economic growth, energy use, international trade and ecological footprints: The role of environmental regulations in N11 countries. Energy Ecol. Environ. 2021, 6, 496–512. [Google Scholar] [CrossRef]
- Pesaran, M.H. General diagnostic tests for cross-sectional dependence in panels. Empir. Econ. 2021, 60, 13–50. [Google Scholar] [CrossRef]
- Pesaran, M.H.; Yamagata, T. Testing slope homogeneity in large panels. J. Econom. 2008, 142, 50–93. [Google Scholar] [CrossRef]
- Swamy, P.A. Efficient inference in a random coefficient regression model. Econom. J. Econom. Soc. 1970, 38, 311–323. [Google Scholar] [CrossRef]
- Im, K.S.; Pesaran, M.H.; Shin, Y. Testing for unit roots in heterogeneous panels. J. Econom. 2003, 115, 53–74. [Google Scholar] [CrossRef]
- Pesaran, M.H. A simple panel unit root test in the presence of cross-section dependence. J. Appl. Econom. 2007, 22, 265–312. [Google Scholar] [CrossRef]
- Pesaran, M.H. Estimation and Inference in Large Heterogenous Panels with Cross Section Dependence. 2003. Available online: https://papers.ssrn.com/sol3/papers.cfm?abstract_id=385123 (accessed on 1 March 2024).
- Kao, C. Spurious regression and residual-based tests for cointegration in panel data. J. Econom. 1999, 90, 1–44. [Google Scholar] [CrossRef]
- Driscoll, J.C.; Kraay, A.C. Consistent covariance matrix estimation with spatially dependent panel data. Rev. Econ. Stat. 1998, 80, 549–560. [Google Scholar] [CrossRef]
- Baloch, M.A.; Danish; Meng, F. Modeling the non-linear relationship between financial development and energy consumption: Statistical experience from OECD countries. Environ. Sci. Pollut. Res. 2019, 26, 8838–8846. [Google Scholar] [CrossRef] [PubMed]
- Baloch, M.A.; Wang, B. Analyzing the role of governance in CO2 emissions mitigation: The BRICS experience. Struct. Chang. Econ. Dyn. 2019, 51, 119–125. [Google Scholar]
- Ulucak, R.; Ozcan, B. Relationship between energy consumption and environmental sustainability in OECD countries: The role of natural resources rents. Resour. Policy 2020, 69, 101803. [Google Scholar] [CrossRef]
- Abrevaya, J.; Dahl, C.M. The effects of birth inputs on birthweight: Evidence from quantile estimation on panel data. J. Bus. Econ. Stat. 2008, 26, 379–397. [Google Scholar] [CrossRef]
- Raza, A.; Habib, Y.; Hashmi, S.H. Impact of technological innovation and renewable energy on ecological footprint in G20 countries: The moderating role of institutional quality. Environ. Sci. Pollut. Res. 2023, 30, 95376–95393. [Google Scholar] [CrossRef] [PubMed]
- Qing, L.; Li, P.; Mehmood, U. Uncovering the potential impacts of financial inclusion and human development on ecological sustainability in the presence of natural resources and government stability: Evidence from G-20 nations. Resour. Policy 2024, 88, 104446. [Google Scholar] [CrossRef]
- Deacon, R.T.; Mueller, B. Political economy and natural resource use. In Economic Development and Environmental Sustainability: New Policy Options; Oxford University Press: New York, NY, USA, 2006; Volume 122. [Google Scholar]
- Abdo, A.-B.; Bin, L.; Zhang, X.; Saeed, M.; Qahtan, A.S.A.; Ghallab, H.M.H. Spatial analysis of financial development’s effect on the ecological footprint of belt and road initiative countries: Mitigation options through renewable energy consumption and institutional quality. J. Clean. Prod. 2022, 366, 132696. [Google Scholar]
- Arif, M.; Gill, A.R.; Ali, M. Analyzing the non-linear association between urbanization and ecological footprint: An empirical analysis. Environ. Sci. Pollut. Res. 2023, 30, 109063–109076. [Google Scholar] [CrossRef] [PubMed]
- Seto, K.C.; Fragkias, M.; Güneralp, B.; Reilly, M.K. A meta-analysis of global urban land expansion. PLoS ONE 2011, 6, e23777. [Google Scholar] [CrossRef]
- Angel, S.; Parent, J.; Civco, D.L.; Blei, A.; Potere, D. The dimensions of global urban expansion: Estimates and projections for all countries, 2000–2050. Prog. Plan. 2011, 75, 53–107. [Google Scholar] [CrossRef]
- Lele, S.; Springate-Baginski, O.; Lakerveld, R.; Deb, D.; Dash, P. Ecosystem services: Origins, contributions, pitfalls, and alternatives. Conserv. Soc. 2013, 11, 343–358. [Google Scholar] [CrossRef]
- Sovacool, B.K.; Dworkin, M.H. Energy justice: Conceptual insights and practical applications. Appl. Energy 2015, 142, 435–444. [Google Scholar] [CrossRef]
- Qayyum, M.; Yu, Y.; Li, S. The impact of economic complexity on embodied carbon emission in trade: New empirical evidence from cross-country panel data. Environ. Sci. Pollut. Res. 2021, 28, 54015–54029. [Google Scholar] [CrossRef] [PubMed]
- Lu, W.-C. The interplay among ecological footprint, real income, energy consumption, and trade openness in 13 Asian countries. Environ. Sci. Pollut. Res. 2020, 27, 45148–45160. [Google Scholar] [CrossRef]
- Mi, Z.; Zheng, J.; Meng, J.; Zheng, H.; Li, X.; Coffman, D.M.; Woltjer, J.; Wang, S.; Guan, D. Carbon emissions of cities from a consumption-based perspective. Appl. Energy 2019, 235, 509–518. [Google Scholar] [CrossRef]
- Sahoo, M.; Kaushik, S.; Gupta, M.; Islam, M.K.; Nayak, P. Powering a sustainable future: Does economic structure influence the ecological footprint? Sustain. Dev. 2024; early view. [Google Scholar]
- Sovacool, B.K.; Martiskainen, M.; Hook, A.; Baker, L. Decarbonization and its discontents: A critical energy justice perspective on four low-carbon transitions. Clim. Chang. 2019, 155, 581–619. [Google Scholar] [CrossRef]
Disclaimer/Publisher’s Note: The statements, opinions and data contained in all publications are solely those of the individual author(s) and contributor(s) and not of MDPI and/or the editor(s). MDPI and/or the editor(s) disclaim responsibility for any injury to people or property resulting from any ideas, methods, instructions or products referred to in the content. |
© 2024 by the authors. Licensee MDPI, Basel, Switzerland. This article is an open access article distributed under the terms and conditions of the Creative Commons Attribution (CC BY) license (https://creativecommons.org/licenses/by/4.0/).