Article

Chloroplast Haplotype Diversity in the White Oak Populations of the Italian Peninsula, Sicily, and Sardinia

1
Department of Planning, Design, and Architecture Technology (PDTA), Sapienza University of Rome, Via Flaminia 70, 00196 Roma, Italy
2
National Biodiversity Future Center (NBFC), 90133 Palermo, Italy
3
Department of Biosciences and Territory, University of Molise, Via Hertz s.n.c., 86090 Pesche, Italy
4
CNR—Research Institute on Terrestrial Ecosystems (IRET), Viale Guglielmo Marconi 2, 05010 Porano, Italy
5
Department of Agricultural and Forestry Science (DAFNE), University of Tuscia, Via S. Camillo de’ Lellis, 01100 Viterbo, Italy
*
Author to whom correspondence should be addressed.
Forests 2024, 15(5), 864; https://doi.org/10.3390/f15050864
Submission received: 12 April 2024 / Revised: 7 May 2024 / Accepted: 13 May 2024 / Published: 15 May 2024

Abstract

:
A phylogeographic study on the chloroplast DNA of natural white oak forests (Quercus subgen. Quercus, sect. Quercus) was carried out to identify possible haplotype-structured distribution within the Italian Peninsula, Sicily, and Sardinia. Sixty white oak populations belonging to Q. frainetto, Q. robur and the collective groups Q. petraea and Q. pubescens were considered and analyzed by combining five Chloroplast Simple Sequence Repeat (cpSSR) markers. A total of 28 haplotypes were detected. Central and southern Italy displayed the highest variability (14 and 10 haplotypes, respectively), followed by northern Italy (7), Sardinia (7), and Sicily (5). A complex geographical structure of the haplotype distribution emerged, highlighting (i) a high number of low-frequency haplotypes; (ii) the marked isolation of Sardinia; (iii) the occurrence of haplotypes widely distributed throughout the Italian Peninsula; (iv) the idiosyncrasy of Sicily, which exhibits exclusive haplotypes, and haplotypes shared with Sardinia and the rest of the Italian Peninsula. The haplotype distribution was also found to be partially related to the taxonomic identity of the specimens, with the following features emerging: a geographic separation between the central Italy and southern Italy Q. frainetto populations, an unexpected discontinuity between the Calabrian and Sicilian Q. petraea subsp. austrotyrrhenica populations, and the absence of the most common haplotype among the Q. pubescens populations of central and southern Italy.

1. Introduction

Progressing toward a comprehensive assessment of forest biodiversity is crucial to achieving modern and effective governance of territories and landscapes, especially in Southern Europe, which is a too often overlooked long-term repository of molecular, taxonomical, and ecological diversity [1]. The genus Quercus is divided into two subgenera, Cerris and Quercus, and includes more than 400 species [2,3]. It has a mainly Northern Hemisphere distribution, denoting great adaptive plasticity within a wide range of habitats from the desert and Mediterranean maquis to the subtropical rainforest. At the European level, Quercus is a dominant genus and constitutes a great part of the forests of Central and Southern Europe from sea level to the montane belt [4]. The white oaks (Quercus subgenus Quercus sect. Quercus) comprise the most important species characterizing the Temperate deciduous forests’ biome in Central and Southern Europe, representing a very important natural, scientific, economic, and social resource [5]. The actual number of species belonging to white oaks in Europe is a source of great debate among European taxonomists, especially as regards the species composition of the collective groups of Q. pubescens and Q. petraea [6,7,8,9,10,11]. Italy hosts about 1.2 M ha of wooded land dominated by white oaks [12], and consequently, it plays a leading role in this debate. Moreover, some white oak taxa currently considered valid species in the floras and checklists of several S European countries (i.e., Quercus congesta, Q. dalechampii, and Q. virgiliana), together with other critical oaks endemic to southern Italy, Sicily, and Sardinia (i.e., Q. amplifolia, Q. ichnusae, and Q. leptobalana), were described for the first time in Italy [13,14,15,16,17,18,19,20]. Although a clear correlation between the high level of taxonomical–nomenclatural splitting and the nuclear DNA variability among S European white oaks did not emerge from recent studies [21,22,23,24,25,26,27], there can be no denying that the eco-morphological and coenological variability of white oaks observable in nature is extraordinarily high. As far as Italy is concerned, it is probable that the explanation for a great part of this variability is to be found in the significant role played by the Italian Peninsula as a glacial refuge for the thermophilous forests during the end of the Tertiary and the whole of the Quaternary [28]. Chloroplast DNA (cpDNA) variability can be particularly useful for studying natural processes, such as species evolution, reticulation, migration routes, isolation, and drift, and to dissect the geographical patterns of lineage distribution subtending community assembly and diversification, local ecological peculiarities, and regional history. The first investigations on European white oaks’ plastid genome were carried out ca. 30 years ago [29,30] using Restriction Fragment Length Polymorphisms of some PCR-amplified intergenic regions of the cpDNA (PCR-RFLP). Subsequently, Petit et al. [31,32] expanded the analyses to over 2600 European populations and found 39 main variants (haplotypes), grouped into 6 lineages. Three lineages were preserved in southern Italy and major islands during the Quaternary glaciations [33]. Deepening some partial results of this fundamental work, Fineschi et al. [34] provided a more detailed picture of the chloroplast PCR-RFLP variability of the Italian populations, confirming the occurrence of three main plastid lineages and cataloguing six widely distributed and four rare haplotypes. However, neither the sampling strategy nor the interpretation of the results were carried out on the basis of detailed taxonomic and/or biogeographical information. Since then, the entire line of research on the plastid DNA of the Italian white oaks has been considered sufficiently analyzed, with the exception of a few regional contributions limited to restricted areas (see Lupini et al. [35]). Indeed, the PCR-RFLP procedure proved useful in uncovering the complex background of oak cpDNA variability and building initial spatial models on a wide geographical scale. However, the low mutation rate obtained through PCR-RFLP analyses generally does not allow high levels of information at finer spatial scales to be retrieved [36,37,38,39]. Consequently, chloroplast microsatellites (or Simple Sequence Repeats, SSRs) have progressively replaced PCR-RFLPs over the years, becoming the most used markers due to their higher efficacy, low cost, and ease of analyses. Exemplary utilizations of cpSSRs include the assessment of geographic patterns of diversity in other widespread Italian oaks such as Quercus cerris and Quercus suber [40,41] and clear genealogical reconstructions of several white oaks in Western Europe [42], Central Europe [38,43], the Balkans [39,44,45,46], and Northeastern Europe [47,48,49,50]. The emerging scenario unambiguously indicates Southern Europe to have hosted a mosaic of refugia for the persistence of tree species during the Quaternary [28,51], with white oak populations exhibiting complex patterns of genetic variation. A more recent study further highlighted the Italian Peninsula and major islands as a repository of chloroplast DNA diversity and bio-ecological distinctiveness [52]. On these bases, we argue that the long-lasting PCR-RFLP framework of the white oaks in Italy [34] needs a critical re-assessment. Our study carries out a new and updated analysis of the cpDNA variability of white oak populations of the Italian Peninsula, Sicily, and Sardinia using cpSSRs in order to fill the existing gap and upgrade the dated diversity structure currently available. The data obtained will contribute to the creation of more informed sampling designs for future genomic studies and to a better interpretation of recent [26,27,53] and ongoing works [54] on white oaks’ diversity. We will address the following questions: (i) Is it possible to correlate the distribution of haplotypes in natural white oak forests in Italy with biogeographical patterns? (ii) Are there hotspots of genetic diversity and rare or divergent genetic variants worthy of special management and conservation measures? (iii) Is it possible to identify a haplotype structure linked to the taxonomical identity of the Italian white oak populations?

2. Materials and Methods

2.1. Field Sampling and Plant Material

Sixty natural oak populations belonging to subgen. Quercus sect. Quercus were collected in the Italian Peninsula, Sicily, and Sardinia (Figure 1, Table A1). The study area was divided into five geographical sectors, i.e., northern Italy, central Italy, southern Italy, Sicily, and Sardinia, with this phytogeographical regionalization being the most widely accepted for the Italian territory at present [55,56]. The plant material was collected during autumn between 2016 and 2018. A total of 3 individuals per population, for a total of 180 individuals, were sampled at a distance of at least 50 m to each other in order to reduce the likelihood of sampling sibling trees.
Where possible, the white oak populations were sampled in areas where phytosociological tables or ecological descriptions were already published. As regards the name of the phytosociological associations related to the sampled populations, reference was made to the nomenclatural epithet originally assigned by the authors who described them (Table A2). For example, for southern Italy and the islands, reference was made to associations such as Oleo-Quercetum virgilianae, Lonicero-Quercetum virgilianae, Ornithogalo-Quercetum ichnusae, Glechomo-Quercetum congestae, Arabido-Quercetum congestae, Quercetum leptobalanae, etc. [57,58,59,60,61], although Q. congesta, Q. ichnusae, Q. leptobalana, and Q. virgiliana, despite being accepted as valid species in Pignatti et al. [16], were considered synonyms of Q. pubescens Willd. in Bartolucci et al. [17]. This choice was made to retain available taxonomic, biogeographic, and ecological information that would have been lost by merging under the same name taxa whose taxonomic position is not yet definitively established at national and European levels. However, to ease the interpretation of the results, a re-arrangement (grouping) of single species into the following species complexes was carried out: (i) Quercus petraea complex (including Q. petraea (Matt.) Liebl. subsp. petraea and Q. petraea subsp. austrotyrrhenica Brullo, Guarino & Siracusa), (ii) Q. pubescens complex (including Q. congesta C. Presl., Q. dalechampii Ten., Q. ichnusae Mossa, Bacch. et Brullo, Q. leptobalana Guss. Q. pubescens Willd, and Q. virgiliana Ten. (Ten.)). Instead, both Q. robur L. and Q. frainetto Ten. were considered only single taxa. Indeed, regarding Q. frainetto, neither have infraspecific taxa been recorded in Italy, nor are similar taxa that could somehow be confused with it known at present. As far as Q. robur is concerned, no specimens were collected in the administrative regions (Campania and Calabria) where the subspecies Q. robur L. subsp. brutia (Ten.) O. Schwarz was considered to occur [17]. Plant material (including twigs, leaves, and fruits) and voucher specimens were deposited and preserved in the herbarium of the University of Molise (IS) [62].

2.2. DNA Extraction and cpSSR Amplification

Five polymorphic chloroplast SSR loci were used (Table 1); the primers were designed by Deguilloux et al. [37] and Sebastiani et al. [63].
DNAs were extracted from silica gel-dried leaves (about 50 mg per tree) of 180 samples, using the NucleoSpin™ Plant II Ks (Macherey-Nagel, Oensingen - Switzerland), following the manufacturer’s instructions. Polymerase chain reactions were carried out using the software GeneAmp® 2700 Thermal Cycler (Applied Biosystems, Foster City, CA, USA). The reaction was performed in a 20 μL total volume containing 20 ng of genomic DNA following the Qiagen multiplex k protocol. The cycling parameters were as follows: 15 min at 95 °C; 30 cycles for 30 s at 95 °C, 44 s at 57 °C, and 30 s at 72 °C; and a final step of 30 min at 60 °C. Amplification products (1 μL) were added to 20 μL formamide and 0.2 μL GeneScan™ 500 LIZ™ and denatured at 95 °C for 5 min. The samples were run on ABI PRISM 3100 DNA-sequencer. The resulting raw data were collected by using GeneMapper 6 software (Applied Biosystems).

2.3. Data Analysis

Fragment-sized polymorphisms were identified as different length variants that were combined to define haplotypes by using GenAlEx 6.5 [64]. The same software was used to compute the main genetic statistic parameters, i.e., the number of observed alleles (Na), number of effective alleles (Ne), number of private alleles (Np), Shannon’s information index (i), haploid genetic diversity (h), and unbiased genetic diversity (uh). An assessment of allele frequency was carried out using FSTAT version 2.9.4 [65]. Within- (HS) and among (HT)-population genetic diversity and the two main coefficients of gene differentiation (GST and RST) were assessed by using the software program PermutCpSSR v2.0 [66] with 1000 permutations. These parameters were computed on the entire dataset and according to the following grouping criteria: “geographical sector”, “single species”, and “species complex”.
The Bayesian Analysis of Population Structure (BAPS, version 6.0; [67]) was used to investigate the geographical patterns underlying the genetic diversity of the white oak dataset and to confirm the division into geographical sectors, for mixture and admixture analysis (LocPrior option). The genetic structure of the investigated populations was also tested using STRUCTURE software v.2.3.4 [68], setting 20 runs with K from 1 to 7. Each run had a burn-in period of 100,000 iterations and 500,000 Monte Carlo Markov iterations, assuming an admixture model (with LocPrior) with correlated allele frequencies.
Structure HARVESTER [69] was used to obtain ΔK and mean L(K) values. Post-processing was carried out using CLUMPAK [70]. To define the genealogical relations among the haplotypes, a minimum spanning network (MSN) based on allele length differences was created using the software Arlequin 3.5.1.3 [71] and an MSN diagram was produced. Finally, a principal coordinate analysis (PCoA) was performed using the Nei’s genetic distance matrix generated with GeneAlEx to evaluate dissimilarity among individuals.

3. Results

The five cpSSRs identified eighteen alleles in total (Table A3). The observed number of alleles per locus ranged from 3 (cmcs6, udt1, and ucd5) to 5 (ucd4), with a mean of 3.6 (Table 2). The number of effective alleles (Ne) ranged from 1.798 to 3.744, averaging 2.546. Shannon’s diversity index ranged from 0.677 to 1.441, indicating medium to high polymorphism at the investigated loci. The values of genetic diversity (h and uh) denoted adequate investigative potential for the markers used across the dataset.

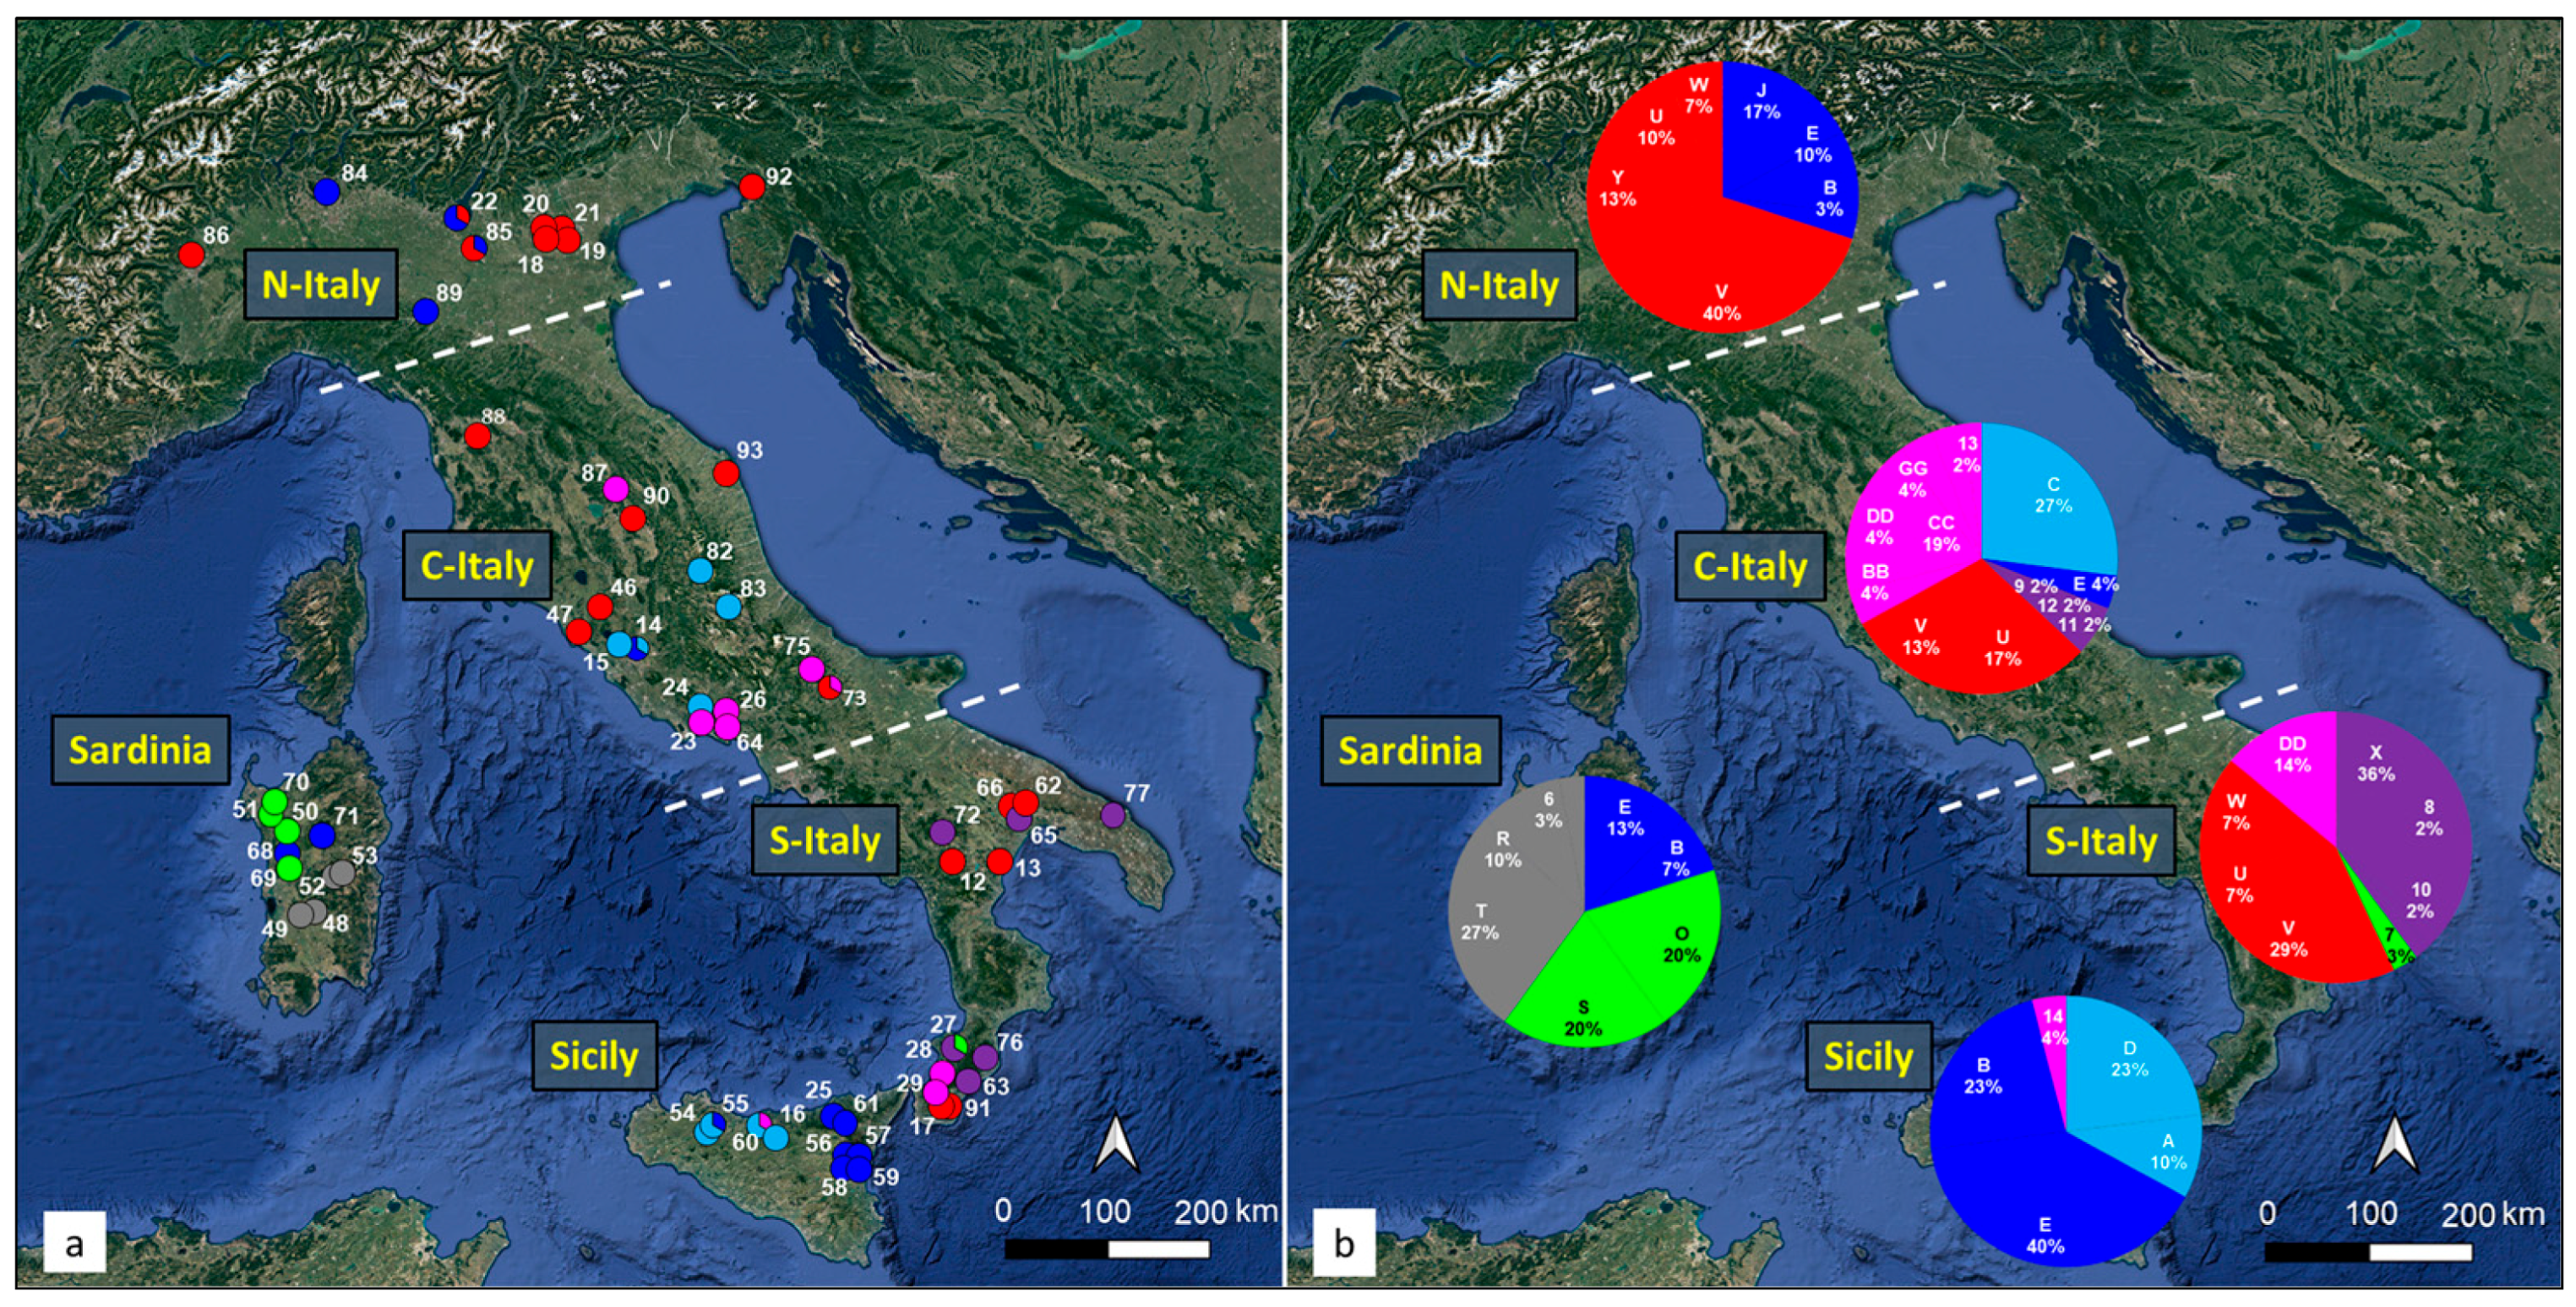
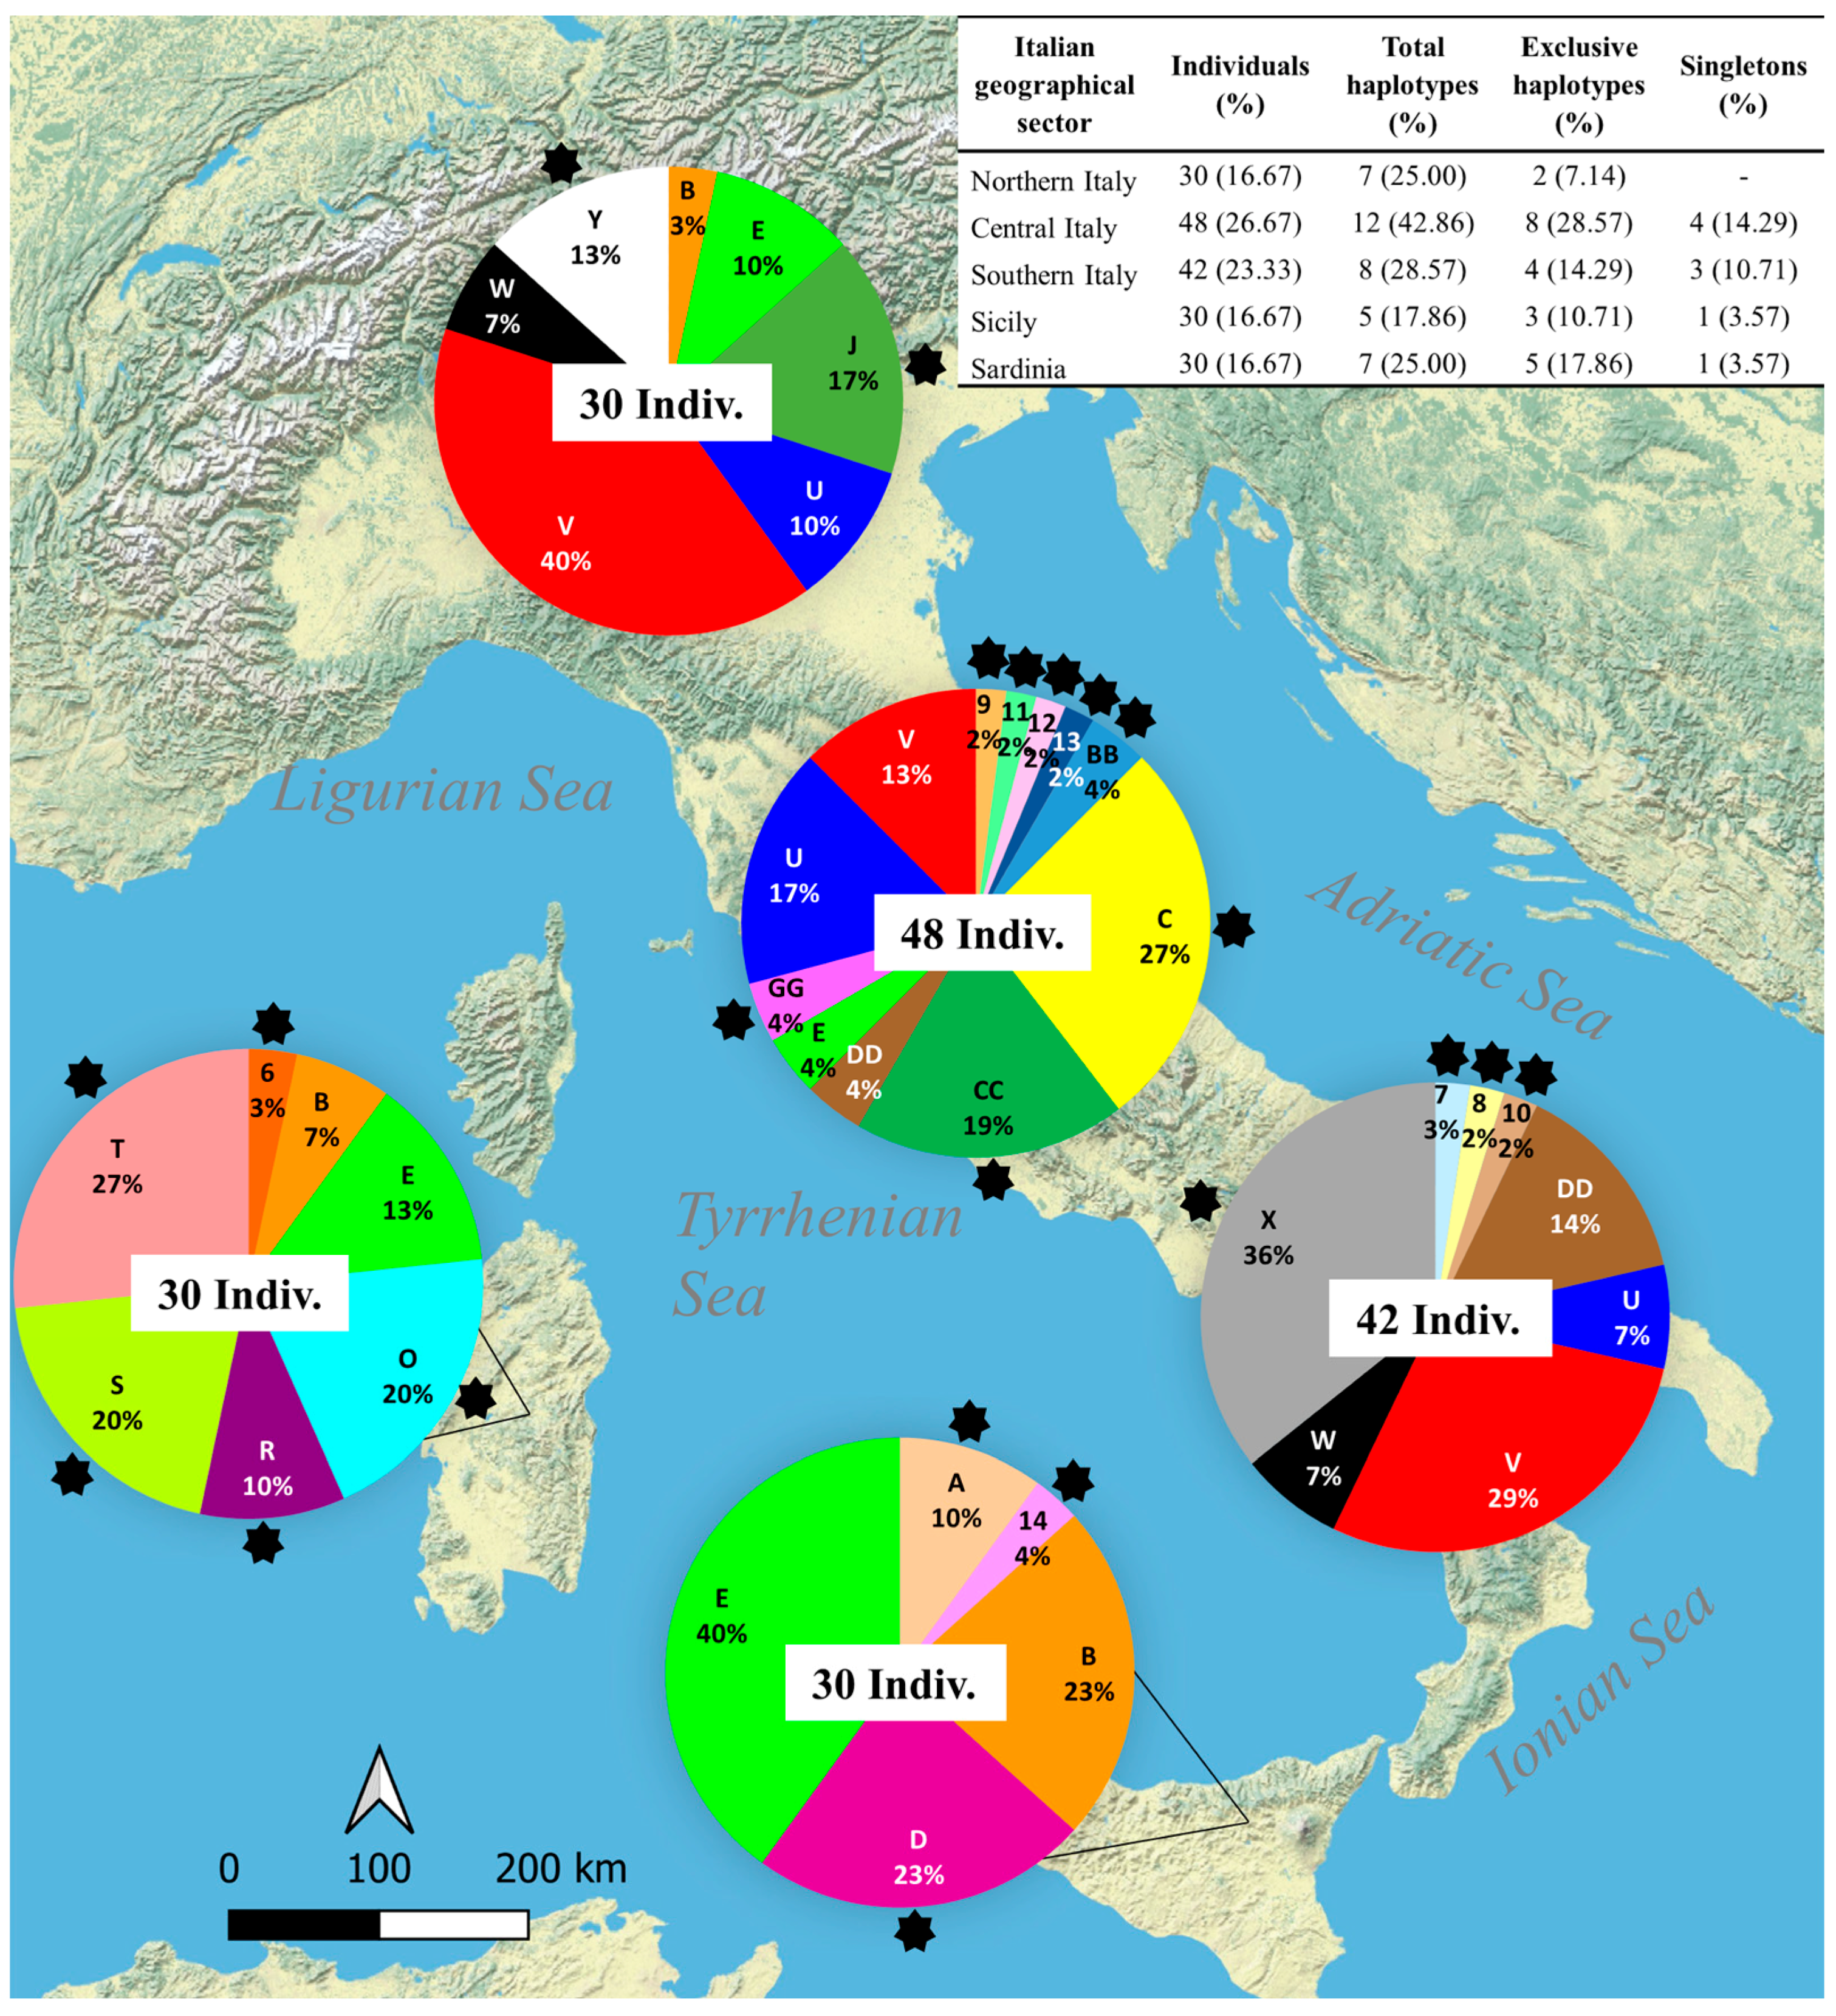
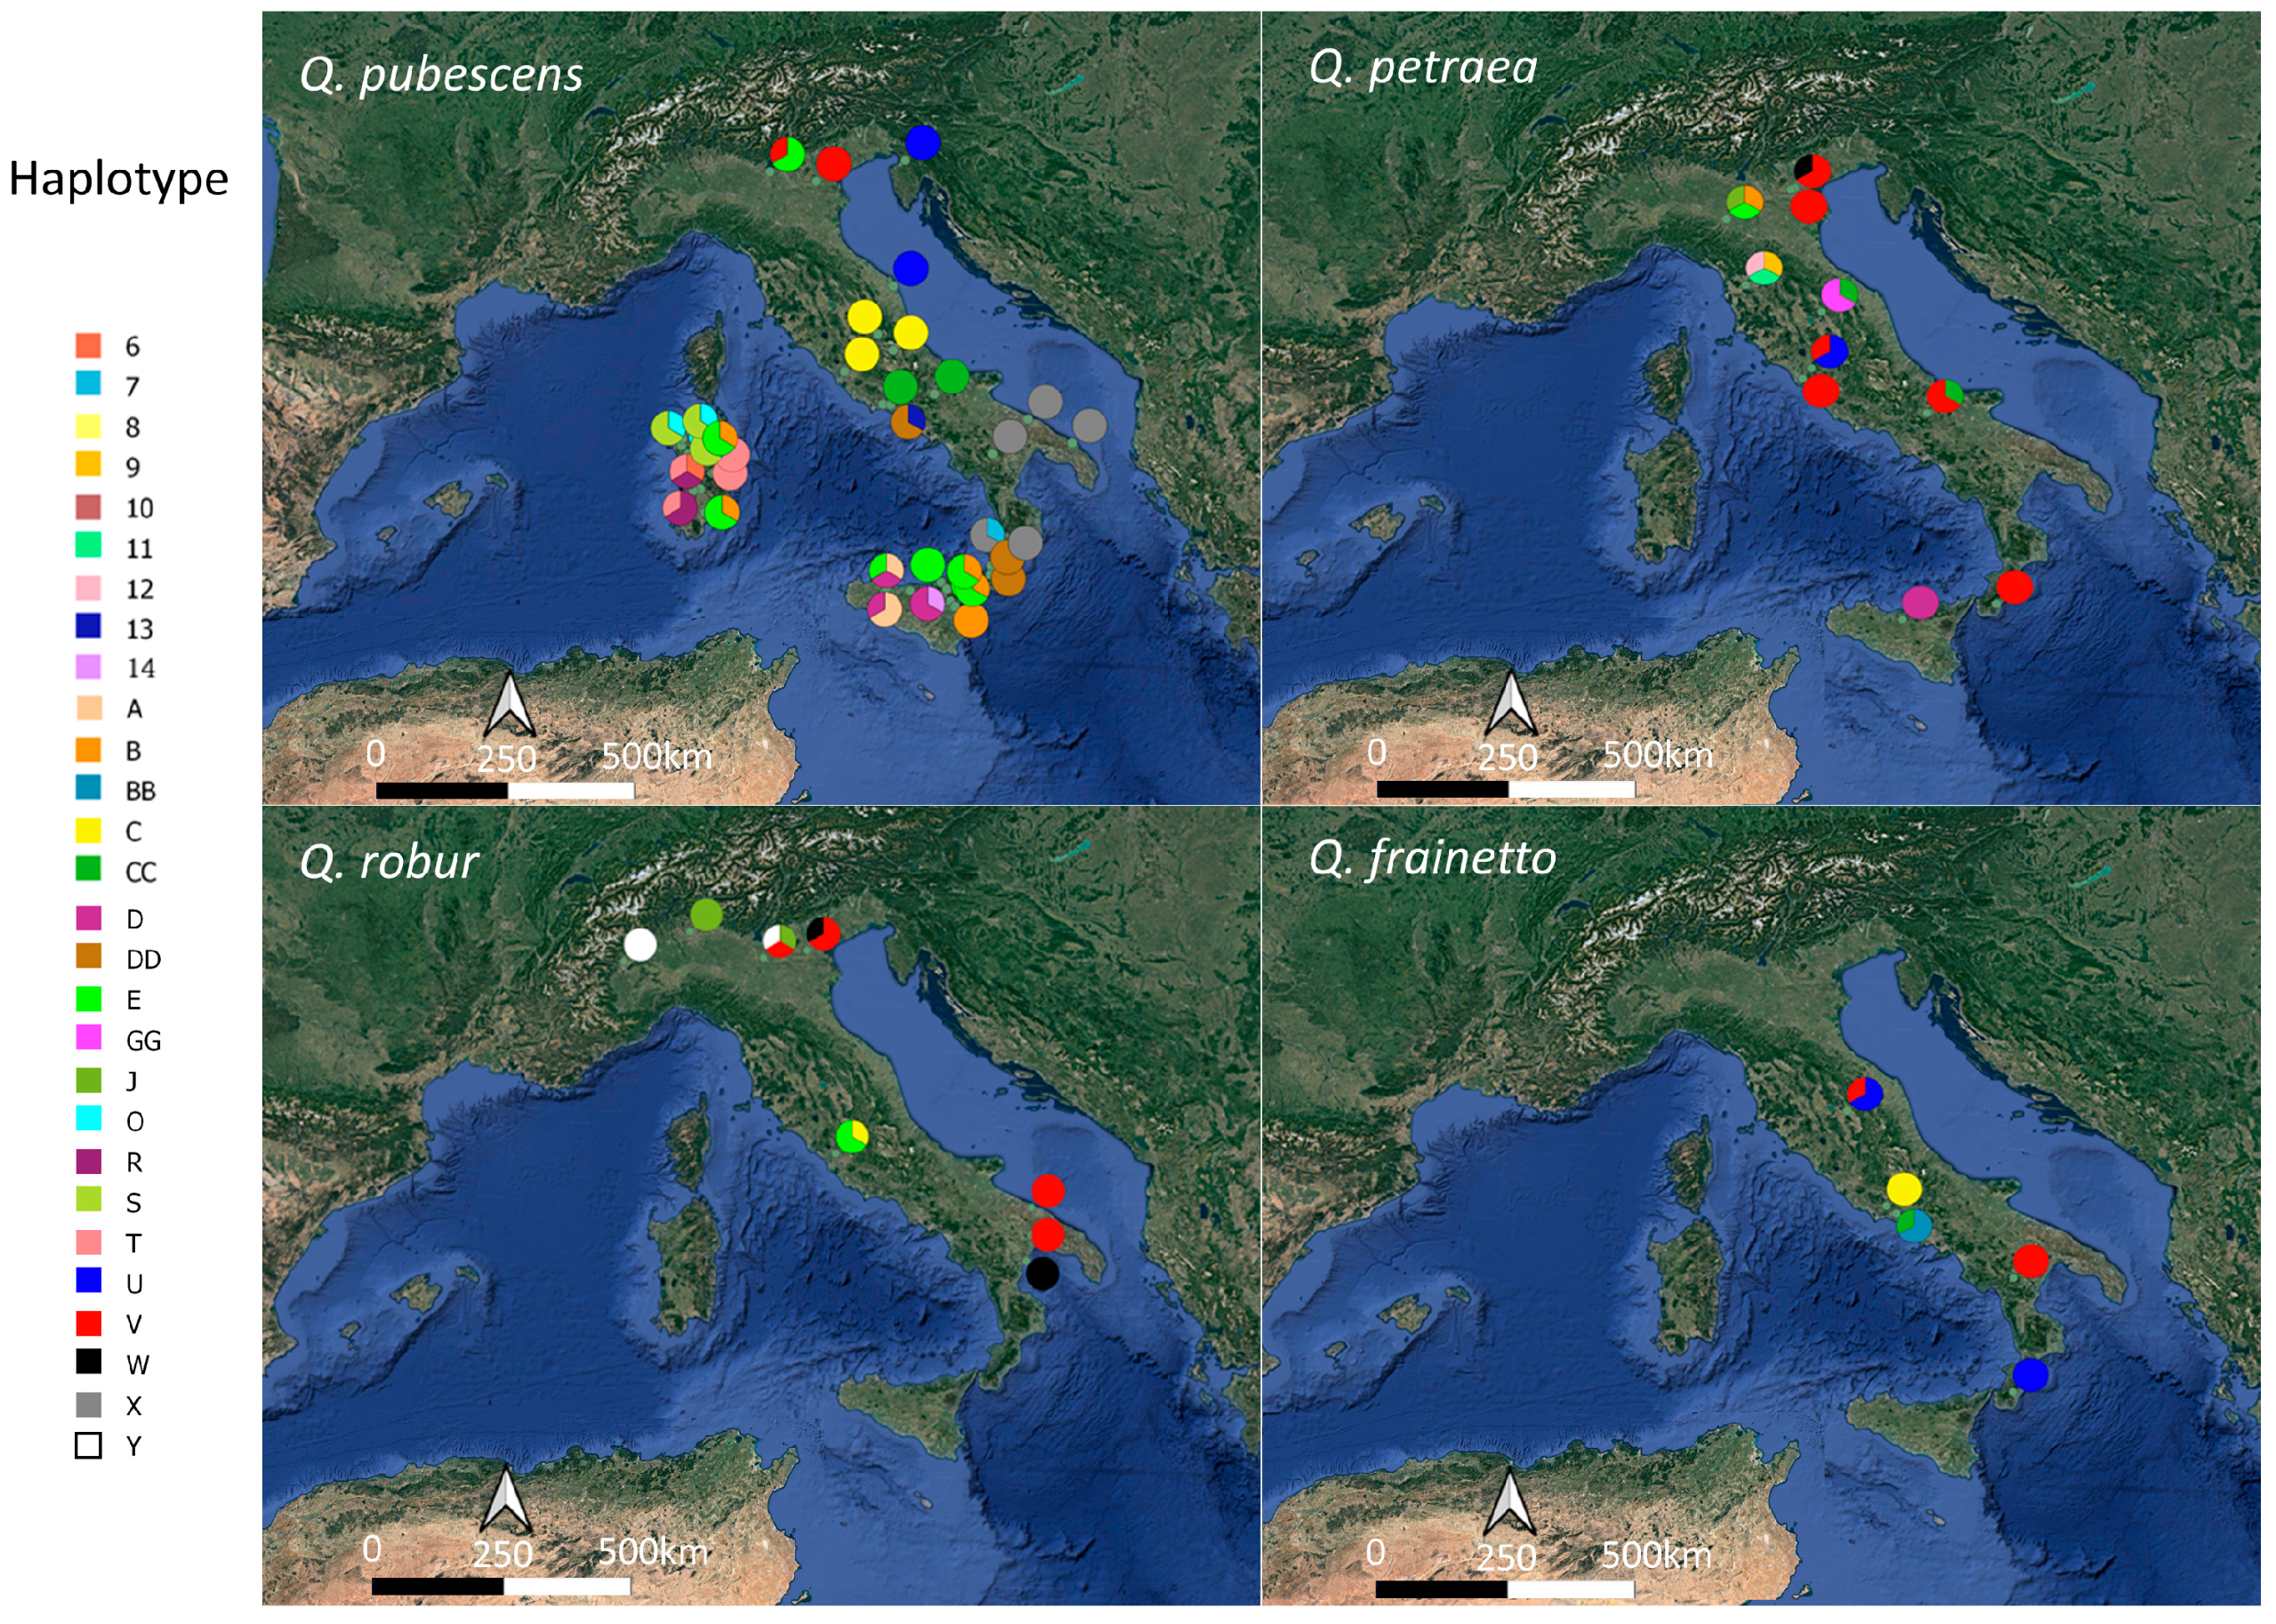
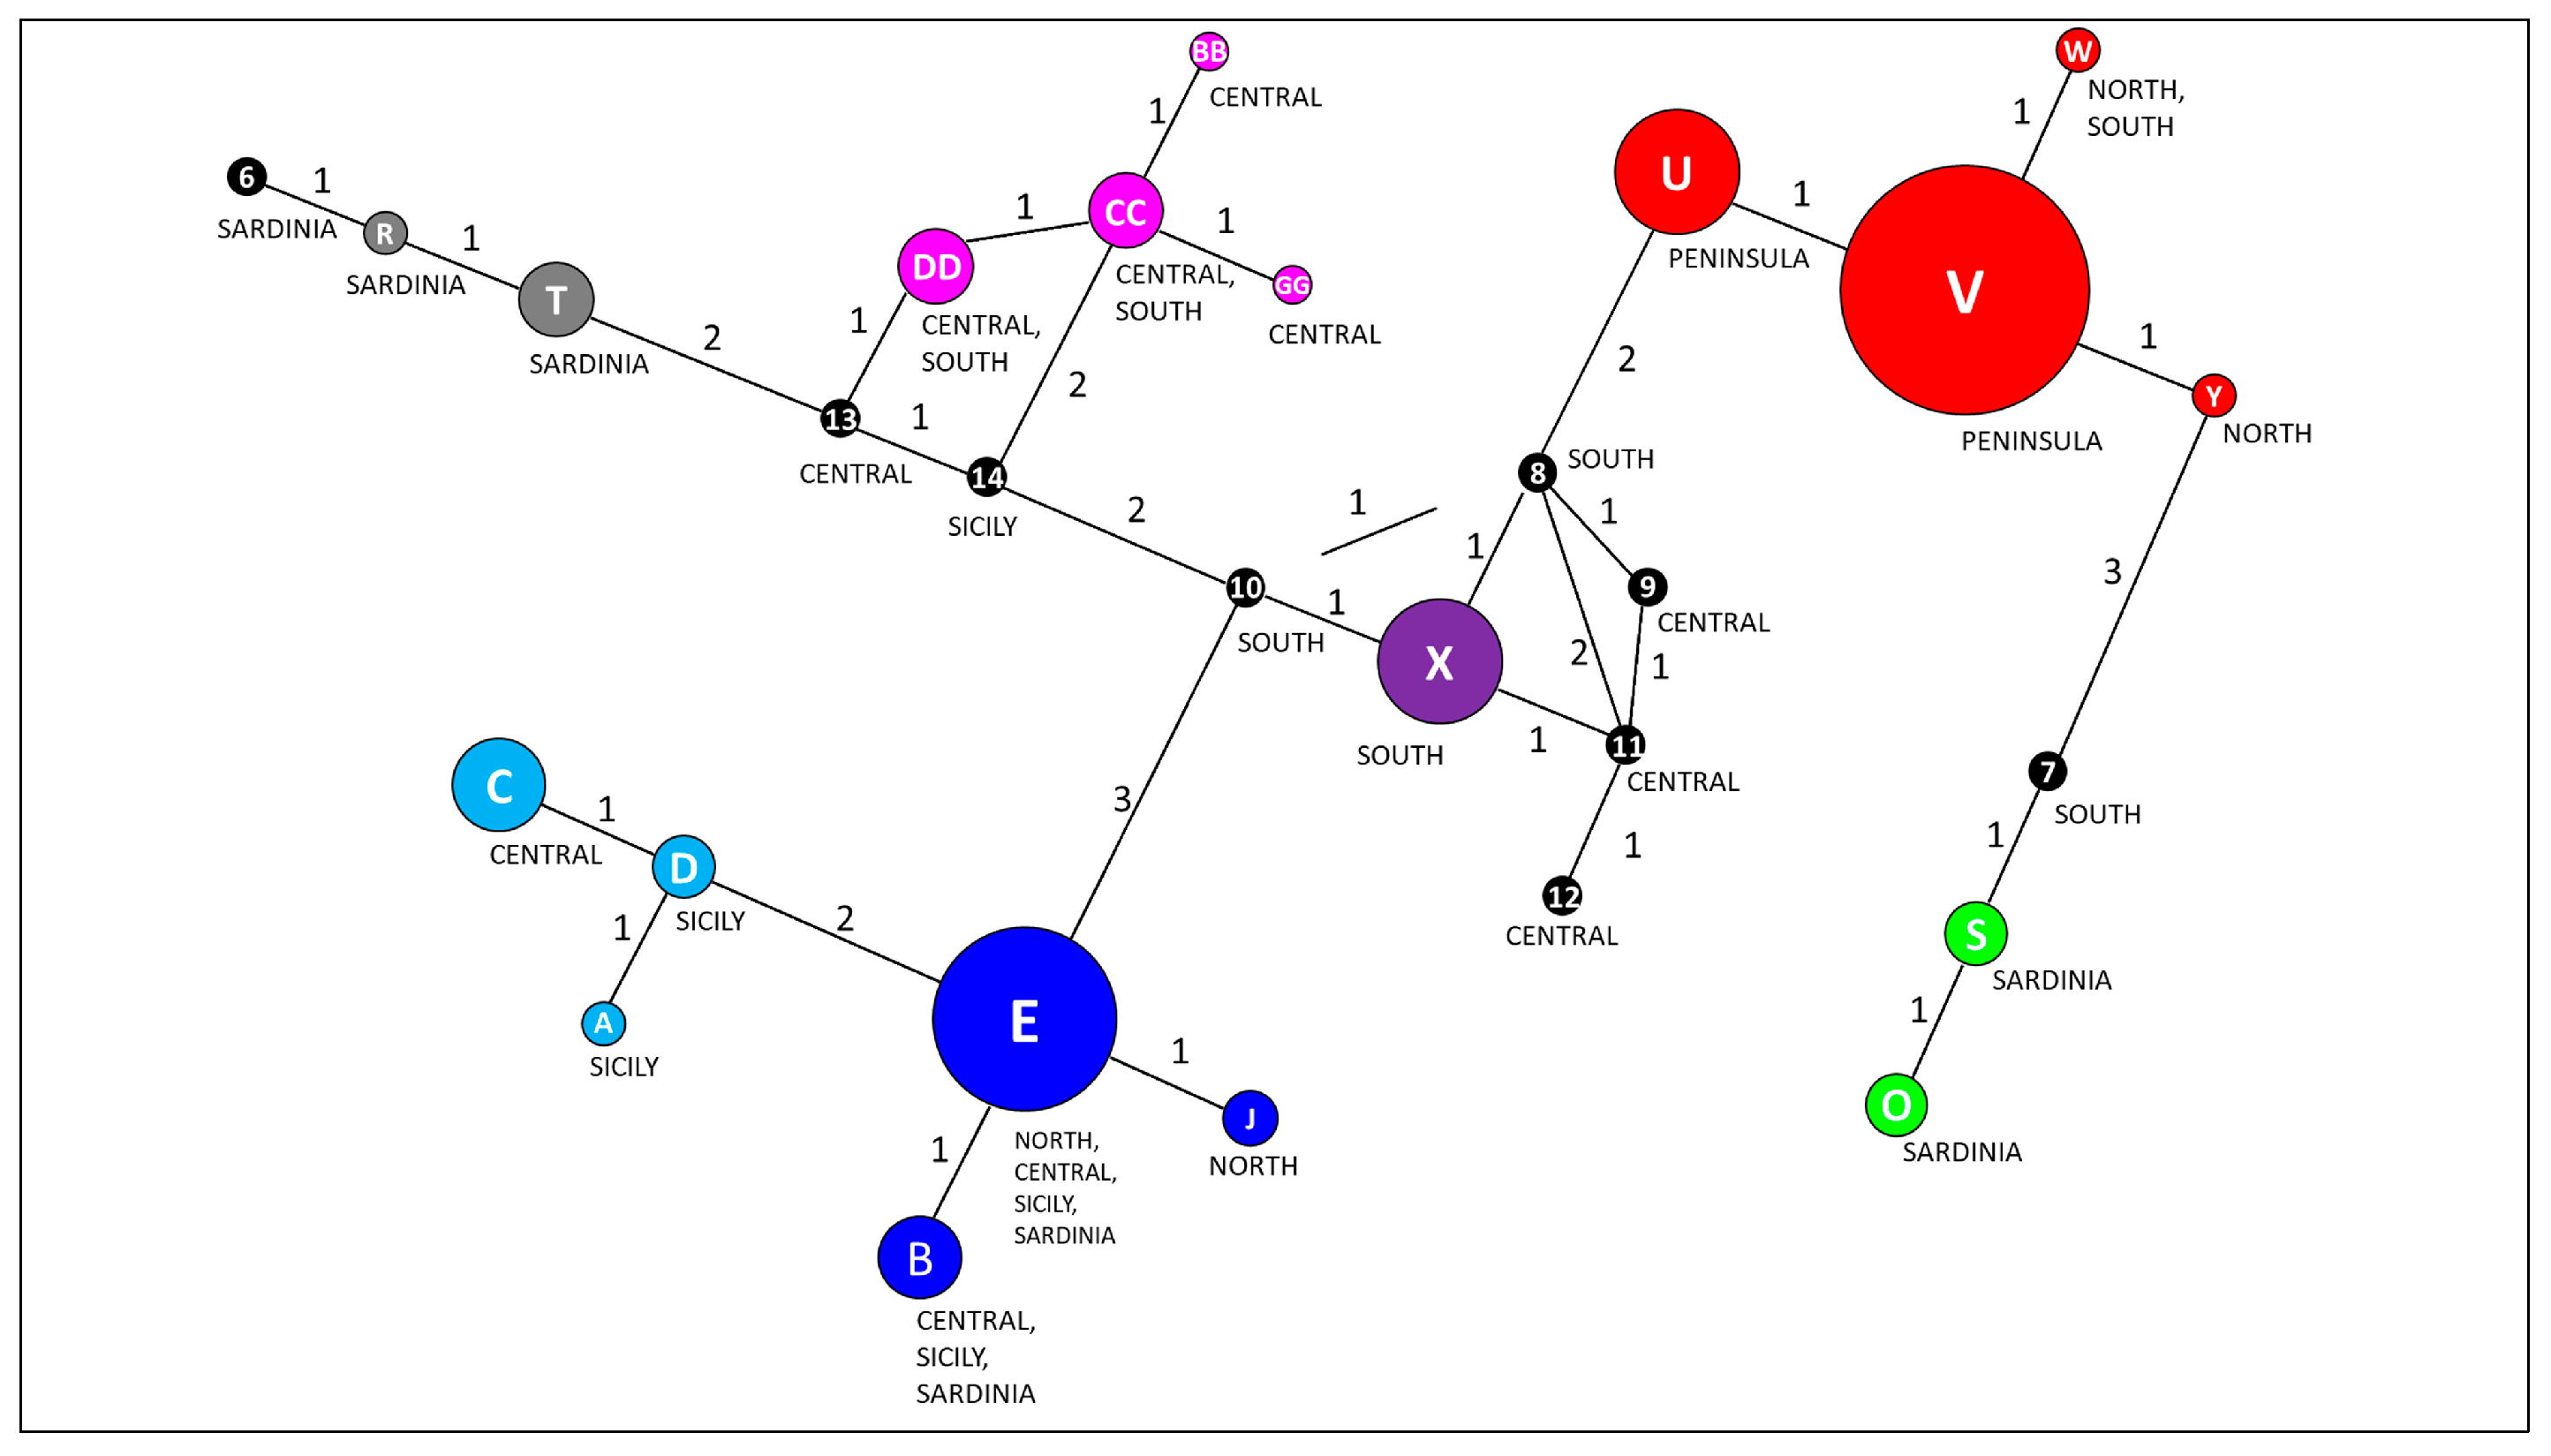
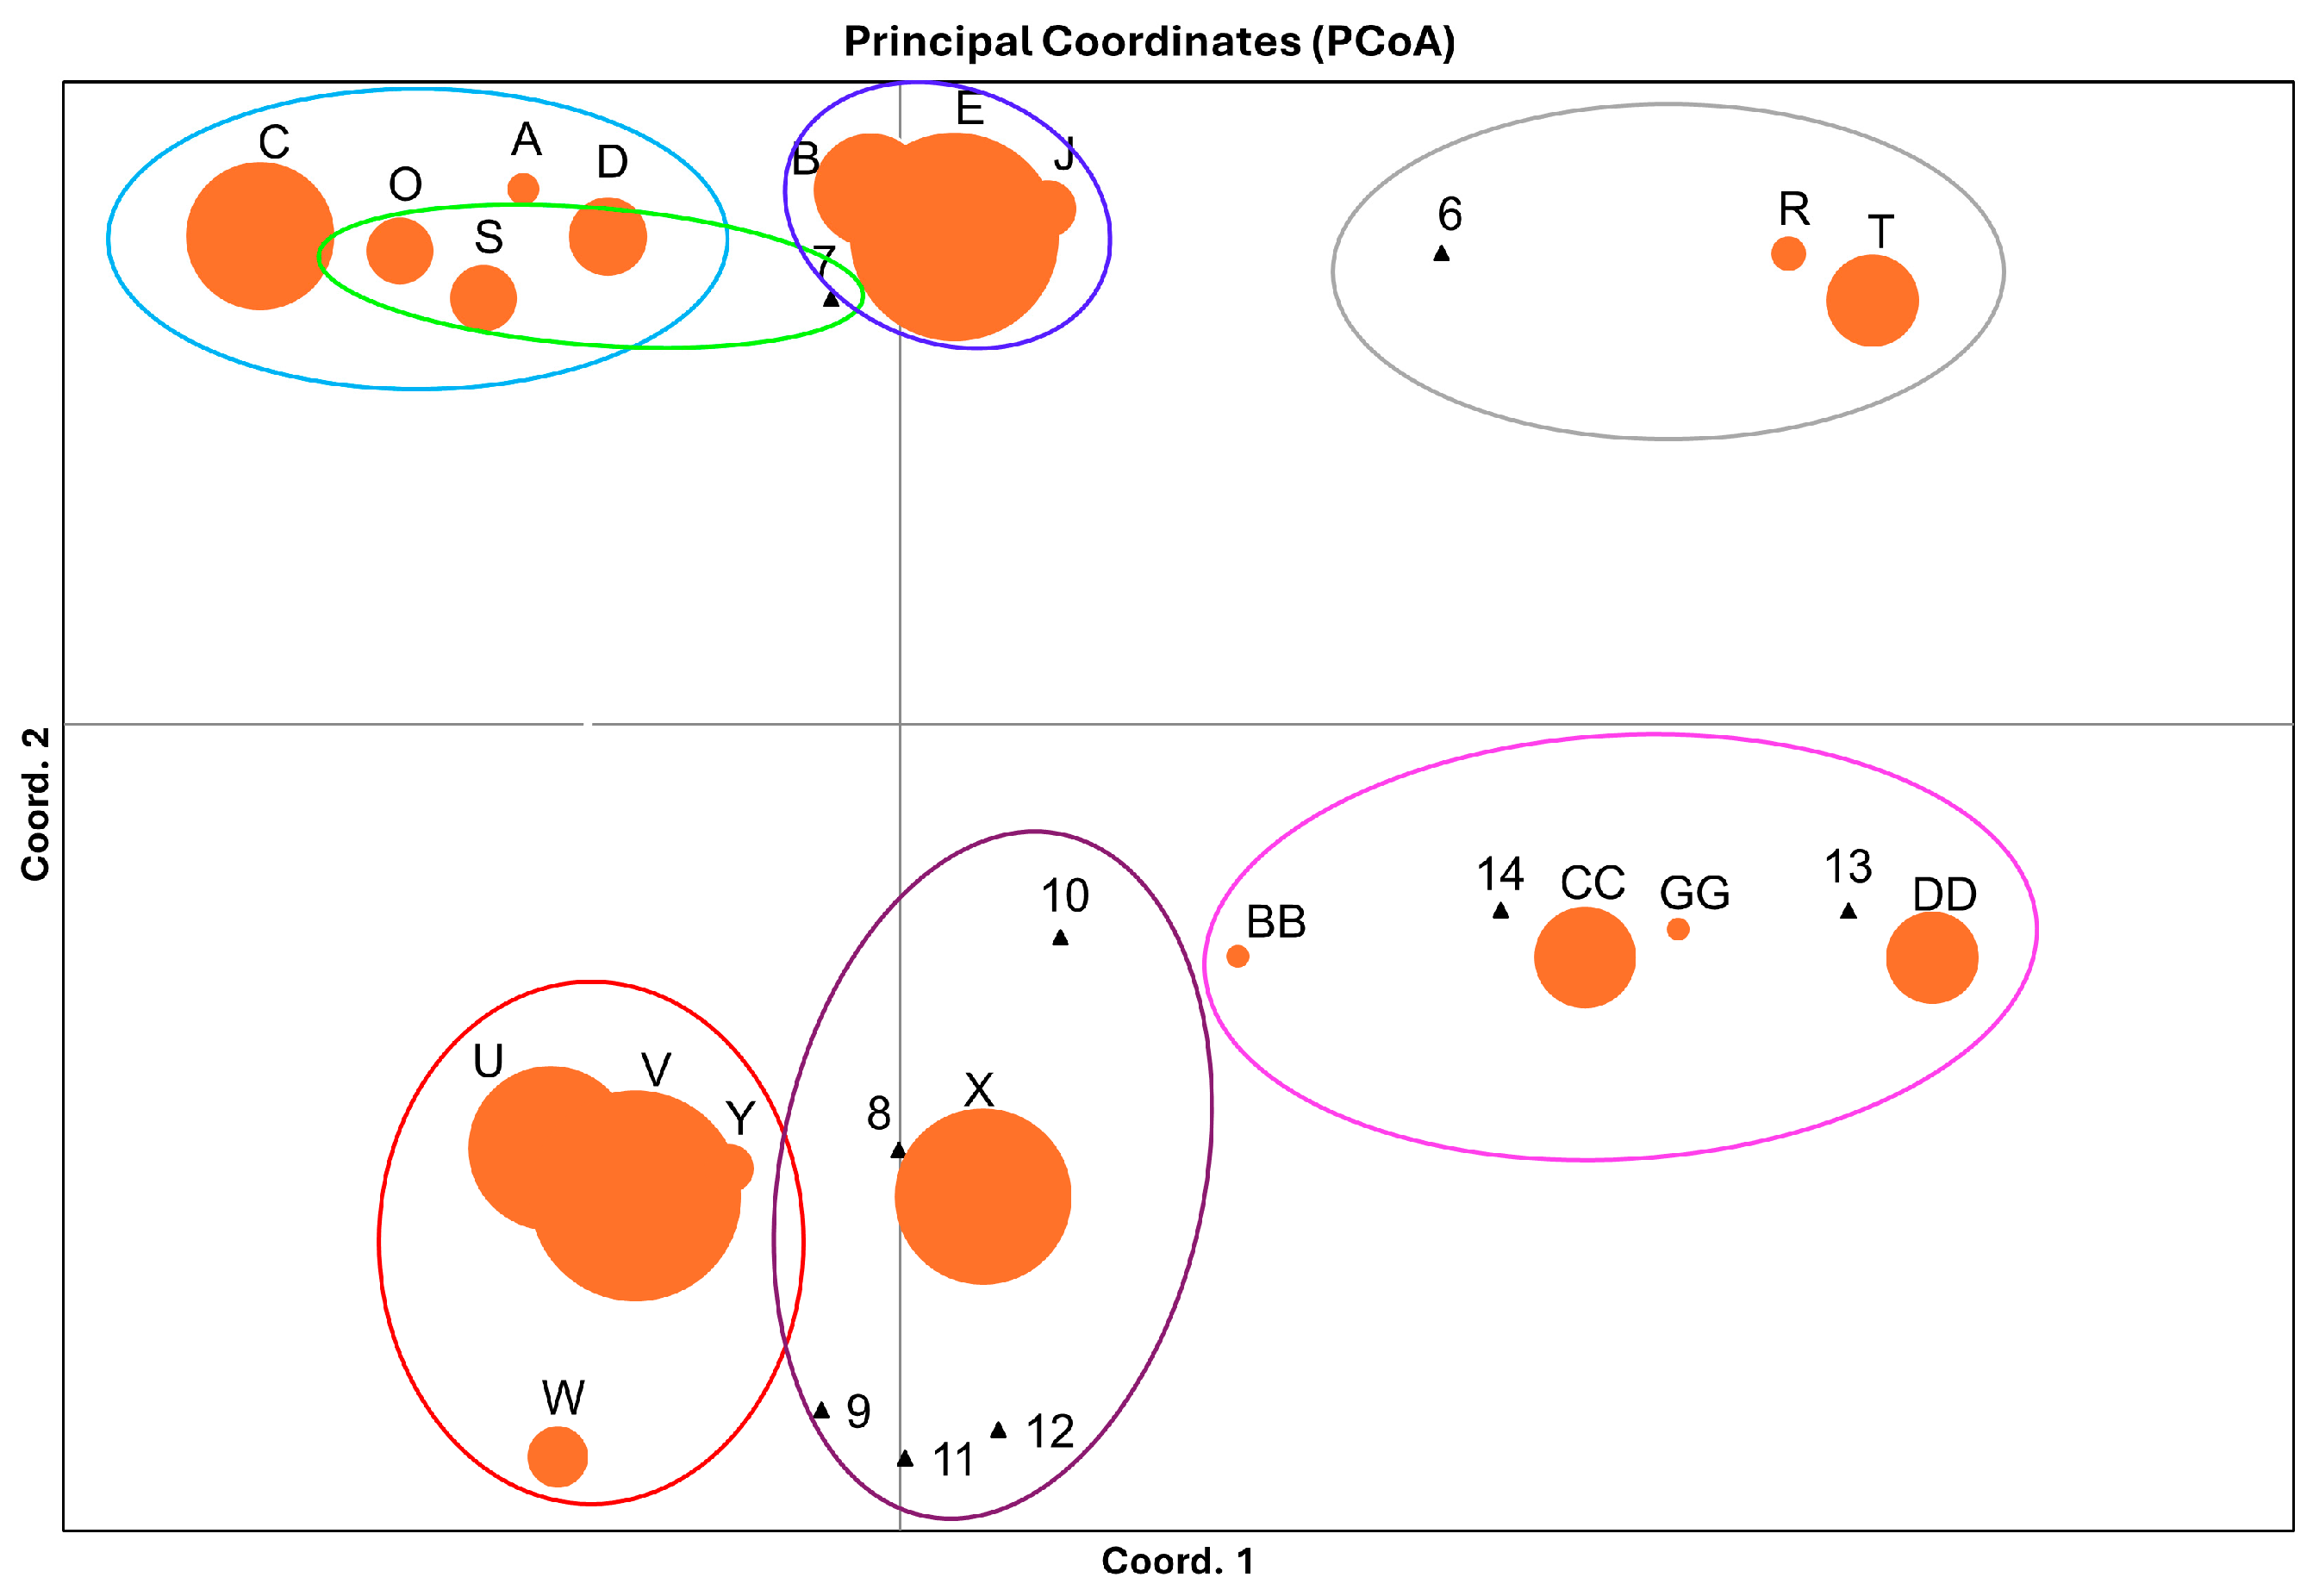
3.1. Overall Haplotype Distribution

Polymorphisms detected in the 5 cpSSR loci resulted in a combined total of 28 haplotypes across the dataset investigated. The overall haplotype distribution, according to individual occurrence, geographical sector, and taxonomy, is shown in Table 3. In total, 6 haplotypes were found to be shared by 10–30 individuals, while 22 were restricted to a fewer number of individuals. A total of 9 of the 28 haplotypes identified were detected in single individuals (singletons). The most frequent haplotype (#V) was found to be distributed throughout the three sectors of the Italian Peninsula and within all of the taxa investigated. The second most frequent haplotype (#E) was found also in Sardinia and Sicily, but missing in southern Italy, and was detected in all of the species investigated except for Q. frainetto. Haplotypes #C and #X were found to be exclusive to central and southern Italy, respectively, with the latter exhibited only by the Q. pubescens complex. Haplotype #U was found to be distributed throughout the Italian Peninsula and in all of the oak species except for Q. robur. Haplotype #B was found in just a few individuals of Q. petraea and Q. pubescens complexes from central Italy, Sardinia, and Sicily. With the exception of haplotype #W, which was detected only in five individuals of Q. petraea and Q. robur from southern and northern Italy, the less frequent haplotypes (including singletons) were found to be concentrated in central Italy (7), Sardinia (5), southern Italy (4), Sicily (3), and northern Italy (2). Finally, three haplotypes, each identified only in two to four individuals, were found to be exclusive to a single species (#BB: Q. frainetto; #GG: Q. petraea; #Y: Q. robur).

3.2. Haplotype Diversity and Geographical Distribution

Central Italy, southern Italy, and Sardinia displayed the highest number of alleles (Na) and the highest level of total genetic diversity (HT) (Table 4). The number of effective alleles (Ne) were found to be low in all of the geographical sectors considered. Central Italy was the only sector displaying private alleles (Np). Relatively low values of genetic diversity within populations (HS) were detected across all of the geographical sectors. The genetic differentiation index (GST) was moderately low (mean = 0.555), ranging from 0.345 in Sicily to 0.839 in southern Italy. In contrast, the coefficient RST was found to be rather high (mean = 0.745). A statistically significant geographical structure across populations (RST vs. GST) was detected for northern Italy, central Italy, and Sardinia, whereas in southern Italy and Sicily, the correlation was not significant.
The number of haplotypes and relative frequencies in each geographical sector are reported in Figure 2. The highest number of haplotypes (12) were found in central Italy, of which eight were exclusive (four singletons), whereas northern Italy exhibited the lowest number (seven haplotypes, of which two were exclusive). Southern Italy exhibited eight haplotypes (four exclusives and three singletons), Sardinia exhibited seven haplotypes (five exclusives, of which one was a singleton), and Sicily exhibited five haplotypes (three exclusives, of which one was a singleton).

3.3. Genetic Diversity and Haplotype Distribution According to Taxonomy

Table 5 reports the genetic diversity displayed by species complexes. The Q. pubescens complex exhibited the highest mean values for Na (3.200) and Ne (2.661), while Q. robur exhibited the lowest values for these parameters (2.200 and 1.747, respectively). Only Q. petraea and Q. pubescens complexes showed private alleles. The genetic diversity among populations (HT) was found to be high in all of the species complexes considered (mean = 8.872), whereas the genetic diversity within populations (HS) was found to be relatively low (0.133–0.351), except for Q. petraea (0.467). The occurrence of a taxonomical structure (RST > GST) has been highlighted for all of the species complexes (Q. pubescens exhibits the highest value), although statistical significance was achieved only for Q. petraea and Q. pubescens.
Table 6 and Figure 3 depict the haplotype distribution for the different oak species and species complexes considered. In total, the Q. pubescens species complex exhibited 20 haplotypes, of which 13 were found to be exclusive (6 singletons). Within the Q. pubescens species complex, Q. congesta, Q. dalechampii, Q. ichnusae, and Q. pubescens exhibited one to three exclusive haplotypes, all of which corresponded to singletons, whereas Q. leptobalana and Q. virgiliana exhibited none. The Q. petraea species complex exhibited twelve haplotypes (four exclusives, of which three were singletons); none of these exclusive haplotypes were found in Q. petraea susbsp. austrotyrrhenica. Both Q. robur and Q. frainetto displayed a lower number of haplotypes (six and five, respectively) compared to the Q. petraea and Q. pubescens species complexes. Moreover, both of these species were found to be characterized by one exclusive haplotype and no singletons. The ratio between the number of haplotypes and the number of individuals showed that the highest value (0.40) was found for Q. petraea and the lowest (0.17) for Q. pubescens; Q. frainetto and Q. robur exhibited values of 0.33 and 0.29, respectively.

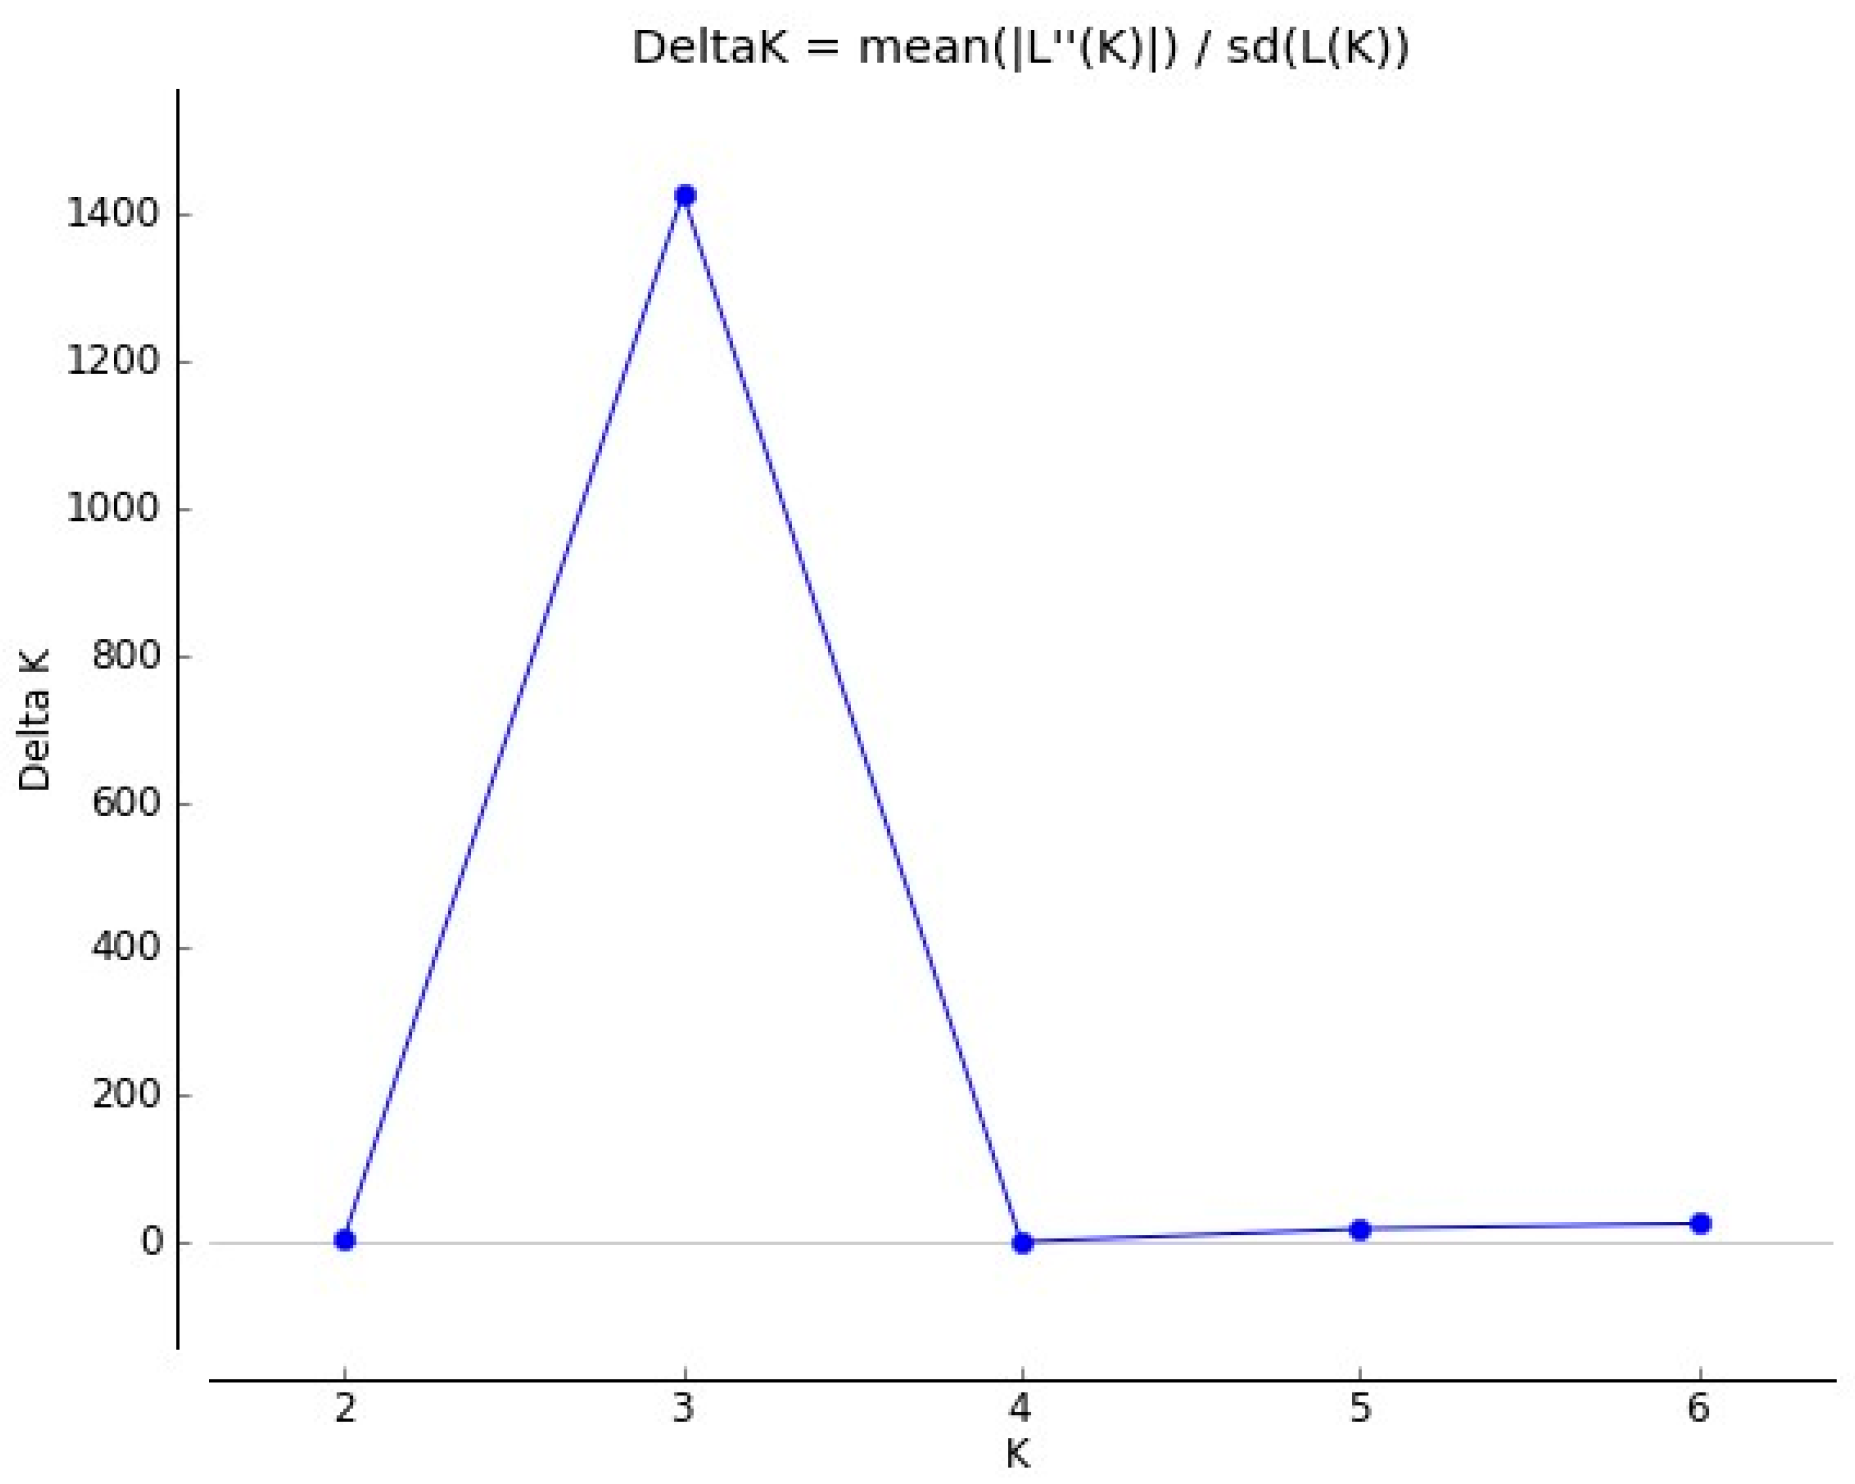
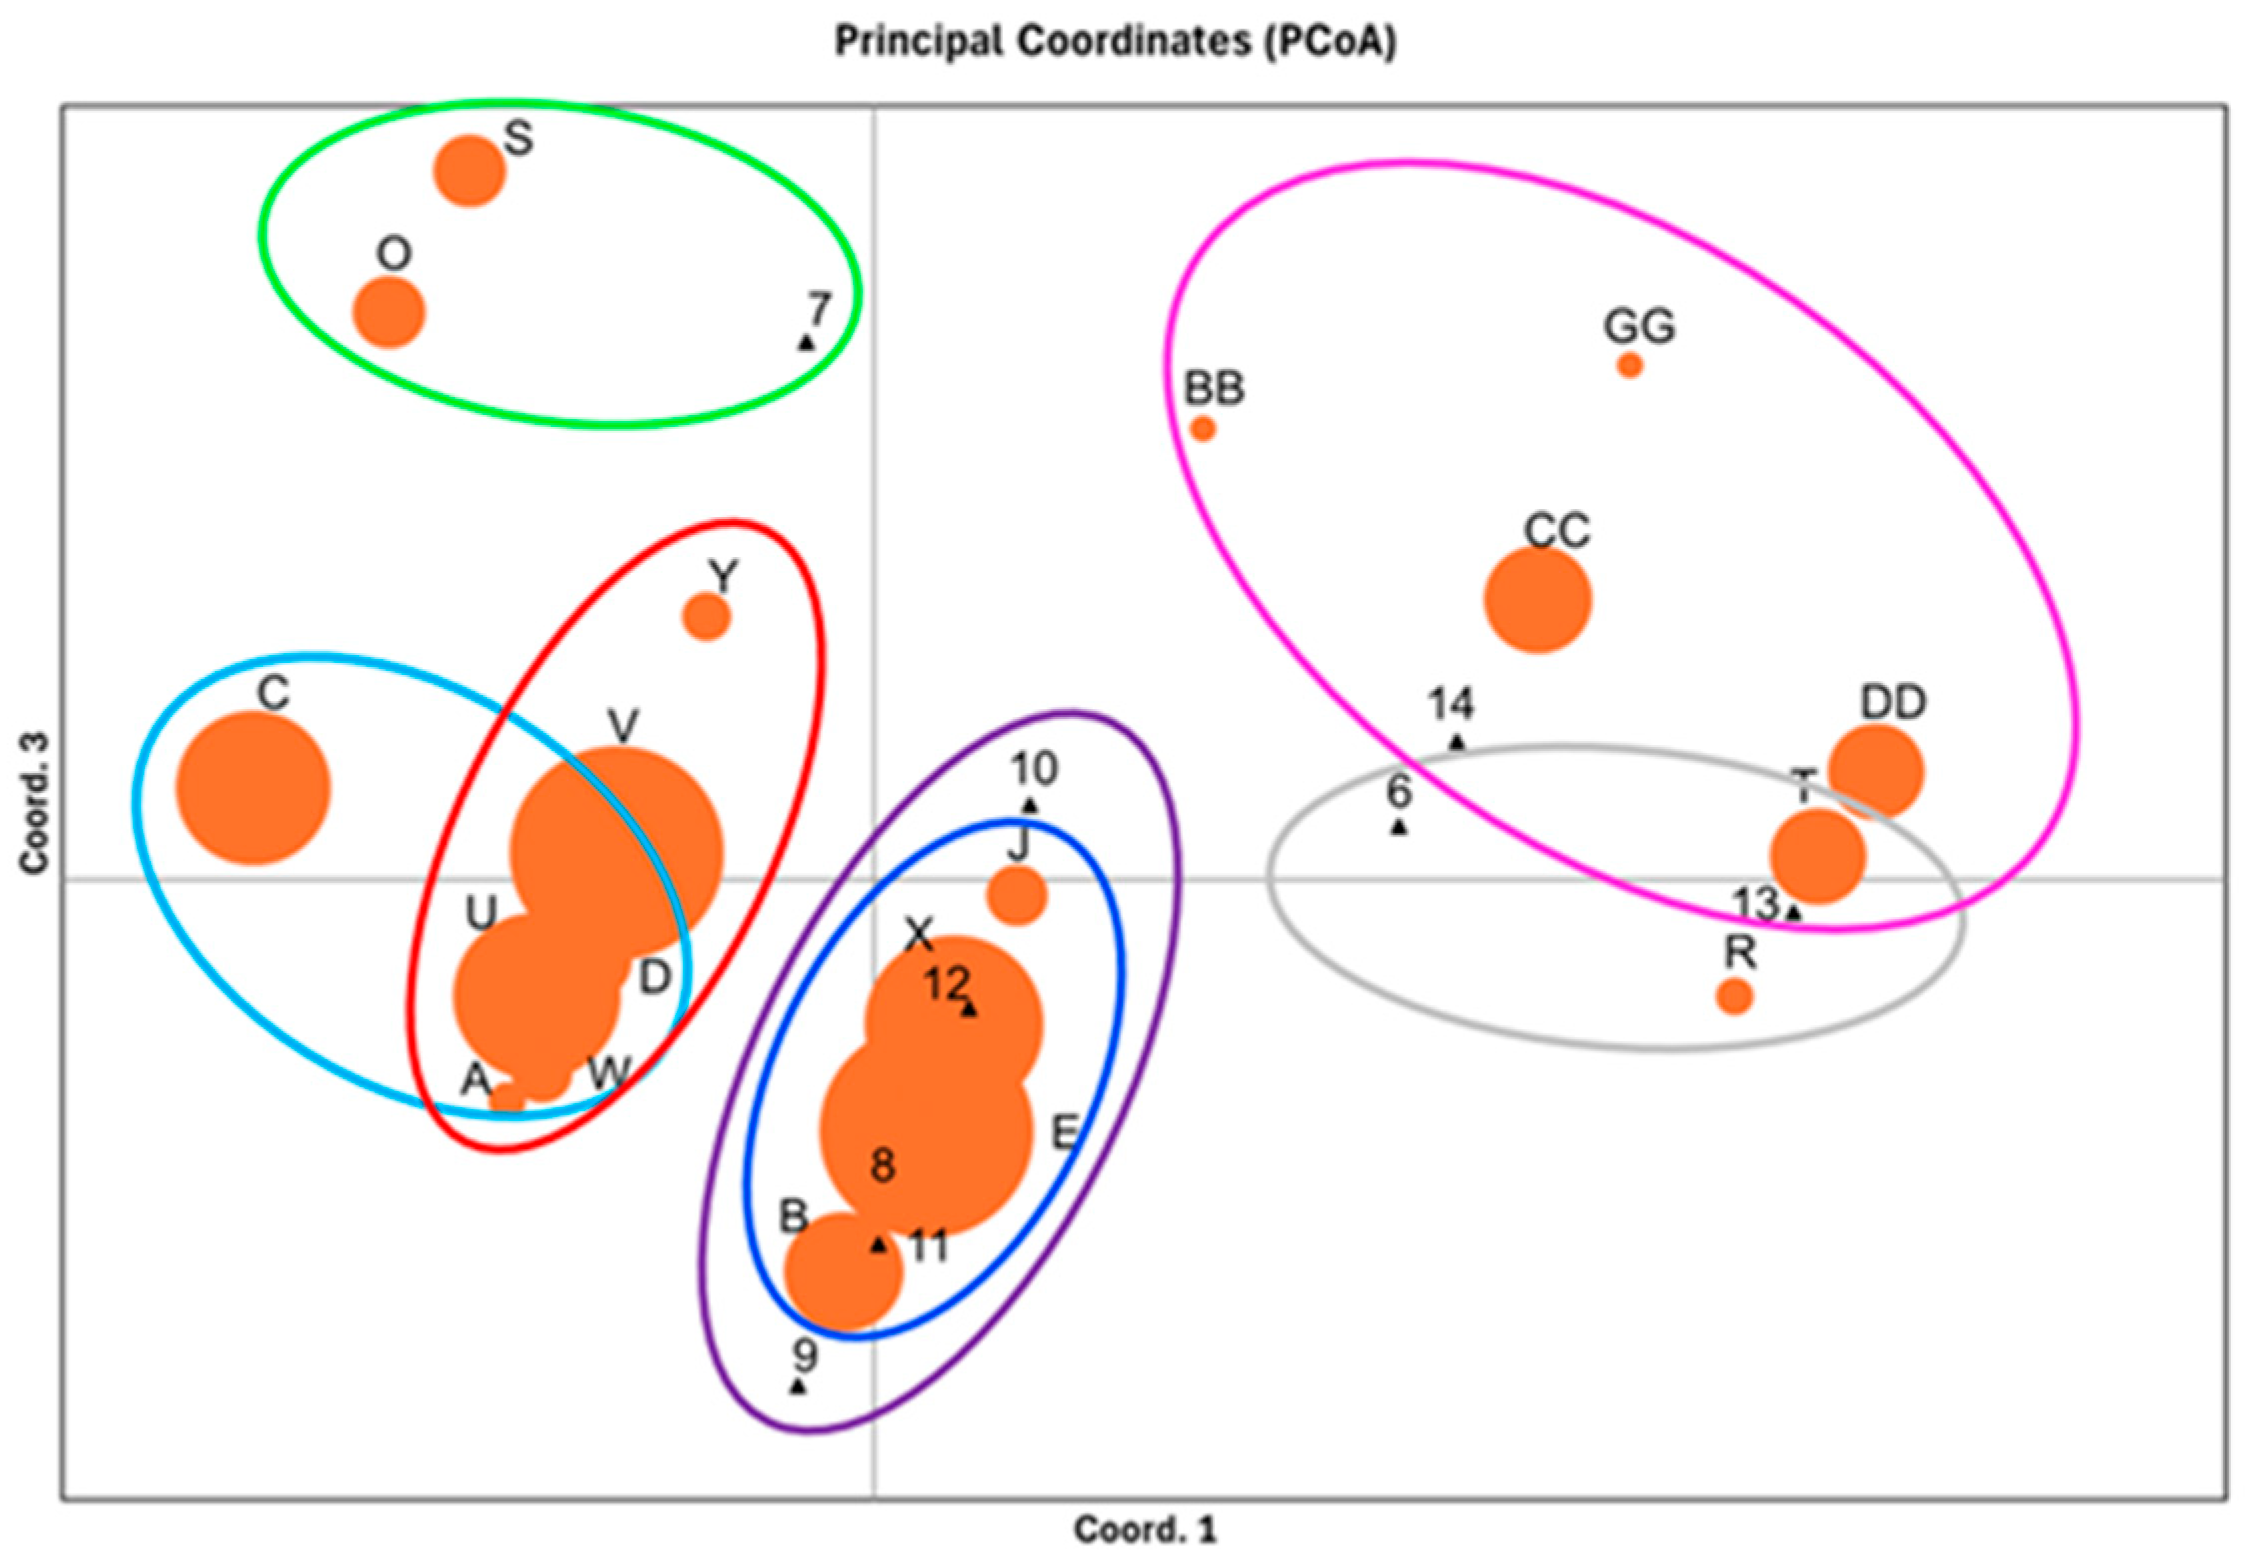
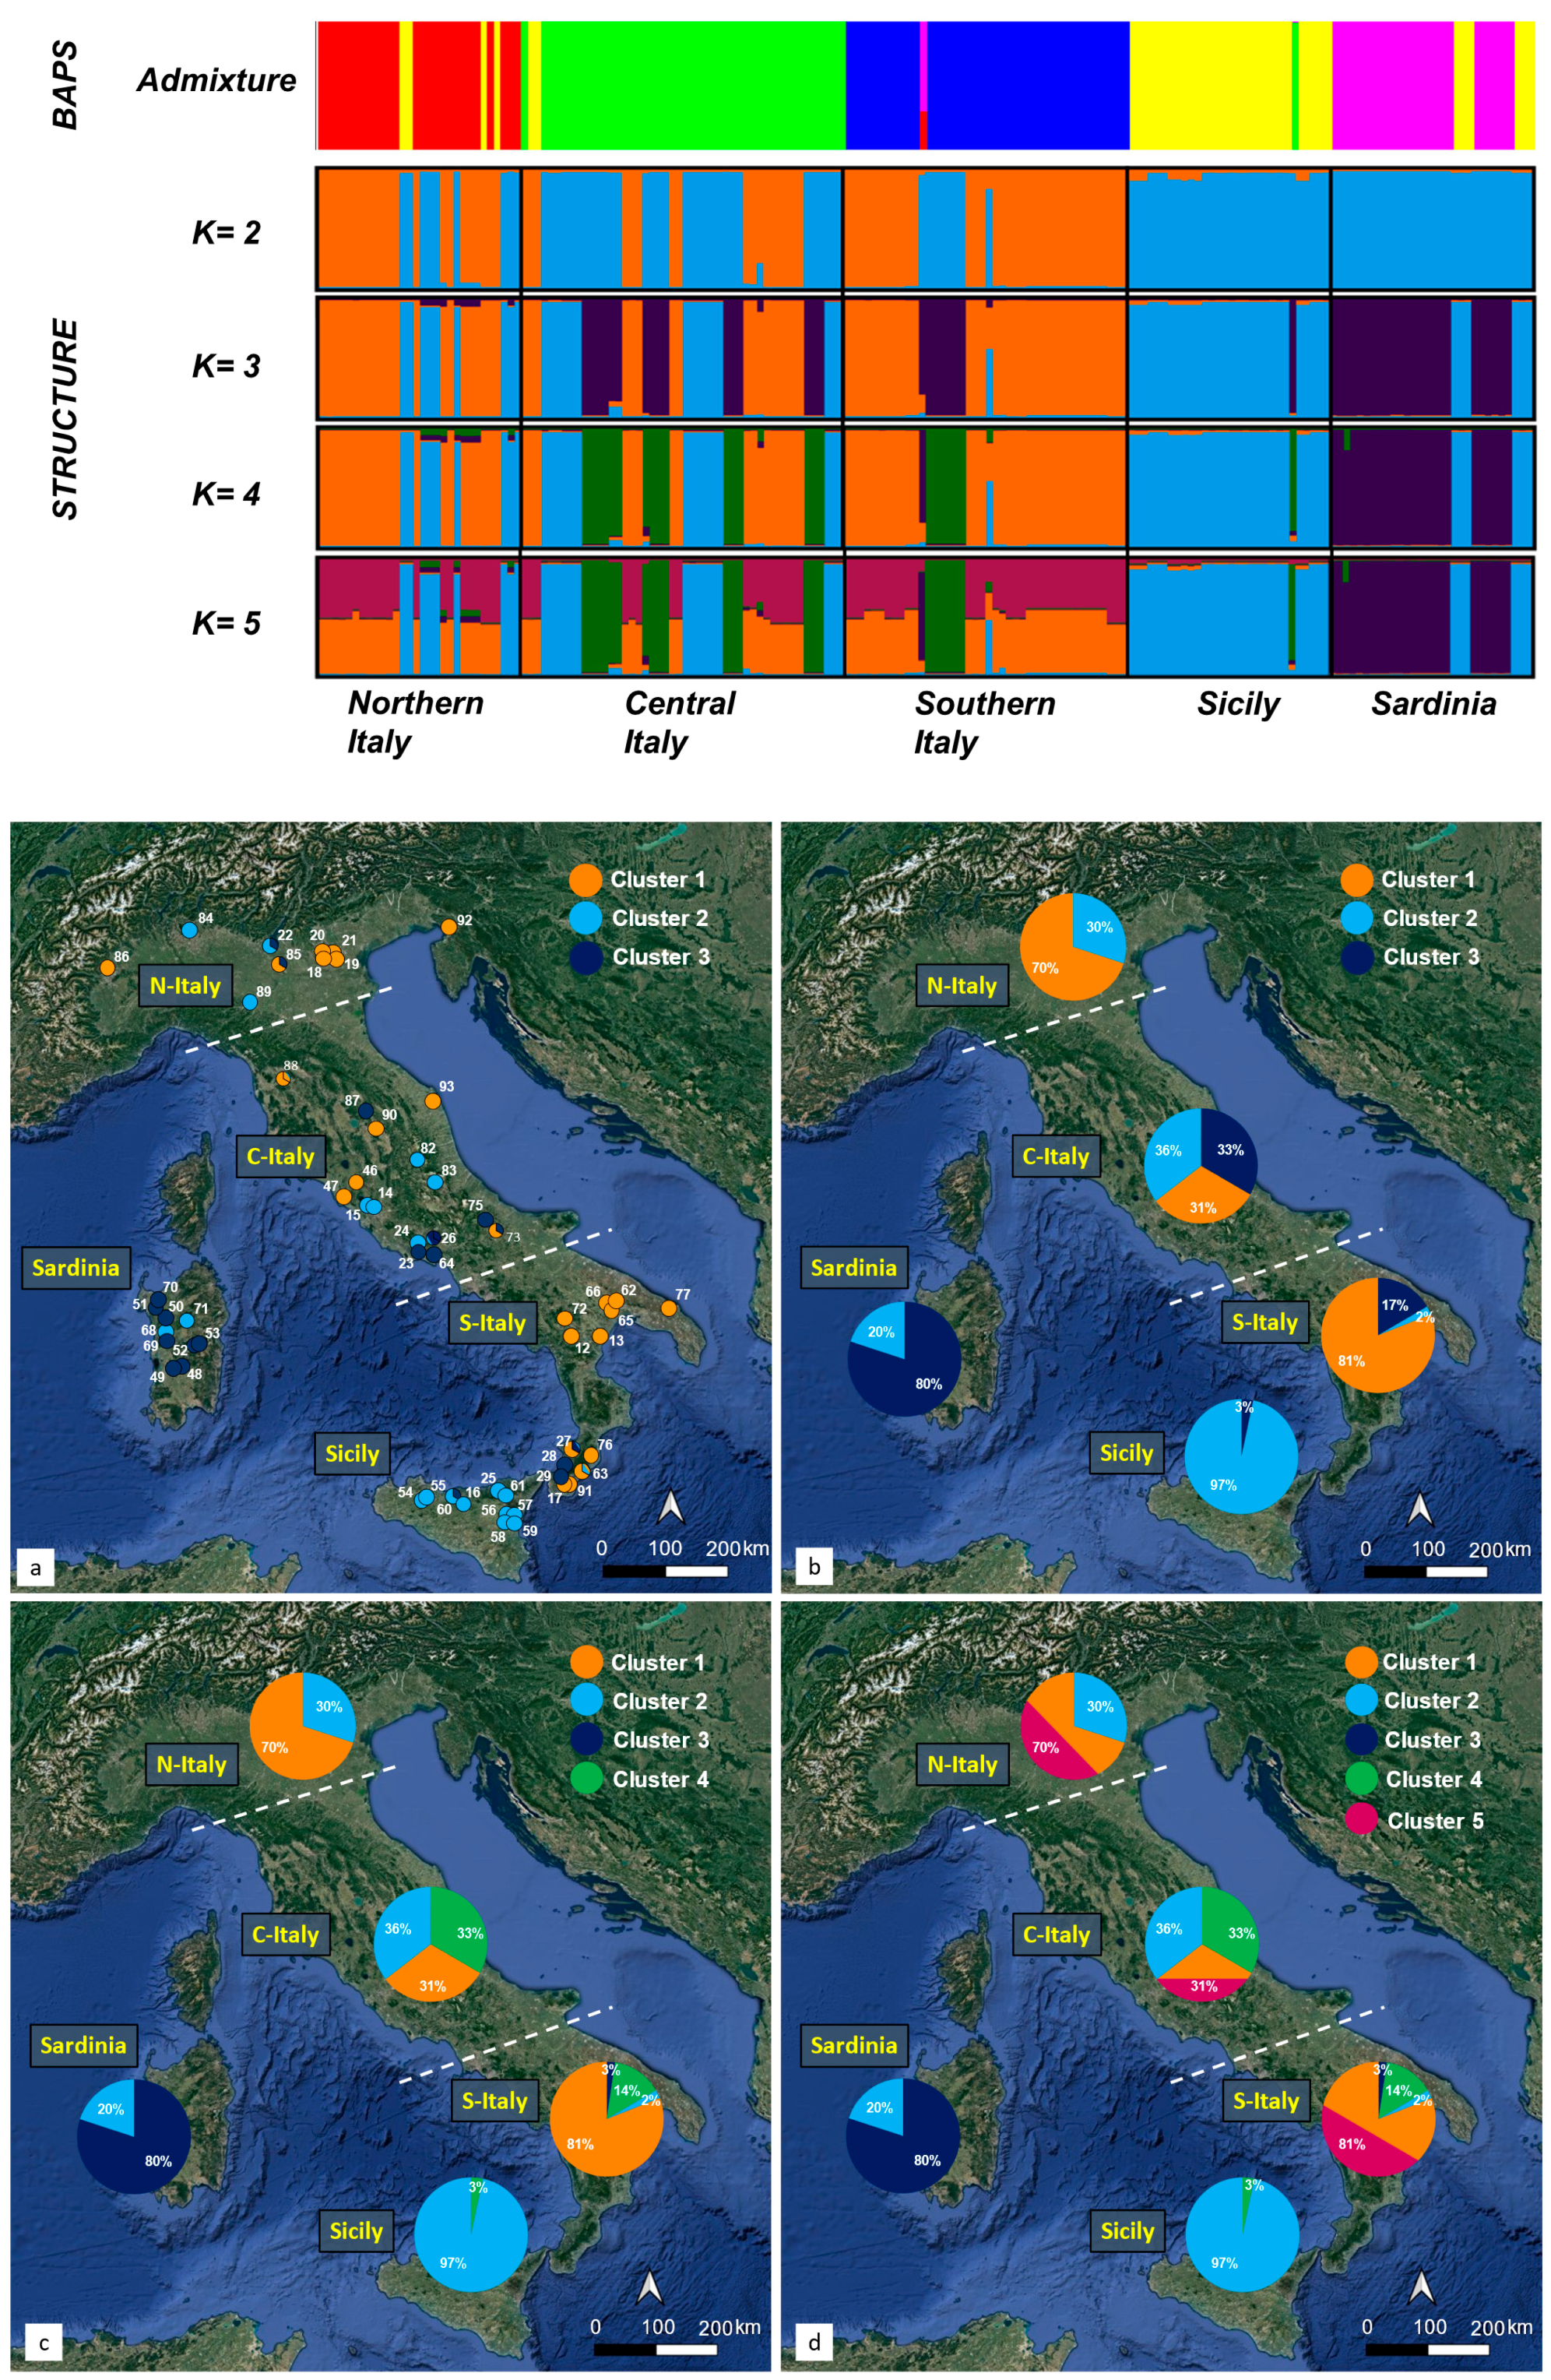
3.4. Genetic Structure

Figure 4 shows the results of BAPS and STRUCTURE clustering analyses. According to BAPS, the best partition was established at K = 5, which exactly corresponds to the number of geographical sectors into which the study area has been considered a priori to be divided. Instead, according to STRUCTURE, the number of genetic clusters (K) that best fit the data were found to be three, as also confirmed by the ΔK value obtained by using the Evanno method [72] (see Figure A1). The three clusters identified by STRUCTURE can be considered to geographically correspond to the Italian Peninsula, Sicily, and Sardinia. Owing to the fact that the best ΔK value suggested might not always represent perfectly the underlying structure of the data, and that additional information might emerge from interpretation of the K values close to the best ΔK value suggested by the Evanno method, the genetic structures for K = 2, K = 4, and K = 5 were analyzed and are discussed. In the specific case of our dataset, three further clusters were identifiable, passing from K = 3 to K = 5, in addition to the two main genetic clusters identified for K = 2 (Figure 4).
According to the minimum spanning network (MSN), seven main clusters of haplotypes were identified. These clusters were distinguished on the basis of the highest values of the genetic distance between adjacent haplotypes readable within each branch of the tree network. The five haplotypes exclusive to Sardinia were found to be concentrated in the two extremes of the network (#T, #R, and singleton #6 on the left side of the network displayed in Figure 5, with #S and #O haplotypes arranged on the right side). The Sicilian haplotypes are almost completely included within a single branch of the network and divided into two groups (light blue and blue in Figure 5) associated with the high-frequency haplotypes #E, #C, and #D. The two haplotypes exclusive to the northern Italy sector (#J and #Y) are arranged within the first branches of high-frequency haplotypes #E and #V. The haplotypes exclusive to the central Italy sector broadly exhibit two main concentration areas: one characterized by a group of singletons surrounding the high-frequency haplotype #X, which includes only individuals from southern Italy, and the other linked to a singleton from Sicily and to haplotype #CC (the latter also includes populations from southern Italy). The geographical distribution of the seven groups of haplotypes identified by the MSN is displayed in Figure A2.
In the PCoA (Figure 6), the first two axes bear 79.94% of the total variance. The seven groups identified in the MSN are also distinguishable in the PCoA diagram, roughly exhibiting a U-shaped distribution. Along axis 2, a separation between haplotypes exclusive to the Italian Peninsula (#V, #U, #W, #Y, and #X) is evident, arranged in the lower part of the diagram, and haplotypes from both the peninsula and the two islands are arranged in the upper part of the diagram. Along axis 1, the two haplotypes exclusive to Sardinia (#T and #R) are found to be clearly identifiable and separated from the rest in the upper right side of the PCoA diagram; the other two Sardinian endemic haplotypes #O and #S are arranged on the other side of axis 1. The proximity of haplotypes #C, #A, and #D to the group of Sardinian endemic haplotypes #O and #S at the left end of the diagram does not seem to fully express the genetic distance between these two groups of haplotypes, which is indeed well observable in the MSN. In fact, these two groups are found to be clearly separated from each other when a third axis is considered (Figure A3). Finally, haplotypes #CC, #GG, and #DD are found to be clearly distinguishable in the lower right side of the diagram. Figure A4 highlights the relationships between the clusters identified in the structure analysis and those derived from the MSN classification through their spatial distribution in the PCoA diagram. In general, a significant correspondence emerges between these two types of classification, where the five clusters identified by STRUCTURE are distributed neatly in the graphic ellipses corresponding to the groups derived from the MSN. The only significant difference concerns the two groups of haplotypes exclusive to Sardinia for which both the MSN and the PCoA itself identify two distinct lineages (#O and #S vs. #R and #T), where, instead, the STRUCTURE analysis maintains these lineages associated within the same group (dark-blue color) for values of ΔK ranging between 3 and 5.

4. Discussion

In this study, we used cpSSRs to investigate the genetic diversity and population genetic structure of 60 white oak populations of Italy. The overall dataset showed levels of total and within-population genetic diversity in line with the results obtained for 160 Italian white oak populations analyzed using chloroplast PCR-RFLP [34] and for 92 white oak populations from Western Europe investigated with 6 cpSSRs [42]. Our GST values also fall well within the ranges observed for 90 Central European white oak populations investigated at ten cpSSR loci [38] and, more generally, within the data compiled on 138 Angiosperm species investigated using different molecular techniques at the cpDNA [73]. Despite the generally lower number of individuals and populations considered, the number of cpSSR haplotypes detected in the present work are also comparatively higher than those found in Western, Central, and Eastern Europe, irrespective of the number of species investigated (two to five) [38,39,42,49].

4.1. Haplotype Distribution and Paleoecological and Paleogeographic Events

The haplotype distribution that we have found among Italian white oak populations follows a rather clear geographical structure which accords well with the current biogeographic features of the Italian Peninsula and with its paleoclimatic and paleogeographic history. Considering only the three geographical sectors into which the Italian Peninsula was divided for this study, (i.e., north, central, and south—leaving aside the islands of Sicily and Sardinia), the northern Italy sector stands out as the one showing the lowest number of haplotypes. This result was largely expected considering that northern Italy includes the southern slope of the Alps and the Po River plain whose deciduous forests were strongly affected by the Quaternary glaciations. The paleoclimatic conditions which prevailed along the entire southern slope of the Alps and the Po River plain after the Last Glacial Maximum (LGM) did not occur as a homogeneously increasing warming [74,75]. It was characterized by significant temperature oscillations, which strongly influenced the density and distribution of the deciduous oak forests and presumably had consequences for their haplotype richness and diversity. During the Bolling–Allerod stage (15 Ky BP), the white oak forests (e.g., the Q. petraea-pubescens group) expanded northwards, covering the Alps’ foothills and partially replacing the boreal coniferous forests that had descended the mountain slopes up to the plain during the LGM. During the subsequent Younger Dryas (YD) (12-10 ky BP), a cold and arid period was established which lasted for the first two millennia of the Holocene and led to a contraction of oak forests almost to the point of their complete disappearance.
The identification of two exclusive haplotypes (#J and #Y) for the white oak populations of northern Italy, alongside the occurrence in this sector of the most common haplotype in the whole dataset (#V), and the identification of a haplotype shared only with the southern Italy sector (#W) comply at least in part with the aforementioned chronological reconstruction. In fact, the foregoing scenario is explainable by hypothesizing the presence of isolated secondary glacial refugia located within the foothill areas of the Po valley characterized by mesoclimatic conditions significantly different from the typical regional macroclimate and thus able to host enclaves of deciduous forests [76,77]. Documented evidence of such glacial “micro-refuges” is available especially for geothermal areas (e.g., Arquà Petrarca thermal lake), where a continuous pollen record for deciduous oak forests across the whole LGM period was found [78]. It would be interesting to know whether the refuge areas of northern Italy represent a site of origin and genetic differentiation for the north Italy-exclusive haplotypes or, as is more probable, a conservative site for lineages shared with other South European refuge areas. Further research on a wider scale will be needed to provide additional information on this issue.
Moving southwards, we observed that both the central and southern Italy sectors exhibited a significant amount of signatures (14 and 10 haplotypes, respectively, with several singletons). Surprisingly, the central Italy white oak populations displayed a higher percentage of exclusive haplotypes compared to southern Italy ones (six vs. four), contradicting the generally held assumption that due to the effects of the glaciations being felt more intensively in Northern Europe and the Alps, the forest genetic diversity must necessarily become higher moving southwards. In general, this is indeed the case, and although the Italian Peninsula partly escapes this tendency (the Apennines are a mountain range oriented toward the meridians connecting the Alps to Sicily), it is true that the effects of the glaciation in the northern and central Apennines were much greater than in the southern Apennines [79,80,81]. However, this did not lead to a concentration of glacial refuges in southern Italy alone, but they were also found to be equally numerous in central Italy, especially along the Tyrrhenian side [28,33,82,83]. Instead, very few glacial refuges were found in the northern Apennines [84,85,86]. The Apennine range is very heterogeneous and extensive in latitude, meaning that it can be considered to be divided into two main blocks, the northern Apennines and the central–southern Apennines, having a different genesis and evolution. In biogeographic terms, the northern Apennines, made up mainly of siliceous rocks, show stronger links with the western Alps than with the rest of the Apennines; it is not by chance that many alpine species or species typical of conifer boreal forests or the alpine tundra find their southernmost limit in the northern Apennines (e.g., Picea abies, Pinus sylvestris, Rhododendron ferrugineus, Vaccinium vitis-idaea, Empetrum ermaphroditum, Juncus trifidus, etc.). In contrast, the central and southern Apennines (both mainly composed of limestone rocks) show many floristic and coenological similarities to each other, hosting many endemics and exhibiting a close link with the Balkan Peninsula, testified to by a very high number of amphi-Adriatic species with a high physiognomical role which do not occur in the northern Apennines and in the Alps (e.g., Anemone apennina, Carpinus orientalis, Carex kitaibeliana, Cytisus spinescens, Edraianthus graminifolius, Festuca bosniaca, Hippocrepis glauca, Leontopodium nivale, Lomelosia crenata, Salvia officinalis, Sesleria juncifolia, etc.). The numerous palynological studies carried out in central Italy [87,88,89,90,91] have shown that even during the YD, the percentage of deciduous tree species’ pollen (with oaks constituting the predominant part) remained much higher (close to 40%) than the percentage recorded in the northern Apennines and Po Valley [92]. This allowed for a reduced depletion of the genetic variability within the oak populations of central Italy and its rapid and intense widespread redistribution during the post-glacial reforestation stage. In the case of our study, the greater number of haplotypes found in central Italy compared to southern Italy could merely be due, at least in part, to the higher number of populations that we collected in the former area. However, the reasons are likely to be deeper. Indeed, a molecular study on Quercus robur in the Italian Peninsula [54] has recently identified central Italy as the geographical sector showing the highest genetic diversity for this species, attributing this result to the occurrence of a possible mosaic of small refugia that allowed Q. robur to persist during the LGM. What is more, a high genetic variability (in terms of allelic variability) for Castanea sativa was found in central Italy too, and this was explained by considering this area a convergence node of migratory routes from glacial refuges scattered throughout the Italian Peninsula [93,94].
The two large islands of Sicily and (especially) Sardinia are only partially involved in the biogeographical context of the peninsula of Italy. The difference in the number of haplotypes that emerges when comparing these two islands with each other can be attributed to the degree of isolation that they experienced during the paleogeographic evolution of the central Mediterranean Basin (see also Fortini et al. [52]). The Corsican–Sardinian block detached from the present Catalan–Provençal coast during the lower Miocene and rotated toward the center of the Tyrrhenian Sea where it settled definitively in the early Miocene. Connections with the mainland, if any, were short-lived and occurred during the Messinian salinity crisis with Sicily and North Africa and during the LGM (Quaternary Age) with the Italian Peninsula via the Tuscan Archipelago. In line with this, we found that five haplotypes, out of the seven found in Sardinia, are exclusive to this island, while the other two are shared with the central sector of the Italian Peninsula and with Sicily, respectively. In contrast, Sicily had repeated land connections with Calabria (the southernmost spur of the Italian Peninsula), especially during the Quaternary cold periods, and for this reason, it exhibits a significantly greater number of haplotypes shared with the peninsula of Italy.
Genetic features of the Sardinian haplotypes appear to be linked to the geographical position of the collection sites, where specimens from geographical areas very close to each other exhibit genetically related haplotypes. For example, #R and #T haplotypes, both of which are found exclusively in populations coming from central Sardinia, are very similar to each other (they differ in only one marker, with length of fragments very similar to each other) and are therefore interpreted as close allelic variants. A similar situation was found for haplotypes #O and #S in the northern Sardinia populations. The taxonomic identity of the specimens appears to have no influence on this result. This statement, which is quite obvious if we take Bartolucci et al. [17] as nomenclatural–taxonomic reference (since [17] reports Q. pubescens to be the only white oak present in Sardinia), also remains valid when adopting more divisive taxonomic frameworks [16,61,95]. This is because we found the allelic variants coming from pairs of similar haplotypes to involve different putative species (Q. congesta/Q. ichnusae, Q. virgiliana/Q. congesta). It is therefore conceivable that the white oak populations showing the two haplotype pairs (R-T; O-S) of central and northern Sardinia, respectively, belong to different phylogenetic lineages as the result of an ancient splitting from a common haplotype stock or to signatures deriving from different events of colonization from the mainland. The MSN (Figure 6) seems to support this hypothesis by placing the two pairs of Sardinian haplotypes (#O-#S and #R-#T) at the two ends of the MSN tree, separated from each other by significant genetic distance. More than a hypothesis, instead (by virtue of the congruent geographical distribution), is that within each pair of similar Sardinian haplotypes, one of the two could be the natural derivation of the other. If this were the case, however, it would not be possible to establish, within each pair, which haplotype should be considered the older and which the derived one, as both are exclusive to Sardinia. This result is consistent with what has already been found by Fortini et al. [52] for the same Sardinian populations, where the individuals bearing #O-#S and #R-#T haplotypes fall into two different plastid haplotypes on the basis of the variability in the two combined plastid loci (trnH-psbA and trnK-matK).
Pairs of genetically similar haplotypes occupying the same geographical area are identified for Sicily too, although in this case, the ecological factor also seems to play a role. In fact, haplotypes #B and #E are found, respectively, in populations from Etna volcano slopes and W-Nebrodi mountains, both developed on acidic substrates. Instead, haplotypes #D and #A come from the Madonie and Sicani mountains and therefore from oak populations developed on limestone substrates. Unlike Sardinia, the position of the exclusive Sicilian haplotypes (#D and #A) is more or less central in the MSN tree network (Figure 5), displaying closer connections with haplotypes occurring in the peninsula of Italy (e.g., #C, #U, and #B), and is therefore perfectly in agreement with Sicily’s lower degree of geographic (and genetic) isolation. Again, this interpretation appears to be consistent with the cpDNA results published in Fortini et al. [52].
One piece of datum that seems interesting concerns the degree of haplotype variability observed within single populations (Figure 3). It emerges that southern Italy is characterized by a higher number of homogeneous haplotype populations compared to central and northern Italy, whilst Sicily and Sardinia exhibit the highest degree of intra-population variability. This result could be useful in providing preliminary information on the propensity of the different Italian geographical sectors to promote intra-population diversity. This will only be verifiable by carrying out more exhaustive and homogeneous spatial sampling.

4.2. Haplotype Distribution vs. Taxonomical Identity

The calculation of the haplotype variability expressed by the oak macro-species (i.e., Q. frainetto, Q. robur, Q. petraea s.l., and Q. pubescens s.l.) shows that this variability is not shared equally among the different macro-species, since each individual macro-species exhibits haplotypes which do not occur in the other ones. These results are not completely in agreement with what was recently published for the Crimean Peninsula (southern Ukraine) by Semerikova et al. [50]. In this latter study, where the cpDNA of the same group of white oak species (except for Q. frainetto) was investigated, no significant differences in haplotype composition were highlighted when comparing the different species. Instead, we found that Q. frainetto exhibits a gene diversity value (0.468) higher than that exhibited by both Q. petraea and Q. robur complexes, although the number of haplotypes (5) identified within the Q. frainetto populations are lower than those identified within Q. petraea (11) and Q. robur (7) populations. Moreover, Q. frainetto exhibits a dominance of the #U haplotype in two populations located at the two boundaries of the species’ Italian distribution range (S-Umbria in the north and S-Calabria in the south), while the #V haplotype occurs in another population from southern Italy and central Italy, too. On the other hand, the populations of Q. frainetto occurring within the Tyrrhenian side of central Italy show completely different plastid genetic features which involve other haplotypes (#BB, #C, and #CC). Owing to the fact that using microsatellites in the study of plastid DNA does not allow the events to be dated chronologically, the reasons for the aforementioned haplotype distribution can only be hypothesized. One possible explanation might be that as Q. frainetto is an amphi-Adriatic species with a range centered in the Balkan Peninsula, the observed haplotype distribution could be the result of different migratory waves that took place from the Balkan to the Italian Peninsula, taking advantage of the land bridges that periodically connected the two sides of the Adriatic Sea. The first appearance of Q. frainetto and other SE European oaks (e.g., Q. trojana and Q. ithaburensis subsp. macrolepis, both restricted to SE Italy) in the proto-Italian Peninsula is thought to date back to the late Miocene, when land bridges temporarily existed between the SW Balkans and the Apulian shelf [96]. The current wider occurrence and ecological amplitude of Q. frainetto in southern Italy compared to central Italy [97] could have resulted precisely from this tertiary migration on the S Balkans–S Italy route (together with the greater survival rate of Q. frainetto in S Italy during the Quaternary due to the low impact that glaciations had in this area). These southern populations may have later reached central Italy and undergone subsequent genetic differentiation. However, it cannot be excluded that further Q. frainetto waves of migration from the Balkans may have occurred further north during the cold periods of the Quaternary along the CW Balkans–C Apennines route, taking advantage of the drying up of the northern and central Adriatic Sea. These Quaternary migrations could have raised the chloroplast genetic variability in central Italy Q. frainetto populations while maintaining qualitative differences with the populations of southern Italy.
Somewhat unexpected are certain aspects of the haplotype diversity observable inside the collective group of Quercus petraea. In particular, the separation between the populations of the Aspromonte massif (S-Calabria) from those of the Madonie mountains (Sicily) strikes us as a little peculiar. Indeed, both of these populations are currently assigned to the southern Italy endemic taxon Q. petraea subsp. austrotyrrhenica and are considered taxonomically separated from the populations of the rest of the Italian Peninsula generally ascribed to Q. petraea subsp. petraea (see [6,16,17]). The fact that the presumed Q. petraea subsp. austrotyrrhenica populations from the southern end of Calabria show stronger phylogeographic links with the populations of the rest of the Italian Peninsula currently assigned to subsp. petraea rather than with the populations of Q. petraea subsp. austrotyrrhenica occurring in Sicily is in partial disagreement with the aforementioned taxonomical framework. This haplotype distinction between oak populations belonging to two virtually bordering areas (Calabria and Sicily), separated from each other by only a 3 km wide stretch of sea (Strait of Messina), lends support to the call to reconsider the effectiveness of the Strait as a barrier to the migration of white oaks, as already hypothesized in previous papers (see [26,98]).
The geographical haplotype distribution observed within the Q. pubescens collective group (the one including the largest number of populations in our dataset) is characterized by the complete absence of haplotype #V (the haplotype displaying the widest distribution in our database and involving the highest number of individuals) in all of the populations of Q. pubescens s.l. occurring in central and southern Italy, whereas this haplotype (#V) acts as the most common in the Q. pubescens populations of northern Italy. The Q. pubescens collective group has also been found to be the one displaying the highest number of exclusive haplotypes (seven plus six singletons), showing a wide gap when compared to the other white oak species (Q. petraea, one plus three singletons; Q. frainetto, one; Q. robur, one). Obviously, this higher haplotype diversity found in the Q. pubescens complex cannot fail to be related, at least in part, to the preponderance of populations belonging to this complex in our sampling. However, the figures tell us that the diversity would still be higher than in the other species complexes even considering the percentage ratios excluding singletons. This high diversity rate of Q. pubescens at the cpDNA level confirms what already emerged from nuclear DNA analyses carried out on white oak populations in various SE European countries [8,24,99]. Analyzing it from an interdisciplinary perspective, this result is also consistent with the well-known high morphological variability in Q. pubescens normally observed within both individuals and populations in Italy [16,23,100] and with the wide ecological amplitude of the Italian Q. pubescens communities [101,102,103].

4.3. Haplotype Distribution vs. Geographical Structure

The genetic features of the populations reflect a clear geographical structure. The five optimal clusters identified by BAPS (Figure 4; upper part) are clearly related to the five geographical sectors into which the Italian territory has been divided (N Italy, C Italy, S Italy, Sicily, and Sardinia). The BAPS analysis, therefore, considers the five sectors as belonging to the same hierarchical level and having roughly the same importance in a phylogeographic key. More detailed information was obtained from the STRUCTURE analysis, which instead identifies the optimal number of clusters as three. These three clusters correspond to the Italian Peninsula (taken as a whole), Sicily, and Sardinia. Accordingly, the three sectors (northern, central, and southern) of the Italian Peninsula should more correctly be considered at the rank of “sub-clusters”, thus bearing a “phylogeographic weight” that is lower than the weights of Sicily and Sardinia. Compared to the BAPS analysis, a higher degree of admixture within the single geographical sector and subsectors emerges from the STRUCTURE results. Starting from the two main genetic macro-clusters identified by K = 2 (orange and light-blue groups), we witness a splitting into new groupings of the genetic structure of the populations by increasing delta K until it equals what the Baps analysis considers the optimal number (K = 5). For K = 3, a genetic subdivision of the light-blue group (identifiable in the dark-blue group of Figure 4) is observable. This new dark-blue group occurs mainly in Sardinia, but also in Sicily (minimally) and in central and southern Italy, and it was found to be characterized by several haplotypes exclusive to the aforementioned three sectors (#C and #CC for central Italy; #X for southern Italy; #T, #S, #R, and #O for Sardinia). The occurrence of the dark-blue group could be hypothesized to be the result of a trans-Tyrrhenian W-E migration (from Sardinia to the Italian Peninsula) and subsequent colonization. The geographical isolation of Sardinia allowed this island to preserve its haplotype structure characterized by two main genetic lineages, as displayed by the simulation with K = 4, where, instead, both Sicily (minimally) and the peninsula of Italy exhibit a further “green” subgroup including the oak individuals previously included in the dark-blue group. The simulation with K = 5 shows a clear development of the other main genetic lineage (orange group) in the three subsectors of the peninsula of Italy, while Sicily and Sardinia remain stable, reflecting the consequences of the geographical isolation. However, considering the presence of such a high number of haplotypes restricted to Sardinia, some populations of the island would be expected to contain signs of ancestral cpDNA. Instead, this expectation was not confirmed in Fortini et al. [52], where the two most ancestral haplotypes identified on the basis of gene sequences were found to be missing in Sardinia, whereas they were found in central and southern Italy and in Sicily.

4.4. What Has Changed Compared to Previous Investigations?

Comparing the results of our study with those published twenty years ago by Fineschi et al. [34,98], we can make the following observations. Central Italy is confirmed to be the geographical sector, out of the three constituting the Italian Peninsula, displaying the highest haplotype diversity within populations (HS in Table 4). However, in our study, Sicily and Sardinia exhibit values of HS significantly higher than those found in the three geographical sectors of the Italian Peninsula and significantly higher than the HS values found in Fineschi et al. [34] (2002) for these two islands. Furthermore, Sicily has here been confirmed as the geographical sector displaying the lowest total and among-population haplotype diversity (Table 4). However, in our study, it is central Italy and not Sardinia (as instead found in Fineschi et al. [34]) that is the sector displaying the highest value for this parameter. The genetic differentiation among populations (GST) calculated for the whole Italian Peninsula was found to be significantly lower (0.554) than that found in Fineschi et al. [34] (0.828), and this is probably due to the higher number of populations investigated and the different molecular approach used in this latter study [73]. The highest GST value per geographic sector was, in our study, found for southern Italy (0.839), with relatively low values for Sicily (0.345) and Sardinia (0.425), whereas the latter island exhibited by far the highest value (1.000) in Fineschi et al. [34]. To summarize, the results of the two cpDNA-based studies both carried out on the whole Italian Peninsula and its major islands twenty years apart from each other displayed some confirmations and several unexpected differences. It is probable that some of these differences could be related to the different number of populations sampled (161 in Fineschi et al. [34] and 60 in our study). Despite the significantly higher number of populations and individuals analyzed by Fineschi et al. [34], however, the final number of haplotypes found twenty years ago (10) were much lower than the number of haplotypes found in our study (28). The difference in markers used certainly influenced this result, testifying to a greater efficiency of cpSSRs for this type of analysis. Nonetheless, we believe that the nature of the differences found goes far beyond a mere (quantitative) numerical issue. In fact, they also appertained to the qualitative aspect of the data and led us to propose new or partially different interpretations to those advanced in previous papers by other authors.

5. Conclusions

Our study, based on the application of cpSSR markers, allowed us to improve the only available, partial picture of the white oaks’ genetic diversity in the Italian Peninsula and its major islands, detailing the extent and organization of the chloroplast DNA diversity, the geographical distribution of lineages, and the spatio-temporal dynamics in an unprecedented taxonomic investigation. The cpSSR variation produced a substantial level of polymorphism, allowing for the detection of about three times the number of haplotypes currently catalogued in Italy. The results obtained and the new interpretations that we advanced turned out to be only partially in agreement with those argued previously by other authors. The cpDNA diversity was found to be higher in central Italy than in southern Italy, whereas northern Italy (expected) and Sicily (surprisingly) displayed the lowest degree of haplotype diversity. The cpDNA features of the Sardinian populations turned out to be significantly different from those of the rest of the Italian Peninsula and Sicily, confirming geographical isolation to have played a major role in producing long-term differentiation and genetic segregation. On the other hand, the occurrence of haplotypes displaying a wide distribution within the whole study area, such as “E” and “#V”, might well indicate a distant common ancestry (see [52,104]). The observation of the haplotype variability for taxonomic macro-species (Q. frainetto, Q. petraea, Q. pubescens, and Q. robur) highlighted some unexpected discontinuities in their haplotype distribution (see Q. petraea subsp. austrotyrrhenica and Q. frainetto) which allowed us to hypothesize relationships between these species’ current distribution and precise palaeoecological or paleogeographic events. All of these findings underline the importance of the peninsula of Italy and its major islands as a mosaic of multiple refugia for the persistence of tree species and their genetic variation during the Quaternary [51], and throw into relief the regrettable lack of similar studies in the other macro-refugial areas of Southeastern Europe. It is desirable, in view of the predicted future environmental changes, that the improved genealogical patterns and biogeographical legacies that have emerged in our study might provide useful pointers for developing adequate management and conservation strategies to preserve biodiversity, especially, as is the case with white oaks, when taxonomy is still uncertain [105]. Accordingly, special measures (e.g., seed banking for artificial plantations and the implementation of bio-ecologically representative conservation networks) will certainly be needed for the individuals presenting rare genetic variants. In our study, as well as in previous ones [31], it has emerged that a high number of trees exhibit singletons or very rare haplotypes. This testifies to progressive genetic erosion among white oaks, the causes of which may reasonably be assumed to have a long-lasting human impact (see Fady et al. [106] and Médail [107]), and it is possible that the frequent and increasingly intense (especially in the Mediterranean area) episodes of oak decline are linked to global warming [108,109,110]. From this perspective, scientists, policy makers, and forest stakeholders still need to develop an effective set of options in order to harmonize landscape planning, management, and preservation of the immeasurable value of forest genetic resources.

Author Contributions

R.D.P., P.F., L.Q., C.M. and M.C.S. designed the study and wrote the first draft of the paper; R.D.P., P.F., E.P. and M.C.S. (together with the colleagues mentioned in the acknowledgments) collected the plant material; L.Q., C.M. and P.D.M. generated and analyzed the molecular data; R.D.P., P.F. and M.C.S. analyzed and interpreted the phylogeographic issues; R.D.P., P.F., E.P., P.D.M., C.M., L.Q. and M.C.S. discussed the results and finalized the paper. All authors have read and agreed to the published version of the manuscript.

Funding

This study was supported by (a) MUR PRIN 2022, project code: 2022B3HA72, project title: “Xerothermic deciduous oaks, a still-unsolved genetic, taxonomic and coenological issue of a valuable forest resource in Mediterranean countries. From the safeguard of landscape identity to the planning of Urban forests” (PI. R. Di Pietro, UO P. Fortini) CUP B53D23011890006; (b) the National Recovery and Resilience Plan (NRRP), Mission 4 Component 2: Investment 1.4—Call for tender No. 3138 of 16 December 2021, rectified by Decree n.3175 of 18 December 2021 of the Italian Ministry of University and Research; Award Number: project code CN_00000033, Concession Decree No. 1034 of 17 June 2022 adopted by the Italian Ministry of University and Research, project funded by the European Union—“NextGenerationEU NBFC”; (A) R. Di Pietro: CUP B83C22002950007, project title “National Biodiversity Future Center”; (B) P. Fortini and P. Di Marzio Project: Strengthening of research structures and creation of “National R&S samples on some Key Enabling Technologies”: CUP H73C22000300001; (C) MC Simeone: Project ECS 0000024 Rome Technopole CUP B83C22002820006, Investment 1.5; (c) PROGET_20232024_Wikiplantbase_START_UP_DIMARZIO.

Data Availability Statement

The genetic analysis and inference file outputs are openly available at https://figshare.com/articles/dataset/_/25375858 (accessed on 11 April 2024). Other relevant data are contained within the manuscript.

Acknowledgments

The authors wish to thank their colleagues who have helped in collecting the specimens of white oaks in different places of Italy. They are A.L. Conte, F. Conti, E. Farris, L. Filesi, L. Gianguzzi, D. Iamonico, G. Misano, L. Rosati, and G. Spampinato (Italy). For the same reason, we thank the Park Directors L. De Filippis, G. De Marchis, and G. Marzano, the Park Rangers D. Di Fazio and colleagues (Ausoni Mountains and Fondi Lake Regional Park) and M. Patriarca, P. Perrella, and F. Soscia (Aurunci Mountains Regional Park). We also thank Marcello Cherubini from the IRET-CNR Institute for their help with the laboratory activity. Jim McManus kindly improved our English.

Conflicts of Interest

The authors declare no potential sources of conflicts of interest.

Appendix A

Table A1. Taxonomic, bioclimatic, lithological, and geographic features of the sampling stands. Pop: population identification code; BR: bioclimatic region; Lith: lithology; Alt: altitude (m a.s.l.).
PopSpecies
Complex
TaxonBR 1Lith. 2Alt.Latitude (N);
Longitude (E) (WGS84) Adm. Region—Sector 3
IT12-Q. frainettoToTes72540.2422; 16.0551
Basilicata—S-IT
IT13-Q. roburMoCls540.1741; 16.6997
Basilicata—S-IT
IT14-Q. roburtMoTcs11241.5515; 12.2112
Lazio—C-IT
IT15Q. pub.Q. pubescenstMoEi10541.9546; 12.4195
Lazio—C-IT
IT16Q. petr.Q. petraea subsp. austrotyrrhenicaToCas140837.8583; 14.0580
Sicily—SIC
IT17Q. petr.Q. petraea subsp. austrotyrrhenicaMoM19538.14604; 16.0599
Calabria—S-IT
IT18Q. pub.Q. pubescensTsCas4245.2745; 11.7416
Veneto—N-IT
IT19Q. petr.Q. dalechampiiTsEi1045.3430; 11.7617
Veneto—N-IT
IT20Q. petr.Q. petraeaTsEi24245.3173; 11.6877
Veneto—N-IT
IT21-Q. roburTsEi5645.3227; 11.7408
Veneto—N-IT
IT22Q. pub.Q. pubescensTsCls7645.4319; 10.6256
Lombardia- N-IT
IT23Q. pub.Q. pubescensMoTcs1641.3640; 13.3391
Lazio—C-IT
IT24-Q. frainettotMoEi8941.4862; 13.3105
Lazio—C-IT
IT25Q. pub.Q. virgilianatMoCas66938.0689; 14.7373
Sicily—SIC
IT26-Q. frainettotToCas57641.3588; 13.5265
Lazio—C-IT
IT27Q. pub.Q. dalechampiiMoTcs26038.6265; 16.1628
Calabria—S-IT
IT28Q. pub.Q. dalechampiiMoTcs7038.3778; 15.9396
Calabria—S-IT
IT29Q. pub.Q. congestaMoIi98038.2107; 15.9163
Calabria—S-IT
IT46Q. petr.Q. petraeaToEi60942.3236; 12.1302
Lazio—C-IT
IT47Q. petr.Q. petraeatMoEi35842.1469; 11.9407
Lazio—C-IT
IT48Q. pub.Q. ichnusaetMoCas/Ei28339.8158; 8.9486
Sardinia—SAR
IT49Q. pub.Q. virgilianatMoCas56739.7871; 8.7892
Sardinia—SAR
IT50Q. pub.Q. ichnusaeMoM52940.4685; 8.6721
Sardinia—SAR
IT51Q. pub.Q. virgilianaMoEi24640.6136; 8.5034
Sardinia—SAR
IT52Q. pub.Q. congestatMoIi83140.1096; 9.2489
Sardinia—SAR
IT53Q. pub.Q. congestaMoIi92140.1289; 9.3027
Sardinia—SAR
IT54Q. pub.Q. leptobalanaMoCas91937.8841; 13.3831
Sicily—SIC
IT55Q. pub.Q. virgilianatMoCas53837.9563; 13.4239
Sicily—SIC
IT56Q. pub.Q. congestatMoEi129837.7095; 14.9621
Sicily—SIC
IT57Q. pub.Q. dalechampiiToEi140037.7062; 14.9672
Sicily—SIC
IT58Q. pub.Q. virgilianatMoM54437.5917; 15.0447
Sicily—SIC
IT59Q. pub.Q. virgilianatMoM54037.6086; 15.0723
Sicily—SIC
IT60Q. pub.Q. congestatMoCas117937.9054; 13.9936
Sicily—SIC
IT61Q. pub.Q. congestatMoCas132737.9415- 14.8762
Sicily—SIC
IT62-Q. roburMoTcs34240.6259; 16.8121
Puglia—S-IT
IT63Q. pub.Q. congestatMoIi119038.4813; 16.3411
Calabria—S-IT
IT64Q. pub.Q. pubescenstToCas57641.3588; 13.5266
Lazio—C-IT
IT65-Q. roburMoCas3941.0925; 16.8223
Puglia—S-IT
IT66Q. pub.Q. virgilianaMoCas3941.0925; 16.8223
Puglia—S-IT
IT68Q. pub.Q. pubescensMoCls9138.0689; 9.0594
Sardinia—SAR
IT69Q. pub.Q. ichnusaeMoM78040.2382; 8.6978
Sardinia—SAR
IT70Q. pub.Q. congestaMoEi14740.7461; 8.5361
Sardinia—SAR
IT71Q. pub.Q. congestaMoIi91640.4277; 9.0069
Sardinia—SAR
IT72Q. pub.Q. pubescensToTes79640.4600; 15.9745
Basilicata—S-IT
IT73Q. petr.Q. petraeaToC61041.3316; 14.3650
Molise—C-IT
IT75Q. pub.Q. pubescensToCas61041.3302; 14.3701
Molise—C-IT
IT76Q. pub.Q. pubescensToIi109138.4813;16.3411
Calabria—S-IT
IT77Q. pub.Q. pubescensMoTcs2340.6584;17.887
Puglia—S-IT
IT82Q. pub.Q. pubescensToCas101442.6205; 13.2173
Lazio—C-IT
IT83Q. pub.Q. pubescensToCas130342.3362; 13.5901
Abruzzo—C-IT
IT84-Q. roburTsCls20245.6213; 9.0943
Lombardia—N-IT
IT85-Q. roburTsTcs2145.2045; 10.7534
Lombardia—N-IT
IT86-Q. roburTsCls27645.1485; 7.5962
Piemonte—N-IT
IT87Q. petr.Q. petraeaToTes34643.2837; 12.3420
Umbria—C-IT
IT88Q. petr.Q. petraeaTo-sCls6743.7353; 10.7334
Toscana—C-IT
IT90-Q. frainettotTo-sTcs20443.0946;12.4672
Umbria—C-IT
IT91-Q. frainettoMoTcs34738.22470- 16.0453
Calabria—S-IT
IT93Q. pub.Q. pubescensTsCas45845.6282;13.8784
Friuli—N-IT
IT93Q. pub.Q. pubescenstTo-sCls1043.4676; 13.5917
Marche—C-IT
1 Bioclimatic regions (according to Blasi et al. [111]): Mo = Mediterranean oceanic, tMo = trans Mediterranean oceanic, To = Temperate oceanic, To-s = Temperate oceanic–semicontinental, Ts = Temperate semicontinental, and tTo = trans Temperate oceanic. 2 Lithology (according to Blasi et al. [111]): Cas = carbonate sedimentary, C = clastic, Cls = clastic sedimentary, Cs/Ei = carbonate sedimentary/effusive igneous, Ei = effusive igneous, Ii = intrusive igneous, Me = metamorphic, Tcs = terrace clastic sedimentary, and Tes = terrigenous sedimentary. 3 Geographic sector (according to Pignatti [55] and Blasi et al. [56]): C-IT = central Italy, N-IT = northern Italy, S-IT = southern Italy, SAR = Sardinia, and SIC = Sicily.
Table A2. Loci, alleles, and allele frequency (total number of individuals: 180).
udt1udt1_810.678
udt1_820.311
udt1_830.011
ucd5ucd5_740.217
ucd5_750.667
ucd5_770.117
ucd4ucd4_940.139
ucd4_950.356
ucd4_970.322
ucd4_980.072
ucd4_990.111
udt3udt3_1250.139
udt3_1260.461
udt3_1270.356
udt3_1280.044
Cmcs6CmCs6_2000.328
CmCs6_2020.139
CmCs6_2030.533
Mean 0.278
Table A3. Syntaxonomic classification of the forest communities within each site of collection.
Pop.Species
Complex
TaxonGeograph.
Sector
Site of Collection (Adm. Province)Syntaxonomy
IT12-Q. frainettoS ItalyRustico, San Mart. d’Agri (PZ)Melittio albidae-Quercion frainetto Quezel et al. in Bonin & Gamisans 1976
IT13-Q. roburS ItalyOasi Pantano di Policoro (MT)Rubio peregrinae-Fraxinetum oxycarpae Biondi & Allegrezza 2004 var with Q. robur
IT14-Q. roburC ItalyInsugherata (RM)Rubio peregrinae-Quercetum cerris Di Pietro et al. 2010 var. with Q. robur
IT15Q. pub.Q. pubescensC ItalyInsugherata (RM)Roso sempervirentis-Quercetum pubescentis Biondi 1986
IT16Q. petr.Q. petraea
subsp. austrothyrr.
S ItalyBosco Pomieri, Geraci Siculo (PA)Ilici-Quercetum austrotyrrhenicae Brullo & Marcenò in Brullo 1984 corr. Brullo 2002
IT17Q. petr.Q. petraea
subsp. austrothyrr.
S ItalyPollia (Asprom.). San LucaAristolochio luteae-Quercetum austrotyrrhenicae Brullo et al. 1999
IT18Q. pub.Q. pubescensN ItalyColli Euganei (PD)Fraxino orni-Ostryon carpinifoliae Tomazic 1940 (Quercetalia pubescenti-petraeae)
IT19Q. petr.Q. petraeaN ItalyColle S.Daniele (PD)Physospermo-Quercion petraeae A.O. Horvat 1976
IT20Q. petr.Q. petraeaN ItalyM. Venda (PD)Melampyro vulgati-Quercetum petraeae Puncer et Zupančić 1979
IT21Q. roburQ. roburN ItalyTorreglia; M.Rua; Roccapendice (PD)Asparago tenuifolii-Quercetum roboris (Lausi 1967). Marincek 1994
IT22Q. pub.Q. pubescensN ItalyOme, San Martino (BS)Quercetalia pubescenti-petraeae Klika 1933
IT23Q. pub.Q. pubescensC ItalyMonte San Biagio (LT)Pistacio terebinthi-Quercetum pubescentis (Blasi et Di Pietro 1998) Allegrezza et al. 2003
IT24-Q. frainettoC ItalySelvapiana
Amaseno (FR)
Quercus frainetto community (Crataego-Quercion cerridis Arrigoni 1998)
IT25Q. pub.Q. virgilianaS ItalyValle del Fitalia (Frazzanò, ME)Erico arborae-Quercetum virgilianae Brullo et Marcenò 1985
IT26-Q. frainettoC ItalyParco Monti Aurunci (LT)Quercus frainetto community (Crataego-Quercion cerridis Arrigoni 1998)
IT27Q. pub.Q. dalechampiiS ItalySerre, Sant’Angelo-Pizzoni (VV)indivisuals of Q. dalechampii in the Erico arborae-Quercetum virgilianae Brullo e Marcenò 1985
IT28Q. pub.Q. dalechampiiS ItalyAspromonte, Croce Mammone (RC)indivisuals of Q. dalechampii in the Oleo oleaster-Quercetum virgilianae Brullo 1984
IT29Q. pub.Q. congestaS ItalyAspromonte, Piani di Carmelia (RC)Erico-Quercetum congestae Brullo et al. 2001
IT46Q. petr.Q. petraeaC ItalyMonti Cimini (VT)individuals of Q. petraea in Coronillo emeri-Quercetum cerridis Blasi 1984 var. with Q. petraea
IT47Q. petr.Q. petraeaC ItalyTolfa mountains (Roma)Carici olbiensis-Quercetum petraeae Di Pietro et al. 2010
IT48Q. pub.Q. ichnusaeSardiniaSenis (OR)Ornithogalo pyrenaici-Quercetum ichnusae Bacchetta et al. 2004
IT49Q. pub.Q. virgilianaSardiniaPau (OR)Lonicero implexae-Quercetum virgilianae Bacchetta et al. 2004
IT50Q. pub.Q. ichnusaeSardiniaMonte Traessu (SS)Ornithogalo pyrenaici-Quercetum ichnusae Bacchetta et al. 2004
IT51Q. pub.Q. virgilianaSardiniaIttiri SS)Lonicero implexae-Quercetum virgilianae Bacchetta et al. 2004
IT52Q. pub.Q. congestaSardiniaFonni (Muggiana) (NU)Glechomo sardoae-Quercetum congestae Bacchetta et al. 2004
IT53Q. pub.Q. congestaSardiniaFonni (Govossai) (NU)Glechomo sardoae-Quercetum congestae Bacchetta et al. 2004
IT54Q. pub.Q. leptobalanaSicilyBosco Ficuzza (PA)Quercetum leptobalani Brullo 1984
IT55Q. pub.Q. virgilianaSicilyMarineo (PA)Oleo-Quercetum virgilianae Brullo 1984
IT56Q. pub.Q. congestaSicilyEtna Volcano (CT)Arabido turritae-Quercetum congestae Brullo e Marcenò 1985
IT57Q. pub.Q. dalechampiiSicilyEtna Volcano (CT)Quercenion dalechampii Brullo 1984
IT58Q. pub.Q. virgilianaSicilyEtna. M. Ceraulo, Mascalucia (CT)Oleo-Quercetum virgilianae Brullo 1984
IT59Q. pub.Q. virgilianaSicilyEtna. Tre castagni, (CT)Celtido aetnensis-Quercetum virgilianae Brullo e Marcenò 1985
IT60Q. pub.Q. congestaSicilyMadonie, Piani Torre-Zucchi (PA)Conopodio capillifolii-Quercetum congestae Maniscalco & Raimondo 2009
IT61Q. pub.Q. congestaSicilyValle del Flascio. Nebrodi (ME)Festuco heterophyllae-Quercetum congestae Brullo & Marcenò 1986
IT62Q. roburQ. roburS ItalyTafuri (BA)Quercus robur isolated individuals in Stipo-Quercetum dalechampii Biondi et al. 2004
IT63Q. pub.Q. congestaS ItalySerre, Sant’Angelo Nardodipace (VV)Festuco heterophyllae-Quercetum congestae Brullo & Marcenò 1986
IT64Q. pub.Q. pubescensC ItalyParco Monti Aurunci (LT)Pistacio terebinthi-Quercetum pubescentis (Blasi & Di Pietro 1998) Allegrezza et al. 2002
IT65Q. roburQ. roburS ItalyTafuri, Murgean Plateau (BA)Quercus robur isolated individuals in Stipo-Quercetum dalechampii Biondi et al. 2004
IT66Q. pub.Q. virgilianaS ItalySelva S. Vito Gravina Laterza (TA)individuals of Q. virgiliana in the Teucrio siculi-Quercetum trojanae Biondi et al. 2004
IT68Q. pub.Q. pubescensSardiniaM.te Zara. Monastir (CA)Lonicero implexae-Quercetum virgilianae Bacchetta et al. 2004
IT69Q. pub.Q. ichnusaeSardiniaBosco S. Antonio. Macomer (NU)Ornithogalo pyrenaici-Quercetum ichnusae Bacchetta et al. 2004
IT70Q. pub.Q. congestaSardiniaSant’Orsola (SS)Glechomo sardoae-Quercetum congestae Bacchetta et al. 2004
IT71Q. pub.Q. congestaSardiniaM. Rasu, Catena del Marghine (SS)Glechomo sardoae-Quercetum congestae Bacchetta et al. 2004
IT72Q. pub.Q. pubescensS ItalyLaurenzana (PZ)Centaureo centaurii-Quercetum pubescentis Ubaldi & Zanotti 1995
IT73Q. petr.Q. petraeaC ItalyMonte Vairano (CB)individuals of Q. petraea in Aremonio-Quercetum cerridis Blasi et al. ex Terzi et al. 2022
IT75Q. pub.Q. pubescensC ItalyMonte Vairano (CB)Cytiso sessilifolii-Quercetum pubescentis Blasi et al. 1982
IT76Q. pub.Q. pubescensS ItalyMar di Pace—Nardodipace (VV)Erico-Quercetum congestae Brullo et al. 2001
IT77Q. pub.Q. pubescensS ItalyBosco del Compare (BR)Individuals of Q. pubescens in Fraxino orni-Quercetum ilicis Horvatic (1956) 1958
IT82Q. pub.Q. pubescensC ItalyTorrita, Monti della Laga (RI)Cytiso sessilifolii-Quercetum pubescentis Blasi et al. 1982
IT83Q. pub.Q. pubescensC ItalyBarisciano, San Colombo (AQ)Cytiso sessilifolii-Quercetum pubescentis Blasi et al. 1982
IT84-Q. roburN ItalyParco delle Groane—Solaro (MI)Polygonato multiflori—Quercetum roboris Sartori 1984
IT85-Q. roburN ItalyBosco Fontana—Marmirolo (MN)Polygonato multiflori—Quercetum roboris Sartori 1984
IT86-Q. roburN ItalyParco La Mandria Ven. Reale (TO)Quercus robur community belonging to Carpinion betuli Issler 1931
IT87Q. petr.Q. petraeaC ItalyMontecorona
Umbertide (PG)
Hieracio racemosi-Quercetum petraeae Pedrotti et al. 1982
IT88Q. petr.Q. petraeaC ItalyParco Castelfranco di Sotto (PI)individuals of Q. petraea in Melico-Quercetum cerridis Arrigoni, in Arrigoni et al. 1990
IT89Q. petr.Q. petraeaN ItalyParco dei boschi
di Carrega (PR)
Physospermo cornubiensis-Quercetum petraeae Oberdorfer & Hofmann 1967
IT90-Q. frainettoC ItalyCollestrada (PG)Malo florentinae-Quercetum frainetto Biondi et al. 2001 ex Terzi et al. 2022
IT91-Q. frainettoS ItalyParco Naz. Aspromonte—Platì (RC)Cytiso-Quercetum frainetto Scelsi & Spampinato 1996
IT92Q. pub.Q. pubescensN ItalyBasovizza (TS)Ostryo-Quercetum pubescentis (Horvat 1959). Trinajstić 1974.
IT93Q. pub.Q. pubescensC ItalySelva di Castelfidardo (AN)Roso sempervirentis-Quercetum pubescentis Biondi 1986
Figure A1. The optimal number of genetic groups in the studied oak populations determined by the ΔK Evanno model.
Forests 15 00864 g0a1
Figure A2. The geographical distribution of the seven groups of haplotypes identified by the MSN diagram displayed in Figure 5, according to (a) single populations (The numbers correspond to the population codes as reported in Table A1); (b) the percentage value per geographical sector. The colors used for filling both single-population circles and pie-chart sectors correspond to those used for circumscribing the different groups of haplotypes in Figure 5.
Forests 15 00864 g0a2
Figure A3. Principal coordinate analysis (PCoA) plot based on genetic distance representing the haplotype distribution observable along the first and third axes. The colors of the ellipsis contours circumscribing the different groups of haplotypes are the same as those used in the PCoA diagram of Figure 6 (axes 1 and 2).
Forests 15 00864 g0a3
Figure A4. Principal coordinate analysis (PCoA) displaying the ellipses that include the groups of haplotypes derived from the MSN classification (Figure 5). Ellipsis contours are colored with the colors already used in the MSN diagram (Figure 5). Haplotypes are filled with the colors derived from the STRUCTURE analysis for K = 4 (see Figure 4).
Forests 15 00864 g0a4

References

  1. Hampe, A.; Petit, R.J. Conserving biodiversity under climate change: The rear edge matters. Ecol. Lett. 2005, 8, 461–467. [Google Scholar] [CrossRef] [PubMed]
  2. Denk, T.; Grimm, G.W.; Manos, P.S.; Deng, M.; Hipp, A.L. An updated infrageneric classification of the oaks: Review of previous taxonomic schemes and synthesis of evolutionary patterns. In Oaks Physiological Ecology. Exploring the Functional Diversity of Genus Quercus L.; Gil-Pelegrín, E., Peguero-Pina, J.J., Sancho-Knapik, D., Eds.; Tree Physiology; Springer International Publishing: Cham, Switzerland, 2017; pp. 13–38. ISBN 978-3-319-69099-5. [Google Scholar]
  3. Govaerts, R.; Nic Lughadha, E.; Black, N.; Turner, R.; Paton, A. The world checklist of vascular plants, a continuously updated resource for exploring global plant diversity. Sci. Data 2021, 8, 215. [Google Scholar] [CrossRef] [PubMed]
  4. Mucina, L.; Bültmann, H.; Dierßen, K.; Theurillat, J.-P.; Raus, T.; Čarni, A.; Šumberová, K.; Willner, W.; Dengler, J.; García, R.G.; et al. vegetation of Europe: Hierarchical floristic classification system of vascular plant, bryophyte, lichen, and algal communities. Appl. Veg. Sci. 2016, 19, 3–264. [Google Scholar] [CrossRef]
  5. Plomion, C.; Martin, F. Oak genomics is proving its worth. New Phytol. 2020, 226, 943–946. [Google Scholar] [CrossRef] [PubMed]
  6. Brullo, S.; Guarino, R.; Siracusa, G. Taxonomical revision about the deciduous oaks of Sicily. Webbia 1999, 54, 1–72. [Google Scholar] [CrossRef]
  7. Di Pietro, R.; Viscosi, V.; Peruzzi, L.; Fortini, P. A Review of the application of the name Quercus dalechampii. Taxon 2012, 61, 1311–1316. [Google Scholar] [CrossRef]
  8. Fortini, P.; Di Marzio, P.; Di Pietro, R. Differentiation and hybridization of Quercus frainetto, Q. petraea, and Q. pubescens (Fagaceae): Insights from macro-morphological leaf traits and molecular data. Plant Syst. Evol. 2015, 301, 375–385. [Google Scholar] [CrossRef]
  9. Wellstein, C.; Spada, F. The status of Quercus pubescens Willd. in Europe. In Warm-Temperate Deciduous Forests around the Northern Hemisphere; Box, E.O., Fujiwara, K., Eds.; Geobotany Studies; Springer International Publishing: Cham, Switzerland, 2015; pp. 153–163. ISBN 978-3-319-01261-2. [Google Scholar]
  10. Kučera, P. New name for central europaean oak formerly labelled as Quercus dalechampii. Biologia 2018, 73, 313–317. [Google Scholar] [CrossRef]
  11. Grossoni, P.; Bruschi, P.; Bussotti, F.; Pollastrini, M.; Selvi, F. The taxonomic interpretation of Mediterranean oaks of Quercus Sect. Quercus (Fagaceae): Uncertainties and diverging concepts. Flora Mediterr. 2021, 31, 271–278. [Google Scholar] [CrossRef]
  12. Gasparini, P.; Papitto, G. The italian forest inventory in brief. In Italian National Forest Inventory—Methods and Results of the Third Survey: Inventario Nazionale delle Foreste e dei Serbatoi Forestali di Carbonio—Metodi e Risultati della Terza Indagine; Gasparini, P., Di Cosmo, L., Floris, A., De Laurentis, D., Eds.; Springer International Publishing: Cham, Switzerland, 2022; pp. 1–15. ISBN 978-3-030-98678-0. [Google Scholar]
  13. Presl, C.B. Quercus. In Deliciae Pragensis Historiam Naturalem Spectantes; Presl, J.S., Presl, C.B., Eds.; Sumtibus Calve: Pragae, Czech Republic, 1822; Volume 1, p. 32. [Google Scholar]
  14. Gussone, G. Florae Siculae Synopsis; Ex Typis Tramater: Naples, Italy, 1842; Volume 2. [Google Scholar]
  15. Dimopoulos, P.; Raus, T.; Bergmeier, E.; Constantinidis, T.; Iatrou, G.; Kokkini, S.; Strid, A.; Tzanoudakis, D. Vascular Plants of Greece: An Annotated Checklist; Botanic Garden and Botanical Museum Berlin-Dahlem: Berlin, Germany; Hellenic Botanical Society: Athens, Greece, 2013. [Google Scholar]
  16. Pignatti, S.; Guarino, R.; La Rosa, M. Flora d’Italia, 2nd ed.; Edagricole: Bologna, Italy, 2017; Volume 4, ISBN 88-506-5242-9. [Google Scholar]
  17. Bartolucci, F.; Peruzzi, L.; Galasso, G.; Albano, A.; Alessandrini, A.; Ardenghi, N.M.G.; Astuti, G.; Bacchetta, G.; Ballelli, S.; Banfi, E.; et al. An updated checklist of the vascular flora native to Italy. Plant Biosyst. 2018, 152, 179–303. [Google Scholar] [CrossRef]
  18. Kaplan, Z.; Danihelka, J.; Chrtek, J.; Prančl, J.; Grulich, V.; Jelinek, B.; Úradníček, L.; Řepka, R.; Smarda, P.; Vašut, R.; et al. Distributions of vascular plants in the Czech Republic. Part 11. Preslia 2022, 94, 335–427. [Google Scholar] [CrossRef]
  19. Tenore, M. Semina Anno 1830 Collecta, Quae in Horto Botanico Neapolitano pro Mutua Commutatione Offeruntur; Fibreni: Naples, Italy, 1830. [Google Scholar]
  20. Tenore, M. Florae Neapolitanae Sylloge; Fibreni: Naples, Italy, 1831. [Google Scholar]
  21. Franjić, J.; Liber, Z.; Škvorc, Ž.; Idžojtić, M.; Šoštarić, R.; Stančić, Z. Morphological and molecular differentiation of the croatian populations of Quercus pubescens Willd. (Fagaceae). Acta Soc. Bot. Pol. 2006, 75, 123–130. [Google Scholar] [CrossRef]
  22. Enescu, C.; Curtu, A.; Șofletea, N. Is Quercus virgiliana a distinct morphological and genetic entity among European white oaks? Turk. J. Agric. For. 2013, 37, 632–641. [Google Scholar] [CrossRef]
  23. Di Pietro, R.; Di Marzio, P.; Medagli, P.; Misano, G.; Silletti, G.N.; Wagensommer, R.P.; Fortini, P. Evidence from multivariate morphometric study of the Quercus pubescens complex in southeast Italy. Bot. Serbica 2016, 40, 83–100. [Google Scholar]
  24. Di Pietro, R.; Di Marzio, P.; Antonecchia, G.; Conte, A.; Fortini, P. Preliminary characterization of the Quercus pubescens complex in southern italy using molecular markers. Acta Bot. Croat. 2020, 79, 15–25. [Google Scholar] [CrossRef]
  25. Di Pietro, R.; Conte, A.L.; Di Marzio, P.; Gianguzzi, L.; Spampinato, G.; Caldarella, O.; Fortini, P. A multivariate morphometric analysis of diagnostic traits in southern Italy and Sicily pubescent oaks. Folia Geobot. 2020, 55, 163–183. [Google Scholar] [CrossRef]
  26. Di Pietro, R.; Conte, A.L.; Di Marzio, P.; Fortini, P.; Farris, E.; Gianguzzi, L.; Müller, M.; Rosati, L.; Spampinato, G.; Gailing, O. Does the genetic diversity among pubescent white oaks in southern Italy, Sicily and Sardinia islands support the current taxonomic classification? Eur. J. For. Res. 2021, 140, 355–371. [Google Scholar] [CrossRef]
  27. Fortini, P.; Di Marzio, P.; Conte, A.L.; Antonecchia, G.; Proietti, E.; Di Pietro, R. Morphological and molecular results from a geographical transect focusing on Quercus pubescens/Q. virgiliana ecological-altitudinal vicariance in peninsular Italy. Plant Biosyst. 2022, 156, 1498–1511. [Google Scholar] [CrossRef]
  28. Brewer, S.; Cheddadi, R.; de Beaulieu, J.L.; Reille, M. The spread of deciduous Quercus throughout Europe since the last glacial period. For. Ecol. Manag. 2002, 156, 27–48. [Google Scholar] [CrossRef]
  29. Dumolin, S.; Demesure, B.; Petit, R.J. Inheritance of chloroplast and mitochondrial genomes in pedunculate oak investigated with an efficient PCR method. Theoret. Appl. Genet. 1995, 91, 1253–1256. [Google Scholar] [CrossRef] [PubMed]
  30. Dumolin-Lapègue, S.; Demesure, B.; Fineschi, S.; Le Come, V.; Petit, R.J. Phylogeographic structure of white oaks throughout the european continent. Genetics 1997, 146, 1475–1487. [Google Scholar] [CrossRef] [PubMed]
  31. Petit, R.J.; Csaikl, U.M.; Bordács, S.; Burg, K.; Coart, E.; Cottrell, J.; van Dam, B.; Deans, J.D.; Dumolin-Lapègue, S.; Fineschi, S.; et al. Chloroplast DNA variation in european white oaks: Phylogeography and patterns of diversity based on data from over 2600 populations. For. Ecol. Manag. 2002, 156, 5–26. [Google Scholar] [CrossRef]
  32. Petit, R.J.; Brewer, S.; Bordács, S.; Burg, K.; Cheddadi, R.; Coart, E.; Cottrell, J.; Csaikl, U.M.; van Dam, B.; Deans, J.D.; et al. Identification of refugia and post-glacial colonisation routes of european white oaks based on chloroplast DNA and fossil pollen evidence. For. Ecol. Manag. 2002, 156, 49–74. [Google Scholar] [CrossRef]
  33. Bennett, K.D.; Tzedakis, P.C.; Willis, K.J. Quaternary refugia of north european trees. J. Biogeogr. 1991, 18, 103–115. [Google Scholar] [CrossRef]
  34. Fineschi, S.; Taurchini, D.; Grossoni, P.; Petit, R.J.; Vendramin, G.G. Chloroplast DNA variation of white oaks in Italy. For. Ecol. Manag. 2002, 156, 103–114. [Google Scholar] [CrossRef]
  35. Lupini, A.; Aci, M.M.; Mauceri, A.; Luzzi, G.; Bagnato, S.; Menguzzato, G.; Mercati, F.; Sunseri, F. Genetic diversity in old populations of sessile oak from Calabria assessed by nuclear and chloroplast SSR. J. Mt. Sci. 2019, 16, 1111–1120. [Google Scholar] [CrossRef]
  36. Provan, J.; Powell, W.; Hollingsworth, P.M. Chloroplast microsatellites: New tools for studies in plant ecology and evolution. Trends Ecol. Evol. 2001, 16, 142–147. [Google Scholar] [CrossRef] [PubMed]
  37. Deguilloux, M.-F.; Dumolin-Lapègue, S.; Gielly, L.; Grivet, D.; Petit, R.J. A set of primers for the amplification of chloroplast microsatellites in Quercus. Mol. Ecol. Notes 2003, 3, 24–27. [Google Scholar] [CrossRef]
  38. Neophytou, C.; Michiels, H.-G. Upper rhine valley: A migration crossroads of middle european oaks. For. Ecol. Manag. 2013, 304, 89–98. [Google Scholar] [CrossRef]
  39. Chmielewski, M.; Meyza, K.; Chybicki, I.J.; Dzialuk, A.; Litkowiec, M.; Burczyk, J. Chloroplast microsatellites as a tool for phylogeographic studies: The case of white oaks in Poland. iForest 2015, 8, 765. [Google Scholar] [CrossRef]
  40. Magri, D.; Fineschi, S.; Bellarosa, R.; Buonamici, A.; Sebastiani, F.; Schirone, B.; Simeone, M.C.; Vendramin, G.G. The distribution of Quercus suber chloroplast haplotypes matches the palaeogeographical history of the western Mediterranean. Mol. Ecol. 2007, 16, 5259–5266. [Google Scholar] [CrossRef] [PubMed]
  41. Bagnoli, F.; Tsuda, Y.; Fineschi, S.; Bruschi, P.; Magri, D.; Zhelev, P.; Paule, L.; Simeone, M.C.; González-Martínez, S.C.; Vendramin, G.G. Combining molecular and fossil data to infer demographic history of Quercus cerris: Insights on european eastern glacial refugia. J. Biogeogr. 2016, 43, 679–690. [Google Scholar] [CrossRef]
  42. Grivet, D.; Deguilloux, M.-F.; Petit, R.J.; Sork, V.L. Contrasting patterns of historical colonization in white oaks (Quercus spp.) in California and Europe. Mol. Ecol. 2006, 15, 4085–4093. [Google Scholar] [CrossRef]
  43. Neophytou, C.; Semizer-Cuming, D.; Michiels, H.-G.; Kremer, A.; Jansen, S.; Fussi, B. Relict stands of central european oaks: Unravelling autochthony and genetic structure based on a multi-population study. For. Ecol. Manag. 2024, 551, 121554. [Google Scholar] [CrossRef]
  44. Curtu, A.L.; Gailing, O.; Leinemann, L.; Finkeldey, R. Genetic variation and differentiation within a natural community of five oak species (Quercus spp.). Plant Biol. 2007, 9, 116–126. [Google Scholar] [CrossRef] [PubMed]
  45. Danusevičius, D.; Baliuckas, V.; Buchovska, J.; Kembrytė, R. Geographical Structuring of Quercus robur L. Chloroplast DNA haplotypes in Lithuania: Recolonization, adaptation, or overexploitation effects? Forests 2021, 12, 831. [Google Scholar] [CrossRef]
  46. Popović, M.; Katičić Bogdan, I.; Varga, F.; Šatović, Z.; Bogdan, S.; Ivanković, M. Genetic diversity in peripheral pedunculate oak (Quercus robur L.) provenances—Potential climate change mitigators in the center of distribution despite challenges in natural populations. Forests 2023, 14, 2290. [Google Scholar] [CrossRef]
  47. Gailing, O.; Wachter, H.; Schmitt, H.-P.; Curtu, A.-L.; Finkeldey, R. Characterization of different provenances of slavonian pedunculate oaks (Quercus robur L.) in Münsterland (Germany) with chloroplast DNA markers: PCR-RFLPs and chloroplast microsatellites. Allg. Forst. Jagdztg. 2007, 178, 85–90. [Google Scholar]
  48. Burger, K.; Gailing, O. Genetic Variability of indigenous (Quercus robur L.) and late flushing oak (Quercus robur L. subsp. slavonica (Gáyer) Mátyás) in adult stands compared with their natural regeneration. Eur. J. For. Res. 2022, 141, 1073–1088. [Google Scholar] [CrossRef]
  49. Semerikova, S.A.; Isakov, I.Y.; Semerikov, V.L. Chloroplast DNA variation and phylogeography of pedunculate oak Quercus robur L. in the eastern part of the range. Russ. J. Genet. 2021, 57, 47–60. [Google Scholar] [CrossRef]
  50. Semerikova, S.A.; Podergina, S.M.; Tashev, A.N.; Semerikov, V.L. Phylogeography of oaks in the crimea reveals pleistocene refugia and migration routes. Russ. J. Ecol. 2023, 54, 197–212. [Google Scholar] [CrossRef]
  51. Médail, F.; Diadema, K. Glacial refugia influence plant diversity patterns in the Mediterranean basin. J. Biogeogr. 2009, 36, 1333–1345. [Google Scholar] [CrossRef]
  52. Fortini, P.; Di Pietro, R.; Proietti, E.; Cardoni, S.; Quaranta, L.; Simeone, M.C. Dissecting the continuum and unravelling the phylogeographic knot of plastid DNA in european white oaks (Quercus sect. Quercus): Ancient signatures and multiple diversity reservoirs. Eur. J. For. Res. 2024, 143, 107–127. [Google Scholar] [CrossRef]
  53. Proietti, E.; Filesi, L.; Di Marzio, P.; Di Pietro, R.; Masin, R.; Conte, A.L.; Fortini, P. Morphology, geometric morphometrics, and taxonomy in relict deciduous oaks woods in northern Italy. Rend. Fis. Acc. Lincei 2021, 32, 549–564. [Google Scholar] [CrossRef]
  54. Avanzi, C.; Bagnoli, F.; Romiti, E.; Spanu, I.; Tsuda, Y.; Vajana, E.; Vendramin, G.G.; Piotti, A. The latitudinal trend in genetic diversity and distinctiveness of Quercus robur rear edge forest remnants calls for new conservation priorities. bioRxiv, 2023; advance online publication. [Google Scholar] [CrossRef]
  55. Pignatti, S. La flora dell’Appennino meridionale: Distribuzione attuale ed ipotesi sull’origine. Biogeographia 1986, 10, 89–100. [Google Scholar] [CrossRef]
  56. Blasi, C.; Filibek, G.; Burrascano, S.; Copiz, R.; Di Pietro, R.; Ercole, S.; Lattanzi, E.; Rosati, L.; Tilia, A. Primi risultati per una nuova regionalizzazione fitogeografia del territorio italiano. Biogeographia 2007, 28, 9–23. [Google Scholar] [CrossRef]
  57. Brullo, S. Contributo alla conoscenza della vegetazione delle Madonie (Sicilia settentrionale). Boll. Acc. Gioenia Sci. Nat. 1984, 16, 351–420. [Google Scholar]
  58. Brullo, S.; Marcenò, C. Contributo alla conoscenza della classe Quercetea ilicis in Sicilia. Not. Fitosoc. 1985, 19, 183–229. [Google Scholar]
  59. Brullo, S.; Scelsi, F.; Spampinato, G. La Vegetazione dell’Aspromonte; Laruffa: Reggio Calabria, Italy, 2001; ISBN 88-7221-160-3. [Google Scholar]
  60. Brullo, S.; Gianguzzi, L.; La Mantia, A.; Siracusa, G. La classe Quercetea ilicis in Sicilia. Boll. Acc. Gioenia Sci. Nat 2008, 41, 1–24. [Google Scholar]
  61. Bacchetta, G.; Biondi, E.; Farris, E.; Filigheddu, R.; Mossa, L. A phytosociological study of the deciduous oak woods of Sardinia (Italy). Fitosociologia 2004, 41, 53–64. [Google Scholar]
  62. Thiers, B. Index Herbariorum: A Global Directory of Public Herbaria and Associated Staff. New York Botanical Garden’s Virtual Herbarium. 2015. Available online: http://sweetgum.nybg.org/ih (accessed on 20 March 2024).
  63. Sebastiani, F.; Carnevale, S.; Vendramin, G.G. A new set of mono- and dinucleotide chloroplast microsatellites in Fagaceae. Mol. Ecol. Notes 2004, 4, 259–261. [Google Scholar] [CrossRef]
  64. Peakall, R.; Smouse, P.E. GenAlEx 6.5: Genetic analysis in Excel. Population genetic software for teaching and research—An update. Bioinformatics 2012, 28, 2537–2539. [Google Scholar] [CrossRef] [PubMed]
  65. Goudet, J. FSTAT (Version 2.9.4), a Program (for Windows 95 and Above) to Estimate and Test Population Genetics Parameters; Department of Ecology & Evolution, Lausanne University: Vaud, Switzerland, 2003; Volume 53. [Google Scholar]
  66. Pons, O.; Petit, R. Measuring and testing genetic differentiation with ordered vs. unordered alleles. Genetics 1996, 144, 1237–1245. [Google Scholar] [CrossRef] [PubMed]
  67. Corander, J.; Cheng, L.; Marttinen, P.; Sirén, J.; Tang, J. BAPS: Bayesian Analysis of Population Structure, Manual v. 6.0, 14 February 2013. Available online: https://github.com/ocbe-uio/BAPS/blob/develop/BAPS6manual.pdf (accessed on 20 October 2023).
  68. Pritchard, J.K.; Stephens, M.; Donnelly, P. Inference of population structure using multilocus genotype data. Genetics 2000, 155, 945–959. [Google Scholar] [CrossRef] [PubMed]
  69. Earl, D.A.; vonHoldt, B.M. STRUCTURE HARVESTER: A website and program for visualizing STRUCTURE output and implementing the Evanno method. Conserv. Genet. Resour. 2012, 4, 359–361. [Google Scholar] [CrossRef]
  70. Kopelman, N.M.; Mayzel, J.; Jakobsson, M.; Rosenberg, N.A.; Mayrose, I. Clumpak: A program for identifying clustering modes and packaging population structure inferences across K. Mol. Ecol. Resour. 2015, 15, 1179–1191. [Google Scholar] [CrossRef] [PubMed]
  71. Excoffier, L.; Lischer, H.E.L. Arlequin Suite Ver 3.5: A new series of programs to perform population genetics analyses under Linux and Windows. Mol. Ecol. Resour. 2010, 10, 564–567. [Google Scholar] [CrossRef]
  72. Evanno, G.; Regnaut, S.; Goudet, J. Detecting the number of clusters of individuals using the software STRUCTURE: A simulation study. Mol. Ecol. 2005, 14, 2611–2620. [Google Scholar] [CrossRef] [PubMed]
  73. Petit, R.J.; Duminil, J.; Fineschi, S.; Hampe, A.; Salvini, D.; Vendramin, G.G. Invited review: Comparative organization of chloroplast, mitochondrial and nuclear diversity in plant populations. Mol. Ecol. 2005, 14, 689–701. [Google Scholar] [CrossRef] [PubMed]
  74. Walker, M.J.C. Climatic changes in Europe during the last glacial/interglacial transition. Quatern. Int. 1995, 28, 63–76. [Google Scholar] [CrossRef]
  75. Schenk, F.; Väliranta, M.; Muschitiello, F.; Tarasov, L.; Heikkilä, M.; Björck, S.; Brandefelt, J.; Johansson, A.V.; Näslund, J.-O.; Wohlfarth, B. Warm summers during the younger dryas cold reversal. Nat. Commun. 2018, 9, 1634. [Google Scholar] [CrossRef] [PubMed]
  76. Ravazzi, C.; Peresani, M.; Pini, R.; Vescovi, E. Il tardoglaciale nelle Alpi Italiane e in Pianura Padana. Evoluzione stratigrafica, storia della vegetazione e del popolamento antropico. Alp. Mediterr. Quat. 2007, 20, 163–184. [Google Scholar]
  77. Vescovi, E. Long-Term Population Dynamics of Major Forest Trees under Strongly Changing Climatic Conditions. Ph.D. Thesis, University of Bern, Bern, Switzerland, 2007. [Google Scholar]
  78. Kaltenrieder, P.; Belis, C.A.; Hofstetter, S.; Ammann, B.; Ravazzi, C.; Tinner, W. Environmental and climatic conditions at a potential glacial refugial site of tree species near the southern alpine glaciers. new insights from multiproxy sedimentary studies at Lago Della Costa (Euganean hills, northeastern Italy). Quat. Sci. Rev. 2009, 28, 2647–2662. [Google Scholar] [CrossRef]
  79. Acquafredda, P.; Palmentola, G. Il glacialismo quaternario nell’Italia meridionale dal massiccio del Matese all’Aspromonte. Biogeographia 1986, 10, 13–18. [Google Scholar] [CrossRef]
  80. Dramis, F.; Kotarba, A. Southern Limit of Relict Rock Glaciers, Central Apennines, Italy. Permafr. Periglac. 1992, 3, 257–260. [Google Scholar] [CrossRef]
  81. Di Pietro, R.; Terzi, M.; Fortini, P. A revision of the high-altitude acidophilous and chionophilous grasslands of the Apennines (peninsular Italy), a long-lasting intricate syntaxonomic issue. Phytocoenologia 2017, 47, 261–304. [Google Scholar] [CrossRef]
  82. Follieri, M.; Magri, D.; Sadori, L. 250,000-year pollen record from Valle Di Castiglione (Roma). Pollen Spores 1988, 30, 329–356. [Google Scholar]
  83. Di Pasquale, G.; Saracino, A.; Bosso, L.; Russo, D.; Moroni, A.; Bonanomi, G.; Allevato, E. Coastal pine-oak glacial refugia in the Mediterranean basin: A biogeographic approach based on charcoal analysis and spatial modelling. Forests 2020, 11, 673. [Google Scholar] [CrossRef]
  84. Lowe, J.J. Lateglacial and early holocene lake sediments from the northern Apennines, Italy—Pollen stratigraphy and radiocarbon dating. Boreas 1992, 21, 193–208. [Google Scholar] [CrossRef]
  85. Bertoldi, R.; Chelli, A.; Roma, R.; Tellini, C. New data from northern Apennines (Italy) pollen sequences spanning the last 30,000 yrs. Il Quat. 2007, 20, 3–20. [Google Scholar]
  86. Vescovi, E.; Ammann, B.; Ravazzi, C.; Tinner, W. A new late-glacial and holocene record of vegetation and fire history from Lago Del Greppo, northern Apennines, Italy. Veget. Hist. Archaeobot. 2010, 19, 219–233. [Google Scholar] [CrossRef]
  87. Follieri, M.; Giardini, M.; Magri, D.; Sadori, L. Palynostratigraphy of the last glacial period in the volcanic region of central Italy. Quatern. Int. 1998, 47, 3–20. [Google Scholar] [CrossRef]
  88. Magri, D. Late quaternary vegetation history at Lagaccione near Lago Di Bolsena (Central Italy). Rev. Palaeobot. Palyno. 1999, 106, 171–208. [Google Scholar] [CrossRef]
  89. Magri, D.; Sadori, L. Late Pleistocene and Holocene pollen stratigraphy at Lago Di Vico, Central Italy. Veg. Hist. Archaeobot. 1999, 8, 247–260. [Google Scholar] [CrossRef]
  90. Sadori, L. The lateglacial and holocene vegetation and climate history of Lago Di Mezzano (central Italy). Quat. Sci. Rev. 2018, 202, 30–44. [Google Scholar] [CrossRef]
  91. Di Rita, F.; Anzidei, A.P.; Magri, D. A lateglacial and early holocene pollen record from Valle Di Castiglione (Rome): Vegetation dynamics and climate implications. Quatern. Int. 2013, 288, 73–80. [Google Scholar] [CrossRef]
  92. Magri, D. Lineamenti della vegetazione tardoglaciale in Italia peninsulare e in Sicilia. In Il Tardiglaciale in Italia–Lavori in Corso; British Archaeological Reports, International Series 1859; Mussi, M., Ed.; Archaeopress: Oxford, UK, 2008; pp. 1–8. ISBN 1-4073-0342-2. [Google Scholar]
  93. Mattioni, C.; Martin, M.A.; Chiocchini, F.; Cherubini, M.; Gaudet, M.; Pollegioni, P.; Velichkov, I.; Jarman, R.; Chambers, F.M.; Paule, L.; et al. Landscape genetics structure of european sweet chestnut (Castanea Sativa Mill): Indications for conservation priorities. Tree Genet. Genomes 2017, 13, 39. [Google Scholar] [CrossRef]
  94. Mattioni, C.; Ranzino, L.; Cherubini, M.; Leonardi, L.; La Mantia, T.; Castellana, S.; Villani, F.; Simeone, M.C. Monuments unveiled: Genetic characterization of large old chestnut (Castanea sativa Mill.) trees using comparative nuclear and chloroplast DNA analysis. Forests 2020, 11, 1118. [Google Scholar] [CrossRef]
  95. Mossa, L.; Bacchetta, G.; Brullo, S. Quercus ichnusae (Fagaceae), a new species from Sardinia. Isr. J. Plant Sci. 1999, 47, 199–207. [Google Scholar] [CrossRef]
  96. Giuli, C.D.; Masini, F.; Valleri, G. Paleogeographic evolution of the adriatic area since oligocene to pleistocene. Riv. Ital. Paleontol. Stratigr. 1987, 93, 109–126. [Google Scholar] [CrossRef] [PubMed]
  97. Di Pietro, R.; Fortini, P.; Ciaschetti, G.; Rosati, L.; Viciani, D.; Terzi, M. A revision of the syntaxonomy of the Apennine-Balkan Quercus cerris and Q. frainetto forests and correct application of the name Melittio-Quercion frainetto. Plant Biosyst. 2020, 154, 887–909. [Google Scholar] [CrossRef]
  98. Fineschi, S.; Vendramin, G. Choroplastic diversity in italian oaks: Evidence of a higher genetic richness in southern and insular populations. Forests 2004, 1, 82. [Google Scholar] [CrossRef]
  99. Kerkez Janković, I.; Jovanović, M.; Milovanović, J.; Aleksić, J.; Šijačić-Nikolić, M. Genetic diversity and genetic structure of three sympatric oak species in serbian landscape of outstanding features “Kosmaj” assessed by nuclear microsatellites. Seefor 2023, 14, 117–127. [Google Scholar] [CrossRef]
  100. Fortini, P.; Viscosi, V.; Maiuro, L.; Fineschi, S.; Vendramin, G.G. Comparative leaf surface morphology and molecular data of five oaks of the subgenus Quercus Oerst (Fagaceae). Plant Biosyst. 2009, 143, 543–554. [Google Scholar] [CrossRef]
  101. Blasi, C.; Di Pietro, R. Two New Phytosociological Types of Quercus pubescens s.l. woodland communities in southern Latium. Plant Biosyst. 1998, 132, 207–223. [Google Scholar] [CrossRef]
  102. Allegrezza, M.; Baldoni, M.; Biondi, E.; Taffetani, F.; Zuccarello, V. Studio fitosociologico dei boschi a Quercus pubescens s.l. delle Marche e delle zone contigue dell’Appennino centro-settentrionale (Italia centrale). Fitosociologia 2002, 39, 161–171. [Google Scholar]
  103. Blasi, C.; Di Pietro, R.; Filesi, L. Syntaxonomical revision of Quercetalia pubescenti-Petraeae in the italian peninsula. Fitosociologia 2004, 41, 87–164. [Google Scholar]
  104. Schaal, B.A.; Hayworth, D.A.; Olsen, K.M.; Rauscher, J.T.; Smith, W.A. Phylogeographic studies in plants: Problems and prospects. Mol. Ecol. 1998, 7, 465–474. [Google Scholar] [CrossRef]
  105. Andrello, M.; D’Aloia, C.; Dalongeville, A.; Escalante, M.A.; Guerrero, J.; Perrier, C.; Torres-Florez, J.P.; Xuereb, A.; Manel, S. Evolving spatial conservation prioritization with intraspecific genetic data. Trends Ecol. Evol. 2022, 37, 553–564. [Google Scholar] [CrossRef] [PubMed]
  106. Fady, B.; Esposito, E.; Abulaila, K.; Aleksic, J.M.; Alia, R.; Alizoti, P.; Apostol, E.-N.; Aravanopoulos, P.; Ballian, D.; Kharrat, M.B.D.; et al. Forest Genetics Research in the Mediterranean Basin: Bibliometric Analysis, Knowledge Gaps, and Perspectives. Curr. For. Rep. 2022, 8, 277–298. [Google Scholar] [CrossRef]
  107. Médail, F. Plant biogeography and vegetation patterns of the Mediterranean islands. Bot. Rev. 2022, 88, 63–129. [Google Scholar] [CrossRef]
  108. Allen, C.D.; Macalady, A.K.; Chenchouni, H.; Bachelet, D.; McDowell, N.; Vennetier, M.; Kitzberger, T.; Rigling, A.; Breshears, D.D.; Hogg, E.H. (Ted); et al. A global overview of drought and heat-induced tree mortality reveals emerging climate change risks for forests. For. Ecol. Manag. 2010, 259, 660–684. [Google Scholar] [CrossRef]
  109. Natalini, F.; Alejano, R.; Vázquez-Piqué, J.; Cañellas, I.; Gea-Izquierdo, G. The role of climate change in the widespread mortality of holm oak in open woodlands of southwestern Spain. Dendrochronologia 2016, 38, 51–60. [Google Scholar] [CrossRef]
  110. Conte, A.L.; Di Pietro, R.; Iamonico, D.; Di Marzio, P.; Cillis, G.; Lucia, D.; Fortini, P. Oak decline in the Mediterranean basin: A study case from the southern Apennines (Italy). Plant Sociol. 2019, 56, 69–80. [Google Scholar]
  111. Blasi, C.; Capotorti, G.; Copiz, R.; Guida, D.; Barbara, M.; Smiraglia, D.; Zavattero, L. Terrestrial Ecoregions of Italy Explanatory Notes. Global Map S.r.l.: Firenze, Italy, 2019; ISBN 978-88-97091-04-2. [Google Scholar]
Figure 1. A distribution map of the white oak populations analyzed in Italy and the geographic sectors considered. The numbers correspond to the population codes as reported in Table A1.
Forests 15 00864 g001
Figure 2. Distribution and frequency of cpSSR white oak haplotypes within five geographical sectors. Asterisks indicate haplotypes exclusive to geographical sector in which they occur.
Forests 15 00864 g002
Figure 3. Haplotype distribution according to the four species complexes considered.
Forests 15 00864 g003
Figure 4. (Top): The results of BAPS and STRUCTURE clustering analyses. Each individual is represented by a vertical line. Individuals are arranged by geographical sector. In the STRUCTURE diagram, orange = ‘Cluster 1’, light blue = ‘Cluster 2’, dark violet = ‘Cluster 3’, green = ‘Cluster 4’, and red = ‘Cluster 5’. (Bottom): (a) the spatial pattern and distribution within each individual population of the genetic clusters identified by STRUCTURE for K = 3 (The numbers correspond to the population codes as reported in Table A1); (bd) the percentages of occurrence within each geographical sector of the genetic clusters identified by STRUCTURE with K = 3 (b), K = 4 (c), and K = 5 (d).
Forests 15 00864 g004
Figure 5. The minimum spanning network (MSN) of the 28 haplotypes, obtained using the pairwise distance. The size of the circles is proportional to the haplotype frequency, while the length of the branches is proportional to the distance between haplotypes. The different colors used identify different groups of haplotypes.
Forests 15 00864 g005
Figure 6. Principal coordinate analysis (PCoA) plot based on genetic distance and representing variability along the first two axes. Ellipses (with related colors) correspond to the seven groups of haplotypes displayed by the MSN of Figure 5.
Forests 15 00864 g006
Table 1. Details of the cpSSRs used in the present study.
LocusLocationRepeat MotifPrimers Sequence (5′–3′) Sense and AntisenseTm (°C)PCR Product Size (bp)
μdt1trnE-trnT intergenic(A)11ATCTTACACTAAGCTCGGAA TTCAATAACTTGTTGATCCC4881–83
μdt3trnD-trnY intergenic(A)11TGTTAGTAATCCTTTCGTTT
AGGTATAAAGTCTAAGGTAA
46125–128
μcd4ycf6-psbM intergenic(T)12TTATTTGTTTTTGGTTTCACC TTTCCCATAGAGAGTCTGTAT4594–99
μcd5ycf6-psbM intergenic(A)8CCCCCGGATCTCTGTCAACTG TAATAAACGAGAATCACATAA4574–77
Cmcs6ndhG-ndhI intergenic(T)10GAAAAAGGACCCTTCCTAAT CTTATGATCGTCACGAATTG55200–203
Table 2. Descriptive polymorphism parameters of the five cpSSR loci in the oak dataset investigated (60 populations; 180 individuals). Na: number of alleles; Ne: number of effective alleles; i: Shannon’s diversity index; h: haploid genetic diversity; uh: unbiased genetic diversity; se: standard error.
LocusNaNeihUh
udt131.7980.6770.4440.446
ucd531.9800.8520.4950.498
ucd453.7441.4410.7330.737
udt342.7751.1370.6400.643
CmCs632.4320.9750.5890.592
Mean (se)3.600 (0.400)2.546 (0.345)1.000 (0.130)0.580 (0.051)0.583 (0.052)
Table 3. The distribution of the 28 cpSSR haplotypes according to haplotype code (H); the number of individuals involved (N); the percentage of individuals with the same haplotype (Freq.); the number of populations involved (Pops); the geographical sector (Gs); and taxonomy (species/species complex). Alphabetical and numerical (for singletons) codes of the haplotypes were automatically assigned using GenAlEx 6.5.
HNFreq.PopsGsSpeciesSpecies Complex
610.561SardiniaQ. ichnusaeQ. pubescens
710.561SouthQ. dalechampiiQ. pubescens
810.561SouthQ. congestaQ. pubescens
910.561CentralQ. petraeaQ. petraea
1010.561SouthQ. congestaQ. pubescens
1110.561CentralQ. petraeaQ. petraea
1210.561CentralQ. petraeaQ. petraea
1310.561CentralQ. pubescensQ. pubescens
1410.561SicilyQ. congestaQ. pubescens
A31.672SicilyQ. leptobalana, Q. virgilianaQ. pubescens
B105.568North, Sicily, and SardiniaQ. congesta, Q. dalechampii, Q. petraea, Q. pubescens, Q. virgilianaQ. petraea, Q. pubescens
BB21.111CentralQ. frainettoQ. frainetto
C137.225CentralQ. frainetto, Q. pubescens, Q. roburQ. frainetto, Q. pubescens, Q. robur
CC955CentralQ. frainetto, Q. petraea, Q. pubescensQ. frainetto, Q. petraea, Q. pubescens
D73.894SicilyQ. congesta, Q. leptobalana, Q. petraea subsp. austrotyrrhenica, Q. virgilianaQ. petraea, Q. pubescens
DD84.443Central and SouthQ. congesta, Q. dalechampii, Q. pubescensQ. pubescens
E2111.6711North, Central, Sicily, and SardiniaQ. congesta, Q. dalechampii, Q. petraea, Q. pubescens, Q. robur, Q. virgilianaQ. petraea, Q. pubescens, Q. robur
GG21.111CentralQ. petraeaQ. petraea
J52.783NorthQ. petraea, Q. roburQ. petraea, Q. robur
O63.334SardiniaQ. congesta, Q. ichnusae, Q. virgilianaQ. pubescens
R31.672SardiniaQ. ichnusae, Q. virgilianaQ. pubescens
S63.333SardiniaQ. congesta, Q. ichnusae, Q. virgilianaQ. pubescens
T84.444SardiniaQ. congesta, Q. ichnusae, Q. virgilianaQ. pubescens
U147.785North, Central, and SouthQ. frainetto, Q. petraea, Q. pubescensQ. frainetto, Q. petraea, Q. pubescens
V3016.6713North, Central, and SouthQ. frainetto, Q. petraea, Q. petraea subsp. austrotyrrhenica, Q. pubescens, Q. roburQ. frainetto, Q. petraea, Q. pubescens, Q. robur
W52.783North and SouthQ. petraea, Q. roburQ. petraea, Q. robur
X158.336SouthQ. congesta, Q. dalechampii, Q. pubescens, Q. virgilianaQ. pubescens
Y42.222NorthQ. roburQ. robur
Table 4. The parameters of genetic diversity per geographical sector. N: the number of individuals; Na: the number of different alleles; Ne: the number of effective alleles; Np: the number of private alleles; h: total genetic diversity; uh: unbiased genetic diversity; HS: the diversity within populations; HT: the diversity among populations; GST: genetic differentiation index; RST: genetic differentiation index considering similarities among haplotypes. The statistical significance of the RST > GST ratio was calculated according to the PERMUT cpSSR manual; ns: non-significant; p > 5%; * p < 5%; ** p = 0% (to be significant, the 1000 permutations must not exceed the observed RST value of 5%). The standard error is reported in parentheses.
Geographical SectorNNaNeNphuhHSHTGSTRST
Northern Italy302.200
(0.200)
1.698 (0.115)0.000 (0.000)0.399 (0.045)0.413 (0.047)0.333 (0.136)0.799 (0.084)0.583 (0.190)0.628 * (0.217)
Central Italy483.200
(0.490)
2.503 (0.457)0.200 (0.200)0.558 (0.060)0.570 (0.061)0.381 (0.110)0.908 (0.045)0.581 (0.110)0.861 ** (0.080)
Southern Italy422.800
(0.374)
1.675 (0.253)0.000 (0.000)0.349 (0.093)0.358 (0.095)0.137 (0.070)0.851 (0.047)0.839 (0.090)0.876 ns (0.090)
Sicily302.000
(0.316)
1.377 (0.205)0.000 (0.000)0.212 (0.104)0.219 (0.108)0.500 (0.114)0.763 (0.055)0.345 (0.166)0.398 ns (0.233)
Sardinia302.400
(0.400)
1.863 (0.293)0.000 (0.000)0.421 (0.068)0.435 (0.071)0.500 (0.114)0.869 (0.036)0.425 (0.123)0.961 ** (0.011)
Mean (among
geogr. sectors)
2.520
(0.356)
1.823 (0.265)0.040 (0.040)0.388 (0.074)0.399 (0.076)0.370 (0.110)0.838 (0.053)0.555 (0.136)0.745 (0.126)
Table 5. The parameters of genetic diversity per species complexes. N: the number of individuals; Na: the number of different alleles; Ne: the number of effective alleles; Np: the number of private alleles; h: total genetic diversity; uh: unbiased genetic diversity; HS: the diversity within populations; HT: the diversity among populations; GST: genetic differentiation index; RST: the coefficient of genetic differentiation index; ns: non-significant; p > 5%; ** p = 0%. The statistical significance of the RST > GST ratio is calculated according to the PERMUT cpSSR manual (to be significant, the 1000 permutations must not exceed the observed RST value of 5%). The standard error is reported in parentheses.
Species ComplexNaNeNphuhHSHTGSTRST
Q. frainetto2.600 (0.400)2.002 (0.256)0.000 (0.000)0.468 (0.065)0.501 (0.070)0.133 (0.133)0.900 (0.117)0.852 (0.138)0.988 ns (0.006)
Q. petraea2.800 (0.200)1.827 (0.175)0.200 (0.200)0.434 (0.050)0.449 (0.052)0.467 (0.133)0.800 (0.116)0.417 (0.126)0.841 ** (0.111)
Q. pubescens3.200 (0.490)2.661 (0.349)0.600 (0.245)0.600 (0.047)0.606 (0.0480.351 (0.062)0.940 (0.011)0.626 (0.066)0.880 ** (0.045)
Q. robur2.200 (0.374)1.747 (0.232)0.000 (0.000)0.377 (0.100)0.393 (0.104)0.292 (0.146)0.849 (0.078)0.657 (0.181)0.721 ns (0.172)
Mean2.700 (0.366)2.059 (0.253)0.200 (0.111)0.470 (0.066)0.487 (0.069)0.311 (0.1189)0.872 (0.080)0.638 (0.128)0.858 (0.084)
Table 6. Haplotype distribution according to the oak species and species complexes. The percentage values related to the total number of individuals {180} and the total number of haplotypes (28) are reported in parentheses.
TaxaIndividualsHaplotypesHaplotypes/
Individuals
Exclusive HaplotypesSingletons
Q. congesta27 {15.0}11 (39.3) 3 (10.7)3 (10.7)
Q. dalechampii9 {5.0}5 (17.9) 1 (3.6)1 (3.6)
Q. ichnusae9 {5.0}5 (17.9) 1 (3.6)1 (3.6)
Q. leptobalana3 {1.7}2 (7.1) --
Q. pubescens42 {23.3}9 (32.1) 1 (3.6)1 (3.6)
Q. virgiliana21 {11.7}9 (32.1) --
Q. pubescens complex111 {61.7}20 (71.4) 0.1813 (46.4) 6 (21.4)
Q. petraea24 {13.3}11 (39.3) 4 (14.3)3 (10.7)
Q. petraea subsp. austrotyrrhenica6 {3.3}2 (7.1) --
Q. petraea complex30 {16.7}12 (42.9) 0.404 (14.3) 3 (10.7)
Q. frainetto15 {8.3}5 (17.9) 0.331 (3.6) -
Q. robur24 {13.3}6 (21.4) 0.251 (3.6) -
Disclaimer/Publisher’s Note: The statements, opinions and data contained in all publications are solely those of the individual author(s) and contributor(s) and not of MDPI and/or the editor(s). MDPI and/or the editor(s) disclaim responsibility for any injury to people or property resulting from any ideas, methods, instructions or products referred to in the content.

